Abstract
The ridge–furrow rainwater harvesting (RFRH) planting mode is widely used in arid and semi-arid areas to solve the problems of agricultural water shortage and low productivity. However, the impact of film mulching on the stability of soil carbon pools makes this planting mode vulnerable to the risk of increased soil carbon emissions and carbon pool losses. In order to clarify the relationship between soil carbon emissions and hydrothermal factors, as well as the regulatory effect of biochar application on soil carbon sequestration and reduced emissions under this planting mode, we set up a biochar application experiment. The effects of the biochar application (at 10 Mg ha−1 biochar and 20 Mg ha−1 biochar) on the soil water dynamics, soil temperature changes, CO2-C and CH4-C flux dynamics, grain yield, carbon emission efficiency, and the net ecosystem carbon budget in wheat fields under the RFRH planting mode were investigated, with no biochar application as the control. The results showed that applying biochar increased the soil water content, soil average temperature, cumulative CH4-C uptake, wheat grain yield, and carbon emission efficiency by 3.10–12.23%, 0.98–3.53%, 59.27–106.65%, 3.51–16.42%, and 18.52–61.17%, respectively; reduced the cumulative CO2-C emissions by 7.51–31.07%; and increased the net ecosystem carbon budget by 2.91 Mg C ha−1 to 6.06 Mg C ha−1. The results obtained by equation fitting showed that in wheat fields under RFRH, the CO2-C emission fluxes had negative and positive exponential relationships with the soil water content and soil temperature, respectively, while the CH4-C uptake fluxes had no significant correlation with the soil water content and had an inverse U-shaped quadratic function relationship with soil temperature. Overall, these results suggest that the application of biochar to wheat fields under RFRH can improve grain yield, farmland carbon emission efficiency, and the net ecosystem carbon budget, and change wheat fields from a carbon source to a carbon sink. These results can provide a theoretical basis and technical support for efficient, green, and sustainable production in farmland in arid and semi-arid areas.
1. Introduction
The global population is expected to reach 9.8 billion by 2050, and food production will need to be increased by 70% to meet the demand due to population growth [1]. It is difficult to increase the area of arable land and it actually tends to decrease, so it is necessary to enhance the productivity of land to increase crop production [2,3]. At present, about 41% of the world’s arable land area is distributed in arid and semi-arid areas [4], and many studies have indicated that there is great potential for improving the productivity of land in these areas [3]. For many years, the main factor that has restricted agricultural production in arid and semi-arid areas is a shortage of water [5]. In order to address this issue, some technical approaches for improved water utilization have been developed. In particular, the ridge–furrow rainwater harvesting (RFRH) planting technique has gradually become an important planting mode for crops in arid and semi-arid areas because it can improve the soil moisture status in the crop root zone, and promote crop growth and yield formation by collecting precipitation via film covering on the ridge [6,7,8,9].
Film mulching regulates the soil hydrothermal environment and also changes the stability of the soil carbon pool [10]. Many studies have shown that film mulching promotes the mineralization and decomposition of soil organic carbon and increases losses from the soil organic carbon pool [11,12,13,14,15], thereby affecting the quality of farmland soil and leading to the gradual degradation of farmland [16,17]. In addition, the soil carbon pool is closely related to the atmospheric carbon pool [18,19], so the increased soil carbon emissions under film mulching will increase the atmospheric carbon concentration and exacerbate global warming [20,21,22,23,24,25]. Therefore, there is an urgent need to sequester carbon and reduce emissions under the RFRH planting mode.
Soil carbon sequestration and carbon emissions are affected by soil hydrothermal factors [26,27,28]. Adding biochar can regulate the soil temperature and soil water content [26,29], and many studies have also shown that biochar can stabilize the soil carbon pool, reduce the mineralization and decomposition of soil organic carbon [30,31,32], and increase the storage of soil carbon [29,33,34,35]. However, previous studies into carbon sequestration and reducing emissions using biochar were mostly conducted in paddy fields in humid areas or incubation experiments in laboratories [32,36,37,38,39]. Clearly, the ecological environment, soil quality, and farming measures differ in dry farmland in non-humid areas. However, few studies have investigated the effect of biochar application on soil carbon sequestration in dry farmland and whether the application of biochar can reduce soil carbon emissions under the RFRH planting mode.
Wheat is the food crop with the largest planting area and trade volume in the world [40]. Coupled with the fact that it is used for food up to 65% [41], it has an irreplaceable role in meeting global food demand. Wheat has a wide range of adaptability to environmental conditions [41]. It is also an important cereal crop in dryland regions [42]. Carrying out research on wheat planting is important for both agricultural production in arid and semi-arid areas and global food security.
Thus, in the present study, different amounts of biochar were applied under the RFRH planting mode using wheat as the test crop in order to: (1) investigate the effects of biochar application on the soil hydrothermal characteristics and gaseous carbon (CO2 and CH4) emissions, as well as the relationships between carbon emissions and soil hydrothermal factors under RFRH planting; (2) determine the effects of biochar application on the crop yield under RFRH planting; and (3) understand the effects of biochar application on the carbon balance under RFRH planting, and the regulatory effects of biochar application and the associated mechanisms on soil carbon sequestration and reductions in emissions under RFRH planting in a dry farmland environment in a non-humid area. We aimed to identify a suitable technical approach to save water, increase yields, reduce emissions, and facilitate carbon sequestration, thereby providing a theoretical basis for high-quality production on farmland in arid and semi-arid areas.
2. Materials and Methods
2.1. Experimental Site Situation and Biochar Characterization
The experiment was conducted at Yangling Experimental Station (108°04′ E, 34°17′ N), Institute of Water-saving Agriculture in Arid Areas of China, which is located at an altitude of 506 m. The meteorological data were obtained based on a 30-year average from the Yangling Weather Station, which is about 200 m away from the experimental field. At the experimental site, the annual average temperature is 13.0 °C, the annual number of sunshine hours is 2196 h, and the frost-free period is 220 days. The precipitation is generally low with an uneven distribution in this region. The annual average precipitation was about 600 mm, the annual average evaporation was about 933.2 mm, and the average precipitation during the growth period of winter wheat was about 200 mm. The detailed precipitation and air temperature data during the experiment were also obtained from this weather station, as shown in Figure 1. The soil in the experimental field is Lou soil, which belongs to Eum-Orthric Anthrosols. Before the experiment, the basic properties of the soil in the top 0–20 cm layer were as follows: pH = 7.59, bulk density = 1.25 g cm−3, soil organic matter = 13.22 g kg−1, total nitrogen = 0.94 g kg−1, available nitrogen (nitrate nitrogen and ammonium nitrogen) = 48.62 mg kg−1, available phosphorus = 11.10 mg kg−1, and available potassium = 110.69 mg kg−1.
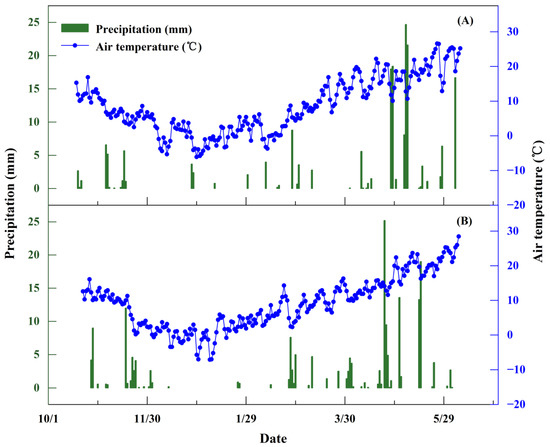
Figure 1.
Precipitation and air temperature distributions during the winter wheat growing seasons in 2018–2019 (A) and 2020–2021 (B).
The biochar used in the experiment was purchased from Zedi Agricultural Science and Technology Company (Jiangsu, China). It was produced with the anaerobic pyrolysis of equal weight rice straw and rice husk at 500 °C for 2 h. The properties of biochar were as follows: pH = 9.27, total N = 6.5 g kg−1, total C = 205.6 g kg−1, total P = 11.34 g kg−1, total K = 17.42 g kg−1, cation exchange capacity = 16.2 cmol kg−1, specific surface area = 29.6 m2 g−1, and bulk density = 0.35 g cm−3.
2.2. Experimental Design and Field Management
A single factor randomized block design was employed with three blocks and the following three treatments: (1) no biochar application (B0) as the control; (2) application of biochar at 10 Mg ha−1 (B10); and (3) application of biochar at 20 Mg ha−1 (B20). Both the biochar and fertilizer were applied basally before sowing. The amounts of fertilizer applied under each treatment were the same with 225 kg ha−1 pure N, 75 kg ha−1 P2O5, and 150 kg ha−1 K2O. The main local wheat cultivar Xinong 979 was used as the test material. Wheat was sown manually in strips around October 20 each year at a rate of 2.25 million plants ha−1 with a row spacing of 20 cm, and it was harvested during early June in the following year without replanting after harvest. The RFRH planting mode was used for all of the treatments (Figure 2), where the widths of the furrows and ridges were 60 cm and 40 cm, respectively. The 15 cm-high ridges were covered with plastic film to collect precipitation and wheat was planted in the furrows. Other management measures applied in the experimental field were the same as those used for wheat production in local fields and they were consistent across treatments.
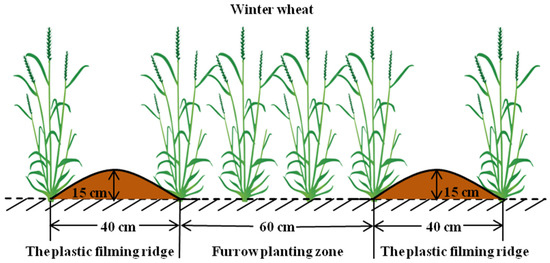
Figure 2.
Schematic diagram of the ridge–furrow rainwater harvesting (RFRH) planting mode.
2.3. Sampling and Measurement Methods
2.3.1. CO2 and CH4 Emission Measurement
The CO2 and CH4 emissions in the field were measured by static chamber-gas chromatography. The static chamber comprised a base (40 cm × 30 cm × 15 cm) and top box (40 cm × 30 cm × 40 cm). The base was made of stainless steel and it was sealed by a water-filled groove at the top. The top box was made of polyvinyl chloride sheet and it was wrapped with a layer of heat-insulating reflective material on the outside. A thermometer was placed at the top and a gas sampling pipe in the middle. The long side of the base was perpendicular to the planting row and it was positioned according to the proportion of each part of the planting pattern. Sampling commenced after fertilization and sowing, and it was conducted every half a month until the wheat was harvested. Sampling was always performed at 9:00–11:00 a.m. During sampling, the top box was fastened to the base and sealed with water. Gas samples were then extracted at intervals of 0, 10, 20, and 30 min using 50-mL syringes, and the temperature in the box was recorded. After sampling, the gas samples were analyzed as soon as possible using a GC-2010 Plus gas chromatograph (Shimadzu, Kyoto, Japan) with a flame ionization detector. The gas chromatograph was calibrated with standard gas before each test. The CO2 and CH4 emission fluxes were calculated by the following formula [43]:
where F is the gas emission flux (mg CO2-C m−2 h−1 or μg CH4-C m−2 h−1), k is the conversion factor (0.536 kg C m−3 for both CO2 and CH4), T is the average temperature inside the box during sampling (K), V is the volume of the sampling box (m3), A is the area of the bottom of the sampling box (m2), and Δc/Δt is the rate of change in the gas concentration in the sampling box per unit time (CO2: ppm h−1; CH4: ppb h−1). Linear regressions were performed based on the gas concentration and sampling time, and flux values were accepted when r2 > 0.90. Cumulative gas emissions were estimated by integrating the monthly average fluxes during the wheat growing season [44].
F = k × (273.15/T) × (V/A) × (Δc/Δt)
2.3.2. Soil Water Content and Soil Temperature
When the gas samples were collected, the volumetric water content of the 0–20 cm soil layer was measured using an AZS-100 TDR portable soil moisture meter (IMKO, Ettlingen, Germany) and converted into the soil mass water content based on the soil bulk density. The soil temperature at a depth of 10 cm was also measured with a geothermometer at the same time.
2.3.3. Wheat Yield, Aboveground Biomass, and Carbon Emission Efficiency (CEE)
At maturity, 1 m × 1 m sample plots (including the rainwater harvesting ridge and planting furrow areas) were harvested manually. The aboveground biomass weight, spike number, and kernel number per spike were measured after drying, before threshing to measure the yield and 1000-grain weight. The yield per hectare, spike number per hectare, and aboveground biomass per hectare were then calculated. The CEE was calculated based on the wheat yield and total gaseous carbon emissions (TGCE) by the following formula [45]:
where WY is the wheat yield (Mg ha−1), and TGCE denotes the total gaseous carbon (CO2-C and CH4-C) emissions during the wheat growing season (Mg ha−1).
CEE = WY/TGCE
2.3.4. Net Ecosystem Carbon Budget (NECB)
The NECB was estimated for a wheat field by the following formula [46]:
where CO2-C and CH4-C are the cumulative CO2 and CH4 carbon emissions from farmland during the wheat growing season, respectively (Mg ha−1), Harvest-C is the amount of carbon contained in the harvested aboveground biomass (Mg ha−1), Add-C is the amount of carbon added (Mg ha−1), and GPP is the gross primary production (Mg ha−1), which was extrapolated from the net primary production (NPP) based on the carbon use efficiency (carbon use efficiency = NPP/GPP) [47]. The carbon use efficiency of wheat was estimated as 0.65 [48,49,50].
NECB = GPP − CO2-C − Harvest-C − CH4-C + Add-C
The NPP of a wheat field was estimated by the following formula [51]:
where NPPshoot, NPProot, NPPlitter, and NPPrhizodeposit are the NPP values corresponding to shoot, root, litter, and rhizodeposit, respectively. Shoot was the harvested aboveground biomass and the other parts were estimated as described by Huang et al. [52] using allometric relationships. The root/shoot ratio was taken as 0.11 [52]. Litter accounted for about 5% of the shoot and root biomass [53,54]. Rhizodeposit accounted for about 10% of the shoot and root biomass [55]. The carbon content of each part was treated as 400 g kg−1 [56].
NPP = NPPshoot + NPProot + NPPlitter + NPPrhizodeposit
2.4. Statistical Analysis
Statistical analyses were carried out on the data from 2018–2019 and 2020–2021 (the data from 2019–2020 were not successfully obtained due to the epidemic). Data entry and sorting were conducted using Microsoft Excel 2007. Analysis of variance was performed using IBM SPSS Statistics 20. Equations representing the relationships between gas emissions and hydrothermal factors were fitted using IBM SPSS Statistics 20. The figures were prepared using OriginPro 2022.
3. Results
3.1. Soil Water Content and Soil Temperature
The soil water contents in the 0–20 cm soil layer tended to decrease during the wheat growth process. The application of biochar affected soil water content. With B0 as the control, the increasing range of soil water content in different months varied from −14.06% to 25.18% and from −30.66% to 85.26% under B10 and B20, respectively (Figure 3). Finally, the application of biochar significantly increased the average soil water content during the wheat growth period (p < 0.05). Compared with B0, the average soil water contents were 3.10–5.64% and 3.24–12.23% higher under B10 and B20, respectively (Figure 3).
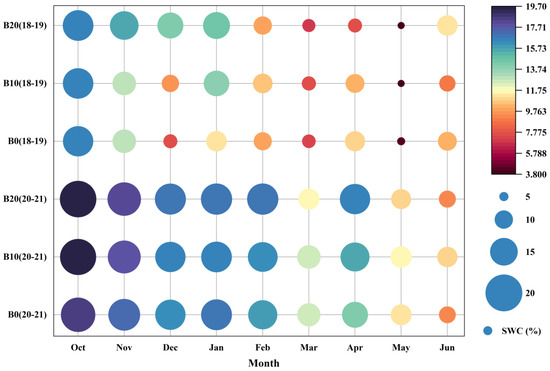
Figure 3.
Changes in soil water content in the 0–20 cm soil layer under different amounts of added biochar during the winter wheat growing seasons in 2018–2019 and 2020–2021. Note: SWC represents soil water content. Both the size and color of the circle represent the level of soil water content. B20, B10, and B0 represent 20, 10, and 0 Mg biochar ha−1, respectively.
The soil temperature at a depth of 10 cm decreased initially and then increased under each treatment during the wheat growth process, with a trough period in December–January (Figure 4). The application of biochar affected soil temperature. With B0 as the control, the increasing range of soil temperature in different months varied from −6.67% to 8.57% and from −3.64% to 16.67% under B10 and B20, respectively (Figure 4). Overall, the application of biochar reduced the variations in the soil temperature range to some extent and increased the average soil temperature during the wheat growth period. Compared with B0, the average soil temperatures were 1.96–3.53% and 0.98–2.35% higher under B10 and B20, respectively (Figure 4).
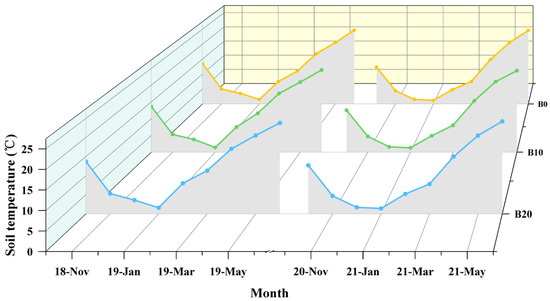
Figure 4.
Changes in soil temperature at a depth of 10 cm under different amounts of added biochar during the winter wheat growing seasons in 2018–2019 and 2020–2021.
3.2. Carbon Emissions
3.2.1. CO2-C Emissions
The CO2-C emission fluxes under different treatments exhibited similar seasonal variations, where they all decreased initially, before increasing and finally decreasing, with the peak occurring in May (wheat filling stage) (Figure 5). The application of biochar affected the CO2-C emission fluxes in wheat fields. With B0 as the control, the decreasing range of the CO2-C emission fluxes in different months varied from 0.48% to 39.38% and from −0.55% to 35.99% under B10 and B20, respectively (Figure 5). In general, the CO2-C emission fluxes were significantly higher under B0 than B10 and B20 during the same period (p < 0.05). Compared with B0, the average CO2-C emission fluxes were 8.54–24.64% and 7.51–31.07% lower under B10 and B20, respectively (Figure 5).
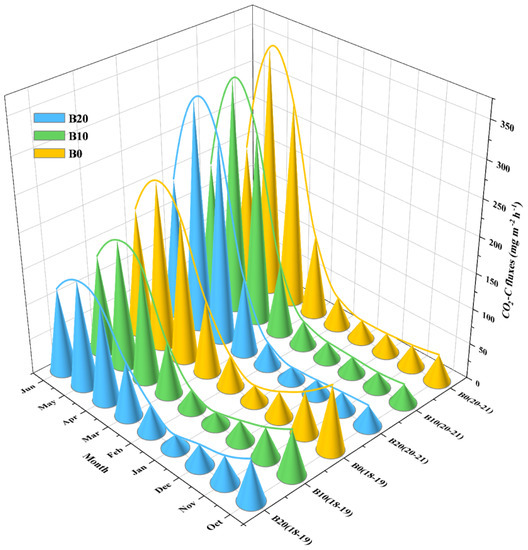
Figure 5.
Variations in field CO2-C emission fluxes under different amounts of added biochar during the winter wheat growing seasons in 2018–2019 and 2020–2021. Note: The circular cone height represents the CO2-C flux value, and the Akima spline curve represents the trend of CO2-C fluxes with time.
As shown in Figure 6, March–May was the key stage for soil CO2-C emissions from wheat fields, and the cumulative CO2-C emissions in this stage accounted for 66.94–82.47% of the cumulative CO2-C emissions in the whole wheat growing season. The application of biochar significantly reduced the cumulative CO2-C emissions from wheat fields (p < 0.05). Compared with B0, the cumulative CO2-C emissions were 584.83–1429.88 kg ha−1 and 514.18–1802.82 kg ha−1 lower under B10 and B20, respectively (Figure 6).
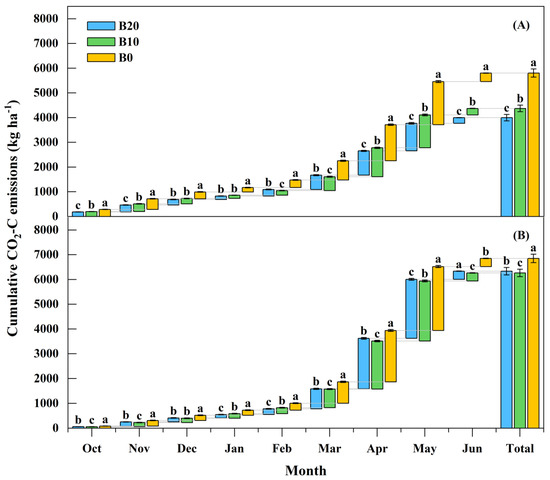
Figure 6.
Cumulative CO2-C emissions under different amounts of added biochar during the winter wheat growing seasons in 2018–2019 (A) and 2020–2021 (B). Note: The column length represents the mean ± standard error of newly added cumulative CO2-C emissions in each stage, and different lowercase letters indicate significant differences between treatments (Duncan’s test, p < 0.05).
3.2.2. CH4-C Uptake
As shown in Figure 7, the CH4-C uptake fluxes under different treatments all decreased initially, before increasing and finally decreasing. The application of biochar affected the CH4-C uptake fluxes in wheat fields. With B0 as the control, the increasing range of the CH4-C uptake fluxes in different months varied from −50.00% to 370.42% and from −1.86% to 967.86% under B10 and B20, respectively (Figure 7). In general, the CH4-C uptake fluxes were significantly lower under B0 than B10 and B20 during the same period (p < 0.05). Compared with B0, the average CH4-C uptake fluxes were 59.29–65.09% and 97.93–106.68% higher under B10 and B20, respectively (Figure 7).
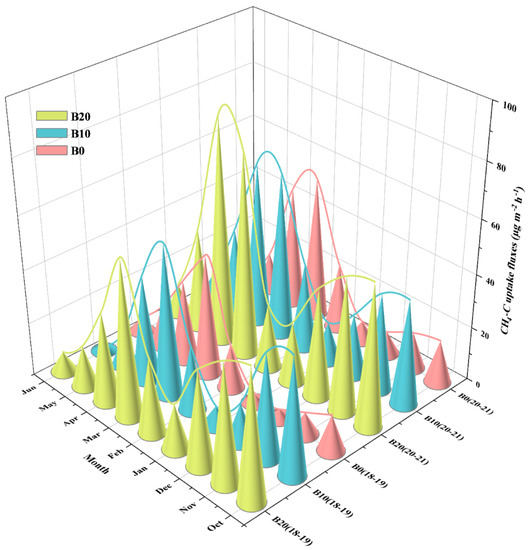
Figure 7.
Variations in field CH4-C uptake fluxes under different amounts of added biochar during the winter wheat growing seasons in 2018–2019 and 2020–2021. Note: The circular cone height represents the CH4-C uptake flux value, and the Akima spline curve represents the trend of CH4-C uptake fluxes with time.
As shown in Figure 8, March–April was the active stage for soil CH4-C uptake in wheat fields, and the cumulative CH4-C uptake in this stage accounted for 36.40–58.75% of the cumulative CH4-C uptake in the whole wheat growing season. The cumulative CH4-C uptake tended to increase as the biochar application amount increased. Compared with B0, the cumulative CH4-C uptake amounts were 616.24–743.44 g ha−1 and 926.72–1337.69 g ha−1 higher under B10 and B20, respectively (Figure 8).
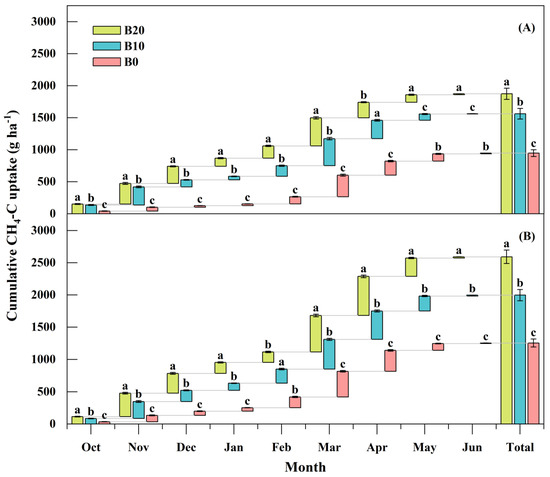
Figure 8.
Cumulative CH4-C uptake under different amounts of added biochar during the winter wheat growing seasons in 2018–2019 (A) and 2020–2021 (B). Note: The column length represents the mean ± standard error of newly added cumulative CH4-C uptake in each stage, and different lowercase letters indicate significant differences between treatments (Duncan’s test, p < 0.05).
3.3. Relationships between Carbon Emissions and Hydrothermal Factors
The relationships between the CO2-C emission fluxes and soil water contents under different biochar application amounts all conformed to an exponential decay equation. According to the fitted equations, the soil water content could explain 21.1–34.3% of the variations in the CO2-C emission fluxes. The coefficient of determination (R2) for the fitted equation increased as the amount of added biochar increased (Table 1). However, the relationships between the CO2-C emission fluxes and soil temperature under different treatments all conformed to an exponential growth equation. According to the fitted equations, soil temperature could explain 72.6–75.8% of the variations in the CO2-C emission fluxes. The R2 value for the fitted equation decreased as the amount of added biochar increased (Table 1).

Table 1.
Equations of the relationships between the CO2-C emission fluxes (F) and soil water content (SWC) and soil temperature (ST) under different amounts of added biochar in wheat fields.
There was no significant correlation between the CH4-C uptake flux and soil water content under each treatment (Table 2). However, the relationships between the CH4-C uptake fluxes and soil temperatures under different biochar application amounts all conformed to an inverse U-shaped quadratic equation. According to the fitted equations, the soil temperature could explain 46.3–72.6% of the variations in the CH4-C uptake flux. The application of biochar increased the R2 value for the fitted equation (Table 2).

Table 2.
Equations of the relationships between the CH4-C uptake fluxes (F) and soil water content (SWC) and soil temperature (ST) under different amounts of added biochar in wheat fields.
3.4. Wheat Yield, TGCE, and CEE
The spike numbers per hectare, kernel number per spike, and 1000-grain weights all increased as the amount of added biochar increased. Compared with B0, the spike numbers per hectare, kernel number per spike, and 1000-grain weights were 0.91–2.21% and 4.64–4.87%, 1.12–4.73% and 2.27–7.97%, and 0.39–1.78% and 0.58–2.72% higher under B10 and B20, respectively (Table 3). Thus, the wheat yields also increased as the amount of added biochar increased. Compared with B0, the wheat yields were 3.51–8.82% and 10.68–16.42% higher under B10 and B20, respectively (Figure 9A). In addition, the application of biochar significantly reduced the TGCE values in wheat fields (p < 0.05). Compared with B0, the TGCE values were 8.55–24.66% and 7.53–31.09% lower under B10 and B20, respectively (Figure 9B). Therefore, the application of biochar significantly improved the CEE values (p < 0.05). Compared with B0, the CEE values were 18.52–37.86% and 25.93–61.17% higher under B10 and B20, respectively (Figure 9C).

Table 3.
Wheat yield components under different amounts of added biochar in 2018–2019 and 2020–2021.
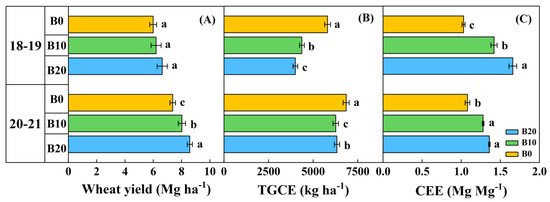
Figure 9.
Wheat yield (A), total gaseous carbon emissions (B), and carbon emission efficiency (C) under different amounts of added biochar in 2018–2019 and 2020–2021. Note: TGCE represents total gaseous carbon emissions and CEE represents carbon emission efficiency. Values represent means ± standard errors and different lowercase letters indicate significant differences between treatments (Duncan’s test, p < 0.05).
3.5. NECB
The application of biochar significantly increased the C inputs in wheat fields (p < 0.05). Compared with B0, the C inputs were 23.38–24.35% and 47.31–49.10% higher under B10 and B20, respectively (Figure 10). Thus, the application of biochar significantly increased the NECB values in wheat fields (p < 0.05). Compared with B0, the NECB values were 2.91–3.58 Mg C ha−1 and 5.29–6.06 Mg C ha−1 higher under B10 and B20, respectively (Figure 10).
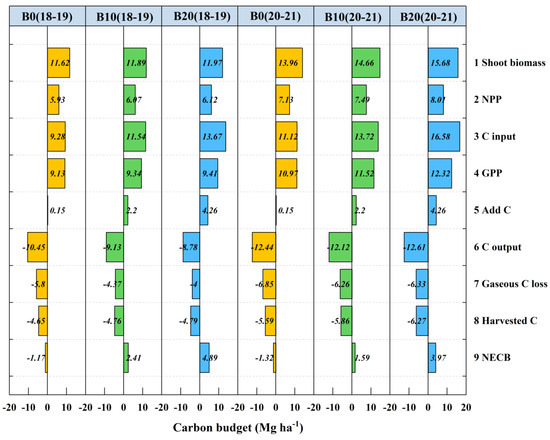
Figure 10.
Characteristics of net ecosystem carbon budget in winter wheat fields under different amounts of added biochar in 2018–2019 and 2020–2021. Note: NPP represents net primary production, GPP represents gross primary production, and NECB represents net ecosystem carbon budget.
4. Discussion
4.1. Responses of Soil Hydrothermal Characteristics and Carbon Emissions to Biochar Application
The soil water content and soil temperature are important physical characteristics of soil, and they are affected by many factors such as climate, topography, and agronomic measures. Biochar has many hydrophilic functional groups, a large specific surface area, and high porosity, which contribute to improved soil water retention [57,58]. Studies have shown that the application of biochar can increase the soil water content in farmland [59,60]. Similar to previous studies, the results obtained in the present study showed that the application of biochar significantly increased the soil water content in wheat fields. In addition, Feng et al. [61] found that the application of biochar could increase the soil temperature, and suggested that this may have been related to the effect of biochar on promoting the absorption of solar radiation by the soil. Furthermore, Zhang et al. [62] showed that the application of biochar reduced the variations in the soil temperature range. Moreover, Liu et al. [63] found that biochar changed the soil thermal properties by increasing the total soil porosity, which may have reduced the fluctuations in the soil temperature. Similar to previous studies, we found that the application of biochar increased the average soil temperature during the wheat growth period and reduced the fluctuations in the soil temperature.
The emission of CO2 from the soil is an important pathway that allows carbon to flow from the soil carbon pool to the atmospheric carbon pool, and these emissions are affected by the physical and chemical properties of soil and biological processes. Biochar can inhibit the mineralization of soil organic carbon by adsorbing soluble organic carbon and promoting the formation of agglomerations [64]. In addition, biochar can slow down the decomposition of soil carbon by inhibiting the activity of glucosidase and microbial growth [65,66,67]. Lentz et al. [68] conducted biochar application trials in irrigated farmland and showed that the application of 22.4 Mg ha−1 biochar significantly reduced soil CO2 emissions by 20%. Similarly, Ge et al. [69] found that the application of biochar in a subtropical bamboo forest reduced cumulative CO2 emissions. Similar to most previous studies, we found that the application of biochar significantly reduced cumulative CO2-C emissions by 7.51–31.07% in wheat fields.
The emission (or uptake) of soil CH4 is determined by CH4 production and oxidation processes, which are mainly regulated by methanogenic bacteria and methane-oxidizing bacteria [70]. Biochar application can increase the abundance of methane-oxidizing bacteria and reduce the ratio of methanogenic bacteria relative to methane-oxidizing bacteria, which is conducive to the CH4 oxidation process [70,71]. Qin et al. [37] showed that the application of biochar could significantly reduce CH4 emissions from rice fields. Similarly, Karhu et al. [72] demonstrated that the application of 9 Mg ha−1 biochar increased the CH4 uptake amount by 96%. Furthermore, Huang et al. [73] found that the pmoA gene copy number as an indicator of methane-oxidizing bacteria increased as the biochar application amount increased, which further contributed to accelerated CH4 oxidation in the soil [74]. Similar to previous studies, the results obtained in the present study demonstrated that the application of biochar significantly increased the cumulative CH4-C uptake by 59.27–106.65% in wheat fields, and the cumulative CH4-C uptake increased as the amount of added biochar increased.
4.2. Relationships between Carbon Emissions and Hydrothermal Factors
The soil water content and soil temperature are important factors that affect soil CO2 emissions [27]. Tang et al. [29] found that the CO2 emission fluxes tended to decrease as the soil water content increased in tobacco fields, and indicated that the CO2 diffusion resistance was large when the soil water content was high, which was not conducive to CO2 emissions. Furthermore, Lu et al. [75] showed that the relationship between the CO2 emission flux and soil water content conformed to an exponential decay equation in the maize growing season, and the R2 value for the fitted equation increased as the biochar application amount increased. Similar to previous studies, we found that the relationships between the CO2-C emission fluxes and soil water contents under different treatments all conformed to an exponential decay equation, and the goodness of fit of the equation increased as the amount of added biochar increased. However, increases in the soil temperature can promote microbial metabolism and the decomposition of organic carbon in soils [76,77], which will increase soil CO2 emissions. Thus, He et al. [26] showed that the CO2 emission flux increased exponentially as the soil temperature increased in a wheat–maize rotation system. Furthermore, Shen et al. [78] showed that the goodness of fit of the equation for the relationship between the CO2 emission flux and soil temperature decreased after applying biochar. Similar to most previous studies, we found that the relationships between the CO2-C emission fluxes and soil temperatures under different biochar application amounts all conformed to an exponential growth equation, and the R2 values for the fitted equation decreased as the amount of added biochar increased.
The soil water content and soil temperature are also important factors that affect soil CH4 emissions (or uptake) [79,80]. The relationship between the soil water content and CH4 emission varies under different soil water conditions, where an increase in the soil water content from a low level can enhance the microbial activity and increase CH4 uptake [81], whereas a decrease in the soil water content from a high level will make the environment less anaerobic and reduce CH4 emissions [82]. However, there is no significant correlation between the CH4 uptake flux and soil water content when the soil water content is in a moderate range with little fluctuation [27,83]. In the present study, the soil water content was moderate range under the different treatments, so we found no significant correlation between the CH4-C uptake flux and soil water content under each treatment. In addition, methanogenic bacteria and methane-oxidizing bacteria differ in terms of their preferred temperature ranges and sensitivity to temperature [84,85], and thus the effects of variations in the soil temperature on CH4 emissions are relatively complex. In particular, Wang et al. [86] found that the relationship between the CH4 emission flux and soil temperature in a desert steppe soil conformed to a U-shaped quadratic equation. Furthermore, Lu et al. [83] showed that the goodness of fit of the equation for the relationship between the CH4 uptake flux and soil temperature increased after applying biochar. Similar to previous studies, we found that the relationships between the CH4-C uptake fluxes and soil temperatures under different treatments all conformed to an inverse U-shaped quadratic equation, and the R2 value for the fitted equation increased after applying biochar.
4.3. Responses of Crop Yield and Farmland Carbon Sequestration to Biochar Application
Crop yields have always been a major focus of agricultural research and they cannot be increased without improving the soil environment and crop traits. The application of biochar can increase soil enzyme activity levels [87], soil nutrient supply [88,89], and soil water and fertilizer storage capacity [90,91] to create good soil conditions for crop growth. In addition, the application of biochar can promote crop root growth [92,93], regulate crop metabolic activities [94], and increase the accumulated crop biomass [95]. Zhang et al. [36] showed that the application of wheat straw biochar increased rice yield by 9–28%. In addition, a meta-analysis by Jeffery et al. [96] demonstrated that the average crop yield increased by about 10% after the application of biochar. Similar to most previous studies, we found that the application of biochar improved the soil hydrothermal conditions and increased the accumulated wheat biomass, and thus the yield increased by 3.51–16.42%.
The agricultural soil carbon budget greatly affects soil quality and crop productivity and further affects the sustainable development of agriculture [25,97], and thus carbon sequestration in farmland has become a research hotspot. Biochar is a highly stable carbon-containing material [98] and its application to soil can help to improve soil carbon inputs [29]. In addition, the application of biochar can enhance the carbon assimilation capacity of crops to fix more gaseous carbon, and the increased amount of carbon transported to the underground parts increases soil carbon sequestration [29,99,100]. Furthermore, the application of biochar can reduce the decomposition rate of soil organic carbon to slow down soil carbon losses [31,32]. In previous soil carbon sequestration studies, the NECB was widely used to assess the changes in soil carbon storage [51,101]. In particular, Wang et al. [97] showed that vegetable fields without biochar application lost carbon and had negative NECB values, whereas vegetable fields treated with biochar sequestered carbon and had positive NECB values. Similarly, Benbi et al. [102] applied biochar in a maize–wheat system and obtained a positive NECB value, and thus biochar played a positive role in soil carbon sequestration. Similar to previous studies, we found that the application of biochar increased the soil carbon inputs and changed the NECB value from negative to positive to facilitate carbon sequestration in wheat fields.
5. Conclusions
In the present study, the CO2-C emission flux had negative and positive exponential relationships with the soil water content and soil temperature, respectively. However, the CH4-C uptake flux had no significant correlation with the soil water content and an inverse U-shaped quadratic function relationship with the soil temperature in wheat fields under RFRH planting. The application of biochar to wheat fields under RFRH planting reduced cumulative CO2-C emissions and increased the soil water content, soil temperature, cumulative CH4-C uptake, wheat yield, CEE, and NECB, and thus the farmland changed from a carbon source to a carbon sink. The application of biochar under RFRH planting can combine the benefits of saving water, increasing yields, reducing emissions, and facilitating carbon sequestration to ensure high-quality production from farmland in arid and semi-arid areas.
Author Contributions
Conceptualization, Z.J., T.C. and X.M.; methodology, T.C., X.M. and M.L.; investigation, X.M. and M.L.; data curation, Z.J., T.C., X.M. and M.L.; writing—original draft preparation, X.M.; writing—review and editing, Z.J., T.C., F.H., P.Z. and X.M. All authors have read and agreed to the published version of the manuscript.
Funding
This study was supported by the Program of National Natural Science Foundation of China (No. 41671226).
Institutional Review Board Statement
Not applicable.
Informed Consent Statement
Not applicable.
Data Availability Statement
The data presented in this study are available within the article.
Acknowledgments
We are grateful to Junfeng Nie, Ruixia Ding, Hui Li, and Baoping Yang for help during experimental period.
Conflicts of Interest
The authors declare no conflict of interest.
References
- Kopittke, P.M.; Menzies, N.W.; Wang, P.; McKenna, B.A.; Lombi, E. Soil and the intensification of agriculture for global food security. Environ. Int. 2019, 132, 105078. [Google Scholar] [CrossRef] [PubMed]
- Mc Carthy, U.; Uysal, I.; Badia-Melis, R.; Mercier, S.; O’Donnell, C.; Ktenioudaki, A. Global food security–Issues, challenges and technological solutions. Trends Food Sci. Technol. 2018, 77, 11–20. [Google Scholar] [CrossRef]
- Farooq, M.; Siddique, K.H. Innovations in Dryland Agriculture; Springer: Gewerbestrasse, Switzerland, 2017. [Google Scholar]
- Li, Y.; Chen, Y.; Li, Z. Dry/wet pattern changes in global dryland areas over the past six decades. Glob. Planet. Chang. 2019, 178, 184–192. [Google Scholar] [CrossRef]
- Chander, G.; Reddy, T.Y.; Kumar, S.; Padmalatha, Y.; Reddy, S.; Adinarayana, G.; Wani, S.P.; Reddy, Y.V.M.; Srinivas, K. Low-cost interventions for big impacts in dryland production systems. Arch. Agron. Soil Sci. 2019, 65, 1211–1222. [Google Scholar] [CrossRef]
- Gan, Y.; Siddique, K.H.M.; Turner, N.C.; Li, X.G.; Niu, J.Y.; Yang, C.; Liu, L.; Chai, Q. Ridge-furrow mulching systems—An innovative technique for boosting crop productivity in semiarid rain-fed environments. Adv. Agron. 2013, 118, 429–476. [Google Scholar]
- Ren, X.; Chen, X.; Jia, Z. Effect of rainfall collecting with ridge and furrow on soil moisture and root growth of corn in semiarid northwest China. J. Agron. Crop Sci. 2010, 196, 109–122. [Google Scholar] [CrossRef]
- Wei, T.; Dong, Z.; Zhang, C.; Ali, S.; Chen, X.; Han, Q.; Zhang, F.; Jia, Z.; Zhang, P.; Ren, X. Effects of rainwater harvesting planting combined with deficiency irrigation on soil water use efficiency and winter wheat (Triticum aestivum L.) yield in a semiarid area. Field Crops Res. 2018, 218, 231–242. [Google Scholar] [CrossRef]
- Luo, C.L.; Zhang, X.F.; Duan, H.X.; Zhou, R.; Mo, F.; Mburu, D.M.; Wang, B.Z.; Wang, W.; Kavagi, L.; Xiong, Y.C. Responses of rainfed wheat productivity to varying ridge-furrow size and ratio in semiarid eastern African Plateau. Agric. Water Manag. 2021, 249, 106813. [Google Scholar] [CrossRef]
- Zhang, F.; Li, M.; Zhang, W.; Li, F.; Qi, J. Ridge–furrow mulched with plastic film increases little in carbon dioxide efflux but much significant in biomass in a semiarid rainfed farming system. Agric. For. Meteorol. 2017, 244, 33–41. [Google Scholar] [CrossRef]
- Li, F.M.; Song, Q.H.; Jjemba, P.K.; Shi, Y.C. Dynamics of soil microbial biomass C and soil fertility in cropland mulched with plastic film in a semiarid agro-ecosystem. Soil Biol. Biochem. 2004, 36, 1893–1902. [Google Scholar] [CrossRef]
- Li, Y.S.; Wu, L.H.; Zhao, L.M.; Lu, X.H.; Fan, Q.L.; Zhang, F.S. Influence of continuous plastic film mulching on yield, water use efficiency and soil properties of rice fields under non-flooding condition. Soil Tillage Res. 2007, 93, 370–378. [Google Scholar] [CrossRef]
- Cuello, J.P.; Hwang, H.Y.; Gutierrez, J.; Kim, S.Y.; Kim, P.J. Impact of plastic film mulching on increasing greenhouse gas emissions in temperate upland soil during maize cultivation. Appl. Soil Ecol. 2015, 91, 48–57. [Google Scholar] [CrossRef]
- Zhang, G.; Hu, X.; Zhang, X.; Li, J. Effects of plastic mulch and crop rotation on soil physical properties in rain-fed vegetable production in the mid-Yunnan plateau, China. Soil Tillage Res. 2015, 145, 111–117. [Google Scholar] [CrossRef]
- Wang, Y.P.; Li, X.G.; Hai, L.; Siddique, K.H.; Gan, Y.; Li, F.M. Film fully-mulched ridge-furrow cropping affects soil biochemical properties and maize nutrient uptake in a rainfed semi-arid environment. Soil Sci. Plant Nutr. 2014, 60, 486–498. [Google Scholar] [CrossRef]
- Lal, R. Carbon management in agricultural soils. Mitig. Adapt. Strateg. Glob. Chang. 2007, 12, 303–322. [Google Scholar] [CrossRef]
- Loveland, P.; Webb, J. Is there a critical level of organic matter in the agricultural soils of temperate regions: A review. Soil Tillage Res. 2003, 70, 1–18. [Google Scholar] [CrossRef]
- Munoz-Rojas, M.; Jordán, A.; Zavala, L.; González-Peñaloza, F.; De la Rosa, D.; Pino-Mejias, R.; Anaya-Romero, M. Modelling soil organic carbon stocks in global change scenarios: A CarboSOIL application. Biogeosciences 2013, 10, 8253–8268. [Google Scholar] [CrossRef]
- Lal, R. Soil carbon sequestration impacts on global climate change and food security. Science 2004, 304, 1623–1627. [Google Scholar] [CrossRef]
- Liu, Y.; Li, S.; Yang, S.; Hu, W.; Chen, X. Diurnal and seasonal soil CO2 flux patterns in spring maize fields on the Loess Plateau, China. Acta Agric. Scand. Sect. B—Soil Plant Sci. 2010, 60, 245–255. [Google Scholar]
- Yu, Y.; Zhao, C.; Stahr, K.; Zhao, X.; Jia, H. Plastic mulching increased soil CO2 concentration and emissions from an oasis cotton field in Central Asia. Soil Use Manag. 2016, 32, 230–239. [Google Scholar] [CrossRef]
- Nan, W.G.; Yue, S.C.; Huang, H.Z.; Li, S.Q.; Shen, Y.F. Effects of plastic film mulching on soil greenhouse gases (CO2, CH4 and N2O) concentration within soil profiles in maize fields on the Loess Plateau, China. J. Integr. Agric. 2016, 15, 451–464. [Google Scholar] [CrossRef]
- Ming, G.; Hu, H.; Tian, F.; Peng, Z.; Yang, P.; Luo, Y. Precipitation alters plastic film mulching impacts on soil respiration in an arid area of northwest China. Hydrol. Earth Syst. Sci. 2018, 22, 3075–3086. [Google Scholar] [CrossRef]
- Zhang, F.; Li, M.; Qi, J.; Li, F.; Sun, G. Plastic film mulching increases soil respiration in ridge-furrow maize management. Arid. Land Res. Manag. 2015, 29, 432–453. [Google Scholar] [CrossRef]
- Lal, R.; Follett, R.F.; Stewart, B.A.; Kimble, J.M. Soil carbon sequestration to mitigate climate change and advance food security. Soil Sci. 2007, 172, 943–956. [Google Scholar] [CrossRef]
- He, X.; Du, Z.; Wang, Y.; Lu, N.; Zhang, Q. Sensitivity of soil respiration to soil temperature decreased under deep biochar amended soils in temperate croplands. Appl. Soil Ecol. 2016, 108, 204–210. [Google Scholar] [CrossRef]
- Wu, X.; Yao, Z.; Brüggemann, N.; Shen, Z.; Wolf, B.; Dannenmann, M.; Zheng, X.; Butterbach-Bahl, K. Effects of soil moisture and temperature on CO2 and CH4 soil–atmosphere exchange of various land use/cover types in a semi-arid grassland in Inner Mongolia, China. Soil Biol. Biochem. 2010, 42, 773–787. [Google Scholar] [CrossRef]
- Li, W.; Zhuang, Q.; Wu, W.; Wen, X.; Han, J.; Liao, Y. Effects of ridge–furrow mulching on soil CO2 efflux in a maize field in the Chinese Loess Plateau. Agric. For. Meteorol. 2019, 264, 200–212. [Google Scholar] [CrossRef]
- Tang, Y.; Gao, W.; Cai, K.; Chen, Y.; Li, C.; Lee, X.; Cheng, H.; Zhang, Q.; Cheng, J. Effects of biochar amendment on soil carbon dioxide emission and carbon budget in the karst region of southwest China. Geoderma 2021, 385, 114895. [Google Scholar] [CrossRef]
- Junna, S.; Bingchen, W.; Gang, X.; Hongbo, S. Effects of wheat straw biochar on carbon mineralization and guidance for large-scale soil quality improvement in the coastal wetland. Ecol. Eng. 2014, 62, 43–47. [Google Scholar] [CrossRef]
- Wang, J.; Xiong, Z.; Kuzyakov, Y. Biochar stability in soil: Meta–analysis of decomposition and priming effects. Glob. Chang. Biol. Bioenergy 2016, 8, 512–523. [Google Scholar] [CrossRef]
- Lu, W.; Ding, W.; Zhang, J.; Li, Y.; Luo, J.; Bolan, N.; Xie, Z. Biochar suppressed the decomposition of organic carbon in a cultivated sandy loam soil: A negative priming effect. Soil Biol. Biochem. 2014, 76, 12–21. [Google Scholar] [CrossRef]
- Laird, D.A.; Brown, R.C.; Amonette, J.E.; Lehmann, J. Review of the pyrolysis platform for coproducing bio–oil and biochar. Biofuels Bioprod. Biorefin. 2009, 3, 547–562. [Google Scholar] [CrossRef]
- Liu, S.; Zhang, Y.; Zong, Y.; Hu, Z.; Wu, S.; Zhou, J.; Jin, Y.; Zou, J. Response of soil carbon dioxide fluxes, soil organic carbon and microbial biomass carbon to biochar amendment: A meta–analysis. Glob. Chang. Biol. Bioenergy 2016, 8, 392–406. [Google Scholar] [CrossRef]
- Lychuk, T.E.; Izaurralde, R.C.; Hill, R.L.; McGill, W.B.; Williams, J.R. Biochar as a global change adaptation: Predicting biochar impacts on crop productivity and soil quality for a tropical soil with the Environmental Policy Integrated Climate (EPIC) model. Mitig. Adapt. Strateg. Glob. Chang. 2015, 20, 1437–1458. [Google Scholar] [CrossRef]
- Zhang, A.; Bian, R.; Pan, G.; Cui, L.; Hussain, Q.; Li, L.; Zheng, J.; Zheng, J.; Zhang, X.; Han, X.; et al. Effects of biochar amendment on soil quality, crop yield and greenhouse gas emission in a Chinese rice paddy: A field study of 2 consecutive rice growing cycles. Field Crops Res. 2012, 127, 153–160. [Google Scholar] [CrossRef]
- Qin, X.; Wang, H.; Liu, C.; Li, J.; Wan, Y.; Gao, Q.; Fan, F.; Liao, Y. Long-term effect of biochar application on yield-scaled greenhouse gas emissions in a rice paddy cropping system: A four-year case study in south China. Sci. Total Environ. 2016, 569, 1390–1401. [Google Scholar] [CrossRef]
- Wu, Z.; Zhang, X.; Dong, Y.; Li, B.; Xiong, Z. Biochar amendment reduced greenhouse gas intensities in the rice-wheat rotation system: Six-year field observation and meta-analysis. Agric. For. Meteorol. 2019, 278, 107625. [Google Scholar] [CrossRef]
- Mohan, D.; Abhishek, K.; Sarswat, A.; Patel, M.; Singh, P.; Pittman, C.U. Biochar production and applications in soil fertility and carbon sequestration–a sustainable solution to crop-residue burning in India. RSC Adv. 2018, 8, 508–520. [Google Scholar] [CrossRef]
- González-Esteban, Á.L. Why wheat? International patterns of wheat demand, 1939–2010. Investig. Hist. Econ. 2017, 13, 135–150. [Google Scholar] [CrossRef]
- Shrawat, A.K.; Armstrong, C.L. Development and application of genetic engineering for wheat improvement. CRC Crit. Rev. Plant Sci. 2018, 37, 335–421. [Google Scholar] [CrossRef]
- Antle, J.M.; Cho, S.; Tabatabaie, S.; Valdivia, R.O. Economic and environmental performance of dryland wheat-based farming systems in a 1.5 °C world. Mitig. Adapt. Strateg. Glob. Chang. 2019, 24, 165–180. [Google Scholar] [CrossRef]
- Beetz, S.; Liebersbach, H.; Glatzel, S.; Jurasinski, G.; Buczko, U.; Höper, H. Effects of land use intensity on the full greenhouse gas balance in an Atlantic peat bog. Biogeosciences 2013, 10, 1067–1082. [Google Scholar] [CrossRef]
- Vera, J.C.; Acreche, M.M. Towards a baseline for reducing the carbon budget in sugarcane: Three years of carbon dioxide and methane emissions quantification. Agric. Ecosyst. Environ. 2018, 267, 156–164. [Google Scholar] [CrossRef]
- Qin, A.Z.; Huang, G.B.; Chai, Q.; Yu, A.Z.; Huang, P. Grain yield and soil respiratory response to intercropping systems on arid land. Field Crops Res. 2013, 144, 1–10. [Google Scholar] [CrossRef]
- Haque, M.; Kim, S.Y.; Ali, M.A.; Kim, P.J. Contribution of greenhouse gas emissions during cropping and fallow seasons on total global warming potential in mono-rice paddy soils. Plant Soil 2015, 387, 251–264. [Google Scholar] [CrossRef]
- Luyssaert, S.; Inglima, I.; Jung, M.; Richardson, A.D.; Reichstein, M.; Papale, D.; Piao, S.; Schulze, E.D.; Wingate, L.; Matteucci, G. CO2 balance of boreal, temperate, and tropical forests derived from a global database. Glob. Chang. Biol. 2007, 13, 2509–2537. [Google Scholar] [CrossRef]
- Tanaka, A.; Osaki, M. Growth and behavior of photosynthesized 14C in various crops in relation to productivity. Soil Sci. Plant Nutr. 1983, 29, 147–158. [Google Scholar] [CrossRef]
- Gent, M.P. Photosynthate reserves during grain filling in winter wheat. Agron. J. 1994, 86, 159–167. [Google Scholar] [CrossRef]
- Van den Boogaard, R.; Goubitz, S.; Veneklaas, E.; Lambers, H. Carbon and nitrogen economy of four Triticum aestivum cultivars differing in relative growth rate and water use efficiency. Plant Cell Environ. 1996, 19, 998–1004. [Google Scholar] [CrossRef]
- Smith, P.; Lanigan, G.; Kutsch, W.L.; Buchmann, N.; Eugster, W.; Aubinet, M.; Ceschia, E.; Béziat, P.; Yeluripati, J.B.; Osborne, B. Measurements necessary for assessing the net ecosystem carbon budget of croplands. Agric. Ecosyst. Environ. 2010, 139, 302–315. [Google Scholar] [CrossRef]
- Huang, Y.; Zhang, W.; Sun, W.; Zheng, X. Net primary production of Chinese croplands from 1950 to 1999. Ecol. Appl. 2007, 17, 692–701. [Google Scholar] [CrossRef] [PubMed]
- Kimura, M.; Murase, J.; Lu, Y. Carbon cycling in rice field ecosystems in the context of input, decomposition and translocation of organic materials and the fates of their end products (CO2 and CH4). Soil Biol. Biochem. 2004, 36, 1399–1416. [Google Scholar] [CrossRef]
- Lu, X.; Lu, X.; Liao, Y. Conservation tillage increases carbon sequestration of winter wheat-summer maize farmland on Loess Plateau in China. PLoS ONE 2018, 13, e0199846. [Google Scholar] [CrossRef] [PubMed]
- Swinnen, J.; Van Veen, J.; Merckx, R. Carbon fluxes in the rhizosphere of winter wheat and spring barley with conventional vs. integrated farming. Soil Biol. Biochem. 1995, 27, 811–820. [Google Scholar] [CrossRef]
- Johnson, J.F.; Allmaras, R.; Reicosky, D. Estimating source carbon from crop residues, roots and rhizodeposits using the national grain–yield database. Agron. J. 2006, 98, 622–636. [Google Scholar] [CrossRef]
- Razzaghi, F.; Obour, P.B.; Arthur, E. Does biochar improve soil water retention? A systematic review and meta-analysis. Geoderma 2020, 361, 114055. [Google Scholar] [CrossRef]
- Suliman, W.; Harsh, J.B.; Abu-Lail, N.I.; Fortuna, A.M.; Dallmeyer, I.; Garcia-Pérez, M. The role of biochar porosity and surface functionality in augmenting hydrologic properties of a sandy soil. Sci. Total Environ. 2017, 574, 139–147. [Google Scholar] [CrossRef] [PubMed]
- Wang, X.; Lu, P.; Yang, P.; Ren, S. Effects of fertilizer and biochar applications on the relationship among soil moisture, temperature, and N2O emissions in farmland. PeerJ 2021, 9, e11674. [Google Scholar] [CrossRef]
- Tarnik, A. Impact of biochar reapplication on physical soil properties. IOP Conf. Ser. Mater. Sci. Eng. 2019, 603, 022068. [Google Scholar] [CrossRef]
- Feng, W.; Yang, F.; Cen, R.; Liu, J.; Qu, Z.; Miao, Q.; Chen, H. Effects of straw biochar application on soil temperature, available nitrogen and growth of corn. J. Environ. Manag. 2021, 277, 111331. [Google Scholar] [CrossRef] [PubMed]
- Zhang, Q.; Wang, Y.; Wu, Y.; Wang, X.; Du, Z.; Liu, X.; Song, J. Effects of biochar amendment on soil thermal conductivity, reflectance, and temperature. Soil Sci. Soc. Am. J. 2013, 77, 1478–1487. [Google Scholar] [CrossRef]
- Liu, Z.; Xu, J.; Li, X.; Wang, J. Mechanisms of biochar effects on thermal properties of red soil in south China. Geoderma 2018, 323, 41–51. [Google Scholar] [CrossRef]
- Hussain, M.; Farooq, M.; Nawaz, A.; Al-Sadi, A.M.; Solaiman, Z.M.; Alghamdi, S.S.; Ammara, U.; Ok, Y.S.; Siddique, K.H. Biochar for crop production: Potential benefits and risks. J. Soils Sediments 2017, 17, 685–716. [Google Scholar] [CrossRef]
- Jin, H. Characterization of Microbial Life Colonizing Biochar and Biochar-Amended Soils. Ph.D. Thesis, Cornell University, New York, NY, USA, 2010. [Google Scholar]
- Spokas, K.; Koskinen, W.; Baker, J.; Reicosky, D. Impacts of woodchip biochar additions on greenhouse gas production and sorption/degradation of two herbicides in a Minnesota soil. Chemosphere 2009, 77, 574–581. [Google Scholar] [CrossRef] [PubMed]
- Dempster, D.; Gleeson, D.; Solaiman, Z.I.; Jones, D.; Murphy, D. Decreased soil microbial biomass and nitrogen mineralisation with Eucalyptus biochar addition to a coarse textured soil. Plant Soil 2012, 354, 311–324. [Google Scholar] [CrossRef]
- Lentz, R.D.; Ippolito, J.A.; Spokas, K.A. Biochar and manure effects on net nitrogen mineralization and greenhouse gas emissions from calcareous soil under corn. Soil Sci. Soc. Am. J. 2014, 78, 1641–1655. [Google Scholar] [CrossRef]
- Ge, X.; Cao, Y.; Zhou, B.; Xiao, W.; Tian, X.; Li, M.H. Combined application of biochar and N increased temperature sensitivity of soil respiration but still decreased the soil CO2 emissions in moso bamboo plantations. Sci. Total Environ. 2020, 730, 139003. [Google Scholar] [CrossRef]
- Wang, C.; Shen, J.; Liu, J.; Qin, H.; Yuan, Q.; Fan, F.; Hu, Y.; Wang, J.; Wei, W.; Li, Y. Microbial mechanisms in the reduction of CH4 emission from double rice cropping system amended by biochar: A four-year study. Soil Biol. Biochem. 2019, 135, 251–263. [Google Scholar] [CrossRef]
- Feng, Y.; Xu, Y.; Yu, Y.; Xie, Z.; Lin, X. Mechanisms of biochar decreasing methane emission from Chinese paddy soils. Soil Biol. Biochem. 2012, 46, 80–88. [Google Scholar] [CrossRef]
- Karhu, K.; Mattila, T.; Bergström, I.; Regina, K. Biochar addition to agricultural soil increased CH4 uptake and water holding capacity–Results from a short-term pilot field study. Agric. Ecosyst. Environ. 2011, 140, 309–313. [Google Scholar] [CrossRef]
- Huang, Y.; Wang, C.; Lin, C.; Zhang, Y.; Chen, X.; Tang, L.; Liu, C.; Chen, Q.; Onwuka, M.I.; Song, T. Methane and nitrous oxide flux after biochar application in subtropical acidic paddy soils under tobacco-rice rotation. Sci. Rep. 2019, 9, 17277. [Google Scholar] [CrossRef] [PubMed]
- Yaghoubi, P.; Yargicoglu, E.N.; Reddy, K.R. Effects of biochar-amendment to landfill cover soil on microbial methane oxidation: Initial results. In Proceedings of the 2014 Congress on Geo-Characterization and Modeling for Sustainability (Geo-Congress 2014), Atlanta, GA, USA, 23–26 February 2014. [Google Scholar]
- Lu, N.; Liu, X.R.; Du, Z.L.; Wang, Y.D.; Zhang, Q.Z. Effect of biochar on soil respiration in the maize growing season after 5 years of consecutive application. Soil Res. 2014, 52, 505–512. [Google Scholar] [CrossRef]
- Ray, R.L.; Griffin, R.W.; Fares, A.; Elhassan, A.; Awal, R.; Woldesenbet, S.; Risch, E. Soil CO2 emission in response to organic amendments, temperature, and rainfall. Sci. Rep. 2020, 10, 5849. [Google Scholar] [CrossRef]
- Hontoria, C.; Saa, A.; Rodríguez–Murillo, J. Relationships between soil organic carbon and site characteristics in peninsular Spain. Soil Sci. Soc. Am. J. 1999, 63, 614–621. [Google Scholar] [CrossRef]
- Shen, Y.; Zhu, L.; Cheng, H.; Yue, S.; Li, S. Effects of biochar application on CO2 emissions from a cultivated soil under semiarid climate conditions in Northwest China. Sustainability 2017, 9, 1482. [Google Scholar] [CrossRef]
- Fang, H.; Yu, G.; Cheng, S.; Zhu, T.; Wang, Y.; Yan, J.; Wang, M.; Cao, M.; Zhou, M. Effects of multiple environmental factors on CO2 emission and CH4 uptake from old-growth forest soils. Biogeosciences 2010, 7, 395–407. [Google Scholar] [CrossRef]
- Gao, B.; Ju, X.; Su, F.; Meng, Q.; Oenema, O.; Christie, P.; Chen, X.; Zhang, F. Nitrous oxide and methane emissions from optimized and alternative cereal cropping systems on the North China Plain: A two-year field study. Sci. Total Environ. 2014, 472, 112–124. [Google Scholar] [CrossRef] [PubMed]
- Striegl, R.G.; McConnaughey, T.; Thorstenson, D.; Weeks, E.; Woodward, J. Consumption of atmospheric methane by desert soils. Nature 1992, 357, 145–147. [Google Scholar] [CrossRef]
- Zhou, M.; Zhu, B.; Wang, X.; Wang, Y. Long-term field measurements of annual methane and nitrous oxide emissions from a Chinese subtropical wheat-rice rotation system. Soil Biol. Biochem. 2017, 115, 21–34. [Google Scholar] [CrossRef]
- Lu, X.; Li, Y.; Wang, H.; Singh, B.P.; Hu, S.; Luo, Y.; Li, J.; Xiao, Y.; Cai, X.; Li, Y. Responses of soil greenhouse gas emissions to different application rates of biochar in a subtropical Chinese chestnut plantation. Agric. For. Meteorol. 2019, 271, 168–179. [Google Scholar] [CrossRef]
- Wu, X.L.; Chin, K. Effect of temperature stress on structure and function of the methanogenic archaeal community in a rice field soil. FEMS Microbiol. Ecol. 2002, 39, 211–218. [Google Scholar] [CrossRef] [PubMed][Green Version]
- Dunfield, P.; Dumont, R.; Moore, T.R. Methane production and consumption in temperate and subarctic peat soils: Response to temperature and pH. Soil Biol. Biochem. 1993, 25, 321–326. [Google Scholar] [CrossRef]
- Wang, C.J.; Tang, S.M.; Wilkes, A.; Jiang, Y.Y.; Han, G.D.; Huang, D. Effect of stocking rate on soil-atmosphere CH4 flux during spring freeze-thaw cycles in a northern desert steppe, China. PLoS ONE 2012, 7, e36794. [Google Scholar] [CrossRef]
- Oleszczuk, P.; Jośko, I.; Futa, B.; Pasieczna-Patkowska, S.; Pałys, E.; Kraska, P. Effect of pesticides on microorganisms, enzymatic activity and plant in biochar-amended soil. Geoderma 2014, 214, 10–18. [Google Scholar] [CrossRef]
- Quilliam, R.S.; DeLuca, T.H.; Jones, D.L. Biochar application reduces nodulation but increases nitrogenase activity in clover. Plant Soil 2013, 366, 83–92. [Google Scholar] [CrossRef]
- Zhang, R.; Zhang, Y.; Song, L.; Song, X.; Hänninen, H.; Wu, J. Biochar enhances nut quality of Torreya grandis and soil fertility under simulated nitrogen deposition. For. Ecol. Manag. 2017, 391, 321–329. [Google Scholar] [CrossRef]
- Uzoma, K.C.; Inoue, M.; Andry, H.; Fujimaki, H.; Zahoor, A.; Nishihara, E. Effect of cow manure biochar on maize productivity under sandy soil condition. Soil Use Manag. 2011, 27, 205–212. [Google Scholar] [CrossRef]
- Laird, D.; Fleming, P.; Wang, B.; Horton, R.; Karlen, D. Biochar impact on nutrient leaching from a Midwestern agricultural soil. Geoderma 2010, 158, 436–442. [Google Scholar] [CrossRef]
- Abiven, S.; Hund, A.; Martinsen, V.; Cornelissen, G. Biochar amendment increases maize root surface areas and branching: A shovelomics study in Zambia. Plant Soil 2015, 395, 45–55. [Google Scholar] [CrossRef]
- Liu, Q.; Liu, B.; Zhang, Y.; Lin, Z.; Zhu, T.; Sun, R.; Wang, X.; Ma, J.; Bei, Q.; Liu, G. Can biochar alleviate soil compaction stress on wheat growth and mitigate soil N2O emissions? Soil Biol. Biochem. 2017, 104, 8–17. [Google Scholar] [CrossRef]
- Viger, M.; Hancock, R.D.; Miglietta, F.; Taylor, G. More plant growth but less plant defence? First global gene expression data for plants grown in soil amended with biochar. Glob. Chang. Biol. Bioenergy 2015, 7, 658–672. [Google Scholar] [CrossRef]
- Yan, Q.; Dong, F.; Li, J.; Duan, Z.; Yang, F.; Li, X.; Lu, J.; Li, F. Effects of maize straw–derived biochar application on soil temperature, water conditions and growth of winter wheat. Eur. J. Soil Sci. 2019, 70, 1280–1289. [Google Scholar] [CrossRef]
- Jeffery, S.; Verheijen, F.G.; van der Velde, M.; Bastos, A.C. A quantitative review of the effects of biochar application to soils on crop productivity using meta-analysis. Agric. Ecosyst. Environ. 2011, 144, 175–187. [Google Scholar] [CrossRef]
- Wang, J.; Chen, Z.; Xiong, Z.; Chen, C.; Xu, X.; Zhou, Q.; Kuzyakov, Y. Effects of biochar amendment on greenhouse gas emissions, net ecosystem carbon budget and properties of an acidic soil under intensive vegetable production. Soil Use Manag. 2015, 31, 375–383. [Google Scholar] [CrossRef]
- Grutzmacher, P.; Puga, A.P.; Bibar, M.P.S.; Coscione, A.R.; Packer, A.P.; de Andrade, C.A. Carbon stability and mitigation of fertilizer induced N2O emissions in soil amended with biochar. Sci. Total Environ. 2018, 625, 1459–1466. [Google Scholar] [CrossRef]
- Qian, Z.; Kong, L.J.; Shan, Y.Z.; Yao, X.D.; Zhang, H.J.; Xie, F.T.; Xue, A. Effect of biochar on grain yield and leaf photosynthetic physiology of soybean cultivars with different phosphorus efficiencies. J. Integr. Agric. 2019, 18, 2242–2254. [Google Scholar]
- Ciais, P.; Wattenbach, M.; Vuichard, N.; Smith, P.; Piao, S.; Don, A.; Luyssaert, S.; Janssens, I.; Bondeau, A.; Dechow, R. The European carbon balance. Part 2: Croplands. Glob. Chang. Biol. 2010, 16, 1409–1428. [Google Scholar] [CrossRef]
- Chapin, F.S.; Woodwell, G.M.; Randerson, J.T.; Rastetter, E.B.; Lovett, G.M.; Baldocchi, D.D.; Clark, D.A.; Harmon, M.E.; Schimel, D.S.; Valentini, R. Reconciling carbon-cycle concepts, terminology, and methods. Ecosystems 2006, 9, 1041–1050. [Google Scholar] [CrossRef]
- Benbi, D.K.; Toor, A.; Brar, K.; Dhall, C. Soil respiration in relation to cropping sequence, nutrient management and environmental variables. Arch. Agron. Soil Sci. 2020, 66, 1873–1887. [Google Scholar] [CrossRef]
Publisher’s Note: MDPI stays neutral with regard to jurisdictional claims in published maps and institutional affiliations. |
© 2022 by the authors. Licensee MDPI, Basel, Switzerland. This article is an open access article distributed under the terms and conditions of the Creative Commons Attribution (CC BY) license (https://creativecommons.org/licenses/by/4.0/).