1. Introduction
Honeybees ensure the pollination of agricultural crops and without them agriculture as it is now could not exist. Without bees, many fruit, seed, and nut yields would significantly decrease [
1]. Beekeeping is an important agricultural activity globally that contributes to sustainable rural area development in two main ways: economic (income) support and ecological support from honeybee activities [
2,
3,
4].
The importance of the beekeeping activities has been emphasized in the field of biodiversity, ecosystems, agriculture, and human health. Thus, efficient management and deciding correct beekeeping activities seems essential to maintain and improve productivity and efficiency [
5]. Moreover, beekeeping activities have an importance to rural economic development through the derived products such as honey, pollen, beeswax, royal jelly, bee venom, and propolis which are very important for human health and crop pollination [
6].
Land should be used based on its capacity to meet human needs and ensure the sustainability of ecosystems. Furthermore, determining suitable locations for beekeeping should be evaluated in the field of land use planning considering economical, ecological, environmental, and social aspects [
7]. Due to the close relationship between honeybees and their surrounding environment, there is scope to exploit the value of geospatial information through the use of geographic information systems (GIS) [
8]. GIS, which can manipulate, store, and analyze various datasets in connection with a geographical reference, has been used in many agricultural aspects [
9].
To create GIS-based solutions, it is necessary to analyze all the available data in detail and explore different ways to visualize it. This is very important to ensure the completeness, accuracy, and trustworthiness of the resulting GIS solution.
Because flowering and foraging areas are time-dependent criteria, mapping and illustrating these criteria have some difficulties, but selection of a good foraging location for bee colonies is an important task for beekeepers, especially for migratory beekeeping [
10]. Different fields and potential foraging locations can be competitors for the pollination service if their flowering periods overlap, and they can complement each other when plants have different flowering periods [
11]. Since all crops do not flower simultaneously, the beekeepers can move their bee colonies from one forage site to the next throughout the year. To make the apiary location planning more efficient and predictive, beekeepers can use information about the crop and plant flowering.
To make the flowering calendar more user friendly and appealing, it is combined with spatial information and GIS data and is presented as a digital tool.
Digitalization of beekeeping is an ongoing process, which includes not only the digital tool and software development for the beekeepers, but also the real-time monitoring of the colonies. These are all within the precision beekeeping direction [
12].
Regarding real-time monitoring of the colonies, there are plenty of available scientific, commercial systems and software solutions [
13]. When information and communication technologies (ICTs) are applied to assist beekeeping, profitability may increase because the technology systematically helps to take care of beehives [
14]. The application of ICT can be used for other beekeeping-related tasks as well, for instance, completing the beekeeping journal, managing financial operations, marketing the products, etc.
There were several approaches formed to use map services and geographic tools to support beekeepers in their decision making. Application of Google Maps as a tool for decision support in solving spatial problems associated with the American Foulbrood disease was described by [
15]. Web-based application BeeBox was developed to visualize patterns of growth in floral resources and hence allow beekeepers to make better decisions in planning their seasonal operations in Australia [
16]. The application of GIS is to identify the best locations to establish new apiaries within a given geographical location [
17]. Moreover, GIS was used to present expectations about the potential impacts of climate change on honeybees [
18]. In general, the development of these decision-making platforms is challenging because they must be adapted both to various heterogeneous environments and to modern technologies that are constantly being updated [
19].
The main idea and the aim of this research was to create a digital interactive map application that can be used as a toolbox for beekeepers. Beekeepers can use the application as a support solution to improve their beekeeping activities. At the same time, the application can be used by researchers as a “sandbox” to implement and test different kinds of models, technologies, and solutions for beekeepers.
The outcome of this study would mainly allow the Latvian beekeepers to predict and plan the apiary locations that can provide potentially the highest production during the honeybee colony foraging season. This can be particularly useful for the migratory beekeepers, who change the apiary location throughout the foraging season.
One of the most important tasks during the development of the interactive map was the digitalization and visualization of a flowering calendar for Latvian cultivated plants. A flowering calendar is a timetable for a beekeeper that indicates the approximate date and duration of the blossoming periods of the important nectar and pollen plants [
20], basically serving as a guide to migrate the colonies during nectar flow to obtain higher honey production [
21]. As the calendar is based on real data, it can be used by a variety of specialists from other fields as well, to help them solve their specific problems, and in general, it can serve as an educational material for the general public observing the flowering of local plant cultures. Currently, given the rapidly changing climatic conditions, it has been seen that the selection of the bee foraging locations should be decided by combining more qualified information rather than experience [
22].
Beekeeping in Latvia has a long tradition, and it is a classical branch of agriculture. In Latvia, there is no traditional beekeeping region, and beekeeping is performed in all regions [
23]. The natural foraging base does not provide the honey yield evenly throughout the whole season, thus the interactive map should help the beekeepers to optimally plan their beekeeping activities more efficiently. Precision beekeeping in Latvia has also started to be a part of the beekeeping practice [
24], thus more ICT solutions and tools should be developed and introduced into beekeeping.
Within this research we developed a combined interactive tool, which includes features such as flowering calendar, field calculator, weather data, and others.
This research is conducted within the Horizon 2020 FET programme project HIVEOPOLIS (
https://www.hiveopolis.eu/, accessed on 18 February 2023).
2. Materials and Methods
This section describes a selected approach for the interactive map development and visualization process. Within this research, we used real field data based on the available GIS data set for Latvia. The author’s approach can be used in any different geographical location connecting appropriate GIS data layers. The focus of this study was on cultivated crops as the used GIS data did not have information about natural vegetation (such as tree species, wild plants, etc.). Nevertheless, the existing literature supports the idea that natural vegetation also has an important resource for managed honeybees and represents a key supporting ecosystem service to sustain honeybee populations outside the months when the cultivated crops are blooming [
25,
26], thus this information can be added by the crowd support on the digital map.
Each nectar producing plant has its own flowering time and duration. Many external environmental parameters can affect the start of flowering. As well, in each geographical and climatic region, spring can come at different times, and this can change the progress of the flowering process. As we are focusing on the cultivated plants, the sowing date is known, so the blooming time can also be calculated based on historical data and knowledge. By using different literature sources [
27,
28,
29] we developed an example table of nectar plant flowering phenology.
For the flowering calendar a data step equal to the one week is selected. This parameter is used for visualization purposes. In this study we did not split the flowering period by the intensity of the blooming, as the productivity of plants can potentially vary during the whole flowering period.
The development of the interactive map application is based on free and open-source software. The main one is R (
https://www.r-project.org/, accessed on 18 February 2023), which is a free software environment for statistical computing and graphics. It compiles and runs on a wide variety of UNIX platforms, Windows, Linux, and MacOS. R Studio was used as the integrated development environment (IDE) for R (
https://posit.co/products/open-source/rstudio/, accessed on 18 February 2023)
There are different kinds of R libraries (packages) that were used to provide the necessary functionality for the development and operation of the application. The R packages used are available from the Comprehensive R Archive Network (CRAN) repository. The main ones are:
Leaflet—was used to implement the interactive map support. Leaflet is the leading open-source library based on JavaScript for deployment of the interactive maps on the WEB (
https://rstudio.github.io/leaflet/, accessed on 18 February 2023);
To work with the geographic data and do the preparation of the data prototypes the QGIS was used. QGIS is a free and open-source geographic information system (
https://www.qgis.org/en/site/, accessed on 18 February 2023).
For the weather data provisioning Open Weather Map’s API was used, which allows to obtain data about the weather parameters in a selected location. Parameters such as temperature, humidity, air pressure, and wind speed were selected, as they are the most important for beekeepers.
For the air pollution also Open Weather Map’s API was used. Air pollution is affecting bees, as they rely on their sense of smell to identify different flowers [
30]. Air pollution masks the scent molecules from plants. This makes bees forage longer, leading them to become ineffective pollinators because of the decreased reproductive output and the amount of pollen flow in flowering plants [
31].
An important feature of the interactive map is the input from the crowd (crowdsourcing data and external users). There are several crowdsourcing scenarios which can be considered and implemented in the map.
Beekeepers can put the apiary on the map to inform other beekeepers where bee colonies are already present;
Crowd informs the beekeepers about the blooming plants and locations for potential foraging;
Farmers informing and marking fields where some pesticides, insecticides or other plant protection products have been used.
These features are planned to be implemented in the interactive map in the near future.
There is information available about specific fields including: area ID, name of the planted crop, field area in ha, and year of application. This information is used in the interactive map to calculate individual crop area and number of fields and to visually show different crops encoded by different colors.
In addition, such parameters such as melliferousness, diversity, and equitability indexes are calculated in the map. Melliferousness, is a parameter which shows the amount of nectar per kg that can be foraged from 1 ha field of a specific plant. This parameter can be used to evaluate the potential amount of nectar that can be foraged by bees from those fields in suitable meteorological parameters.
For environmental sustainability it is important to know the diversity of crops for the specific region, especially when beekeepers are aiming to produce monofloral honey. For this study, we selected the Shannon Diversity Index (sometimes called the Shannon–Wiener Index) to measure the diversity of crop species in a geographical location [
32].
Denoted as H, this diversity index is calculated as:
where pi is the proportion of the entire community made up of species i.
The higher the value of H, the higher the diversity of species is in a particular location. The lower the value of H, the lower the diversity. A value of H = 0 indicates that only one species is present.
In addition to the diversity index, the equitability index can also be calculated. Equitability is a way to measure the evenness of species in a location. The term “evenness” simply refers to how similar the abundances of different species are in the community. Its value ranges between 0 and with 1 being complete evenness.
Denoted as EH, the Shannon’s equitability index is calculated as:
where H is Shannon’s diversity index and S is the number of species encountered in a region.
3. Results and Discussion
As a result of this research an interactive map with different sources of data were developed. Meteorological, hive-specific data, hive monitoring data, and GIS data were used as data sources. The main output services for the end-users are flowering calendar, weather forecast, and exchange of the data about croplands.
3.1. General Map with Crop Fields
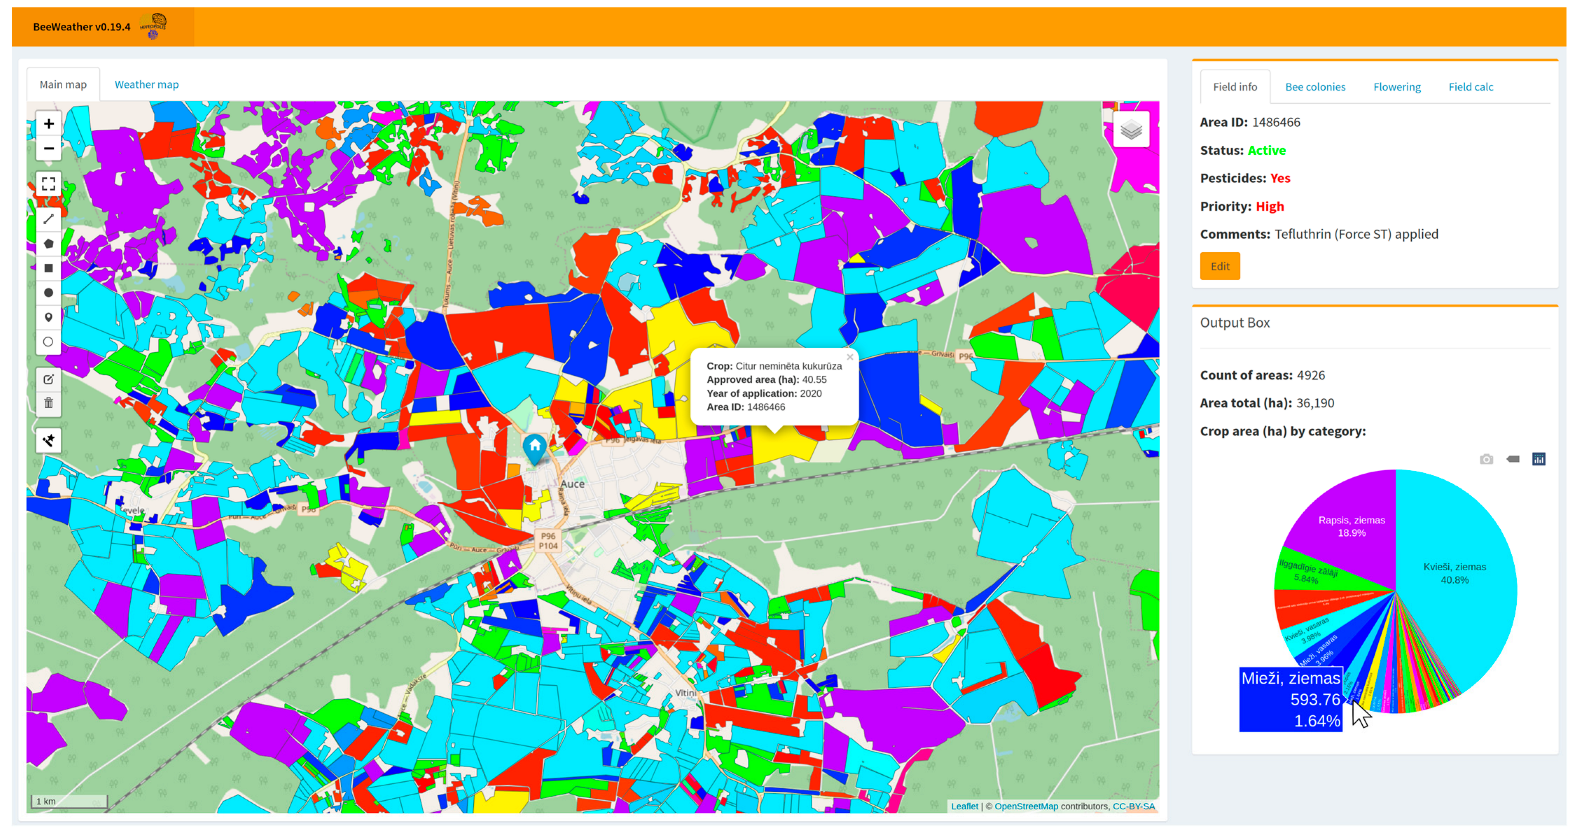
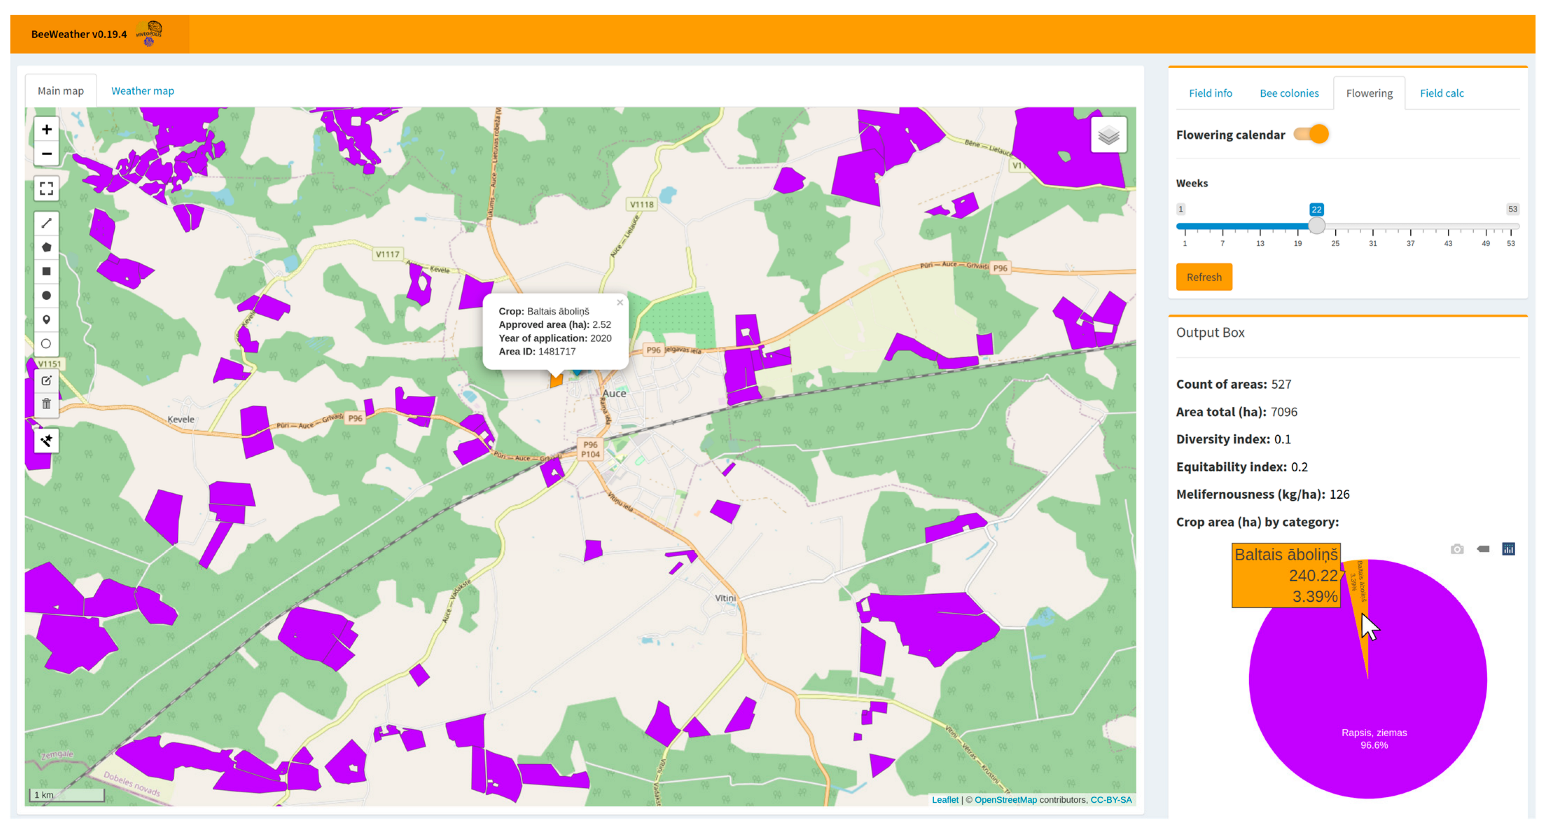
A main outcome of the study is the visualization of cultivated crops in a geographic region, based on GIS data. One of the benefits of the developed software is that data can be aggregated and grouped in different ways, and the outcome can be demonstrated to the end users. The image below (see
Figure 1) shows the variety of cultivated crops in a selected region. In addition, the number of fields, total area of crops, and area by individual crops are summarized for the user.
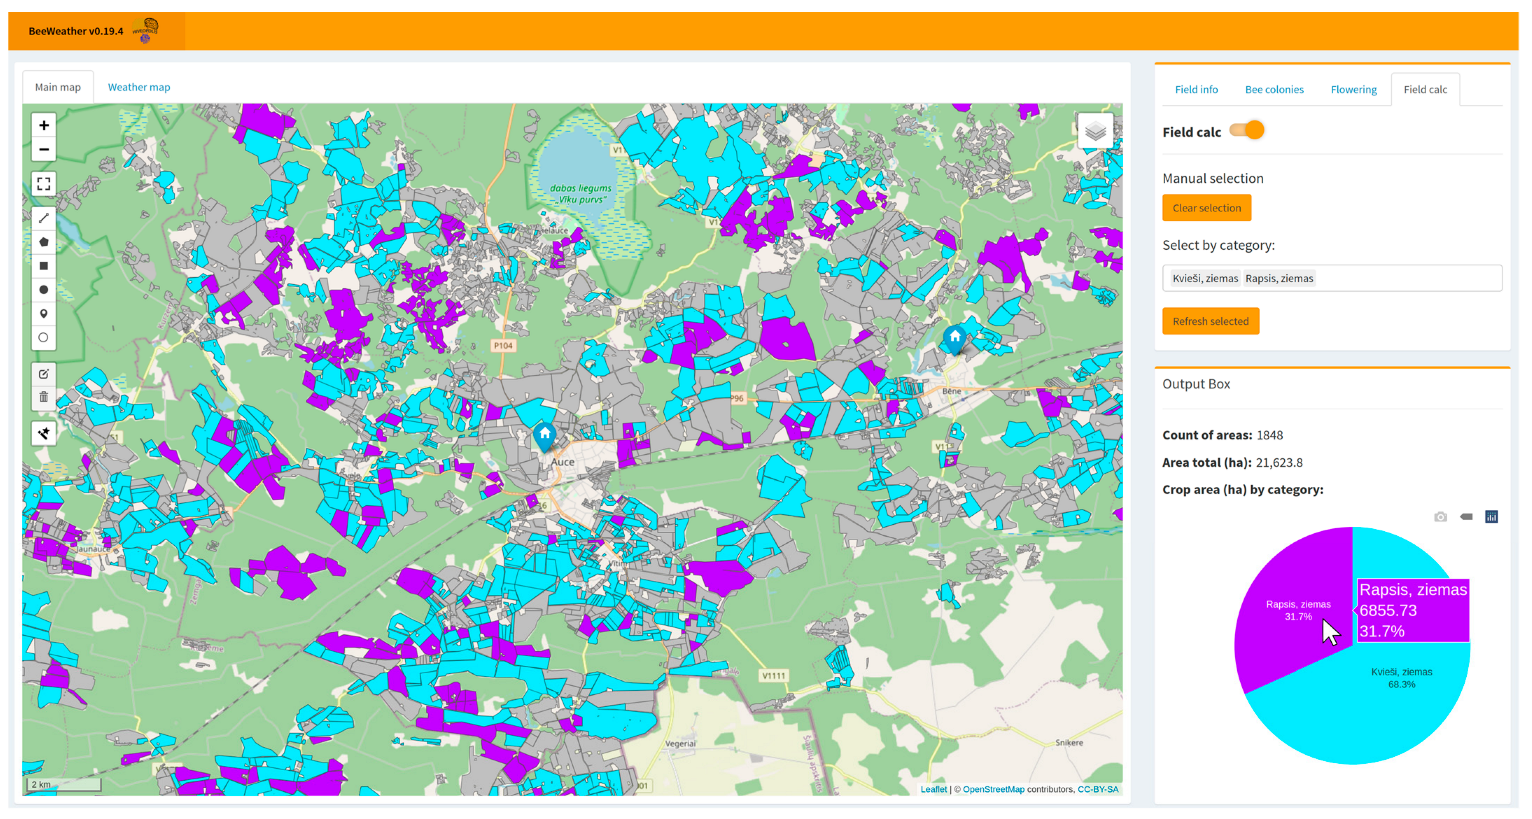
The interactive map also provides the ability to select individual crops and observe where they are planted. It also provides information on the percentage of selected fields, their number and total area. The figure below (see
Figure 2) demonstrates wheat and rape fields.
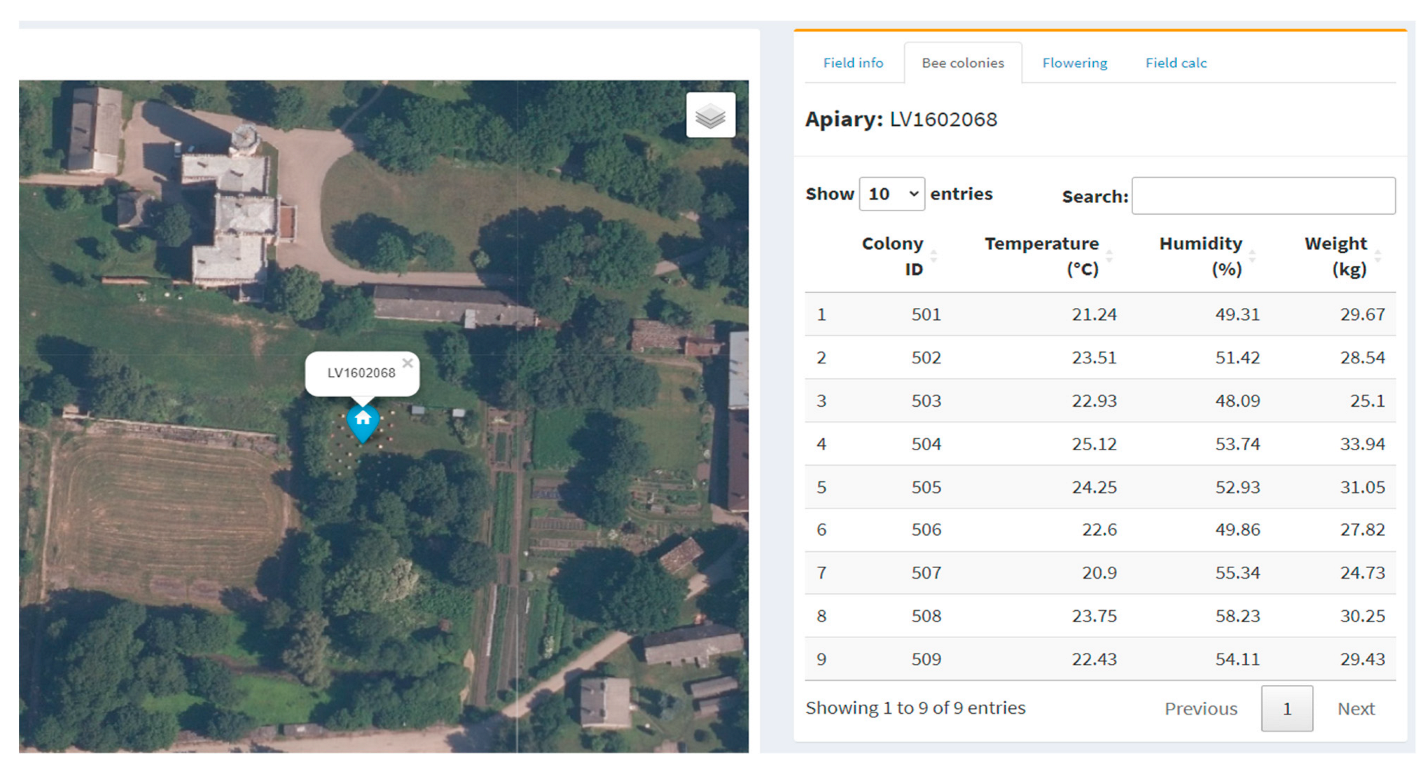
3.2. Remote Colony Monitoring
The possibility for the remote monitoring of bee colonies makes it possible to monitor the situation in the apiary without being physically present there. For the monitoring purpose each hive should be equipped with the necessary set of measurement devices for collecting and transmitting data. Among the bee colony data, it is important to note such parameters as the temperature and humidity inside the hive, as well as the weight of the hive. The monitoring data are displayed in the table of the sidebar of the application when a specific apiary is selected (see
Figure 3).
The focus of this paper was not on colony monitoring devices, and thus an example of how to integrate these data to the interactive map is presented using the ready API from another system. To receive data in the application, a dedicated API is used. Thus, if there is an API available, it is possible to obtain and interpret data in a different ways, as well as for other apiaries.
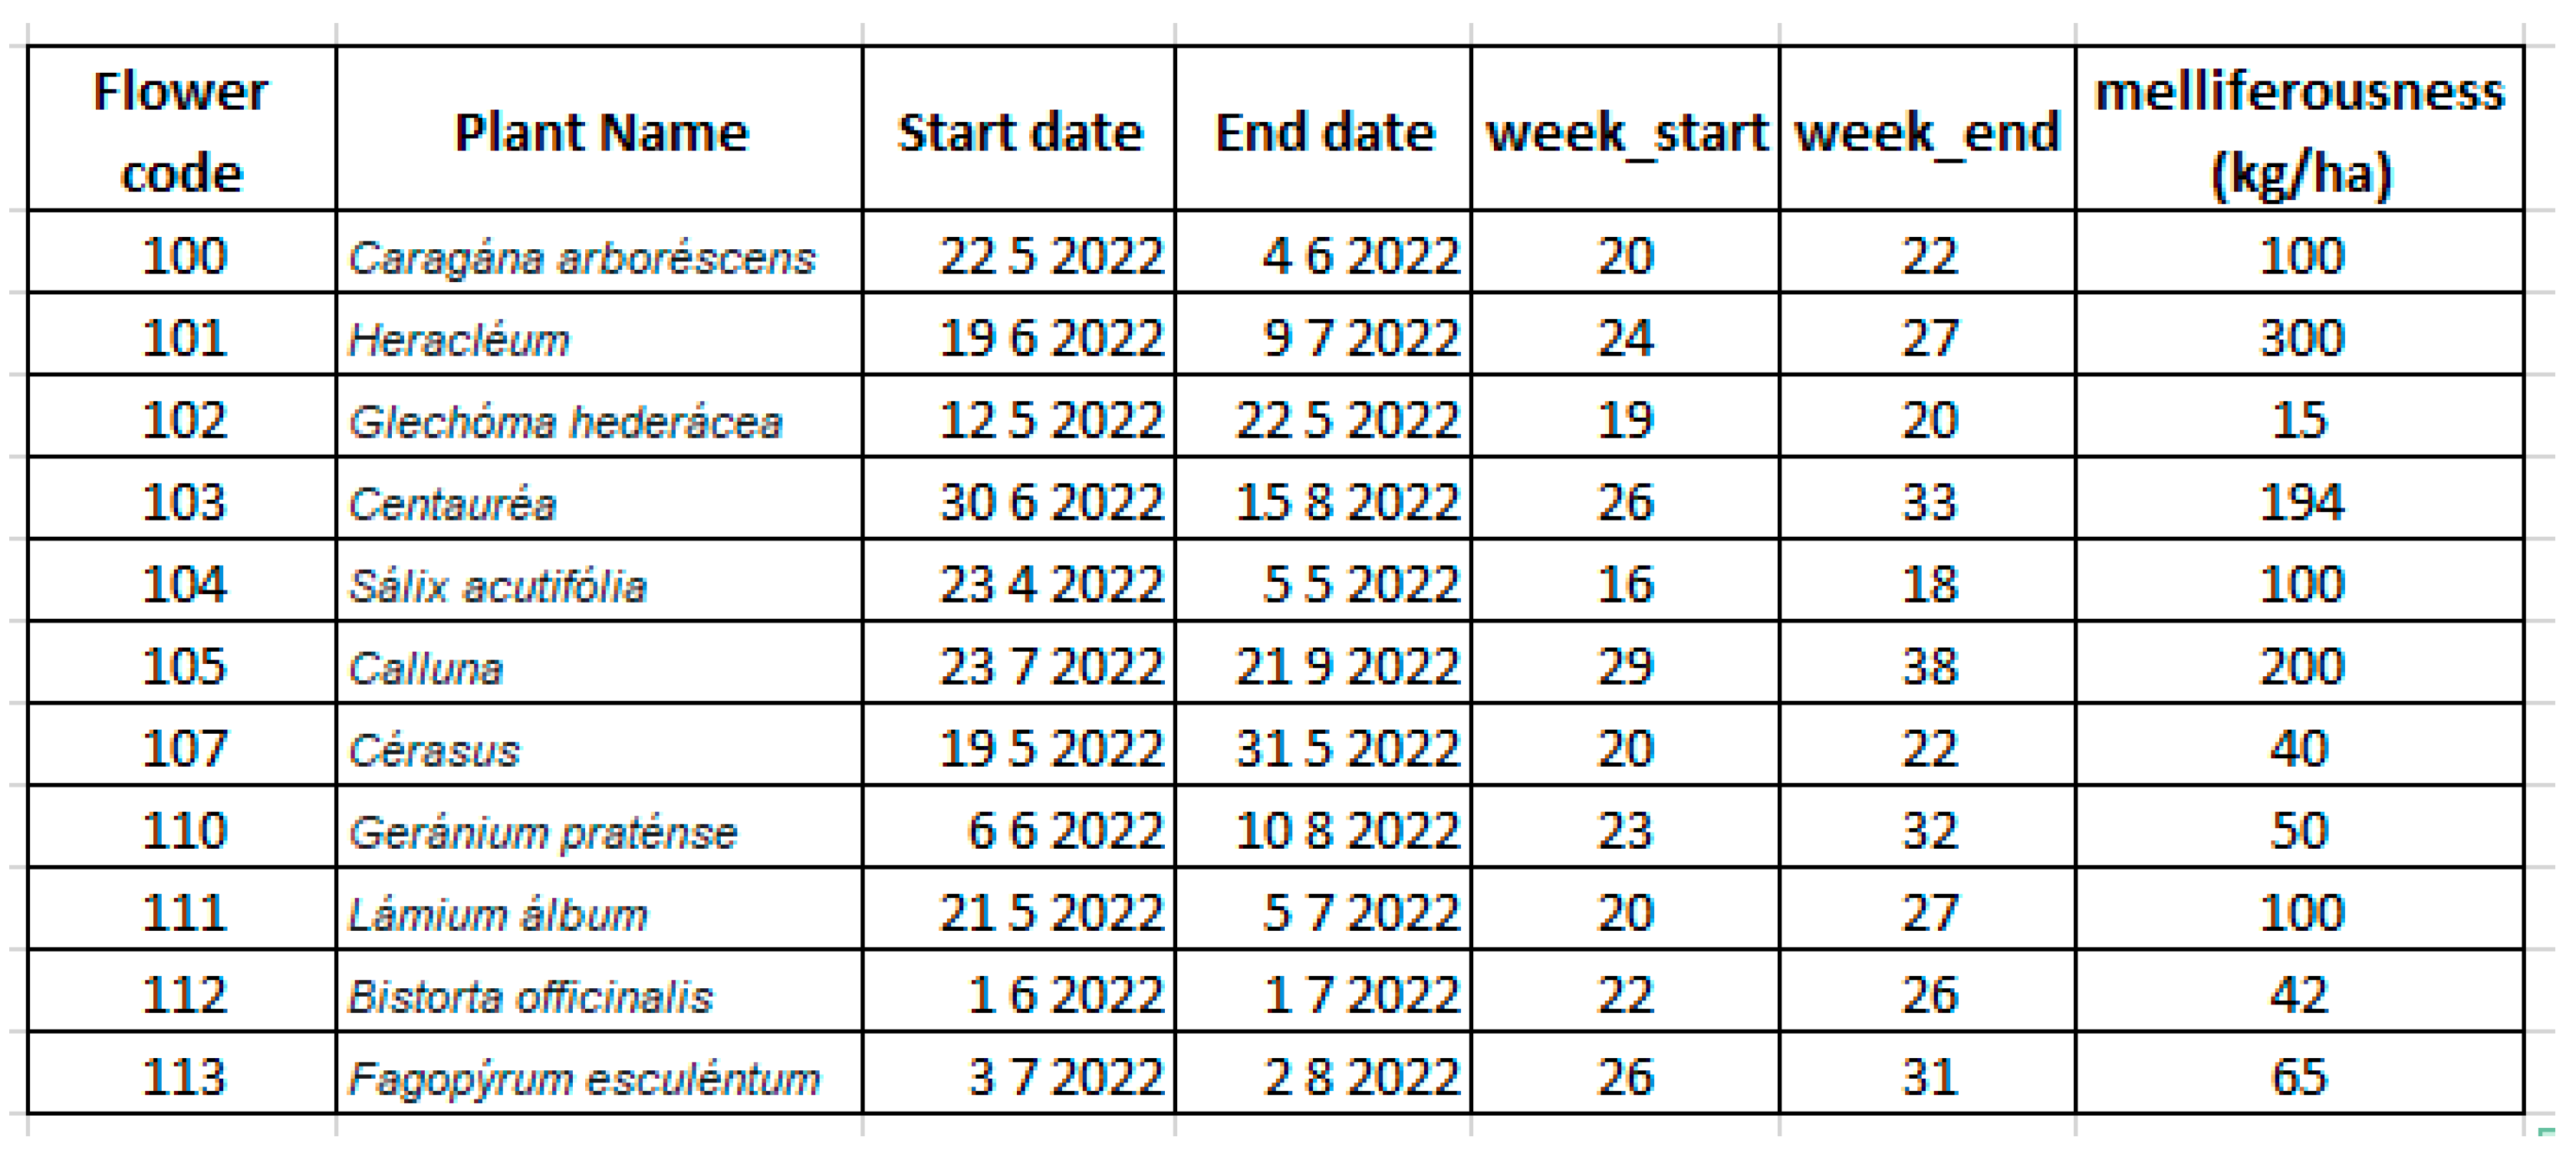
3.3. Flowering Simulation
The proposed solution provides flowering simulation for the managed crops when the fields of the map are encoded by color, based on flowering information throughout the weeks of a year. For now, information about the flowering is simulated and can be different from the real situation. The information about the flowering is hard-coded, providing the week numbers for each crop. An example of the flowering table (see
Figure 4) is provided below.
The simulation of the flowering process was also implemented within the interactive map and can be demonstrated for a selected geographical region. The simulation contains 53 steps, which correspond to weeks of the year, when an individual simulation step is equal to a one-week step. The maximum number of weeks for the year is equal to 53, thus this number is taken for the simulation. The image below (see
Figure 5) shows simulation step for week 22.
By changing the “Weeks” slider, it is possible to observe flowering information in the selected week of the year. The number of fields, total area of flowering crops, and area by individual crops are summarized for the user.
The flowering simulation provides the information about the blooming periods of plants that are usable to beekeepers, especially migratory beekeepers, in order to select a more beneficial geographical location for apiary placing. The flowering calendar can be considered as an important tool for determining various beekeeping management operations, such as when to add or reduce supplementary feed and honeybee colony migration time.
3.4. Diversity and Equitability Indexes
Diversity and equitability indexes are calculated within all flowering simulation steps (weeks) and are shown to the end user. These indexes are calculated for the whole selected geographical area, where the summed area of 4926 fields is equal to 36,191 ha.
3.5. Mellferousness
For better usage of the calendar, it is also possible to show the area (km
2) of the fields on the image (see
Figure 6), then taking into account nectar production rates (“Melliferousness”), the potential amount of nectar available for foraging can be evaluated. It can be performed by selecting one specific field.
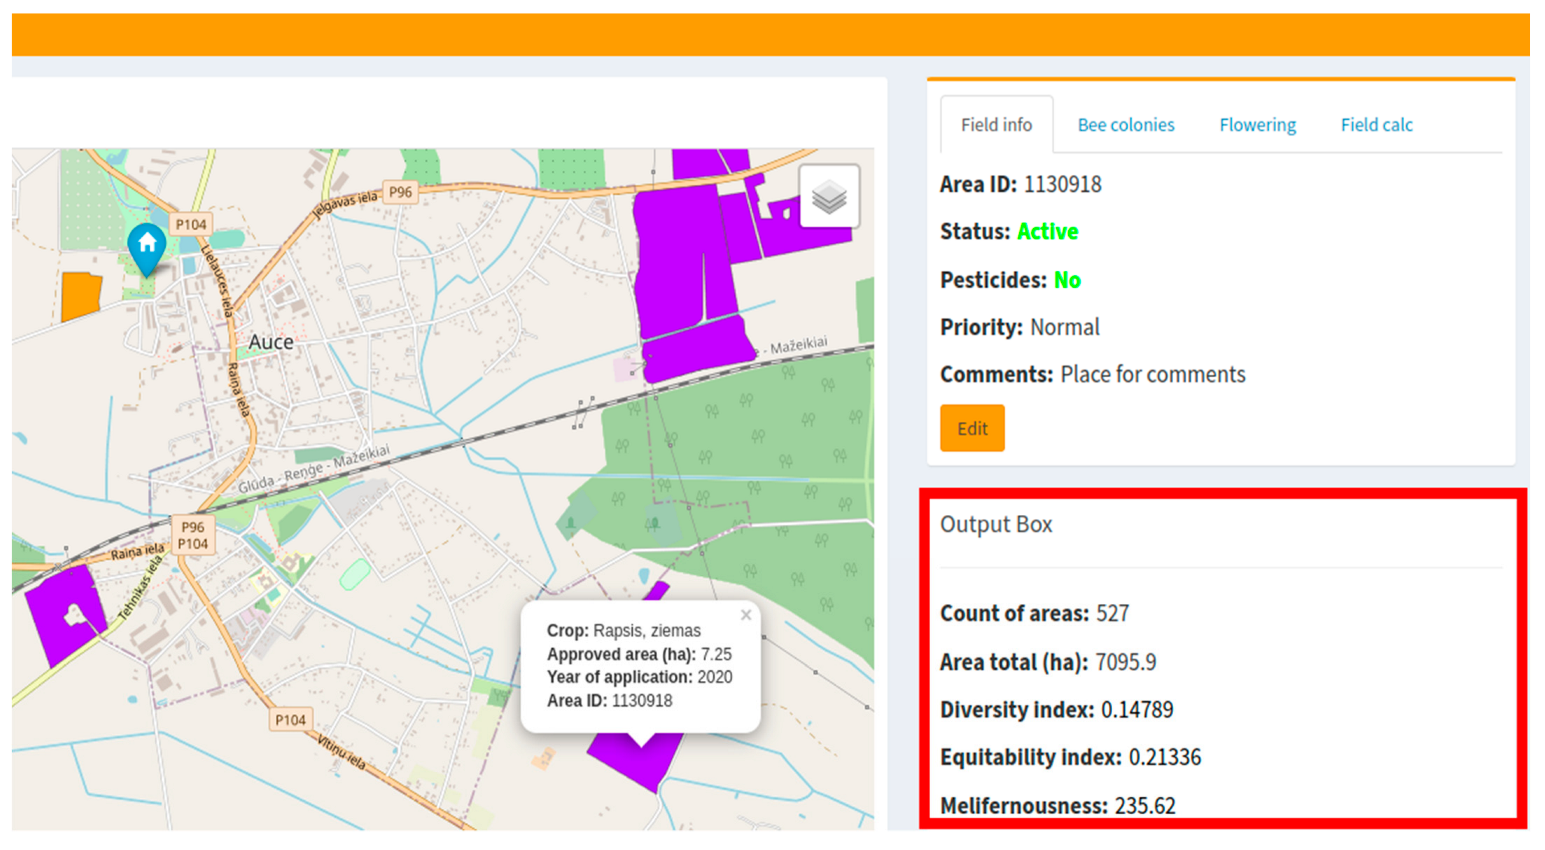
All these calculated parameters (diversity, equitability indexes, and melliferousness) are available at the sidebar, inside the “Output Box” element.
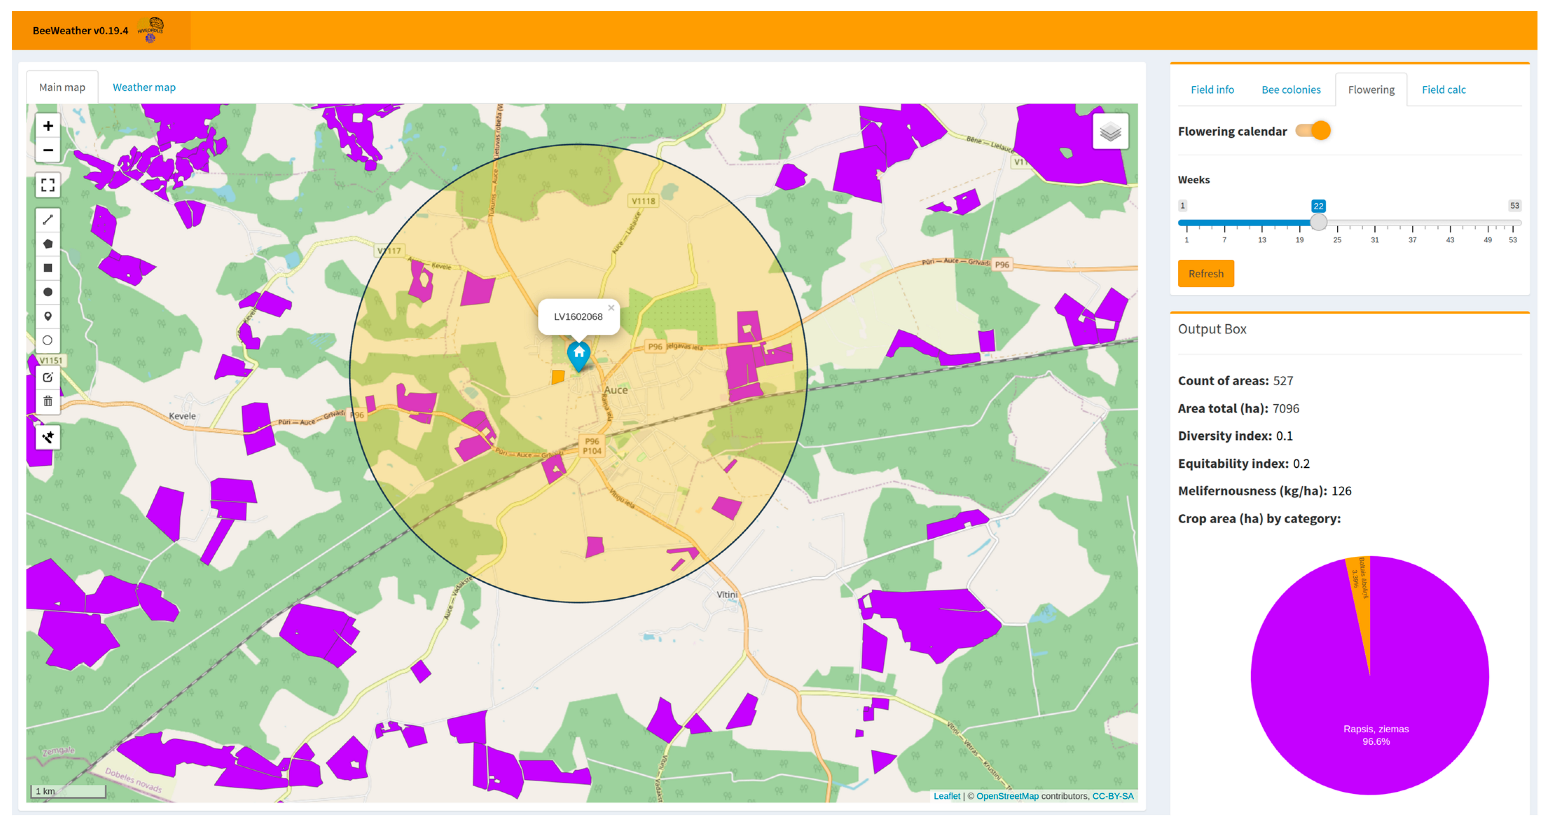
3.6. Bee Flight Radius Image with Fields
For beekeepers, it is important to know the crops which are growing within the foraging radius of the bees. It is assumed that the flight radius of the bees is 3 km [
33]. In the image below (see
Figure 7) the foraging radius is visually shown as a circle on a map. The beekeepers can then determine the crops that flower at a specific time of the year.
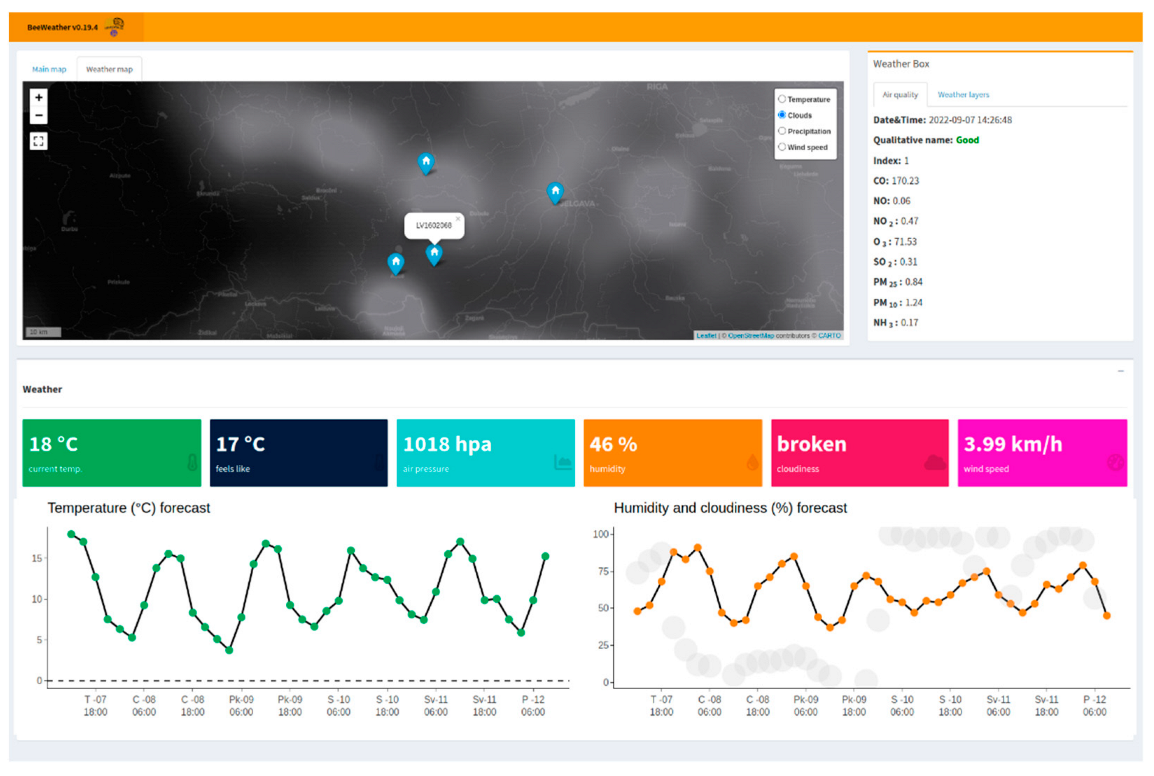
3.7. Weather and Air Pollution Data Integration
The developed application has a separate sub-module called Weather Map that contains a separate interactive map with the information about weather and the forecast in the individual geographical locations (see
Figure 8). Weather data can provide value for the beekeepers to predict colony behavior and foraging activity. Weather data are provided by OpenWeatherMap.
To supplement the Weather Map with additional information air pollution data are also used to provide the basic information about the air quality status. Air pollution data are also provided by OpenWeatherMap service and shows the air quality parameters in the specific location.
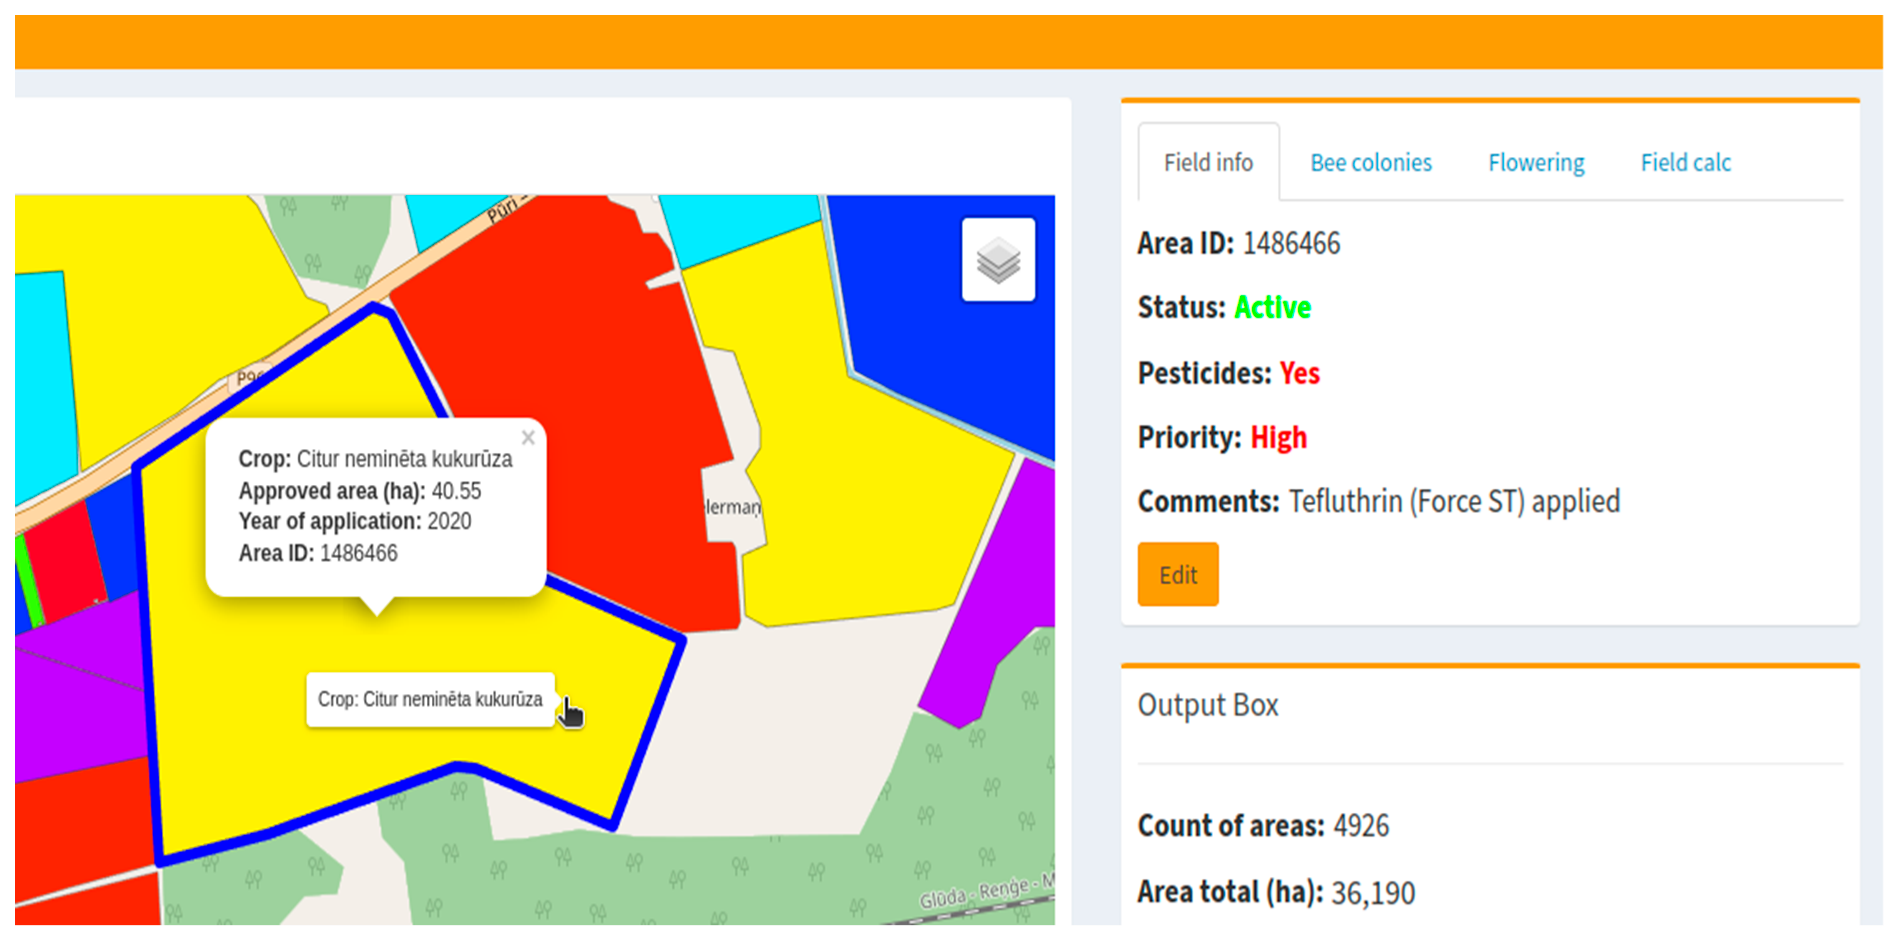
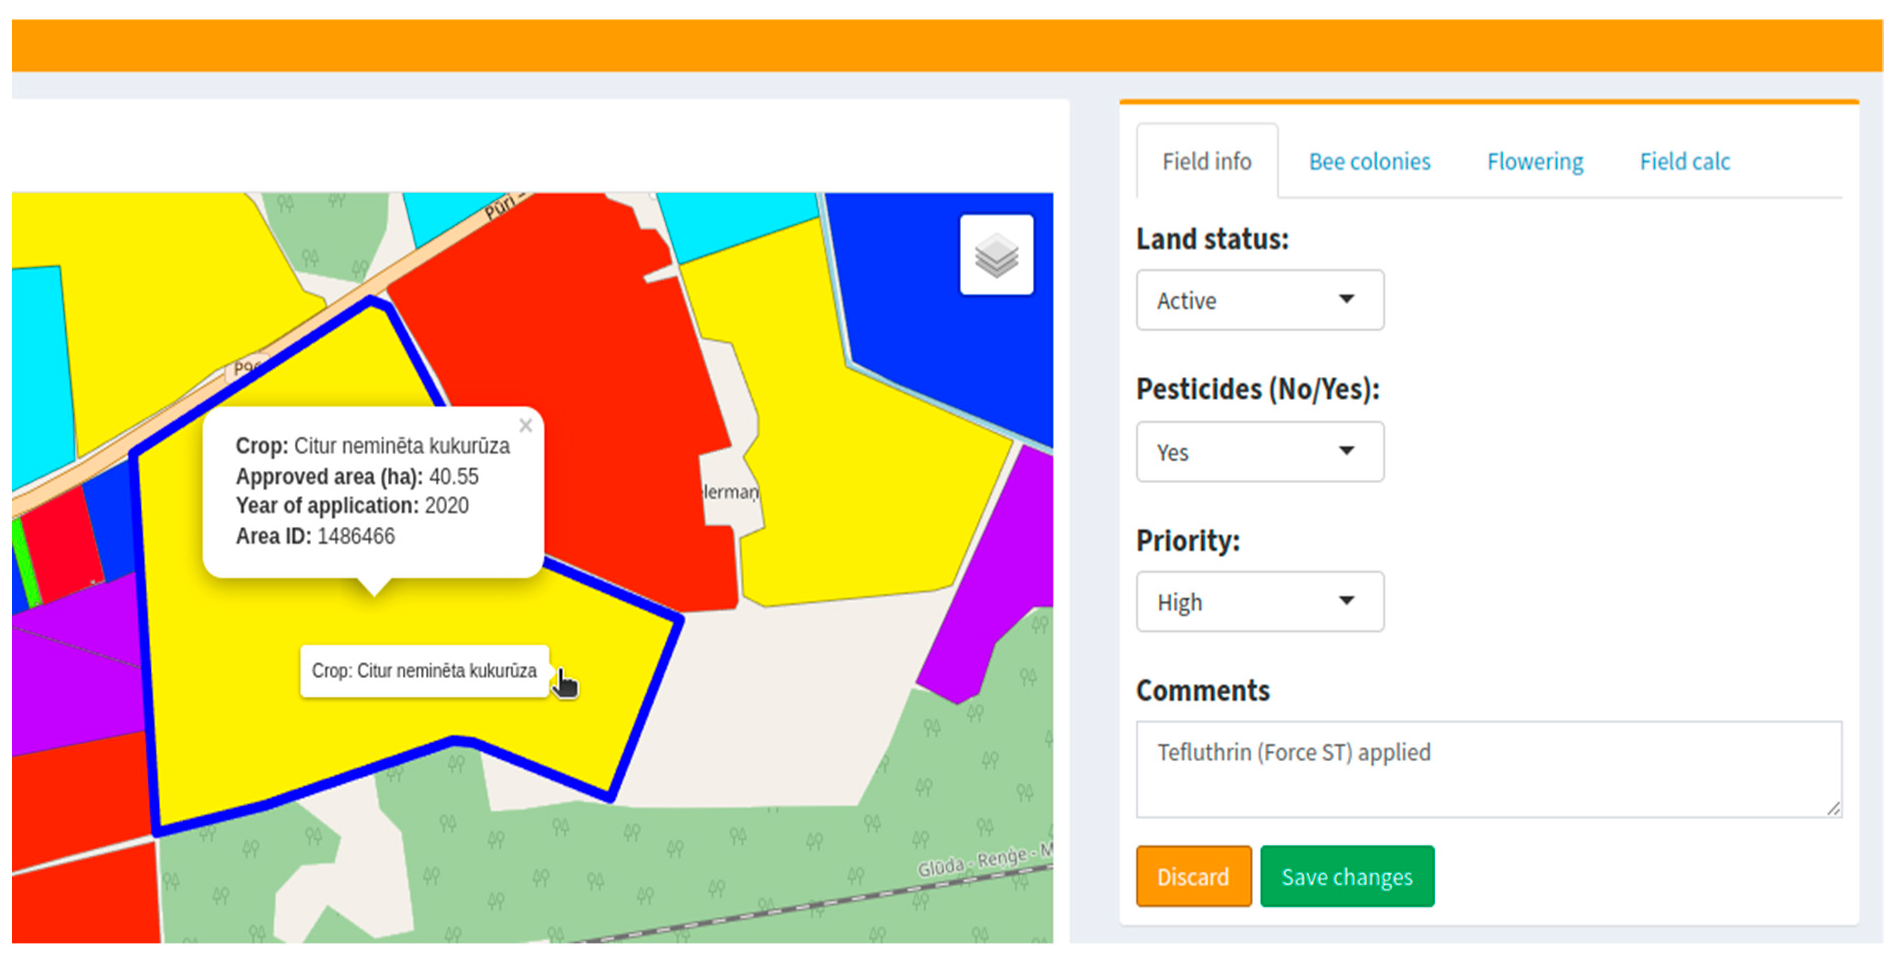
3.8. Crowdsourcing Data
There are many crowdsourcing scenarios which can be considered and implemented in the interactive map. For now, this feature is implemented as an interactive data exchange within each field of the map. Each field has four parameters that can be modified by the user:
Status (of the field usage, Active/Inactive);
Pesticides (No/Yes) (pesticide usage in the current field);
Priority (of the field, Normal/High);
Comments (additional information that can be useful).
The images below show the examples of the data view (see
Figure 9) and editing modes (see
Figure 10).
The developed GIS interactive map can potentially be integrated with additional information on natural vegetation, as this usually presents great interest for the beekeepers because such crops are not treated with pesticides and can guarantee high honey production. To validate provided data by the GIS map, bee colony monitoring should take place, especially bee colony weight should indicate start and end periods of the crops flowering.
One more direction in which this developed system can be used is the rationalization of pollination services, by coordinating times and areas between farmers and beekeepers.
The future plans in relation to the crowdsourcing data are to implement a solution to interactively draw the objects (shapes, markers, etc.) on the map. It can be also possible to add appropriate data to the created objects (pesticide, insecticide, danger, etc.).
For now, the prototype of the interactive map can be accessed locally, but in the near future it will be available online for any interested party. This interactive map also can be used by agricultural specialists and farmers for planning activities. It can also serve as an educational tool for the general public, as well.
One more potential application of the developed interactive map lies within the urban beekeeping topic. It is possible to show the location of urban hives, thus informing citizens about such places, and evaluate the urban beekeeping activity in different geographical locations.
To provide the possibly higher added value from the interactive map and flowering calendar, it should be constantly updated based on actual agricultural crops and climatic conditions, which affect the start and duration of crop flowering.


