Article

The Impact of Urbanization on Cultivated Land Use Efficiency in the Yangtze River Economic Belt in China

1
School of Business, Shandong University of Political Science and Law, Jinan 250014, China
2
Faculty of Commerce and Accountancy, Thammasat University, Bangkok 10200, Thailand
3
Institute of Automation, Qilu University of Technology (Shandong Academy of Sciences), Jinan 250014, China
4
School of Economics, Shandong University of Finance and Economics, Jinan 250014, China
5
Faculty of Economics, Chiang Mai University, Chiang Mai 50200, Thailand
*
Author to whom correspondence should be addressed.
Agriculture 2023, 13(3), 666; https://doi.org/10.3390/agriculture13030666
Submission received: 27 February 2023 / Revised: 10 March 2023 / Accepted: 11 March 2023 / Published: 13 March 2023
(This article belongs to the Section Agricultural Economics, Policies and Rural Management)

Abstract

:
The Yangtze River Economic Belt (YREB), an important industrial belt for food security for China, is facing the challenge of decreasing cultivated land in the process of rapid urbanization. In this case, how to improve the cultivated land use efficiency (CLUE) has become the top priority. Based on data from 108 cities of YREB from 2001 to 2019, we measured CLUE using a slack-based measure with undesirable output (SBM-Undesirable). The high-value area of CLUE shows a trend from multi-core agglomeration to two-core agglomeration, mainly concentrated in Chengdu-Chongqing urban agglomeration and the northern part of the YREB. Then the paper examines the spatial effect of urbanization on CLUE using the Spatial Error Model (SEM). The result shows that population urbanization has significantly promoted the improvement of CLUE in YREB during the sample period. With each percentage point increase in population urbanization, CLUE will increase by 2.99%. Land urbanization has a negative impact on CLUE, for each percent increase in the expansion of urban spatial scope, CLUE will decrease by 0.06%. The spatial heterogeneity analysis shows that population urbanization in the lower reaches has significantly promoted CLUE, with a coefficient of 1.053. The population urbanization level in the middle and lower reaches of the region has no obvious effect on CLUE. The coefficient of land urbanization in the downstream region is 0.35, which significantly promotes CLUE. The coefficient in the middle is −0.26, which implies the CLUE decreases by 0.26% for every one percentage point increase in land urbanization. Land urbanization in the upper has no significant impact on the CLUE. Policy implications include improving the quality of the three major urban clusters along the YREB, building an ecologic protective screen in the upper, encouraging a new agricultural management system and detailed regulations related to the cultivated land protection in YREB.

1. Introduction

Cultivated land is the basic resource of human survival and development [1,2]. Farmland protection is of great importance for food security and social stability, especially given the dual impact of COVID-19 and regional tensions [3,4]. Over recent decades, developing countries are characterized by a decrease in rural land use and an increase in urban land use through urbanization [5,6]. In China, where urbanization has reached 60%, the cultivated land area only accounts for one-eighth of the total land area. With the acceleration of urbanization, cultivated land area is still shrinking unceasingly, which is an indisputable fact [7,8]. In this case, it is particularly important to make full and reasonable use of every inch of cultivated land and improve the cultivated land use efficiency (CLUE) [9,10]. What is more, the redistribution of urban and rural labor forces and cultivated land brought by urbanization will inevitably affect the CLUE [11,12]. Therefore, understanding the relationship between urbanization and CLUE is crucial to the sustainable development of cultivated land [13,14,15].
The Yangtze River Economic Belt (YREB) covers 25% of China’s land area and accounts for more than 40% of the population and Gross Domestic Product (GDP) [16]. It is the economic belt with the most vitality and development potential in China, with self-evident importance to the economy. However, with dramatic urbanization and industrialization, YREB is also facing the problem of increasingly scarce cultivated land resources. The 14th Five-Year Plan proposes to improve the efficiency of resource utilization and promote the coordinated and sustainable development of the middle and lower reaches of the YREB and the eastern, central and western regions. Under the new development concept, promoting high-quality development of the YREB, especially striking a balance between ecological and environmental protection and economic growth, is a major strategy for China’s overall development. Cultivated land is the most important factor of production in agricultural development. Therefore, improving the CLUE has become an urgent issue in the face of dwindling arable land in YREB [17]. The rapid urbanization of the YREB inevitably has brought about the decline of the cultivated land area. Does it do the same to the CLUE? What is more, how do we handle the relationship between urbanization and cultivated land use in the YREB? How can YREB better realize the coordinated development of economy and ecology in the process of urbanization? Figuring out these problems has become important content in studies on YREB.
To date, research on cultivated land mostly focuses on the evaluation of CLUE or the quality of cultivated land. Scholars have reached different conclusions on the trend of CLUE based on different methods or sampling. Some suggested that CLUE was on the rise. Kuang et al. [18] analyzed the CLUE of China and showed that there was an increasing trend in CLUE from 2000 to 2017. Besides, most provinces had much lower levels of CLUE with significant spatial disparities [19]. Herzig et al. [20] presented a novel approach to assess explicitly the resource-use efficiency of land use and the test assessment showed that the resource-use efficiency could be increased by 11% for both nitrate and sediment loss in the Haean catchment, South Korea. Masini et al. [21] presented a multidimensional analysis of land-use efficiency in terms of the per-capita built-up area over 417 metropolitan regions from 27 European countries and the results indicated that wealthier cities were characterized by higher land-use efficiency.
Others concluded that CLUE was declining. Fei et al. [22] and Guo et al. [23] thought the CLUE in China had decreased overall from 2004 to 2017, showing a decreasing trend from the east to the central and west. It has not evolved towards harmonious development of the environment and economy. Xie et al. [24] found that the net loss of topsoil through cultivated land use is 1.75 times the resilience of the cultivated land system, which places tremendous pressure on cultivated land protection. Lu et al. [25] took 65 cities of the Yellow River Basin as the basic evaluation unit and found that the CLUE presents a trend of “rising first and then falling”. Yang et al. [26] indicated that socioeconomic development level, agricultural science and technology investments, carbon emission reduction, and agricultural pollution control could all effectively improve the CLUE in the YREB.
As for the impact of urbanization on cultivated land, most scholars hold that urbanization was one of the main reasons for the decrease in cultivated land resources in China [27]. The evolution of cultivated land is driven by climatic, economic, and social factors, of which population density is one of the most important factors [8]. With the development of urbanization, a large amount of cultivated land had been transformed into industrial land, infrastructural land and residential land, resulting in the reduction of cultivated land [28,29]. Yang et al. [30] have explored the trajectory and driving paths of rural transformation in traditional agricultural areas, taking the Loess Plateau of China as an example. They found that regional urbanization was one of the key forces affecting traditional agricultural areas. Under the impact of urbanization and other factors, land use showed an eco-transformation from farmland to forest land, and from cultivated land gradually to uncultivated land. Tian et al. [31] found that the expansion of non-agricultural land had been mainly characterized by the growth of industrial land by combining Landsat TM images and land use maps based on a site survey. This is in line with Haroon and Mohd [5], which concluded that the amount of built-up area had increased dramatically whereas the area under agriculture had decreased drastically due to urban expansion from 1991 to 2010. Li et al. [32] measured changes in rainfed land, paddy land, irrigated land and orchards in the peri-urban area throughout a period of rapid urbanization and indicated that irrigated land and orchards were mainly distributed within urban-adjacent areas, and paradoxically showed an evident decrease in quantity across time. Hou et al. [33] systematically analyzed how urbanization influenced the CLUE and concluded agglomeration and barrier effects had a significant negative effect on the CLUE, while driving and feedback effects presented significant positive effects. However, other scholars argued that urbanization was conducive to the improvement of land use intensity and can protect cultivated land. Since the per capita construction land in urban areas was less than that in rural areas, population urbanization would not only not increase the occupation of cultivated land, but also could protect cultivated land [34]. Li et al. [35] found strong connections between the land conversion rates and urban–rural transformation intensity in the Bohai Rim region. That is, rapid land conversion normally takes place in counties/districts of low initial level of urban–rural transformation.
Although existing studies have provided rich insights into understanding the relationship between urbanization and CLUE, more efforts are still needed to account for the relationship between the two. First, studies mostly have focused on the impact of urbanization on urban land efficiency [36,37,38] or the reduction of the cultivated land area [39]. The impact of urbanization on CLUE has been rarely studied, especially along the YREB, the most important driving force for China’s economic development. Second, there is abundant research on the measurement of CLUE in the existing literatures. However, when it comes to the impact of urbanization on CLUE in YREB, the measurement of CLUE lacks consideration of environmental issues. Besides, urbanization is accompanied by the gathering of the population into cities and the expansion of urban space. These are not fully recognized in previous studies, leading to errors or deviations in estimating and analyzing process. Third, the measurement of CLUE mainly adopts the data at the provincial level, while the data at the municipal level are rarely used.
The contribution of this study is as follows: (1) Compared with previous studies, this paper focuses on the differentiated impact of population and land urbanization on CLUE in the YREB. The result makes a clear understanding of the impact of urbanization on CLUE, which is of great significance for promoting the high-quality development of the YREB. (2) Considering the impact of environmental pollution, this paper adopts the SBM-Undesirable method to evaluate the CLUE in YREB. On this basis, we use the spatial effect model to analyze the impact of urbanization on CLUE and its regional differences, providing a reference for decision makers to rationally plan urban layout and balanced development of cultivated land resources in the YREB (3). Different from previous studies on CLUE in YREB, which use data at the provincial level, this paper uses the data of 108 cities in YREB to measure CLUE and analyze its evolution trend. This has important reference value for reducing cultivated land-use carbon emissions and promoting green and low-carbon transformations of cultivated land for YREB.
The remainder of this paper is as follows. In Section 2, we introduce the study area and the method of spatial empirical analysis. Section 3 carries on the spatial empirical analysis. Section 4 is the discussion. Section 5 is the conclusion with some policy implications.

2. Methodology

2.1. Study Area

The YREB (21°08′ N–35°07′ N, 97°22′ E–123°25′ E) covers 11 provinces and cities, including Shanghai, Jiangsu, Zhejiang, Anhui, Jiangxi, Hubei, Hunan, Chongqing, Sichuan, Yunnan and Guizhou (Figure 1). We selected 108 cities as the study unit. Then according to the Outline of the Development Plan for the Yangtze River Economic Belt, this paper divides the 108 cities into the lower, middle and upper reaches. The lower reaches of the YREB involve Shanghai and 40 cities in Jiangsu, Zhejiang and Anhui provinces. The middle involves 36 cities in Jiangxi, Hubei and Hunan provinces. The upper involves Chongqing and 30 cities in Sichuan, Guizhou and Yunnan provinces.

2.2. Variable and Data Source

Dependent Variable (CLUE): This paper uses SBM to measure CLUE. The CLUE is the ratio of input and output of cultivated land. Based on input-output rules and data availability, we selected four variables, including agricultural labor, agricultural machinery, fertilizer application rate, and agricultural sown area as the input indictors according to Liu et al. [40] and Zhao et al. [41]. Expect output involves total grain production and gross agricultural output value. The carbon emissions estimated by the amount of chemical fertilizer used are taken as the undesired output. Table 1 represents the description of variables. We used Matlab7.0 to measure the CLUE of 108 cities in the YREB from 2001 to 2019.
Explanatory variables (UB): Population urbanization and land urbanization are the two main dimensions of urbanization. On the one hand, urbanization leads to the occupation of cultivated land, the reduction of high-quality farmland, and the scarcity of cultivated land resources. On the other hand, urbanization leads to the transfer of agricultural labor force to cities, and the reduction of the agricultural labor force inevitably affects the efficiency of cultivated land. Therefore, we choose population urbanization (UB1) and land urbanization (UB2) as the core explanatory variable in this paper. Population urbanization is expressed as the total urban population at the end of the year. Land urbanization is represented by the proportion of urban construction land in the urban area.
Control variable:
Economic development (EC): In economically developed areas, residents have higher incomes. The increase in residents’ demand for green organic agricultural products stimulates the government to improve the supervision of food safety and agricultural resources and ecological environmental protection, thus encouraging agricultural operators to reduce the use of agricultural chemical inputs. All these may affect the utilization efficiency of cultivated land. The level of economic development is measured by GDP per capita.
Industrial structure (IS): The industrial structure will directly affect the employment structure of farmers. The developed secondary and tertiary industries will promote the transfer of the agricultural labor force to the secondary and tertiary industries. The shift of agricultural labor to non-agricultural industries will hinder the improvement of food production efficiency. This may affect the efficiency of cultivated land.
In order to reduce the deviation caused by neglected variables, this paper also introduced other control variables which may affect CLUE. Effective irrigation rates can improve the quality of cultivated land, and increasing multiple cropping indexes can directly increase grain output, thus affecting the utilization efficiency of cultivated land. The variables are shown in Table 2.
There are 133 cities along the YREB. We include Chaohu in Anhui Province in Hefei as it was established in 2011. There are many ethnic minorities in Hubei and Yunnan provinces and the statistical data in these areas are lacking. Thus this paper employed panel data from 108 cities in the YREB from 2001 to 2019. Some missing data has been filled in with the average of adjacent years. The data on labor force, mechanical, fertilizer, land, gross agricultural output value, effective irrigation rate and multiple cropping index were retrieved from the China Rural Statistical Yearbook (2002–2020). The data on population urbanization, land urbanization and industrial structure were from the China City Statistical Yearbook (2002–2020). The data on economics were from the National Bureau of Statistics of China from 2002 to 2020.

2.3. Spatial Econometric Model

Given the spatial nature of the variables, the Spatial Lag Model (SLM) and Spatial Error Model (SEM) was established. The SLM model assumes that explained variables influence the economy of other regions through spatial interaction [42]. SEM model assumes that the spillover of spatial effect is the result of random impact, and its spatial effect is mainly transmitted through error terms [43]. The models are as follows:
SLM:
C L U E it = β 0 + ρ W C L U E it + β 1 U B jit + β 2 X it + ε it
SEM:
C L U E it = β 0 + β 1 U B jit + β 2 X it + μ it μ it = λ W μ it + ε it
where i denotes the variable in region i, t represents the year in the sample period, CLUEit represents the cultivated land use efficiency of the 108 cities in YREB, and UBit denotes the urbanization level of each city. It represents population urbanization when j = 1 and land urbanization when j = 2. Xit is the control variable. μit is the individual fixed effects. εit is a disturbance term that varies with individuals and time.
The paper investigates the effect of urbanization on CLUE based on the geographical weights matrix (W1) and economic distance weight matrix (W2). The spatial weight matrixes are as follows:
W 1 = { 1 ,   if   i   and   j   are   adjacent 0 ,   otherwise
W 2 = W 1   d i a g ( Y 1 ¯ Y ¯ , Y 1 ¯ Y ¯ Y n ¯ Y ¯ )
where Y i ¯ represents the average GDP of region i during the research period, and Y ¯ represents the average GDP of all regions during the observation period.

2.4. SBM-Undesirable Model

The Data Envelopment Analysis (DEA) model, originally proposed by Charnes et al. [44] in 1978, can determine the relative efficiency of a set of comparable decision-making units [45]. However, it ignores the output that is undesirable in the evaluation process. To ameliorate this problem, Tone (2001) [46] has developed a slack-based measure with undesirable output (SBM-Undesirable) with non-radial and non-angle, which can measure the efficiency of combining desirable and undesirable outputs [26].
Suppose that the cultivated land use system of each city in YREB has n decision-making units, m, s1 and s2 are the number of inputs, expected outputs and unexpected outputs. Then, the input matrix X , desirable output matrix Y g , and undesirable output matrix Y b  are respectively expressed as follows:
X = ( x 1 , x 2 ,   , x n ) R m × n Y g = ( x 1 g , y 2 g , , y n g ) R s 1 × n Y b = ( y 1 b , y 2 b , , y n b ) R s 2 × n
The SBM model with undesirable outputs is expressed as follows:
ρ * = min 1 1 m i = 1 m S i X i 0 1 + 1 s 1 + s 2 ( r = 1 s 1 S r g y r 0 g + r 1 s 2 S r b y r 0 b )   ( 0 ρ * 1 ) s t { x 0 = X λ + S y 0 g = Y g λ     S g y 0 b = Y b λ + S b S ,   S g ,   S b ,   λ 0 }
where ρ* represents the CLUE value. S,Sg and Sb represent the slack variables of input, expected output and the unexpected output, respectively. λ is the weight vector. When ρ * = 1, it is the optimal solution of the decision-making unit.

2.5. Data Analysis

To find an appropriate spatial model, the LM test and LR test are carried out respectively before the spatial regression. In the LM test, the model with a higher statistical significance is better. If they pass the significance test at the same level, a robust LM test needs to be conducted, and then, a suitable model according to the results of the robust LM test can be selected [42]. Using Stata 15 [47], the results are shown in Table 3. SEM and SLM both pass the significant test at the 10% level at least when the matrix is W1 and W2, but in the robust LM test, the SLM fails to pass the significant test. Thus, SEM is adopted for spatial regression in this paper. Based on the panel data of 108 cities in the YREB from 2001 to 2019, we introduced the SEM to investigate the effects of population urbanization on CLUE.

3. Results

3.1. Spatial Correlation Analysis

To reflect the spatial features of the CLUE, the global Moran’s I has been listed in Table 4, respectively. The indices of all variables are significantly positive at the 1% significance level, indicating that CLUE has positive spatial autocorrelation. Before 2010, Moran’s I grew slowly, followed by a prominent growth trend after 2011, which then decreased in 2015 and picked up in 2019. This indicates that the spatial agglomeration of CLUE in the YREB is in the stage of increasing volatility during the sample period, but the overall spatial differentiation pattern remains relatively stable.

3.2. Spatial Feature Analysis

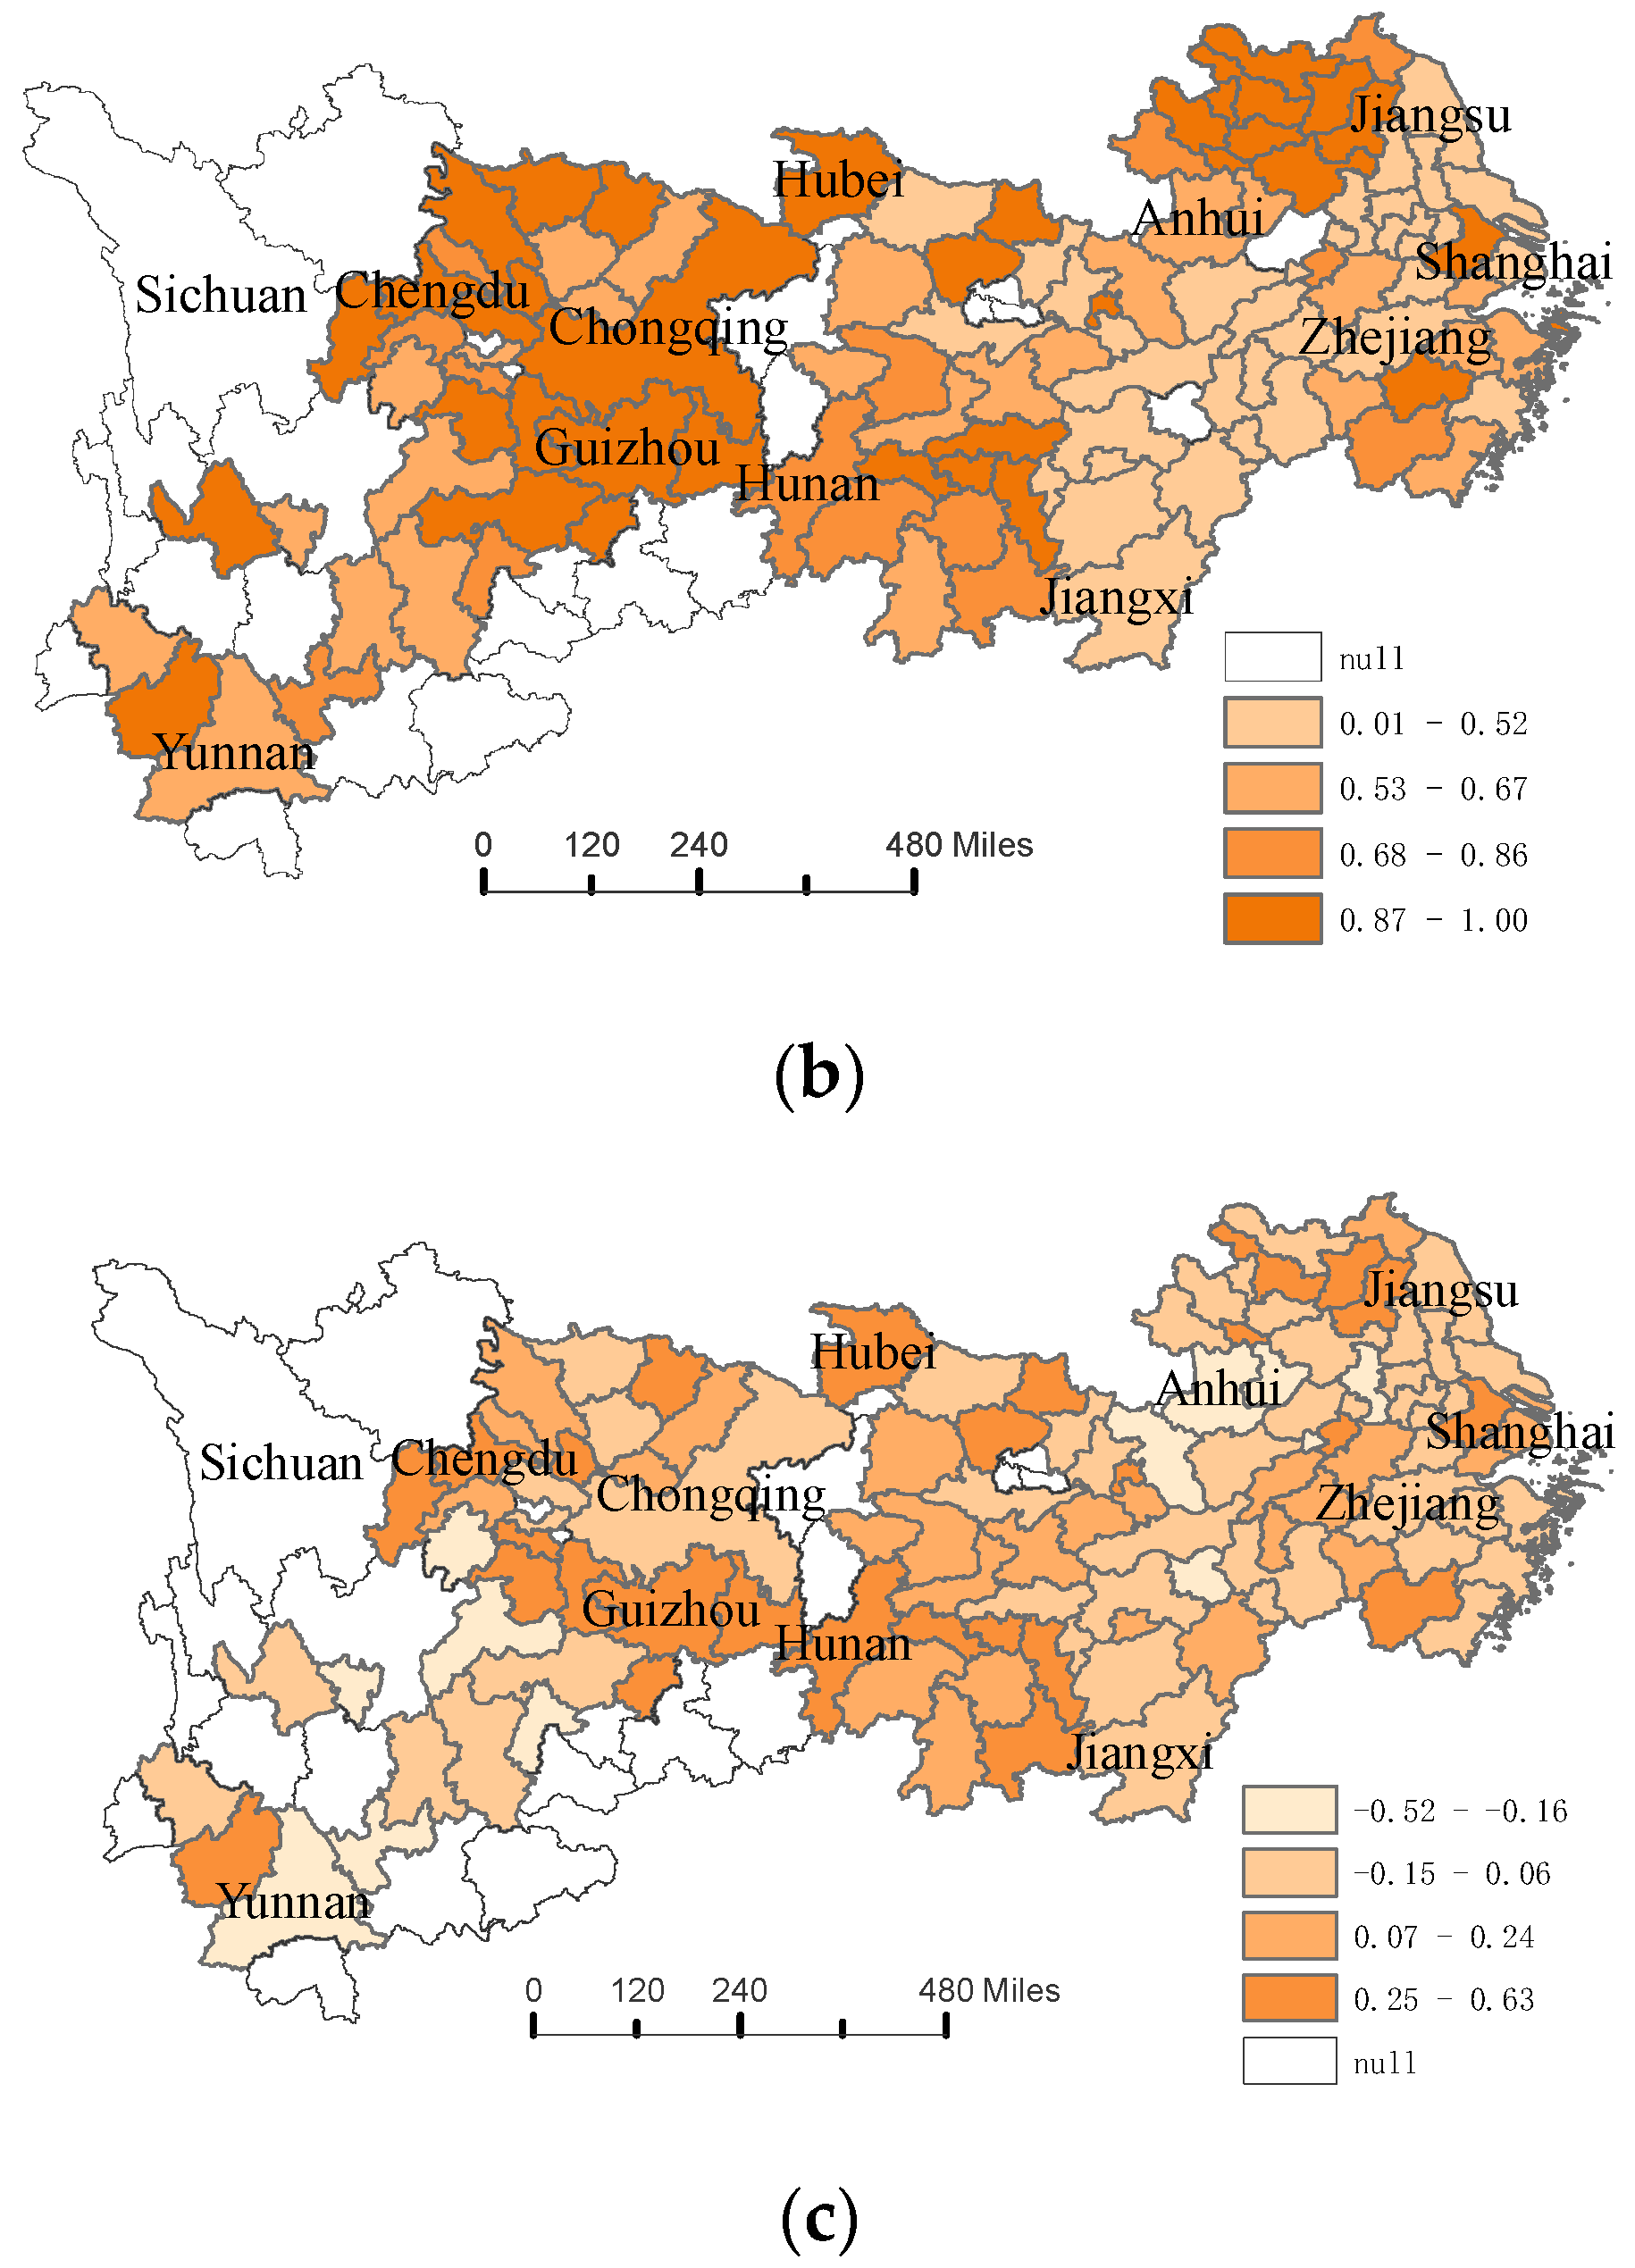
The global Moran’s I index only reflects the spatial autocorrelation characteristics of CLUE from a global perspective. In order to reflect the local spatial differentiation pattern of CLUE in the YREB, we draw the local agglomeration evolution map using the Arc GIS as is shown in Figure 2. In 2001, the area with a high value of CLUE showed the spatial pattern of “multi-core agglomeration”, forming four high-value agglomeration regions. The first polar core regions are clustered in cities like the southern cities of Yunnan. The second is in the northern city of Anhui. The other two are located in southern Sichuan Province and Chongqing. The low values are mainly concentrated in Jiangxi and southern Anhui provinces. The most obvious feature in 2019 is the formation of two relatively large high-value aggregation polar cores, namely around the Chengdu-Chongqing urban agglomeration and in the northern urban areas of the Yangtze River Delta. In addition, a small high-value polar core region has formed in the northern city of the Hunan Province. The low-value areas are mainly in Jiangxi and Guizhou. In general, the spatial agglomeration characteristics of CLUE in the YREB are relatively significant during the sample period, presenting a spatial distribution trend of high or low agglomeration.
From 2001 to 2019, regions with a large increase in CLUE value were mainly located in the middle and upper reaches such as Guizhou, Hunan and Chongqing. The upstream area is the ecological protection barrier of the Yangtze River Basin. The middle reaches are rich in cultivated land and water resource, which is the main grain-producing area of China. Figure 2c shows that under the concept of green ecology, the middle and upper reaches have clearly defined their strategic positioning. The protection of cultivated land has achieved remarkable results, and the utilization efficiency of cultivated land has been significantly improved.

3.3. Spatial Regression

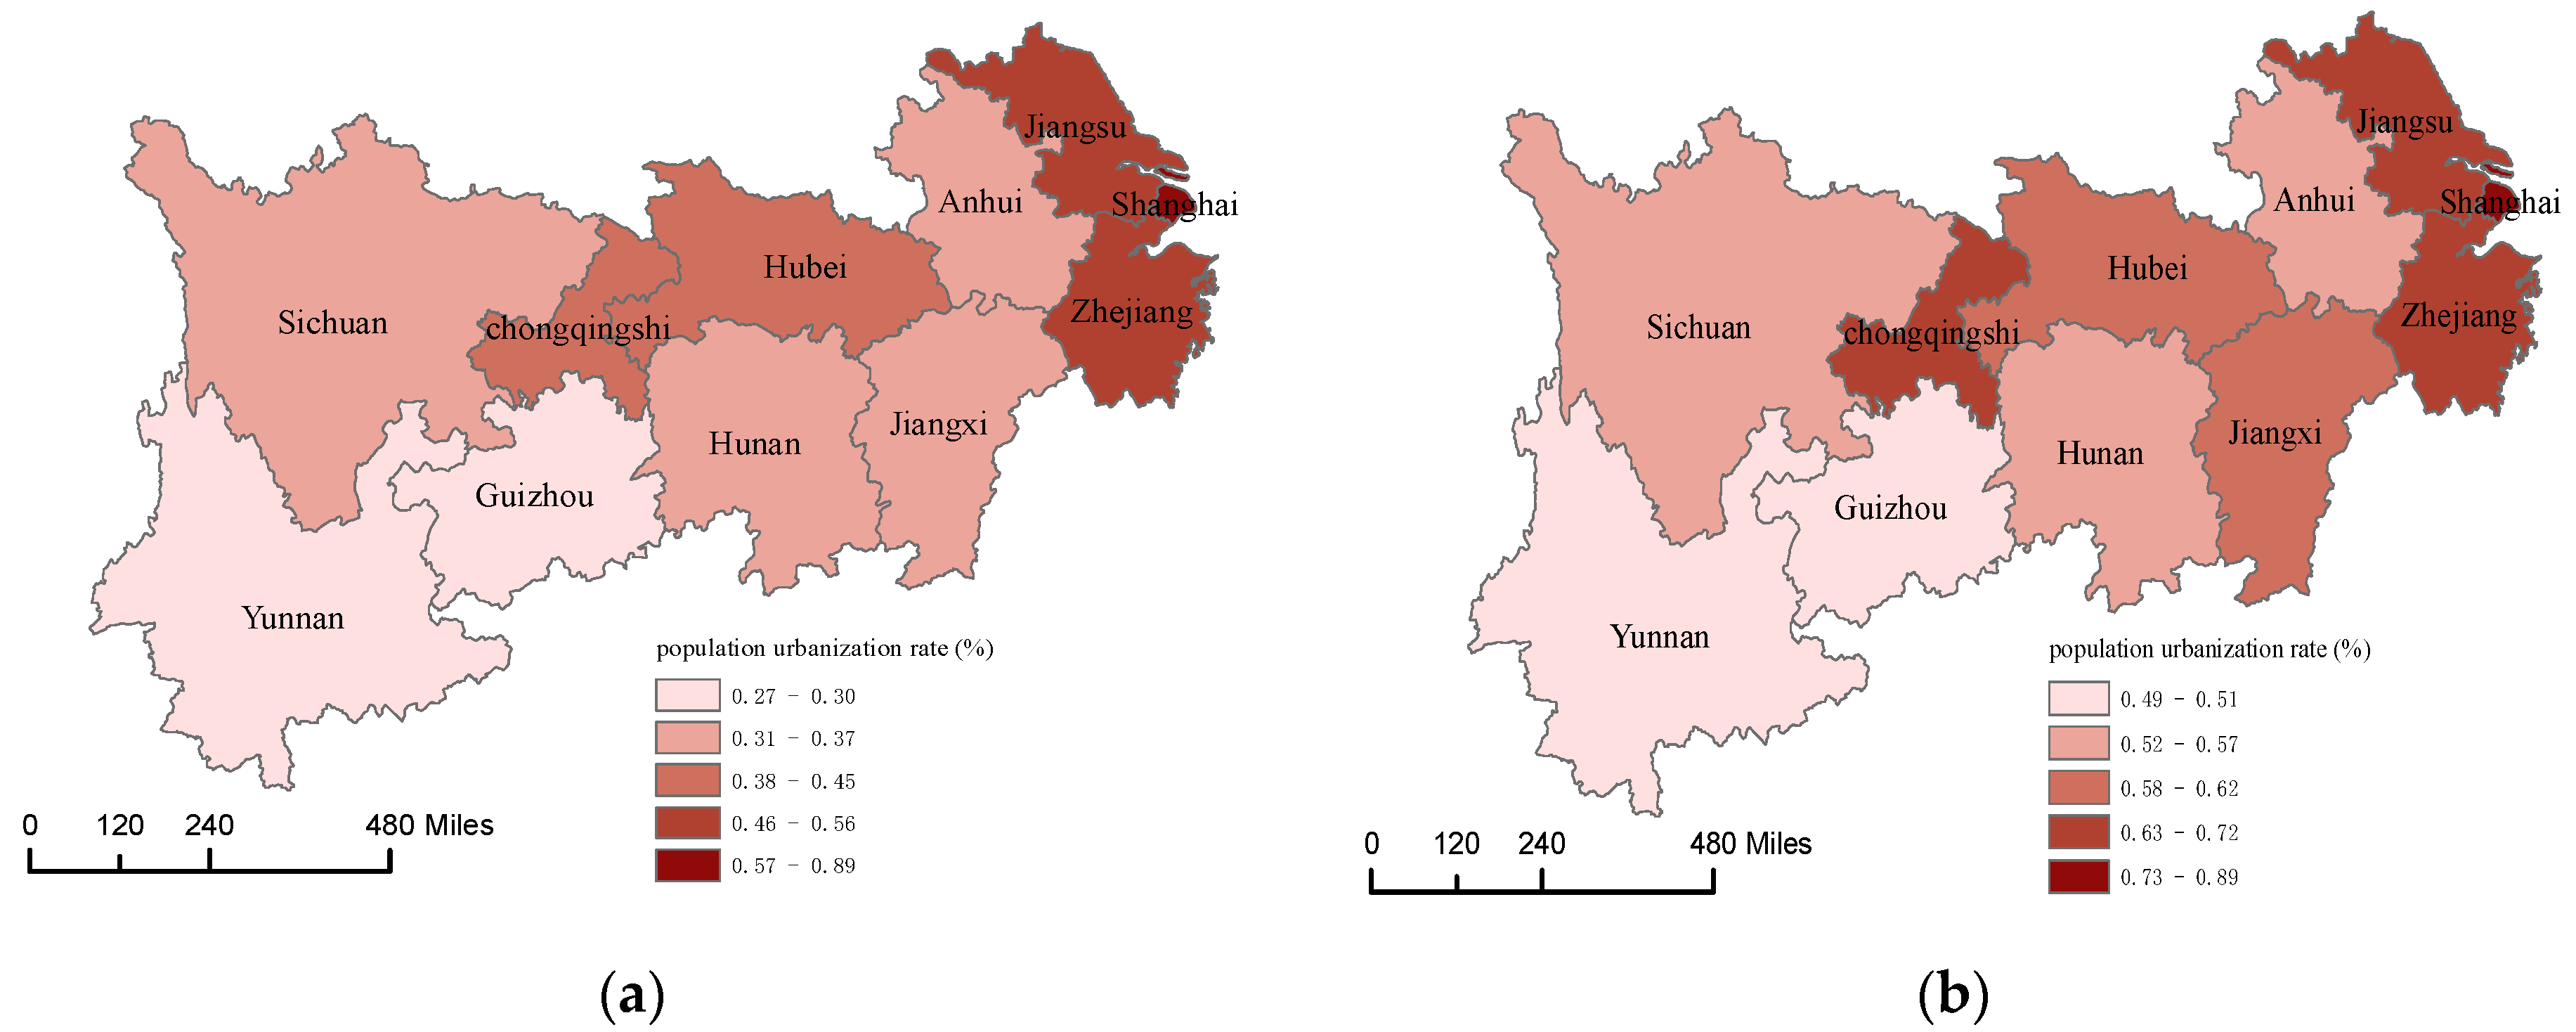
Table 5 reports the spatial econometric estimation results of urbanization on CLUE under geographical weights matrix and the robustness test results. As can be seen, population urbanization is significantly positively correlated with CLUE. For every percent increase in urbanization, the efficiency of cultivated land will increase by 2.99%. That is, population urbanization has significantly promoted the improvement of CLUE in the YREB during the sample period. The YREB is an important growth pole of China’s economic development. As is shown in Figure 3, the urbanization levels of Shanghai, Jiangsu, Zhejiang, Chongqing and Hubei have all exceeded the national average, with Shanghai reaching 88.1%, Jiangsu and Zhejiang reaching over 70%, and Hunan and Jiangxi reaching about 57% by 2019 [48]. Rapid urbanization has led to a mass migration to cities, while the decline of the agricultural labor force has promoted the popularization of agricultural mechanization and the application of science and technology. At the same time, the increase in urban consumption demand also stimulated the large-scale operation of agriculture. Modern agricultural industrial systems, production systems and management systems are increasingly perfect, which is conducive to improving the output efficiency of cultivated land. In addition, large-scale urban infrastructure construction reduces the per capita construction area. With the development of the economy, the awareness of environmental protection is gradually strengthened, and agricultural production conditions can be improved, which is conducive to the improvement of cultivated efficiency.
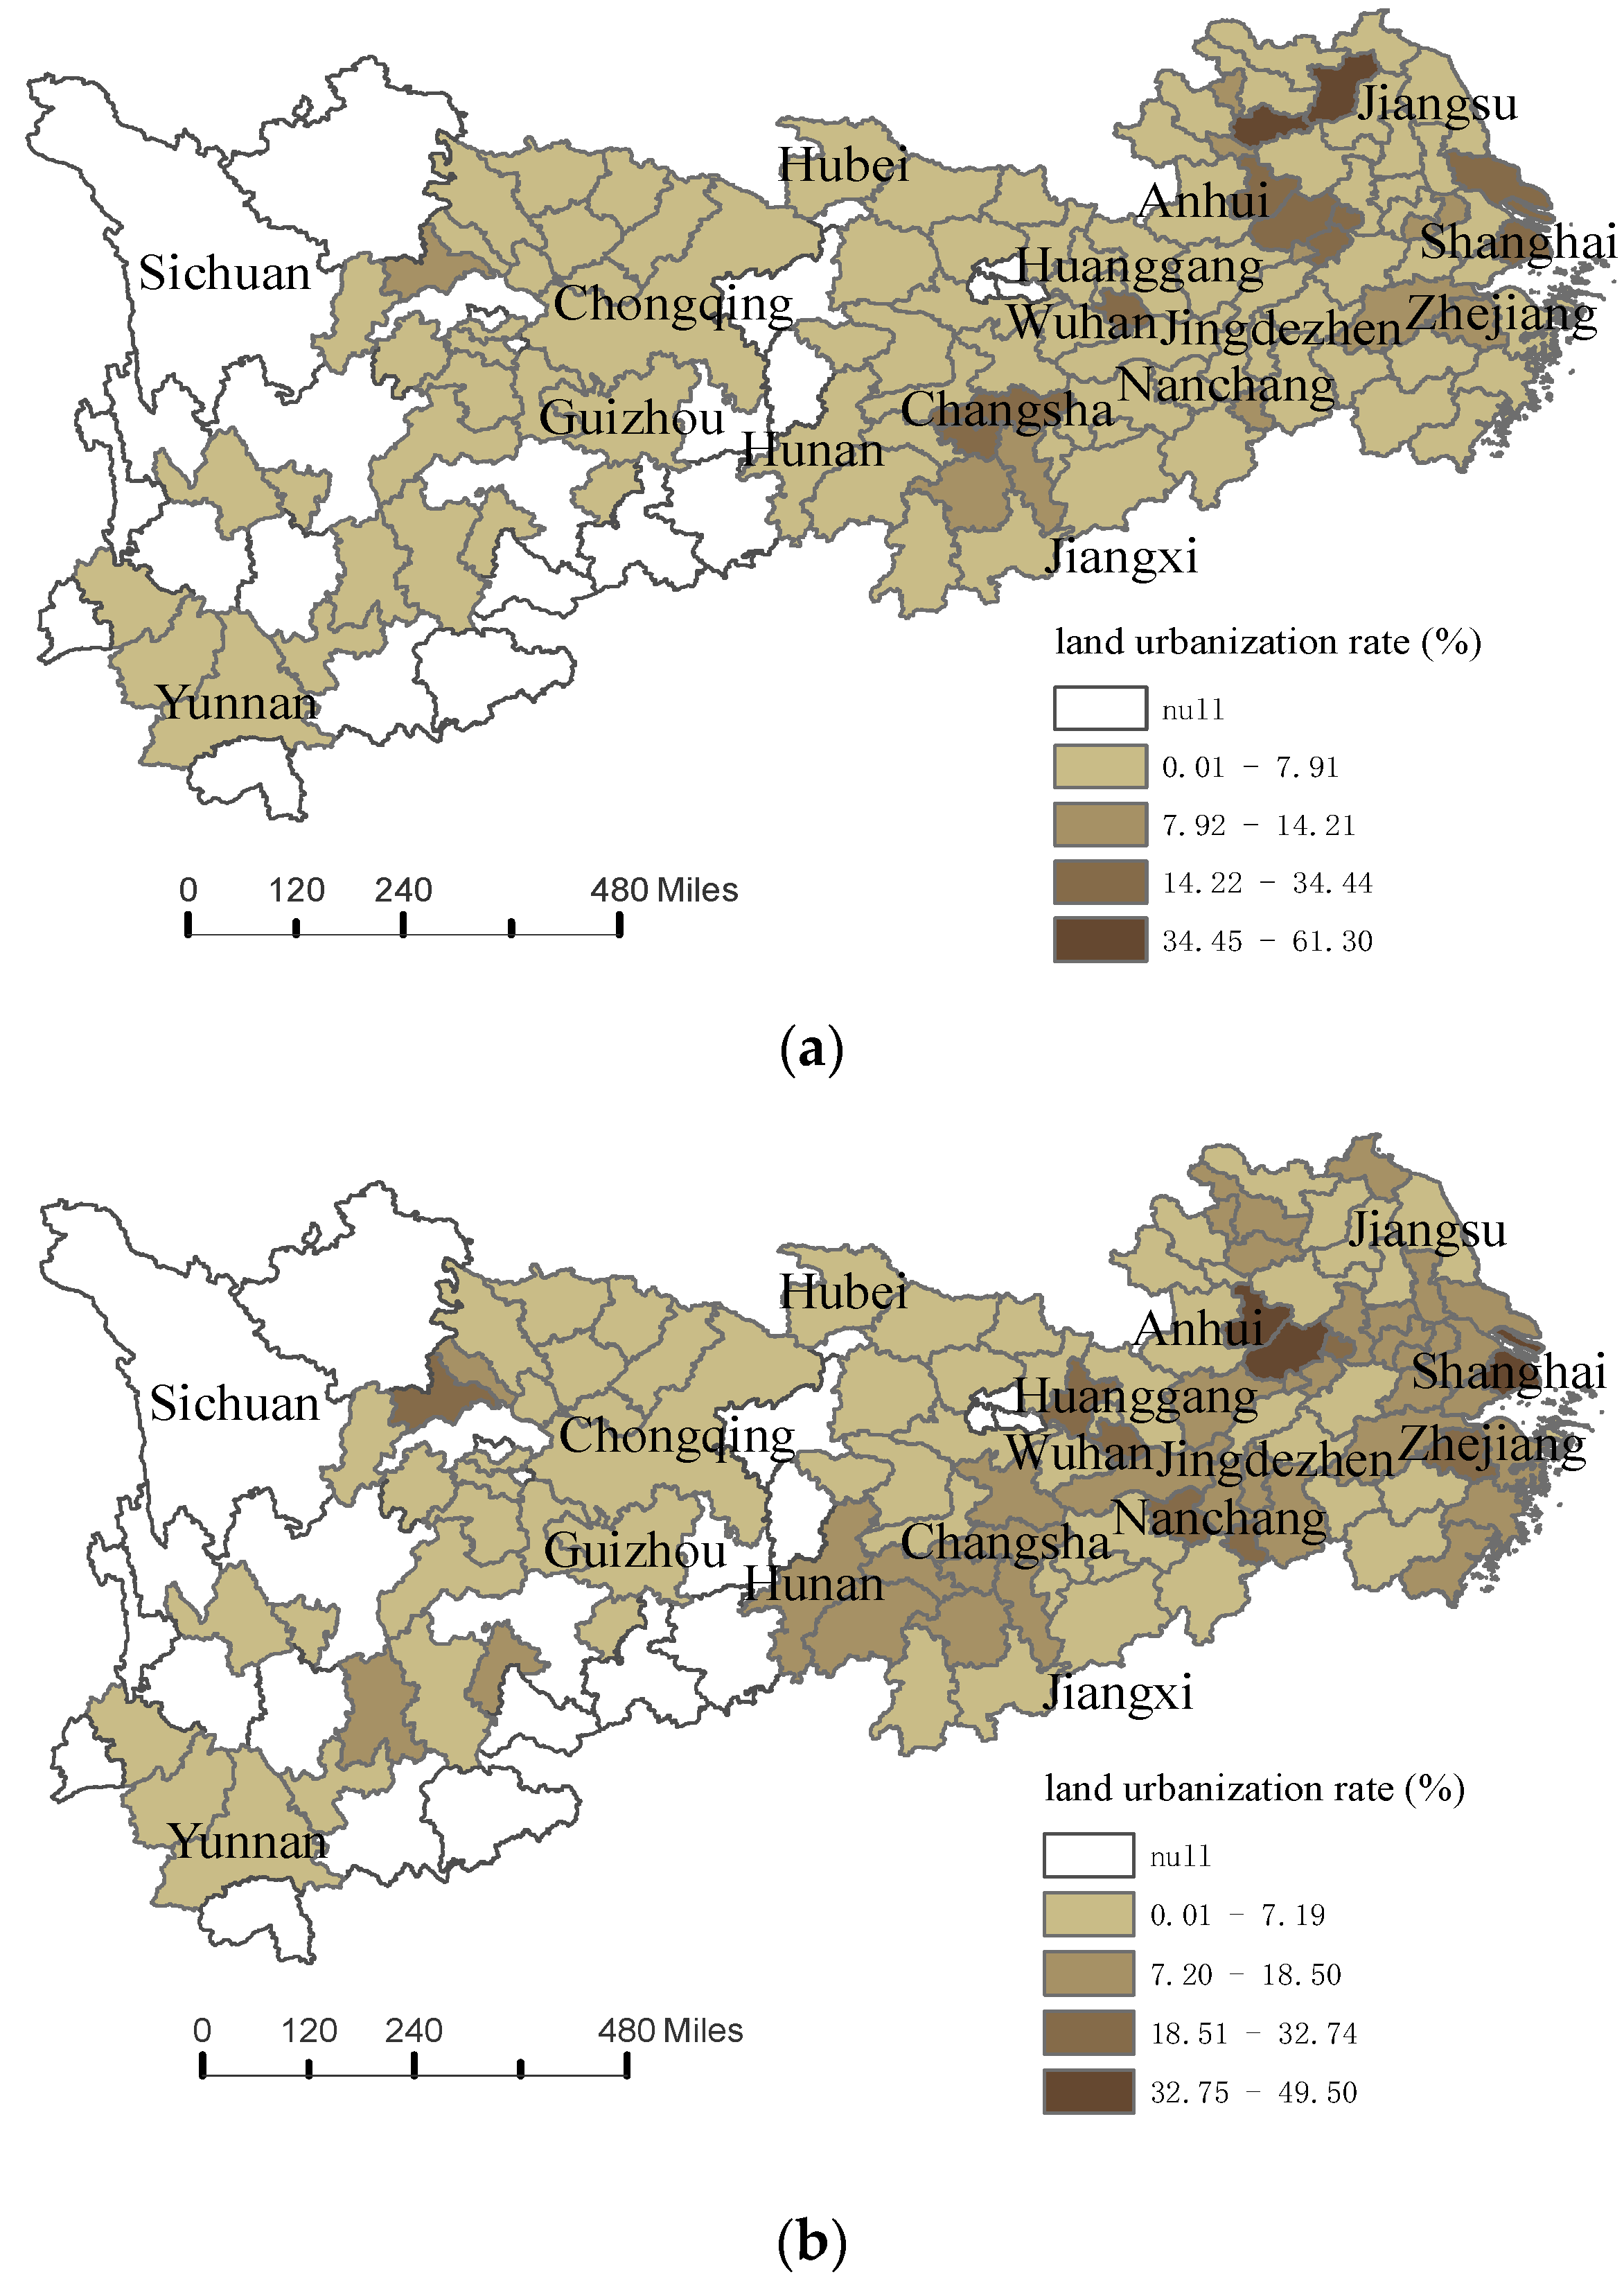
The results show that land urbanization has a negative impact on CLUE regardless of whether control variables are included. It indicates that for each percent increase in the expansion of urban spatial scope in the YREB, CLUE decreases by 0.06%. As is shown in Figure 4, before 2011, the land urbanization rate of megacities and central cities in YREB was at a high level. Many cities in Jiangsu, Zhejiang, Anhui and Hunan provinces saw growth rates above 10% and Shanghai maintained an overall rate of about 47%. Nanchang in Jiangxi Province saw growth rates of 32.74%. After 2011, although the land urbanization rate of large and medium-sized cities slowed down, the rate of non-central cities and small and medium-sized cities has shown rapid growth. For example, Jingdezhen in Jiangxi province and Huanggang in Hubei Province even saw growth rates of 23.26% and 16.3% in 2019. The rapid expansion of urban infrastructure and residential areas directly resulted in the reduction of effective arable land area and the decline of cultivated land quality. Besides, it also has promoted the improvement of fertilizer application intensity in agricultural production, resulting in a negative effect on the CLUE.
To test the robustness, the SEM are recalculated under economic distance weight matrix (W2). It can be known from Table 5 that the main results are basically consistent with the above, which shows that the spatial estimation result is reliable and robust.
As for control variables, economic development in the sample period is conducive to the improvement of CLUE. The industrial structure also shows a positive effect on the efficiency of cultivated land, that is, the increase of the proportion of secondary and tertiary industries in the national economy is conducive to improving the efficiency of cultivated land. The effect of effective irrigation rate and multiple cropping index on CLUE is not obvious in YREB during the sample period. Increasing irrigation rate and multiple cropping index can effectively increase grain yield, but on the other hand, it may be accompanied by the waste of water resources and excessive application of fertilizer. Besides, the quality of cultivated land had been continued to decline due to the overuse of farmland and the overdraft of its productive capacity [49]. Since the measurement of CLUE in this paper comprehensively considers the impact of the ecological environment, effective irrigation rate and multiple cropping index may not have an obvious effect on CLUE.

3.4. Spatial Heterogeneity Analysis

The YREB comprises 11 provinces and cities, straddling eastern and western China, with vastly different economic and geographical conditions. In order to analyze the impact of urbanization on CLUE in different regions of the YREB more specifically, a heterogeneity test has been conducted in this paper. As is mentioned in Section 2.1, the lower reaches of the YREB involves Shanghai, Jiangsu, Zhejiang and Anhui provinces. The middle involves Jiangxi, Hubei and Hunan provinces. The upper involves Chongqing, Sichuan, Guizhou and Yunnan provinces. We adopted SEM to conduct regression tests for the upper, middle and lower reaches. The results are shown in Table 6.
From the perspective of population urbanization, the coefficient of UB1 in the lower reaches is 1.053, significantly positive at the 1% level. This is consistent with the results of the full sample test, that is, the population urbanization level in the lower reaches has a positive impact on the CLUE. The downstream region has the highest degree of population urbanization in the YREB. With the agglomeration of population size, production factors are allocated more efficiently and agricultural labor productivity has improved, which is conducive to the improvement of the CLUE. The UB1 in the middle and upper reaches of the region is not significant, that is, the population urbanization level in the middle and lower has no obvious effect on CLUE. From Figure 3, we can see that a large number of prefecture-level cities in the middle and upper reaches are small in scale and lack the ability to attract an agglomeration population, which is not enough to attract the rural population in the region, contributing to large numbers of population outflow to the downstream areas. Due to the lack of population agglomeration effect, population urbanization in the middle and upper has not exerted a corresponding positive effect on CLUE.
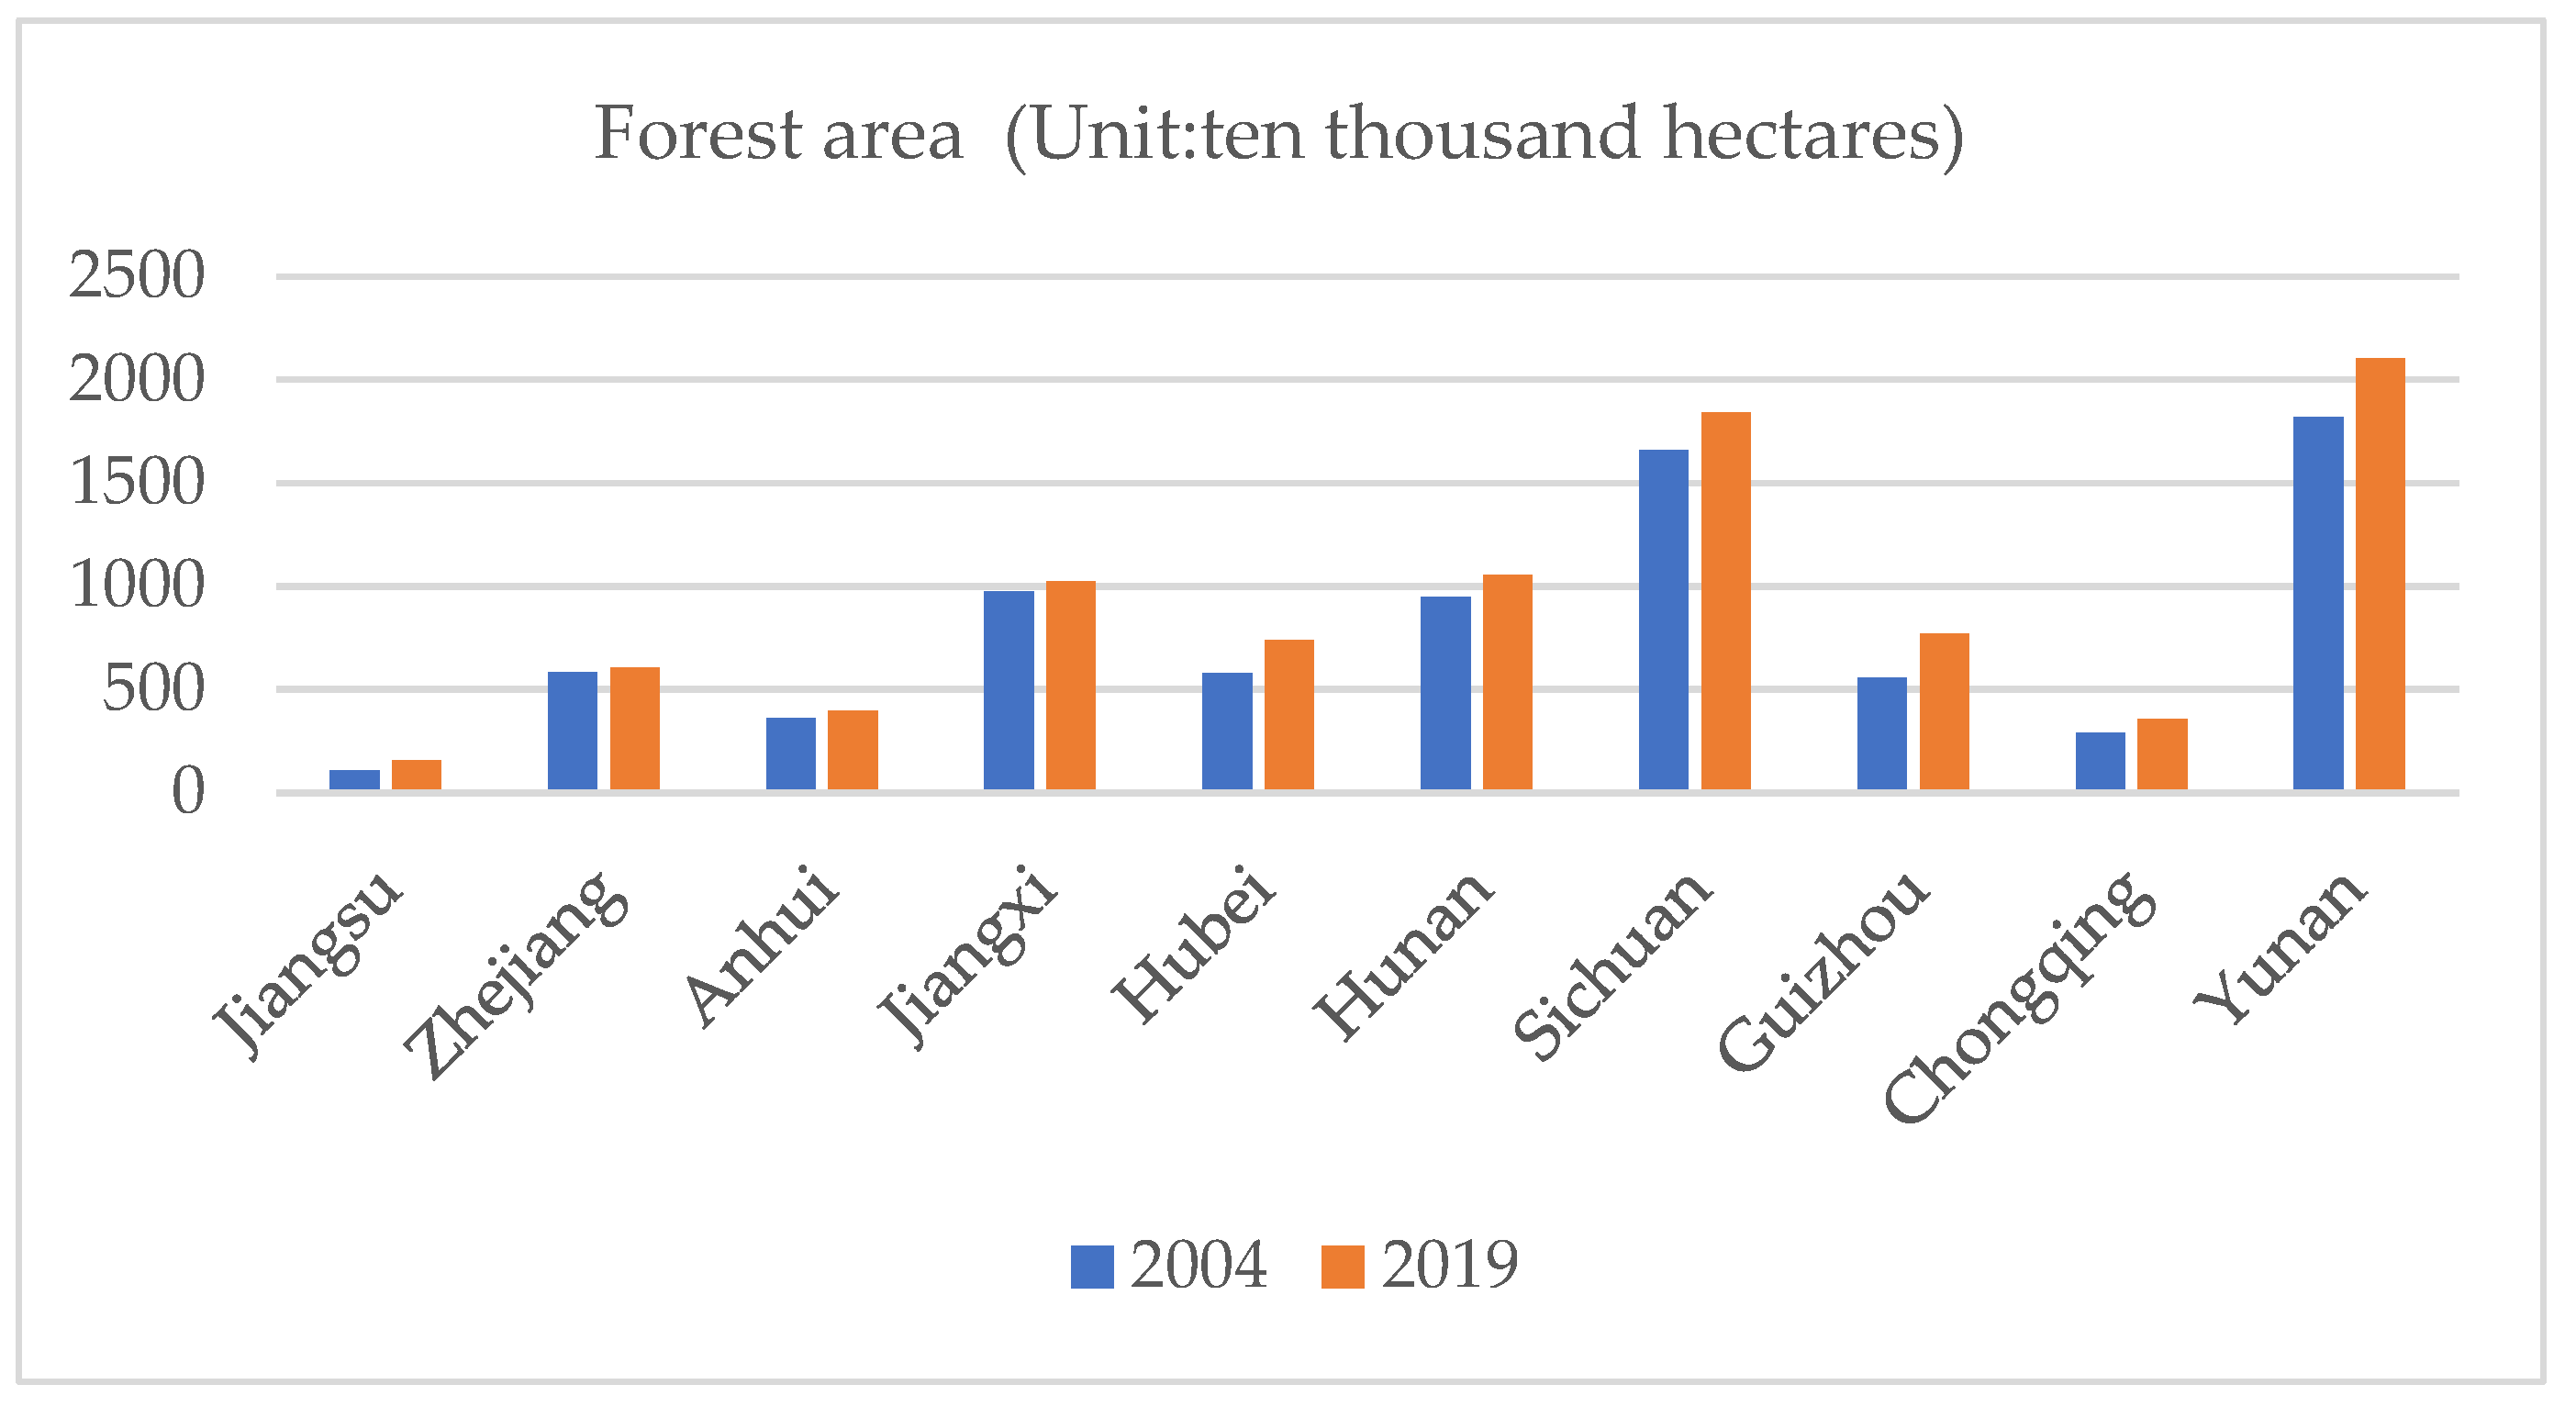
From the perspective of land urbanization, the coefficient of UB2 in the downstream region is 0.35, significantly positive at the 1% level. It indicates that for each percent in land urbanization in the downstream region increases, the CLUE increases by 0.35%. This is inconsistent with the results of the full sample. Compared with the upper and middle reaches, the lower reaches are mostly paddy fields with fertile soil. In addition, a higher level of economic development provides more favorable conditions for ecological agriculture. All these are conducive to improving the efficiency of cultivated land. The coefficient of UB2 in the middle is −0.26, significantly negative at the 5% level. For each percent in land urbanization increases, the CLUE decreases by 0.26%. The middle reaches connect east and west geographically, and the provincial capitals such as Wuhan, Changsha and Nanchang have a high comprehensive level of urbanization. Other urban agglomerations are mainly medium-sized cities, and problems such as the imbalance between population urbanization and land urbanization and the ecological environment are still prominent. Therefore, it presents a negative effect on the efficiency of cultivated land. The UB2 in the upper is not significant, that is, land urbanization has no significant impact on the CLUE. The encroachment intensity of urbanization on cultivated land in the YREB is gradually decreasing from the lower to the upper. The construction of an ecological barrier in the upper reaches of the Yangtze River is an important part of China’s ecological security strategy. As is shown in Figure 5, compared with the middle and lower reaches, the upper reaches are dominated by woodland and grassland. The core of upstream ecological barrier construction is ecological issues rather than economic growth. The focus of the government is to stop unreasonable deforestation, expand afforestation and biodiversity protection. In addition, its cultivated land resources are not as abundant as the middle and upper reaches. Therefore, land urbanization in the upper has no obvious influence on CLUE.

4. Discussion

With the advancement of urbanization in the YREB, the contradiction between urbanization and cultivated land has become increasingly prominent. In the case of limited cultivated land, how to improve the CLUE is an inherent requirement to promote the high-quality development of the YREB. The six provinces in YREB are China’s main grain-producing areas, which play an important role in ensuring national food security. At the same time, the YREB is also the region with the fastest urbanization development in China. Therefore, how to handle the relationship between the two becomes increasingly crucial.
Urbanization is mainly manifested in two dimensions, including population and land. With the large-scale transfer of the rural population, the population in rural areas is hollowing out seriously, contributing to the inevitable change of the traditional farming mode. The expansion of urban space leads to a large number of encroachments on cultivated land. The decentralized management of land makes it difficult to realize the scale effect. Moreover, the damage to soil caused by environmental pollution in the process of land urbanization is difficult to repair in a short term. There is much in the literature on the impact of urbanization on urban land use efficiency, while few studies focus on CLUE, especially empirical studies on city-level norms. Based on data of 108 cities in YREB, the spatial effect model test shows that population urbanization and land urbanization have positive and negative effects on CLUE, respectively, which is consistent with the conclusion of Gao and Wang (2020) [50].
Existing studies on the relationship between urbanization and CLUE in the YREB mainly focus on the whole sample [17,26], and there are few studies on the impact of urbanization on CLUE of different regions. Through the heterogeneity test, this paper specifically analyzes the impact of urbanization in various regions on the utilization efficiency of cultivated land. It is found that population urbanization and land urbanization in the upper, middle and lower reaches have significantly different effects on the efficiency of cultivated land due to the influence of economic development level geographical factors and Ecological orientation. The results of the study are conducive to strengthening inter-provincial coordination in ecological and environmental protection in the YREB and realizing the synergy of the upper, middle and lower reaches in promoting high-quality development.
In terms of indicator selection, there are many measurement methods for urbanization. Future research may take economic urbanization, social urbanization and the comprehensive level of urbanization into consideration. Due to the limitation of data availability, the carbon emissions estimated by the amount of chemical fertilizer used are taken as the unexpected output when SBM is used to calculate the CLUE. This may influence the conclusion to some extent. In addition, this paper has adopted the urban level as the scale of spatial analysis. Smaller scales, such as the county-level units, could be considered in future research.

5. Conclusions

With the advancement of urbanization in the YREB, the contradiction between urbanization and cultivated land has become increasingly prominent. In the case of limited cultivated land, how to improve the CLUE is an inherent requirement to promote the high-quality development of the YREB. The six provinces in YREB are China’s main grain-producing areas, which play an important role in ensuring national food security. At the same time, the YREB is also the region with the fastest urbanization development in China. Therefore, how to handle the relationship between the two becomes increasingly crucial. Existing studies pay more attention to the impact of urbanization on urban land use efficiency, while there are few studies on CLUE, especially empirical studies on city-level norms. Based on the panel data of 108 cities in the YREB from 2001 to 2019, this paper adopts the SEM to investigate the impact of urbanization on CLUE. The main conclusions are as follows:
1. The CLUE of the YREB presents a spatial distribution trend of high or low agglomeration during the sample period. The high-value cluster has changed from a multi-core cluster to a two-core cluster. In 2001, the high-value areas were mainly concentrated in southern Yunnan, northern Anhui, Sichuan and Chongqing. In 2019, the high-value areas were mainly around the Chengdu-Chongqing urban agglomeration and the northern urban agglomeration of the Yangtze River Delta. The low values are mainly concentrated in provinces such as Jiangxi.
2. The spatial effect model test shows that population urbanization has positive effects on CLUE, while land urbanization has negative effects on CLUE. The positive effect of population urbanization is mainly due to the scale effect brought by the population agglomeration caused by the rapid urbanization of the YREB. With the large-scale transfer of the rural population in YREB, the population in rural areas is hollowing out, seriously contributing to the inevitable change of the traditional farming mode. Meanwhile, urbanization provides capital, technology and professional talents for agricultural development, and promotes the expansion and upgrading of agricultural product consumption markets. This is conducive to rural scale management, improving the efficiency of cultivated land use. The negative effect of land urbanization may be due to the decline of cultivated land quality caused by the indiscriminate occupation of cultivated land and the destruction of resources and the environment in the process of land urbanization. The expansion of urban space leads to a large number of encroachments on cultivated land. The decentralized management of land makes it difficult to realize the scale effect. Moreover, the damage to soil caused by environmental pollution in the process of land urbanization is difficult to repair in a short term.
3. Urbanization in different regions of the YREB has different effects on CLUE. For population urbanization, the lower reaches have a positive impact on the CLUE, while the middle and upper reaches have no obvious effect on CLUE. Compared with the middle and upper reaches, the high level of urbanization in the lower reaches of the region has brought scale effects to the efficiency of cultivated land. For land urbanization, the downstream has significantly promoted CLUE. The reason for this may be related to the conversion of a large number of dry land to paddy land. The coefficient of land urbanization in the middle is significantly negative. The region is dominated by medium-sized cities, of which the degree of urbanization coordination needs to be improved. The upper reaches are dominated by woodland and grassland, and the land urbanization rate is relatively slower. Therefore, the upper has no significant impact on the CLUE.
Based on the conclusion, we propose the following policy implications:
1. Improve the quality of the three major urban clusters along the YREB, releasing the huge potential from population urbanization. The YREB is the most rapidly urbanized region in China, but the economic development levels of the nine provinces and two cities are very different. The government should deepen inter-city cooperation in the Yangtze River Delta city cluster, the midstream city cluster and the Chengdu-Chongqing city cluster in terms of ecology, industry and transportation network construction. Define the functional positioning of core cities, taking core cities such as Shanghai, Nanjing, Wuhan, Chongqing and Chengdu as the most important economic growth poles within the belt. Thus, they can play a radiating role in the surrounding urban agglomeration. Yibin City of the Sichuan Province should assume the role of coordinator and promoter of upstream urban agglomeration, strengthening the county’s economy. Counties in the upper reaches of the YREB are developing at a relatively high level, while those in the lower reaches are lagging behind. The government should increase transfer payments and counterpart assistance to these regions, promote the upgrading of urban consumption structure and advocate for the concept of urban green life. This is conducive to promoting green agricultural production and reducing the input intensity and carbon emission intensity of agricultural chemicals.
2. Build an ecologic protective screen in the upper reaches of YREB. Prohibit the exploitation of high-quality cultivated land resources and strictly implement the compensation system for cultivated land. In particular, the middle and upper reaches, as a zone of ecological fragility and ecological barrier construction, must always adhere to the supremacy of ecology. Avoid supplementing high-quality cultivated land with low-quality cultivated land, and pay attention to restoring and improving the quality of cultivated land in the process of implementing the balance between the occupation and compensation of cultivated land. Optimize the tillage layout of paddy and dry land and farm intensively according to geographical conditions and water environment capacity, improving CLUE.
3. Complement the shortcomings of the agricultural labor force with the new agricultural management system. The rapid urbanization of the population in the YREB has prompted a shift from traditional to modern agricultural methods. Cultivating new agricultural management subjects and exploring the diversification of agricultural socialized services can offset the negative effect of rural labor shortage and improve the scale efficiency of land.
4. Detailed regulations related to the cultivated land protection in YREB must be deployed. To date, the standards for soil pollution, pesticide use and agricultural sewage directly related to the YREB are not clear. The 11 provinces and municipalities may continuously complete the formulation of relevant standards under the coordination of the Leading Group for the Development of the Yangtze River Economic Belt and the Coordination Committee for the Green Development of the Yangtze River Economic Belt.

Author Contributions

Conceptualization, J.L. and S.S.; methodology, X.F.; software, J.G.; validation, J.L. and J.G.; formal analysis, Z.W.; investigation, J.G.; resources, J.L; data curation, X.F.; writing—original draft preparation, X.F.; writing—review and editing, J.L.; visualization, J.L.; supervision, S.S. and J.S.; project administration, S.S. and J.S. All authors have read and agreed to the published version of the manuscript.

Funding

This research received no external funding.

Institutional Review Board Statement

Not applicable.

Data Availability Statement

The data presented in this study are available upon request from the corresponding author.

Acknowledgments

This work was supported by the Faculty of Economics and the Centre of Excellence in Econometrics at Chiang Mai University, the China–ASEAN High-Quality Development Research Center and International Exchange and Cooperation Office at Shandong University of Finance and Economics.

Conflicts of Interest

The authors declare no conflict of interest.

References

  1. De Brauw, A.; Huang, J.; Rozelle, S. The sequencing of reform policies in China’s agricultural transition. Econ. Transit. 2004, 12, 427–465. [Google Scholar] [CrossRef]
  2. Rithmire, M.E. Land institutions and Chinese political economy. Polit. Soc. 2017, 45, 123–153. [Google Scholar] [CrossRef]
  3. Zhao, Z.; Bai, Y.; Wang, G.; Chen, J.; Yu, J.; Liu, W. Land eco-efficiency for new-type urbanization in the Beijing-Tianjin-Hebei Region. Technol. Forecast. Soc. Chang. 2018, 137, 19–26. [Google Scholar] [CrossRef]
  4. Duro, J.A.; Lauk, C.; Kastner, T.; Erb, K.H.; Haberl, H. Global inequalities in food consumption, cropland demand and land-use efficiency: A decomposition analysis. Glob. Environ. Chang. 2020, 64, 102124. [Google Scholar] [CrossRef]
  5. Haroon, S.; Mohd, I. Impact of urbanization on land use/land cover of Dudhganga watershed of Kashmir Valley, India. Int. J. Urban Sci. 2012, 16, 321–339. [Google Scholar]
  6. Sumari, S.N.; Cobbinah, P.B.; Ujoh, F.; Xu, G. On the absurdity of rapid urbanization: Spatio-temporal analysis of land-use changes in Morogoro, Tanzania. Cities 2020, 107, 102876. [Google Scholar] [CrossRef]
  7. Deng, X.; Huang, J.; Rozelle, S.; Zhang, J.; Li, Z. Impact of urbanization on cultivated land changes in China. Land Use Policy 2015, 45, 1–7. [Google Scholar] [CrossRef]
  8. Zhu, Z.; Duan, J.; Li, R.; Feng, Y. Spatial evolution, driving mechanism, and patch prediction of grain-producing cultivated land in China. Agriculture 2022, 12, 860. [Google Scholar] [CrossRef]
  9. Lai, Z.; Chen, M.; Liu, T. Changes in and prospects for cultivated land use since the reform and opening up in China. Land Use Policy 2020, 97, 104781. [Google Scholar] [CrossRef]
  10. Zanten, H.H.E.; Mollenhorst, H.; Klootwijk, C.W. Global food supply: Land use efficiency of livestock systems. Int. J. Life Cycle Assess. 2016, 21, 747–758. [Google Scholar] [CrossRef] [Green Version]
  11. Spalding, A.K. Exploring the evolution of land tenure and land use change in Panama: Linking land policy with development outcomes. Land Use Policy 2017, 61, 543–552. [Google Scholar] [CrossRef]
  12. Mertz, O.; Merens, C.F. Land sparing and land sharing policies in developing countries drivers and linkages to scientific debates. World Dev. 2017, 98, 523–535. [Google Scholar] [CrossRef]
  13. Han, H.; Zhang, X. Exploring environmental efficiency and total factor productivity of cultivated land use in China. Sci. Total Environ. 2020, 726, 138434. [Google Scholar] [CrossRef] [PubMed]
  14. Talukdar, S.; Naikoo, M.W.; Mallick, J.; Praveen, B. Coupling geographic information system integrated fuzzy logic-analytical hierarchy process with global and machine learning based sensitivity analysis for agricultural suitability mapping. Agric. Syst. 2022, 196, 103343. [Google Scholar] [CrossRef]
  15. Zhou, X.; Wu, D.; Li, J.; Liang, J. Cultivated land use efficiency and its driving factors in the Yellow River Basin, China. Ecol. Indic. 2022, 144, 109411. [Google Scholar] [CrossRef]
  16. Challenges and Solutions to the High-Quality Development of the Yangtze River Economic Belt. Available online: http://nads.ruc.edu.cn/upfile/file/20191025091346_108605_92177.pdf (accessed on 25 October 2019).
  17. Wu, C.; Wei, Y.D.; Huang, X. Economic transition, spatial development and urban land use efficiency in the Yangtze River Delta, China. Habitat Int. 2017, 63, 67–78. [Google Scholar] [CrossRef]
  18. Kuang, B.; Lu, X.; Zhou, M. Provincial cultivated land use efficiency in China: Empirical analysis based on the SBM-DEA model with Carbon emissions considered. Technol. Forecast.Soc. Chang. 2020, 151, 119874. [Google Scholar] [CrossRef]
  19. Han, H.; Zhang, X. Static and dynamic cultivated land use efficiency in China: A minimum distance to strong efficient frontier approach. J. Clean. Prod. 2020, 246, 119002. [Google Scholar] [CrossRef]
  20. Herzig, A.; Nguyen, T.T.; Ausseil, A.G.E.; Maharjan, G.R.; Dymond, J.R. Assessing resource-use efficiency of land use. Environ. Model. Softw. 2018, 107, 34–49. [Google Scholar] [CrossRef]
  21. Masini, E.; Tomao, A.; Barbati, A. Urban Growth, Land-use Efficiency and Local Socioeconomic Context: A Comparative Analysis of 417 Metropolitan Regions in Europe. Environ. Manag. 2019, 63, 322–337. [Google Scholar] [CrossRef]
  22. Fei, R.; Lin, Z.; Chunga, J. How land transfer affects agricultural land use efficiency: Evidence from China’s agricultural sector. Land Use Policy 2021, 103, 105300. [Google Scholar] [CrossRef]
  23. Guo, S.; Hu, Z.; Ma, H.; Xu, D.; He, R. Spatial and temporal variations in the ecological efficiency and ecosystem service value of agricultural land in China. Agriculture 2022, 12, 803. [Google Scholar] [CrossRef]
  24. Xie, H.; Huang, Y.; Choi, Y.; Shi, J. Evaluating the sustainable intensification of cultivated land use based on emergy analysis. Technol. Forecast.Soc Chang. 2021, 165, 120449. [Google Scholar] [CrossRef]
  25. Lu, X.; Qu, Y.; Sun, P. Green transition of cultivated land use in the Yellow River Basin: A perspective of green utilization efficiency evaluation. Land 2020, 9, 475. [Google Scholar] [CrossRef]
  26. Yang, B.; Wang, Z.; Zou, L.; Zou, L.; Zhang, H. Exploring the eco-efficiency of cultivated land utilization and its influencing factors in China’s Yangtze River Economic Belt, 2001–2018. J. Environ. Manag. 2021, 294, 112939. [Google Scholar] [CrossRef]
  27. Lin, G.C.S.; Ho, S.P.S. China’s land resources and land-use change: Insights from the 1996 land survey. Land Use Policy 2003, 20, 87–107. [Google Scholar] [CrossRef]
  28. Skog, K.L.; Steinnes, M. How Do centrality, population growth and urban sprawl impact farmland conversion in Norway? Land Use Policy 2016, 59, 185–196. [Google Scholar] [CrossRef]
  29. Amour, C.B.; Reitsma, F.; Baiocchi, G.; Barthel, S.; Güneralp, B.; Erb, K.H.; Haberl, H.; Creutzig, F.; Seto, K.C. Future urban land expansion and implications for global croplands. Proc. Nati. Acad. Sci. USA 2017, 114, 8939–8944. [Google Scholar]
  30. Yang, Q.; Gao, Y.; Yang, X.; Zhang, J. Rural transformation driven by households’ adaptation to climate, policy, market, and urbanization: Perspectives from livelihoods–land use on Chinese Loess Plateau. Agriculture 2022, 12, 1111. [Google Scholar] [CrossRef]
  31. Tian, L.; Ge, B.; Li, Y. Impacts of state-led and bottom-up urbanization on land use change in the peri-urban areas of Shanghai: Planned growth or uncontrolled sprawl? Cities 2017, 60, 476–486. [Google Scholar] [CrossRef]
  32. Li, W.; Wang, D.; Liu, S.; Zhu, Y. Measuring urbanization-occupation and internal conversion of peri-urban cultivated land to determine changes in the peri-urban agriculture of the black soil region. Ecol. Indic. 2019, 102, 328–337. [Google Scholar] [CrossRef]
  33. Hou, X.; Liu, J.; Zhang, D.; Zhao, M.; Xia, C. Impact of urbanization on the eco-efficiency of cultivated land utilization: A case study on the Yangtze River Economic Belt, China. J. Clean. Prod. 2019, 238, 117916. [Google Scholar] [CrossRef]
  34. Huang, J.; Zhu, L.; Deng, X.; Rozelle, S. Cultivated land changes in China: The impacts of urbanization and industrialization. In Proceedings of the Remote Sensing and Modeling of Ecosystems for Sustainability II, San Diego, CA, USA, 31 July–4 August 2005; p. 58840I. [Google Scholar]
  35. Li, Y.; Li, Y.; Westlund, H.; Liu, Y. Urban–rural transformation in relation to cultivated land conversion in China: Implications for optimizing land use and balanced regional development. Land Use Policy 2015, 47, 218–224. [Google Scholar]
  36. Koroso, N.H.; Lengoiboni, M.; Zevenbergen, J.A. Urbanization and urban land use efficiency: Evidence from regional and Addis Ababa satellite cities, Ethiopia. Habitat Int. 2021, 117, 102437. [Google Scholar] [CrossRef]
  37. Yang, L.; Han, B.; Ma, Z.; Wang, T.; Lin, Y. Analysis of the urban land use efficiency in the New-Type Urbanization process of China’s Yangtze River Economic Belt. Int. J. Environ. Res. Public Health 2022, 19, 8183. [Google Scholar] [CrossRef]
  38. Koroso, N.H.; Zevenbergen, J.A.; Lengoiboni, M. Urban land use efficiency in Ethiopia: An assessment of urban land use sustainability in Addis Ababa. Land Use Policy 2020, 99, 105081. [Google Scholar] [CrossRef]
  39. Wang, J.; Lin, Y.; Glendinning, A.; Xu, Y. Land-use changes and land policies evolution in China’s urbanization processes. Land Use Policy 2018, 75, 375–387. [Google Scholar] [CrossRef]
  40. Liu, J.; Dong, C.; Liu, S.; Rahman, S.; Sriboonchitta, S. Sources of total-factor productivity and efficiency changes in China’s agriculture. Agriculture 2020, 10, 279. [Google Scholar] [CrossRef]
  41. Zhao, J.; Zhu, D.; Cheng, J.; Jiang, X.; Lun, F.; Zhang, Q. Does regional economic integration promote urban land use efficiency? Evidence from the Yangtze River Delta, China. Habitat Int. 2021, 116, 102404. [Google Scholar] [CrossRef]
  42. Zhang, M.; Sun, X.; Wang, W. Study on the effect of environmental regulations and industrial structure on haze pollution in China from the dual perspective of independence and linkage. J. Clean. Prod. 2020, 256, 120748. [Google Scholar] [CrossRef]
  43. Anselin, L.; Griffith, D.A. Do spatial effecfs really matter in regression analysis? Pap. Reg. Sci. 1988, 65, 11–34. [Google Scholar] [CrossRef]
  44. Charnes, A.; Cooper, W.W.; Rhodes, E. Measuring the efficiency of decision making units. Eur. J. Oper. Res. 1978, 2, 429–444. [Google Scholar] [CrossRef]
  45. Zhu, X.; Zhang, P.; Wei, Y.; Li, Y.; Zhao, H. Measuring the efficiency and driving factors of urban land use based on the DEA method and the PLS-SEM model—A case study of 35 large and medium-sized cities in China. Sustain. Cities Soc. 2019, 50, 101646. [Google Scholar] [CrossRef]
  46. Tone, K. A slacks-based measure of efficiency in data envelopment analysis. Eur. J. Oper. Res. 2001, 130, 498–509. [Google Scholar] [CrossRef] [Green Version]
  47. StataCorp. Stata Statistical Software: Release 15, StataCorp LLC: College Station, TX, USA, 2017.
  48. Statistical Bulletin of the People’s Republic of China on National Economic and Social Development in 2020. Available online: http://www.gov.cn/xinwen/2021-02/28/content_5589283.htm (accessed on 28 February 2021).
  49. Song, G.; Ren, G.F. Spatial response of cultivated land use efficiency to the maize structural adjustment policy in the “Sickle Bend” region of China: An empirical study from the cold area of northeast. Land Use Policy 2022, 123, 106421. [Google Scholar] [CrossRef]
  50. Gao, Y.L.; Wang, Z.G. Does urbanization increase the pressure of cultivated land? Evidence based on interprovincial panel data in China. Chin. Rural. Econ. 2020, 9, 65–85. [Google Scholar]
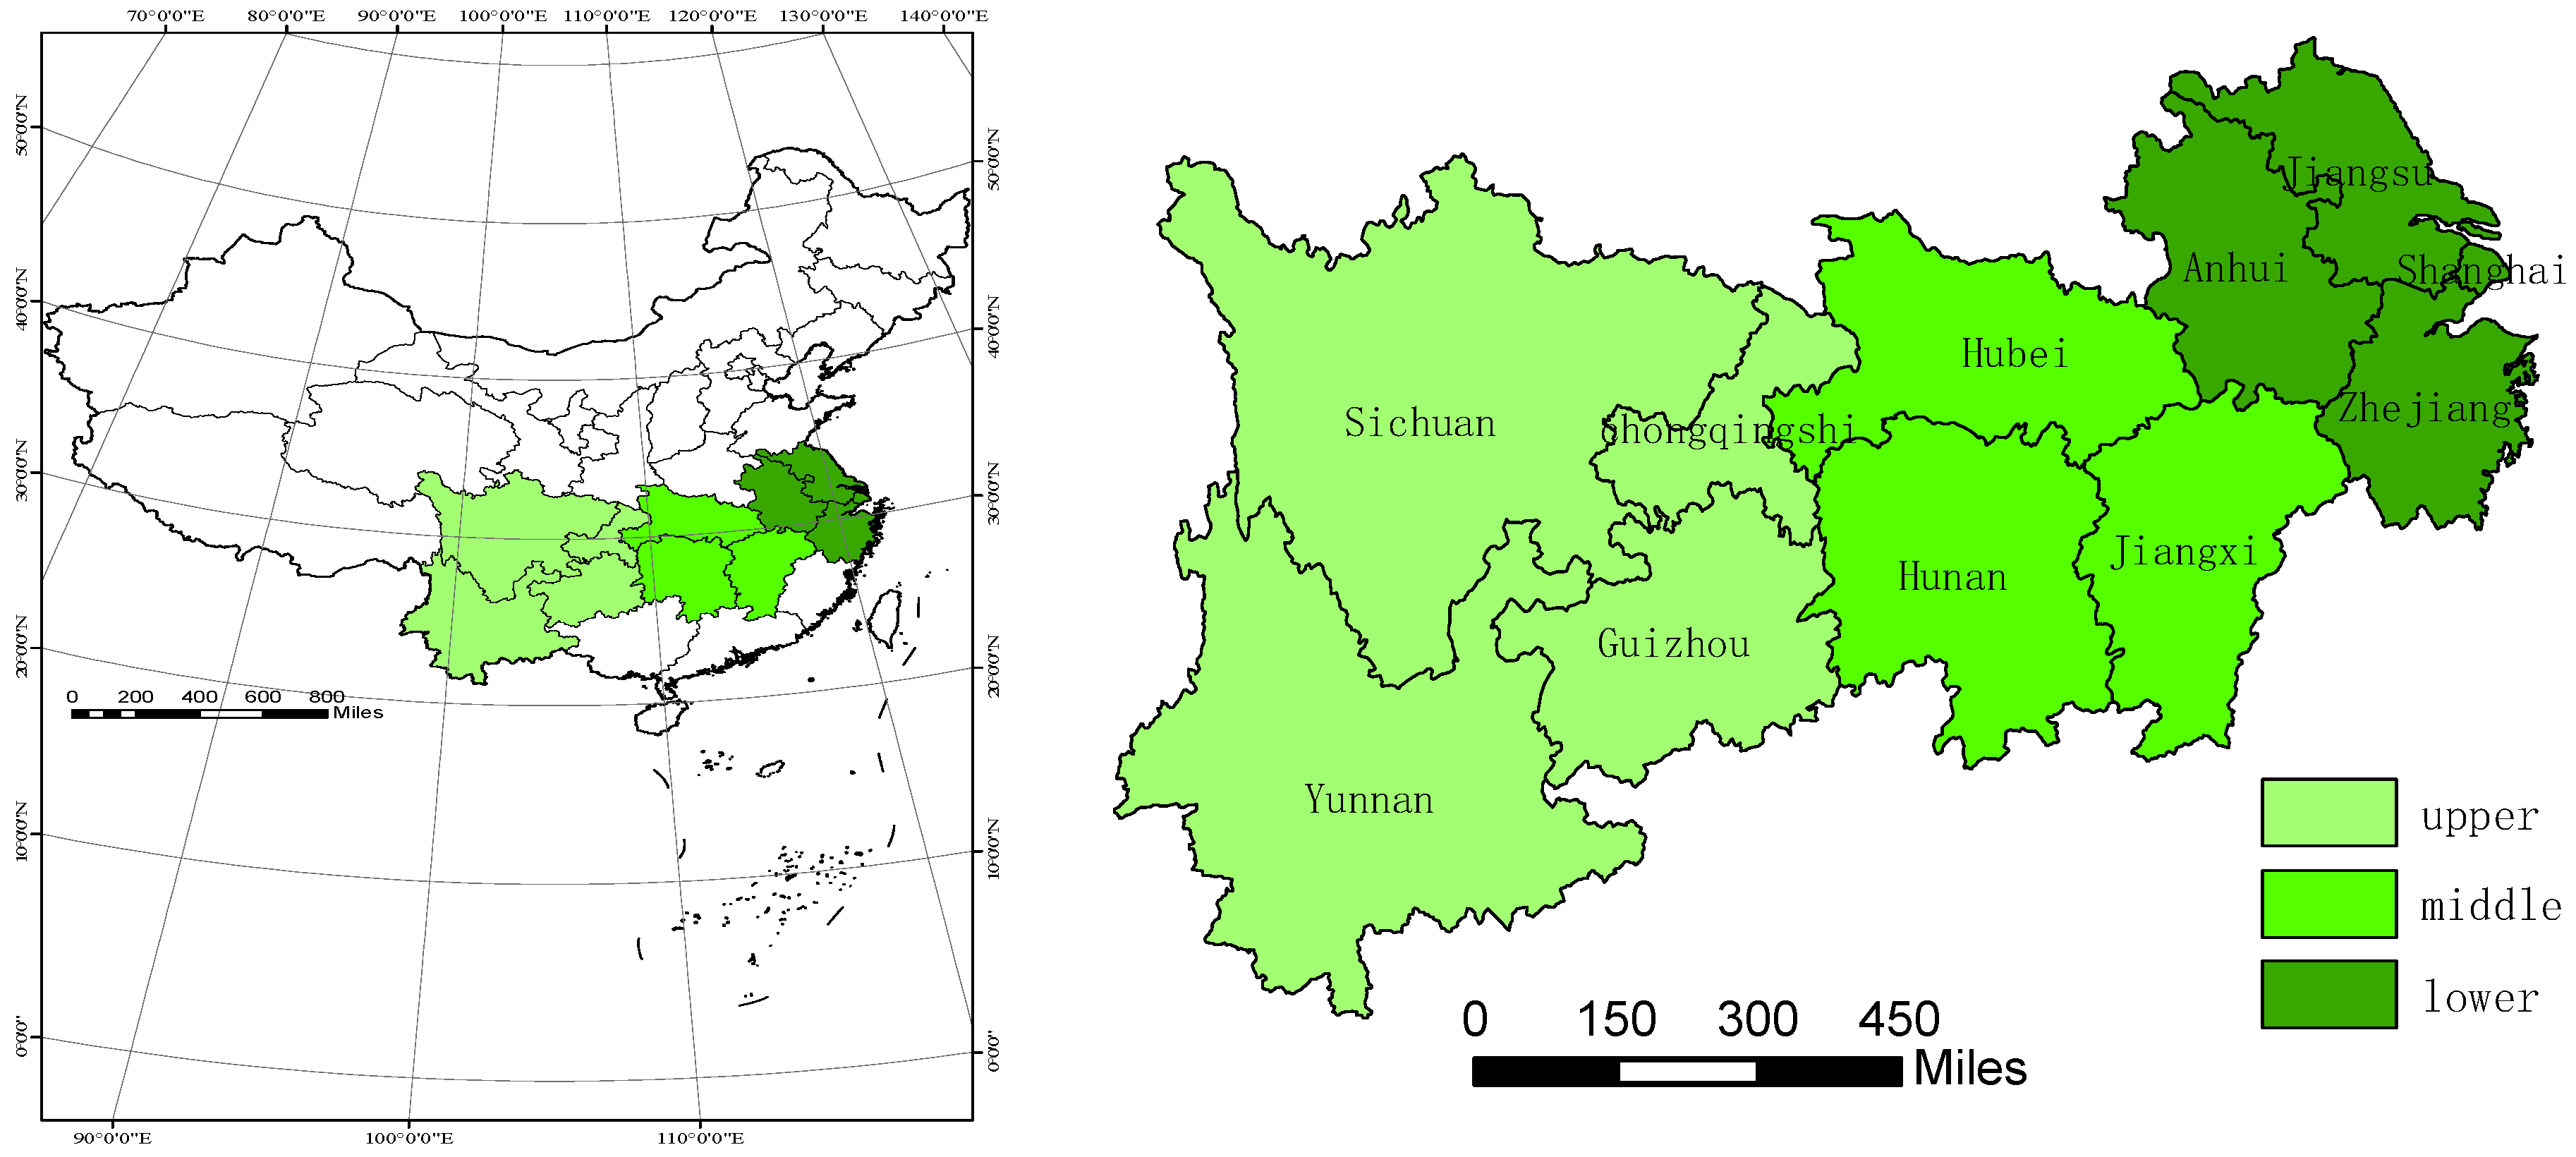
Figure 1. Map of the geographical location of the YREB in China.
Agriculture 13 00666 g001
Figure 2. Distribution maps of CLUE in YREB: (a) CLUE 2001; (b) CLUE 2019; (c) CLUE (changes from 2001 to 2019).
Agriculture 13 00666 g002aAgriculture 13 00666 g002b
Figure 3. Population urbanization of YREB: (a): 2001; (b): 2019.
Agriculture 13 00666 g003
Figure 4. Land urbanization of YREB: (a): 2001; (b): 2011; (c): 2019.
Agriculture 13 00666 g004aAgriculture 13 00666 g004b
Figure 5. The forest area of YREB. Resources: National Bureau of Statistics of China.
Agriculture 13 00666 g005
Table 1. Quantitative evaluation index system for cultivated land use efficiency.
CriteriaIndicator
Input indicatorsLabor forceNumber of workers in the primary industry (Ten thousand)
MechanicaTotal power of farm machinery (Ten thousand kw)
FertilizerFertilizer application rate (Ten thousand tons)
LandAgricultural sown area (Thousand hectares)
Output indicatorsExpect outputTotal grain production (Ten thousand tons)
Gross agricultural output value (Hundred million yuan)
Undesired outputNon-point source pollution
Table 2. Variable selection.
VariableIndicators
Cultivated land use efficiency (CLUE)Measured by SBM-DEA
Population urbanization (UB1)Urban population (million)
Land urbanization (UB2)Proportion of urban construction land in urban area (%)
Economic development(EC)GDP per capital (ten thousand yuan)
Effective irrigation rate (EI)Ratio of irrigated area to cultivated area (%)
Multiple cropping index (MC)Ratio of sown area to cultivated area (%)
Industrial structure (IS)Proportion of added value of secondary and tertiary industries in GDP (%)
Table 3. Spatial models specification results.
MethodsW1W2
LM-lag test 422.075 ***634.346 ***
R-LM-lag test 17.8280.62
LM-err test2249.983 ***1200.408 ***
R-LM-err test1845.69 ***566.608 ***
Note: *** denote statistical significance at the 1% significance levels.
Table 4. Global Moran’s I of CLUE.
VariablesIzp-Value
20010.0332.0910.018
20020.084.3930
20030.0512.9690.001
20040.0814.4580
20050.0332.0840.019
20060.147.3590
20070.0643.5990
20080.0482.8210.002
20090.0613.4490
20100.0955.1310
20110.1326.9150
20120.168.2940
20130.1035.5230
20140.1196.2740
20150.0864.690
20160.0723.9860
20170.0814.4210
20180.0914.9120
20190.1387.2090
Table 5. Spatial econometric estimation results and robustness regression.
(1)(2)(3)(4)
UB1UB1UB2UB2
UB0.1652 **2.99 **−0.0832 **−0.0592 **
(0.1613)(2.4802)(−1.0396)(−0.7477)
EC 0.005 ** 0.0022 **
(−0.1471) (−0.6618)
EI −0.0279 −0.0229
(−0.9778) (−0.8016)
MC −0.0041 −0.0015
(−0.3273) (−0.1158)
IS 0.0086 *** 0.0084 ***
(6.8693) (6.6673)
lambda1.0648 ***1.2628 ***1.0129 ***1.0769 ***
(2.9323)(3.4919)(2.7826)(2.9772)
N2052205220522052
Adjust R20.530.5250.50.533
Robustness regression
UB0.22 **2.29 *−0.11 **−0.09 **
(−0.2096)(1.9068)(−1.3861)(−1.1672)
EC 0.0031 ** 0.0026 **
(−0.3956) (−0.7931)
EI −0.0298 −0.0281
(−1.0357) (−0.9766)
MC −0.0014 0.0004
(−0.1107) (0.0307)
IS 0.0083 *** 0.0082 ***
(6.6031) (6.4661)
lambda0.87 **0.213 ***0.54 **0.226 **
(0.2003)(0.4905)(0.1245)(0.5171)
N2052205220522052
Adjust R20.530.5420.520.540
Note: ***, **, and * denote statistical significance at the 1%, 5%, and 10% significance levels. The t-values are given in the parentheses.
Table 6. Spatial heterogeneity regression.
LowerMiddleUpper
UB1UB2UB1UB2UB1UB2
UB1.053 ***0.35 ***−2.43−0.26 **−2.590.07
(−7.6539)(−4.0771)(−1.5291)−2.0635(−1.2318)−0.1958
lambda2.1726 **2.5082 **2.1458 ***2.0753 ***5.0011 ***5.5245 ***
(2.2149)(2.5131)(4.4508)(4.2686)(3.0023)(3.3430)
N779779684684589589
Adjust R20.51460.6810.5130.350.640.601
Note: *** and ** denote statistical significance at the 1% and 5% significance levels. The t-values are given in the parentheses.
Disclaimer/Publisher’s Note: The statements, opinions and data contained in all publications are solely those of the individual author(s) and contributor(s) and not of MDPI and/or the editor(s). MDPI and/or the editor(s) disclaim responsibility for any injury to people or property resulting from any ideas, methods, instructions or products referred to in the content.