
Changes in the Properties of Hazelnut Shells Due to Conduction Drying


 ,
,  , , ,
, , ,
Abstract
1. Introduction
2. Materials and Methods
3. Results
4. Discussion
5. Conclusions
Author Contributions
Funding
Institutional Review Board Statement
Data Availability Statement
Acknowledgments
Conflicts of Interest
References
- Aydinli, B.; Caglar, A. The comparison of hazelnut shell co-pyrolysis with polyethylene oxide and previous ultra-high molecular weight polyethylene. J. Anal. Appl. Pyrolysis 2010, 87, 263–268. [Google Scholar] [CrossRef]
- Čikić, A.; Zdilar, S.; Mišević, P. The effects of biomass availability and preparation on the sustainability of power plants in croatia. Teh. Vjesn. 2021, 28, 1806–1812. [Google Scholar] [CrossRef]
- European Commission. Sustainable and Optimal Use of Biomass for Energy in the EU beyond 2020 Final Report Pricewaterhousecoopers EU Services EESV’s Consortium to EC Directorate General for Energy Directorate C1-Renewables and CCS Policy; European Commission: Brussels, Belgium, 2017. [Google Scholar]
- Hebda, T.; Brzychczyk, B.; Francik, S.; Pedryc, N. Evaluation of suitability of hazelnut shell energy for production of biofuels. Eng. Rural. Dev. 2018, 17, 1860–1865. [Google Scholar] [CrossRef]
- Rivas, S.; Moure, A.; Parajó, J.C. Pretreatment of hazelnut shells as a key strategy for the solubilization and valorization of hemicelluloses into bioactive compounds. Agronomy 2020, 10, 760. [Google Scholar] [CrossRef]
- Manterola-Barroso, C.; Godoy, K.; Alarcón, D.; Padilla, D.; Meriño-Gergichevich, C. Antioxidants in Shell and Nut Yield Components after Ca, Mg and K Preharvest Spraying on Hazelnut Plantations in Southern Chile. Plants 2022, 11, 3536. [Google Scholar] [CrossRef]
- Hamidi, R.; Toillon, J.; Thomas, M. Underestimated Damage Caused by the European Hazelnut Weevil, Curculio nucum (Curculionidae). Agronomy 2022, 12, 3059. [Google Scholar] [CrossRef]
- Turan, A. Effect of drying on the chemical composition of Çakıldak (cv) hazelnuts during storage. Grasas Aceites 2019, 70, e296. [Google Scholar] [CrossRef]
- Ferrão, A.C.; Guiné, R.P.F.; Ramalhosa, E.; Lopes, A.; Rodrigues, C.; Martins, H.; Gonçalves, R.; Correia, P.M.R. Chemical and physical properties of some hazelnut varieties grown in Portugal. Agronomy 2021, 11, 1476. [Google Scholar] [CrossRef]
- De Souza, L.L.; Moretti, M.L. Chemical control of suckers in hazelnut orchards of western Oregon. Weed Technol. 2020, 34, 863–869. [Google Scholar] [CrossRef]
- Sahin, S.; Tonkaz, T.; Yarilgaç, T. Chemical Composition, Antioxidant Capacity and Total Phenolic Content of Hazelnuts Grown In Different Countries. J. Tekirdag Agric. Fac. 2022, 19, 262–270. [Google Scholar] [CrossRef]
- Sun, J.; Feng, X.; Lyu, C.; Zhou, S.; Liu, Z. Effects of different processing methods on the lipid composition of hazelnut oil: A lipidomics analysis. Food Sci. Hum. Wellness 2022, 11, 427–435. [Google Scholar] [CrossRef]
- Di Michele, A.; Pagano, C.; Allegrini, A.; Blasi, F.; Cossignani, L.; Di Raimo, E.; Faieta, M.; Oliva, E.; Pittia, P.; Primavilla, S.; et al. Hazelnut shells as source of active ingredients: Extracts preparation and characterization. Molecules 2021, 26, 6607. [Google Scholar] [CrossRef] [PubMed]
- Valente, S.; Meloni, G.R.; Prencipe, S.; Spigolon, N.; Somenzi, M.; Fontana, M.; Gullino, M.L.; Spadaro, D. Effect of drying temperatures and exposure times on aspergillus flavus growth and aflatoxin production on artificially inoculated hazelnuts. J. Food Prot. 2020, 83, 1241–1247. [Google Scholar] [CrossRef] [PubMed]
- Kanbur, G.; Arslan, D.; Özcan, M.M. Some compositional and physical characteristics of some Turkish hazelnut (Corylus avellana L.) variety fruits and their corresponding oils. Int. Food Res. J. 2013, 20, 2161–2165. [Google Scholar]
- Delprete, C.; Sesana, R. Mechanical characterization of kernel and shell of hazelnuts: Proposal of an experimental procedure. J. Food Eng. 2014, 124, 28–34. [Google Scholar] [CrossRef]
- Moralar, A.; Çelen, S. Evaluation of Thermal and Drying Characteristics of Dried Hazelnut (Corylus avellana L.) Shell Waste. Philipp. Agric. Sci. 2022, 105, 161–170. [Google Scholar]
- Ercisli, S.; Ozturk, I.; Kara, M.; Kalkan, F.; Seker, H.; Duyar, O.; Erturk, Y. Physical properties of hazelnuts. Int. Agrophys. 2011, 25, 115–121. [Google Scholar]
- Maleki, G.; Milani, J.; Motamedzadegan, A. Some physical properties of azarbayejani hazelnut and its kernel. Int. J. Food Eng. 2013, 9, 135–140. [Google Scholar] [CrossRef]
- Turan, D.; Capanoglu, E.; Altay, F. Investigating the effect of roasting on functional properties of defatted hazelnut flour by response surface methodology (RSM). LWT 2015, 63, 758–765. [Google Scholar] [CrossRef]
- Sarkar, T.; Salauddin, M.; Choudhury, T.; Um, J.S.; Pati, S.; Hazra, S.K.; Chakraborty, R. Spatial optimisation of mango leather production and colour estimation through conventional and novel digital image analysis technique. Spat. Inf. Res. 2021, 29, 439–453. [Google Scholar] [CrossRef]
- HRN EN 15148:2009; Solid Biofuels—Determination of the Content of Volatile Matter. Croatian Standard Institute: Zagreb, Croatia, 2009.
- Vario. Macro CHNS Analyzer; Elementar Analysensysteme GmbH: Langenselbold, Germany, 2022. [Google Scholar]
- HRN EN ISO 16948:2015; Solid Biofuels—Determination of Total Content of Carbon, Hydrogen and Nitrogen. Croatian Standard Institute: Zagreb, Croatia, 2015.
- IKA C200 Adiabatic Calorimeter; IKA Analysentechnik GmbH: Staufen im Breisgau, Germany, 2022.
- HRN EN 14918:2010; Solid Biofuels—Determination of Calorific Value. Croatian Standard Institute: Zagreb, Croatia, 2010.
- TIBCO Statistica, version 13.3.0; TIBCO Software Inc.: Palo Alto, CA, USA, 2017; Available online: https://www.tibco.com/products/tibco-statistica (accessed on 7 February 2023).
- Van Rossum, G.; Drake, F.L. Python 3 Reference Manual; CreateSpace: Scotts Valley, CA, USA, 2009. [Google Scholar]
- McKinney, W. Data structures for statistical computing in python. In Proceedings of the 9th Python in Science Conference, Austin, TX, USA, 28 June–3 July 2010; Volume 445, pp. 51–56. [Google Scholar]
- Harris, C.R.; Millman, K.J.; Van Der Walt, S.J.; Gommers, R.; Virtanen, P.; Cournapeau, D.; Wieser, E.; Taylor, J.; Berg, S.; Smith, N.J.; et al. Array programming with NumPy. Nature 2020, 585, 357–362. [Google Scholar] [CrossRef] [PubMed]
- Hunter, J.D. Matplotlib: A 2D Graphics Environment. Comput. Sci. Eng. 2007, 9, 90–95. [Google Scholar] [CrossRef]
- Pedregosa, F.; Varoquaux, G.; Gramfort, A.; Michel, V.; Thirion, B.; Grisel, O.; Blondel, M.; Prettenhofer, P.; Weiss, R.; Dubourg, V. Scikit-learn: Machine learning in Python. J. Mach. Learn. Res. 2011, 12, 2825–2830. [Google Scholar]
- Bohnhoff, D.R.; Lawson, K.S.; Fischbach, J.A. Physical Properties of Upper Midwest U.S.-Grown Hybrid Hazelnuts. Trans. Am. Soc. Agric. Biol. Eng. 2019, 62, 1084–1102. [Google Scholar] [CrossRef]
- Smith, J.D.; Alembath, A.; Al-Rubaye, H.; Yu, J.; Gao, X.; Golpour, H. Validation and Application of a Kinetic Model for Downdraft Biomass Gasification Simulation. Chem. Eng. Technol. 2019, 42, 2505–2519. [Google Scholar] [CrossRef]
- Marcantonio, V.; Bocci, E.; Monarca, D. Development of a chemical quasi-equilibrium model of biomass waste gasification in a fluidized-bed reactor by using Aspen plus. Energies 2019, 13, 53. [Google Scholar] [CrossRef]
- Madan, A.; Pare, A.; Gowda, N.A.N. Mathematical modelling of thin-layer drying process of bamboo (Bambusa bambos) shoots at varying temperature. Res. Rev. J. Bot. 2014, 3, 1–9. [Google Scholar]
- Djaeni, M.; Aishah, N.A.; Nissaulfasha, H.; Buchori, L. Corn Drying with Zeolite in The Fluidized Bed Dryer under Medium Temperature. IPTEK J. Technol. Sci. 2013, 24, 1–6. [Google Scholar] [CrossRef]
- Ghavidelan, M.A.; Chayjan, R.A. Modeling engineering characteristics of hazelnut kernel during infrared fluidized bed drying. J. Food Meas. Charact. 2017, 11, 460–478. [Google Scholar] [CrossRef]
- Múnera-Tangarife, R.D.; Solarte-Rodríguez, E.; Vélez-Pasos, C.; Ochoa-Martínez, C.I. Factors affecting the time and process of cmc drying using refractance window or conductive hydro-drying. Gels 2021, 7, 257. [Google Scholar] [CrossRef]
- Parhizi, Z.; Karami, H.; Golpour, I.; Kaveh, M.; Szymanek, M.; Blanco-Marigorta, A.M.; Marcos, J.D.; Khalife, E.; Skowron, S.; Adnan Othman, N.; et al. Modeling and Optimization of Energy and Exergy Parameters of a Hybrid-Solar Dryer for Basil Leaf Drying Using RSM. Sustainability 2022, 14, 8839. [Google Scholar] [CrossRef]
- Taghinezhad, E.; Kaveh, M.; Szumny, A. Optimization and prediction of the drying and quality of turnip slices by convective-infrared dryer under various pretreatments by rsm and anfis methods. Foods 2021, 10, 284. [Google Scholar] [CrossRef] [PubMed]


| Sample | Len. (mm) | Wid. (mm) | Thick. (mm) | Den. (g/cm3) | Vol. (cm3) | FM (g) | KM (g) | SM (g) |
|---|---|---|---|---|---|---|---|---|
| Istarski duguljasti | 25.93 ± 1.24 b | 19.93 ± 0.88 a | 16.36 ± 1.28 a | 1.05 ± 0.09 a | 0.96 ± 0.08 b | 3.85 ± 0.44 a | 1.78 ± 0.21 a | 2.07 ± 0.31 a |
| Rimski okrugli | 21.41 ± 1.8 a | 22.79 ± 1.2 b | 15.92 ± 1.05 a | 1.3 ± 0.21 b | 0.8 ± 0.16 a | 3.85 ± 0.45 a | 1.75 ± 0.27 a | 2.1 ± 0.33 a |
| Statistical significance | * | * | n.s. | * | * | n.s. | n.s. | n.s. |
| Sample | Moisture (%) | DM (%) | Ash (%) | Coke (%) | FC (%) | VM (%) | N (%) | C (%) | S (%) | O (%) | H (%) | HHV (MJ kg−1) |
|---|---|---|---|---|---|---|---|---|---|---|---|---|
| Istarski duguljasti | 17.14 ± 0.09 a | 82.86 ± 0.09 a | 0.99 ± 0.14 a | 22.58 ± 0.86 a | 17.73 ± 0.82 a | 64.14 ± 0.69 a | 0.31 ± 0.08 a | 57.6 ± 2.68 a | 0.1 ± 0.01 a | 34.7 ± 3.25 a | 7.29 ± 0.51 b | 20.72 ± 0.21 a |
| Rimski okrugli | 17.41 ± 1.19 a | 82.59 ± 1.19 a | 1.12 ± 0.13 a | 23.22 ± 0.4 a | 18.06 ± 0.38 a | 63.41 ± 0.88 a | 0.25 ± 0.09 a | 57.95 ± 3.15 a | 0.21 ± 0.14 a | 34.94 ± 3.07 a | 6.65 ± 0.16 a | 21.12 ± 0.76 a |
| Statistical significance | n.s. | n.s. | n.s. | n.s. | n.s. | n.s. | n.s. | n.s. | n.s. | n.s. | ** | n.s. |
| Sample | Temp. (°C) | Time (min) | Len. (mm) | Wid. (mm) | Thick. (mm) | Den. (g/cm3) | Vol. (cm3) | FM (g) | KM (g) | SM (g) |
|---|---|---|---|---|---|---|---|---|---|---|
| Istarski duguljasti | 100 | 15 | 25.31 ± 1.16 bcde | 19.79 ± 0.46 abcde | 15.56 ± 1.21 a | 2.09 ± 0.12 abcdefg | 0.48 ± 0.03 a | 4.23 ± 0.06 a | 1.91 ± 0.1 a | 2.32 ± 0.11 ab |
| 30 | 26.97 ± 0.68 e | 19.1 ± 1.6 abcde | 14.34 ± 1 a | 2.7 ± 0.21 efghijk | 0.37 ± 0.03 a | 3.95 ± 0.5 a | 1.87 ± 0.31 a | 2.07 ± 0.21 ab | ||
| 45 | 24.62 ± 0.33 abcde | 18.99 ± 0.21 abcde | 14.17 ± 1.48 a | 3.12 ± 0.24 jk | 0.32 ± 0.03 a | 4.18 ± 0.74 a | 1.99 ± 0.24 a | 2.19 ± 0.51 ab | ||
| 60 | 24.81 ± 1.18 abcde | 19.22 ± 0.83 abcde | 15.25 ± 1.31 a | 1.65 ± 0.54 a | 1.65 ± 0.54 b | 3.44 ± 0.29 a | 1.59 ± 0.15 a | 1.85 ± 0.15 ab | ||
| 120 | 15 | 25.26 ± 1.3 bcde | 18.83 ± 1.11 abcde | 14.45 ± 0.9 a | 2.02 ± 0.11 abcdef | 0.5 ± 0.03 a | 4.43 ± 0.22 a | 1.83 ± 0.21 a | 2.6 ± 0.01 b | |
| 30 | 24.35 ± 1.45 abcde | 18.08 ± 1.18 ab | 13.24 ± 0.33 a | 1.78 ± 0.14 ab | 0.57 ± 0.04 a | 3.92 ± 0.22 a | 1.85 ± 0.1 a | 2.07 ± 0.21 ab | ||
| 45 | 26.23 ± 2.86 cde | 19.04 ± 1.33 abcde | 15.48 ± 1.61 a | 1.82 ± 0.32 abc | 0.56 ± 0.11 a | 4.37 ± 0.34 a | 1.91 ± 0.17 a | 2.46 ± 0.19 ab | ||
| 60 | 26.01 ± 1.09 bcde | 19.14 ± 0.78 abcde | 15.95 ± 0.81 a | 3.31 ± 0.23 k | 0.3 ± 0.02 a | 3 ± 0.21 a | 1.43 ± 0.24 a | 1.57 ± 0.03 a | ||
| 140 | 15 | 25.62 ± 1.62 bcde | 18.82 ± 0.52 abcde | 15.66 ± 0.88 a | 2.31 ± 0.23 abcdefghi | 0.44 ± 0.04 a | 4.02 ± 0.21 a | 1.9 ± 0.06 a | 2.12 ± 0.16 ab | |
| 30 | 24.81 ± 0.43 abcde | 17.87 ± 0.52 a | 14.46 ± 1.39 a | 2 ± 0.34 abcde | 0.51 ± 0.1 a | 3.79 ± 0.22 a | 1.79 ± 0.11 a | 2 ± 0.13 ab | ||
| 45 | 26.7 ± 1.05 de | 18.57 ± 0.44 abcd | 14.89 ± 0.07 a | 2.54 ± 0.22 cdefghij | 0.4 ± 0.04 a | 3.57 ± 0.56 a | 1.51 ± 0.37 a | 2.06 ± 0.27 ab | ||
| 60 | 25.64 ± 1.72 bcde | 18.76 ± 0.49 abcde | 15.38 ± 0.74 a | 2.4 ± 0.17 bcdefghij | 0.42 ± 0.03 a | 4.06 ± 0.74 a | 1.88 ± 0.32 a | 2.19 ± 0.42 ab | ||
| 160 | 15 | 25.11 ± 0.7 bcde | 18.18 ± 0.68 abc | 13.9 ± 0.61 a | 2.17 ± 0.09 abcdefg | 0.46 ± 0.02 a | 3.74 ± 0.36 a | 1.69 ± 0.14 a | 2.06 ± 0.29 ab | |
| 30 | 25.78 ± 1.46 bcde | 18.49 ± 1.05 abcd | 13.88 ± 1.07 a | 2.58 ± 0.24 defghijk | 0.39 ± 0.04 a | 3.57 ± 0.09 a | 1.62 ± 0.06 a | 1.95 ± 0.03 ab | ||
| 45 | 24.28 ± 0.87 abcde | 18.43 ± 0.54 abcd | 15.63 ± 0.72 a | 2.27 ± 0.14 abcdefghi | 0.44 ± 0.03 a | 3.65 ± 0.28 a | 1.83 ± 0.13 a | 1.82 ± 0.19 ab | ||
| 60 | 23.35 ± 0.52 abcde | 18.17 ± 0.66 abc | 15.45 ± 0.23 a | 2.75 ± 0.2 ghijk | 0.36 ± 0.03 a | 4.01 ± 0.27 a | 1.76 ± 0.25 a | 2.25 ± 0.17 ab | ||
| Rimski okrugli | 100 | 15 | 21.83 ± 2.22 abcde | 21.89 ± 1.87 bcde | 16.01 ± 3.48 a | 2.24 ± 0.05 abcdefgh | 0.45 ± 0.01 a | 3.89 ± 0.45 a | 1.76 ± 0.05 a | 2.13 ± 0.46 ab |
| 30 | 22.04 ± 3.37 abcde | 20.88 ± 0.98 abcde | 16.03 ± 3.08 a | 1.78 ± 0.25 ab | 0.57 ± 0.07 a | 3.56 ± 0.14 a | 1.68 ± 0.06 a | 1.88 ± 0.19 ab | ||
| 45 | 19.58 ± 0.71 a | 22.38 ± 1.02 de | 14.07 ± 1.04 a | 1.89 ± 0.16 abcd | 0.53 ± 0.05 a | 3.39 ± 0.16 a | 1.51 ± 0.11 a | 1.88 ± 0.1 ab | ||
| 60 | 19.52 ± 1.25 a | 22.25 ± 1.08 de | 14.12 ± 1.48 a | 2.41 ± 0.22 bcdefghij | 0.42 ± 0.04 a | 3.99 ± 0.32 a | 1.63 ± 0.21 a | 2.37 ± 0.36 ab | ||
| 120 | 15 | 19.52 ± 0.91 a | 22.66 ± 1.19 e | 13.5 ± 1.67 a | 2.74 ± 0.17 fghijk | 0.37 ± 0.02 a | 3.52 ± 0.22 a | 1.66 ± 0.09 a | 1.86 ± 0.14 ab | |
| 30 | 20.94 ± 0.45 abc | 21.09 ± 2.95 abcde | 13.38 ± 2.03 a | 2.16 ± 0.43 abcdefg | 0.47 ± 0.09 a | 4.09 ± 0.94 a | 1.8 ± 0.28 a | 2.29 ± 0.68 ab | ||
| 45 | 21.7 ± 2.11 abcde | 21.66 ± 1.7 abcde | 14.83 ± 2.28 a | 1.8 ± 0.17 abc | 0.56 ± 0.05 a | 4.3 ± 0.19 a | 1.83 ± 0.19 a | 2.48 ± 0.13 ab | ||
| 60 | 19.43 ± 2.38 a | 22.09 ± 1.62 cde | 14.93 ± 1.44 a | 2.29 ± 0.13 abcdefghi | 0.44 ± 0.03 a | 3.7 ± 0.59 a | 1.69 ± 0.21 a | 2.01 ± 0.44 ab | ||
| 140 | 15 | 20.59 ± 2.24 ab | 20.67 ± 1 abcde | 13.82 ± 1.42 a | 2.92 ± 0.42 hijk | 0.35 ± 0.05 a | 4.38 ± 0.62 a | 1.89 ± 0.27 a | 2.49 ± 0.53 ab | |
| 30 | 21.04 ± 3.14 abc | 21.47 ± 0.88 abcde | 14.3 ± 0.65 a | 2.04 ± 0.15 abcdefg | 0.49 ± 0.03 a | 3.49 ± 0.45 a | 1.55 ± 0.26 a | 1.94 ± 0.19 ab | ||
| 45 | 22.32 ± 2.88 abcde | 21.06 ± 2.27 abcde | 16.43 ± 2.19 a | 2.7 ± 0.2 efghijk | 0.37 ± 0.03 a | 3.78 ± 0.29 a | 1.78 ± 0.1 a | 2.01 ± 0.21 ab | ||
| 60 | 21.91 ± 1.88 abcde | 22.2 ± 1.21 de | 15.53 ± 1.82 a | 2.13 ± 0.16 abcdefg | 0.47 ± 0.04 a | 3.62 ± 0.59 a | 1.62 ± 0.13 a | 2 ± 0.47 ab | ||
| 160 | 15 | 21.48 ± 2.59 abcd | 21.18 ± 0.24 abcde | 15.52 ± 1.94 a | 2.35 ± 0.09 abcdefghi | 0.43 ± 0.02 a | 4.1 ± 0.19 a | 1.69 ± 0.12 a | 2.41 ± 0.18 ab | |
| 30 | 20.75 ± 0.44 abc | 21.13 ± 0.13 abcde | 13.11 ± 1.03 a | 2.42 ± 0.05 bcdefghij | 0.41 ± 0.01 a | 3.86 ± 0.33 a | 1.81 ± 0.17 a | 2.05 ± 0.2 ab | ||
| 45 | 21.43 ± 1.08 abcd | 21.67 ± 2.52 abcde | 13.04 ± 1.64 a | 2.34 ± 0.15 abcdefghi | 0.43 ± 0.03 a | 4.2 ± 0.92 a | 1.96 ± 0.41 a | 2.24 ± 0.75 ab | ||
| 60 | 19.34 ± 1.05 a | 20.02 ± 0.16 abcde | 12.79 ± 0.77 a | 2.98 ± 0.06 ijk | 0.34 ± 0.01 a | 3.85 ± 0.25 a | 1.5 ± 0.31 a | 2.35 ± 0.09 ab | ||
| Statistical significance | * | * | n.s. | * | * | ** | n.s. | ** | ||
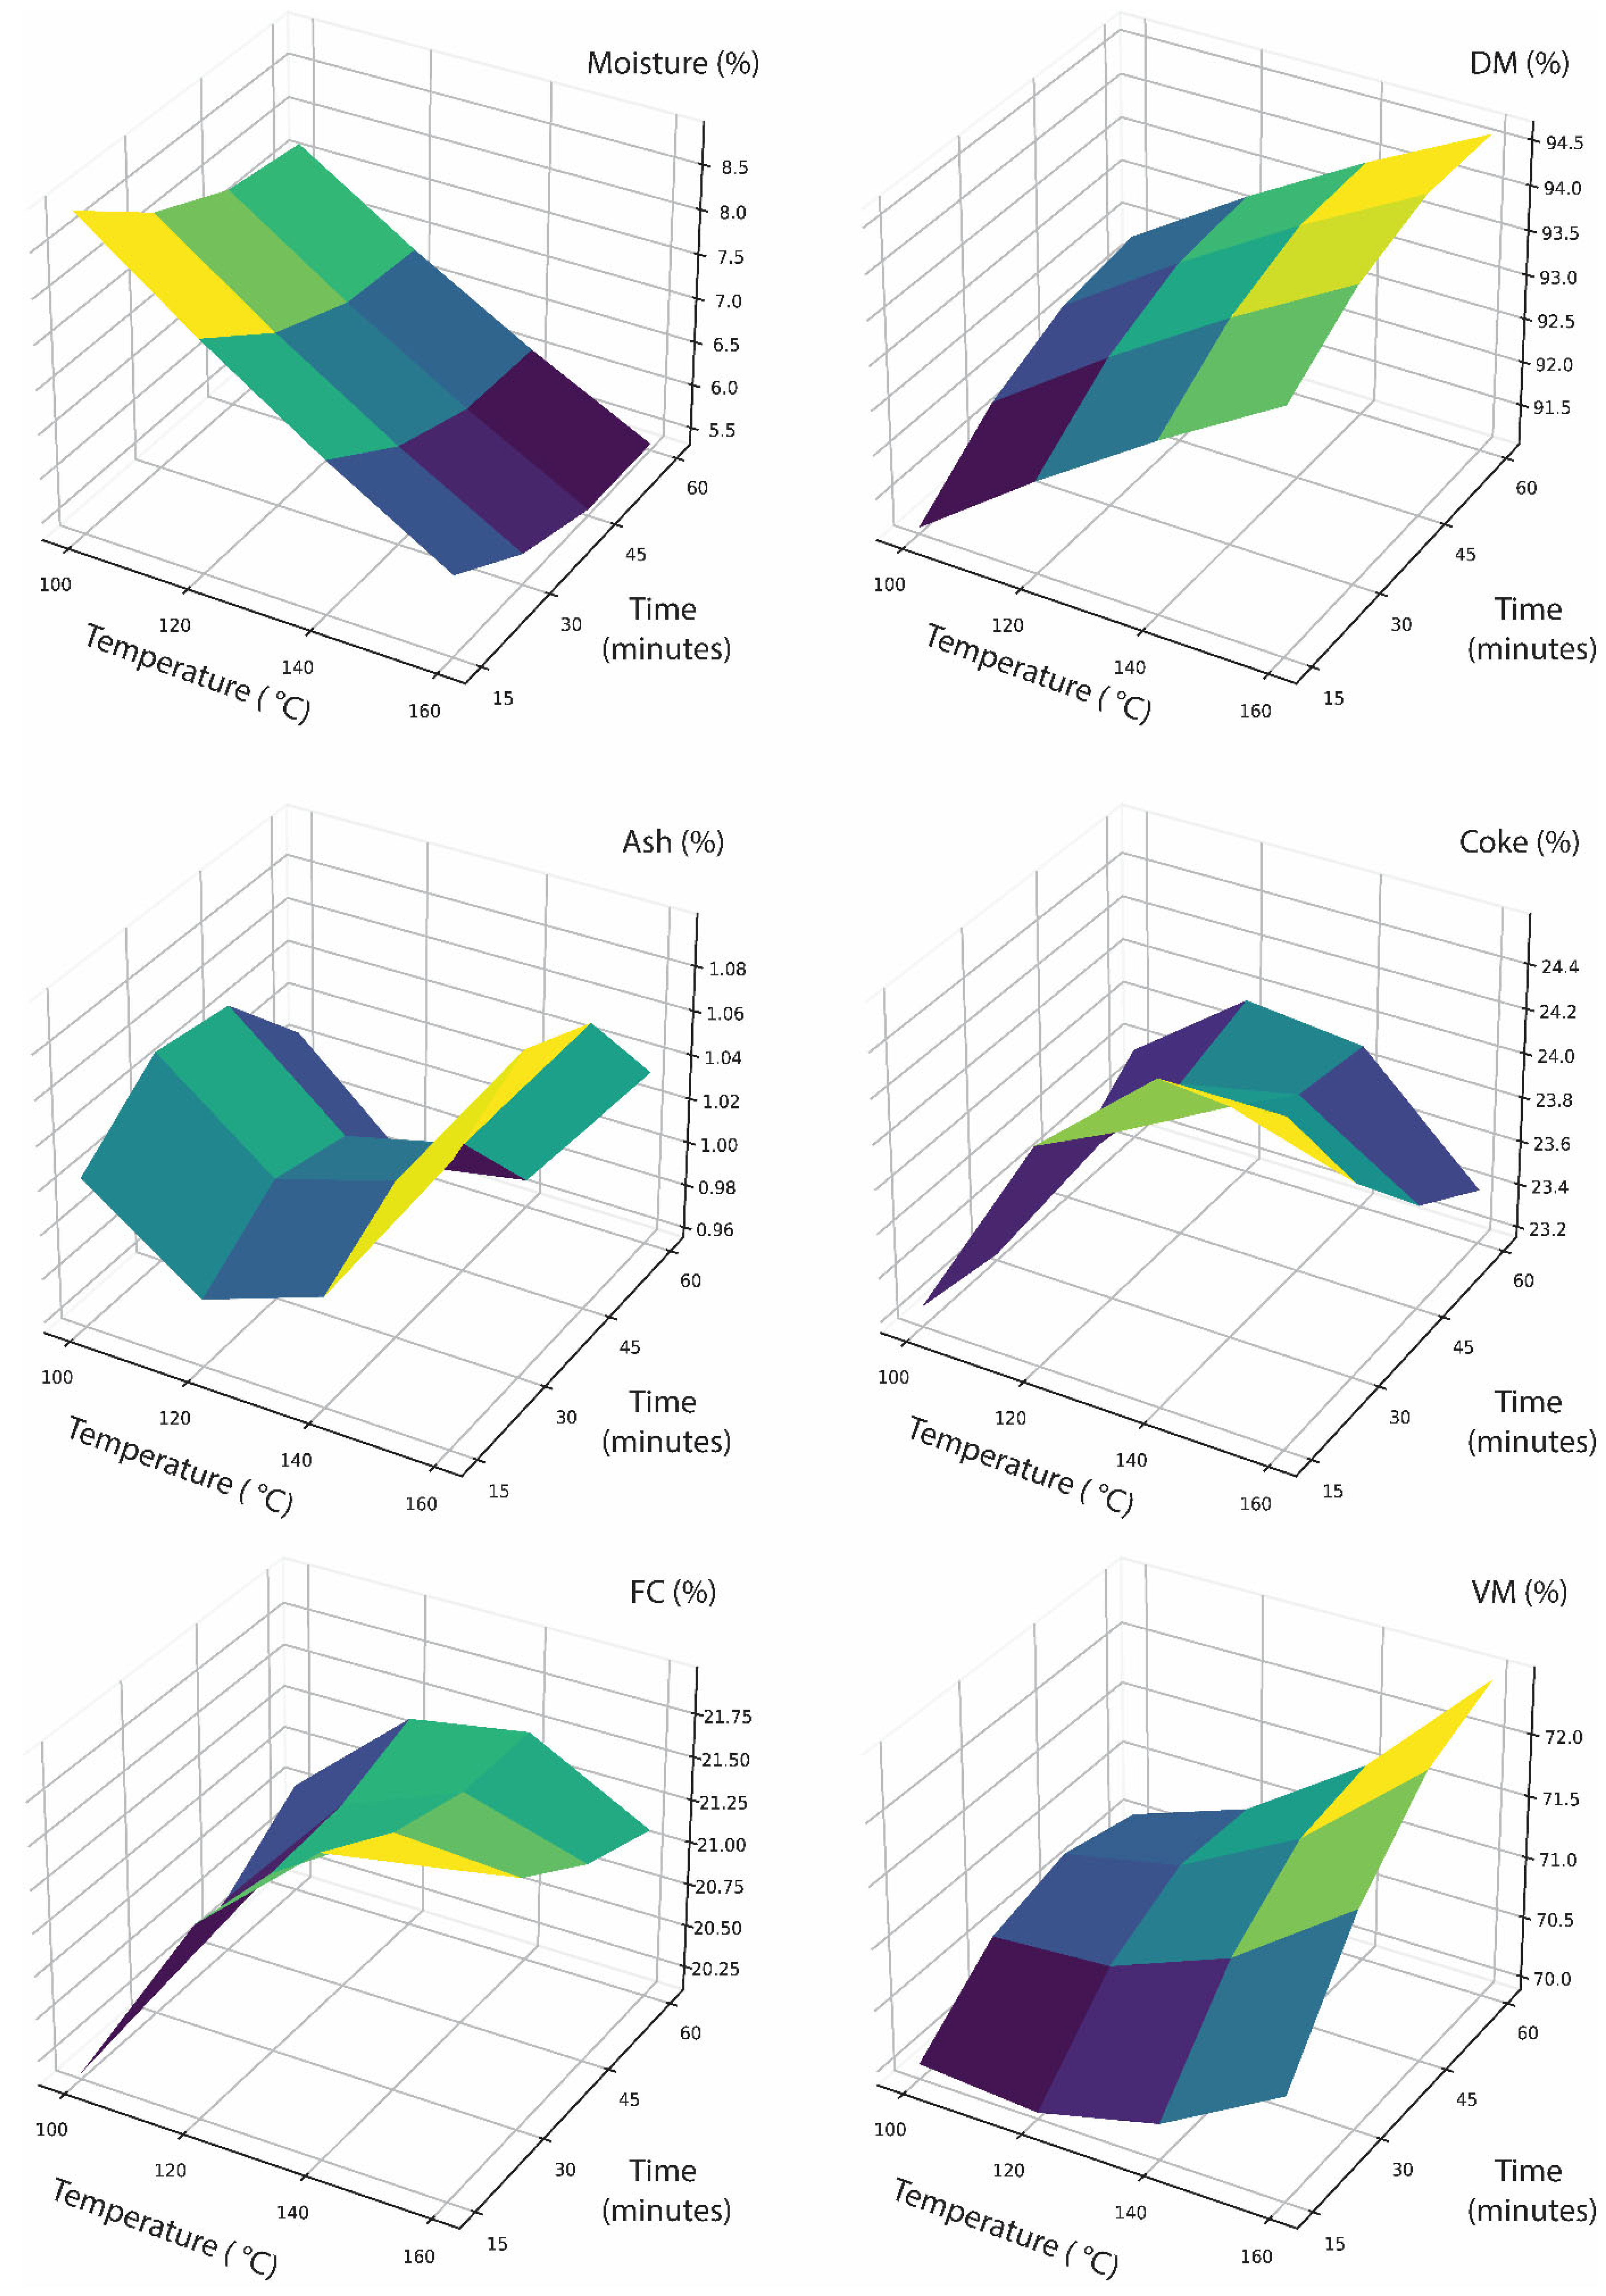
| Sample | Temp. (°C) | Time (min) | Moisture (%) | DM (%) | Ash (%) | Coke (%) | FC (%) | VM (%) |
|---|---|---|---|---|---|---|---|---|
| Istarski duguljasti | 100 | 15 | 9.29 ± 0.23 p | 90.71 ± 0.23 a | 1.06 ± 0.12 cdefgh | 23.57 ± 0.21 cdef | 20.32 ± 0.37 a | 69.34 ± 0.02 a |
| 30 | 7.71 ± 0.24 no | 92.29 ± 0.24 bc | 1.03 ± 0.05 cdefg | 23.63 ± 0.25 cdefg | 20.78 ± 0.34 ab | 70.48 ± 0.04 bcde | ||
| 45 | 8.03 ± 0.01 o | 91.97 ± 0.01 b | 1.15 ± 0.07 efghi | 23.55 ± 0.87 cdef | 20.51 ± 0.86 bc | 70.31 ± 0.81 abcd | ||
| 60 | 7.67 ± 0.01 n | 92.33 ± 0.01 c | 0.99 ± 0.07 abcde | 23.13 ± 0.29 abc | 20.36 ± 0.34 bcd | 70.98 ± 0.26 defgh | ||
| 120 | 15 | 7.79 ± 0.18 no | 92.21 ± 0.18 bc | 0.93 ± 0.04 abcd | 24.2 ± 0.07 efghij | 21.38 ± 0.06 bcd | 70.43 ± 0.99 bcde | |
| 30 | 6.95 ± 0.04 klm | 93.05 ± 0.04 def | 1.01 ± 0.02 bcdef | 24.94 ± 0.14 jk | 22.19 ± 0.14 bcde | 69.84 ± 0.16 abc | ||
| 45 | 6.67 ± 0.03 ijkl | 93.33 ± 0.03 efgh | 1.01 ± 0.04 bcdef | 24.47 ± 0.35 ghij | 21.83 ± 0.38 bcdef | 70.49 ± 0.31 bcde | ||
| 60 | 6.9 ± 0.19 jklm | 93.1 ± 0.19 defg | 0.84 ± 0.02 a | 23.81 ± 0.23 cdefghi | 21.32 ± 0.16 bcdef | 70.94 ± 0.36 defgh | ||
| 140 | 15 | 7 ± 0.04 lm | 93 ± 0.04 de | 0.92 ± 0.05 abc | 24.08 ± 0.17 defghij | 21.47 ± 0.1 bcdefg | 70.61 ± 0.19 bcdef | |
| 30 | 6.61 ± 0.22 ij | 93.39 ± 0.22 gh | 1.01 ± 0 bcdef | 24.14 ± 0.4 efghij | 21.54 ± 0.43 bcdefgh | 70.84 ± 0.2 cdefg | ||
| 45 | 6.64 ± 0.02 ijk | 93.36 ± 0.02 fgh | 1.03 ± 0 cdefg | 24.1 ± 0.03 defghij | 21.47 ± 0.04 cdefghi | 70.86 ± 0.02 cdefgh | ||
| 60 | 5.96 ± 0.15 def | 94.04 ± 0.15 klm | 1.2 ± 0.01 hi | 23.84 ± 0.26 cdefghi | 21.22 ± 0.22 cdefghij | 71.62 ± 0.36 fghi | ||
| 160 | 15 | 6.27 ± 0.07 fgh | 93.73 ± 0.07 ijk | 1.16 ± 0.06 fghi | 25.56 ± 0.17 k | 22.79 ± 0.11 cdefghij | 69.77 ± 0.1 ab | |
| 30 | 5.91 ± 0.08 cde | 94.09 ± 0.08 lmn | 0.99 ± 0.03 abcd | 24.16 ± 0.26 efghij | 21.74 ± 0.29 cdefghij | 71.36 ± 0.18 efghi | ||
| 45 | 5.36 ± 0.03 ab | 94.64 ± 0.03 op | 1.09 ± 0.03 defghi | 24.04 ± 0.27 defghi | 21.66 ± 0.22 defghijk | 71.89 ± 0.28 hij | ||
| 60 | 5.58 ± 0.06 bc | 94.42 ± 0.06 no | 1.02 ± 0.01 cdef | 23.93 ± 0.3 cdefghi | 21.57 ± 0.25 efghijkl | 71.82 ± 0.33 ghij | ||
| Rimski okrugli | 100 | 15 | 9.11 ± 0.1 p | 90.89 ± 0.1 a | 0.97 ± 0.03 abcd | 23.71 ± 0.31 cdefgh | 20.58 ± 0.27 efghijkl | 69.34 ± 0.21 a |
| 30 | 8.01 ± 0.04 no | 91.99 ± 0.04 bc | 1.24 ± 0.09 i | 22.38 ± 0.38 a | 19.34 ± 0.26 fghijkl | 71.41 ± 0.39 efghi | ||
| 45 | 7.71 ± 0 no | 92.29 ± 0 bc | 0.91 ± 0.06 abc | 22.64 ± 0.29 ab | 19.99 ± 0.21 ghijkl | 71.4 ± 0.26 efghi | ||
| 60 | 7.81 ± 0.08 no | 92.19 ± 0.08 bc | 0.98 ± 0.06 abcd | 23.8 ± 0.15 cdefgh | 20.96 ± 0.1 ghijkl | 70.25 ± 0.08 abcd | ||
| 120 | 15 | 7.69 ± 0.03 n | 92.31 ± 0.03 c | 0.98 ± 0.03 abcd | 23.4 ± 0.14 bcde | 20.62 ± 0.15 hijkl | 70.71 ± 0.15 bcdef | |
| 30 | 7.71 ± 0.07 no | 92.29 ± 0.07 bc | 0.86 ± 0.01 ab | 23.59 ± 0.1 cdefg | 20.91 ± 0.07 hijkl | 70.52 ± 0.14 bcde | ||
| 45 | 6.58 ± 0.04 hij | 93.42 ± 0.04 ghi | 1.05 ± 0.04 cdefgh | 23.06 ± 0.1 abc | 20.5 ± 0.13 hijkl | 71.87 ± 0.13 ghij | ||
| 60 | 6.96 ± 0.04 klm | 93.04 ± 0.04 def | 1.01 ± 0.03 bcdef | 24.7 ± 0.2 ijk | 21.97 ± 0.15 hijkl | 70.06 ± 0.22 abcd | ||
| 140 | 15 | 7.02 ± 0 m | 92.98 ± 0 d | 1.01 ± 0.04 bcdef | 24.08 ± 0.04 defghij | 21.38 ± 0 ijkl | 70.59 ± 0.03 bcdef | |
| 30 | 6.47 ± 0.02 ghi | 93.53 ± 0.02 hij | 1.18 ± 0.06 ghi | 24.32 ± 0.22 fghij | 21.57 ± 0.27 ijkl | 70.79 ± 0.19 bcdef | ||
| 45 | 6.14 ± 0.02 efg | 93.86 ± 0.02 jkl | 1.06 ± 0.07 cdefgh | 24.35 ± 0.14 fghij | 21.79 ± 0.21 ijkl | 71.01 ± 0.12 defgh | ||
| 60 | 5.98 ± 0.15 def | 94.02 ± 0.15 klm | 0.84 ± 0.06 a | 23.87 ± 0.46 cdefghi | 21.61 ± 0.34 jkl | 71.58 ± 0.54 fghi | ||
| 160 | 15 | 5.93 ± 0.12 de | 94.07 ± 0.12 lm | 1.16 ± 0.06 fghi | 24.53 ± 0.28 hij | 21.92 ± 0.3 klm | 70.99 ± 0.36 defgh | |
| 30 | 5.74 ± 0.03 cd | 94.26 ± 0.03 mn | 1.05 ± 0.06 cdefgh | 23.41 ± 0.1 bcde | 21.02 ± 0.16 klm | 72.19 ± 0.07 ij | ||
| 45 | 5.24 ± 0.11 a | 94.76 ± 0.11 p | 1.01 ± 0.01 bcdef | 23.22 ± 0.1 abcd | 21 ± 0.06 lm | 72.75 ± 0.18 jk | ||
| 60 | 5.02 ± 0.02 a | 94.98 ± 0.02 p | 1.06 ± 0.01 cdefgh | 22.58 ± 0.04 ab | 20.39 ± 0.05 m | 73.54 ± 0.05 k | ||
| Statistical significance | n.s. | n.s. | n.s. | n.s. | n.s. | n.s. | ||
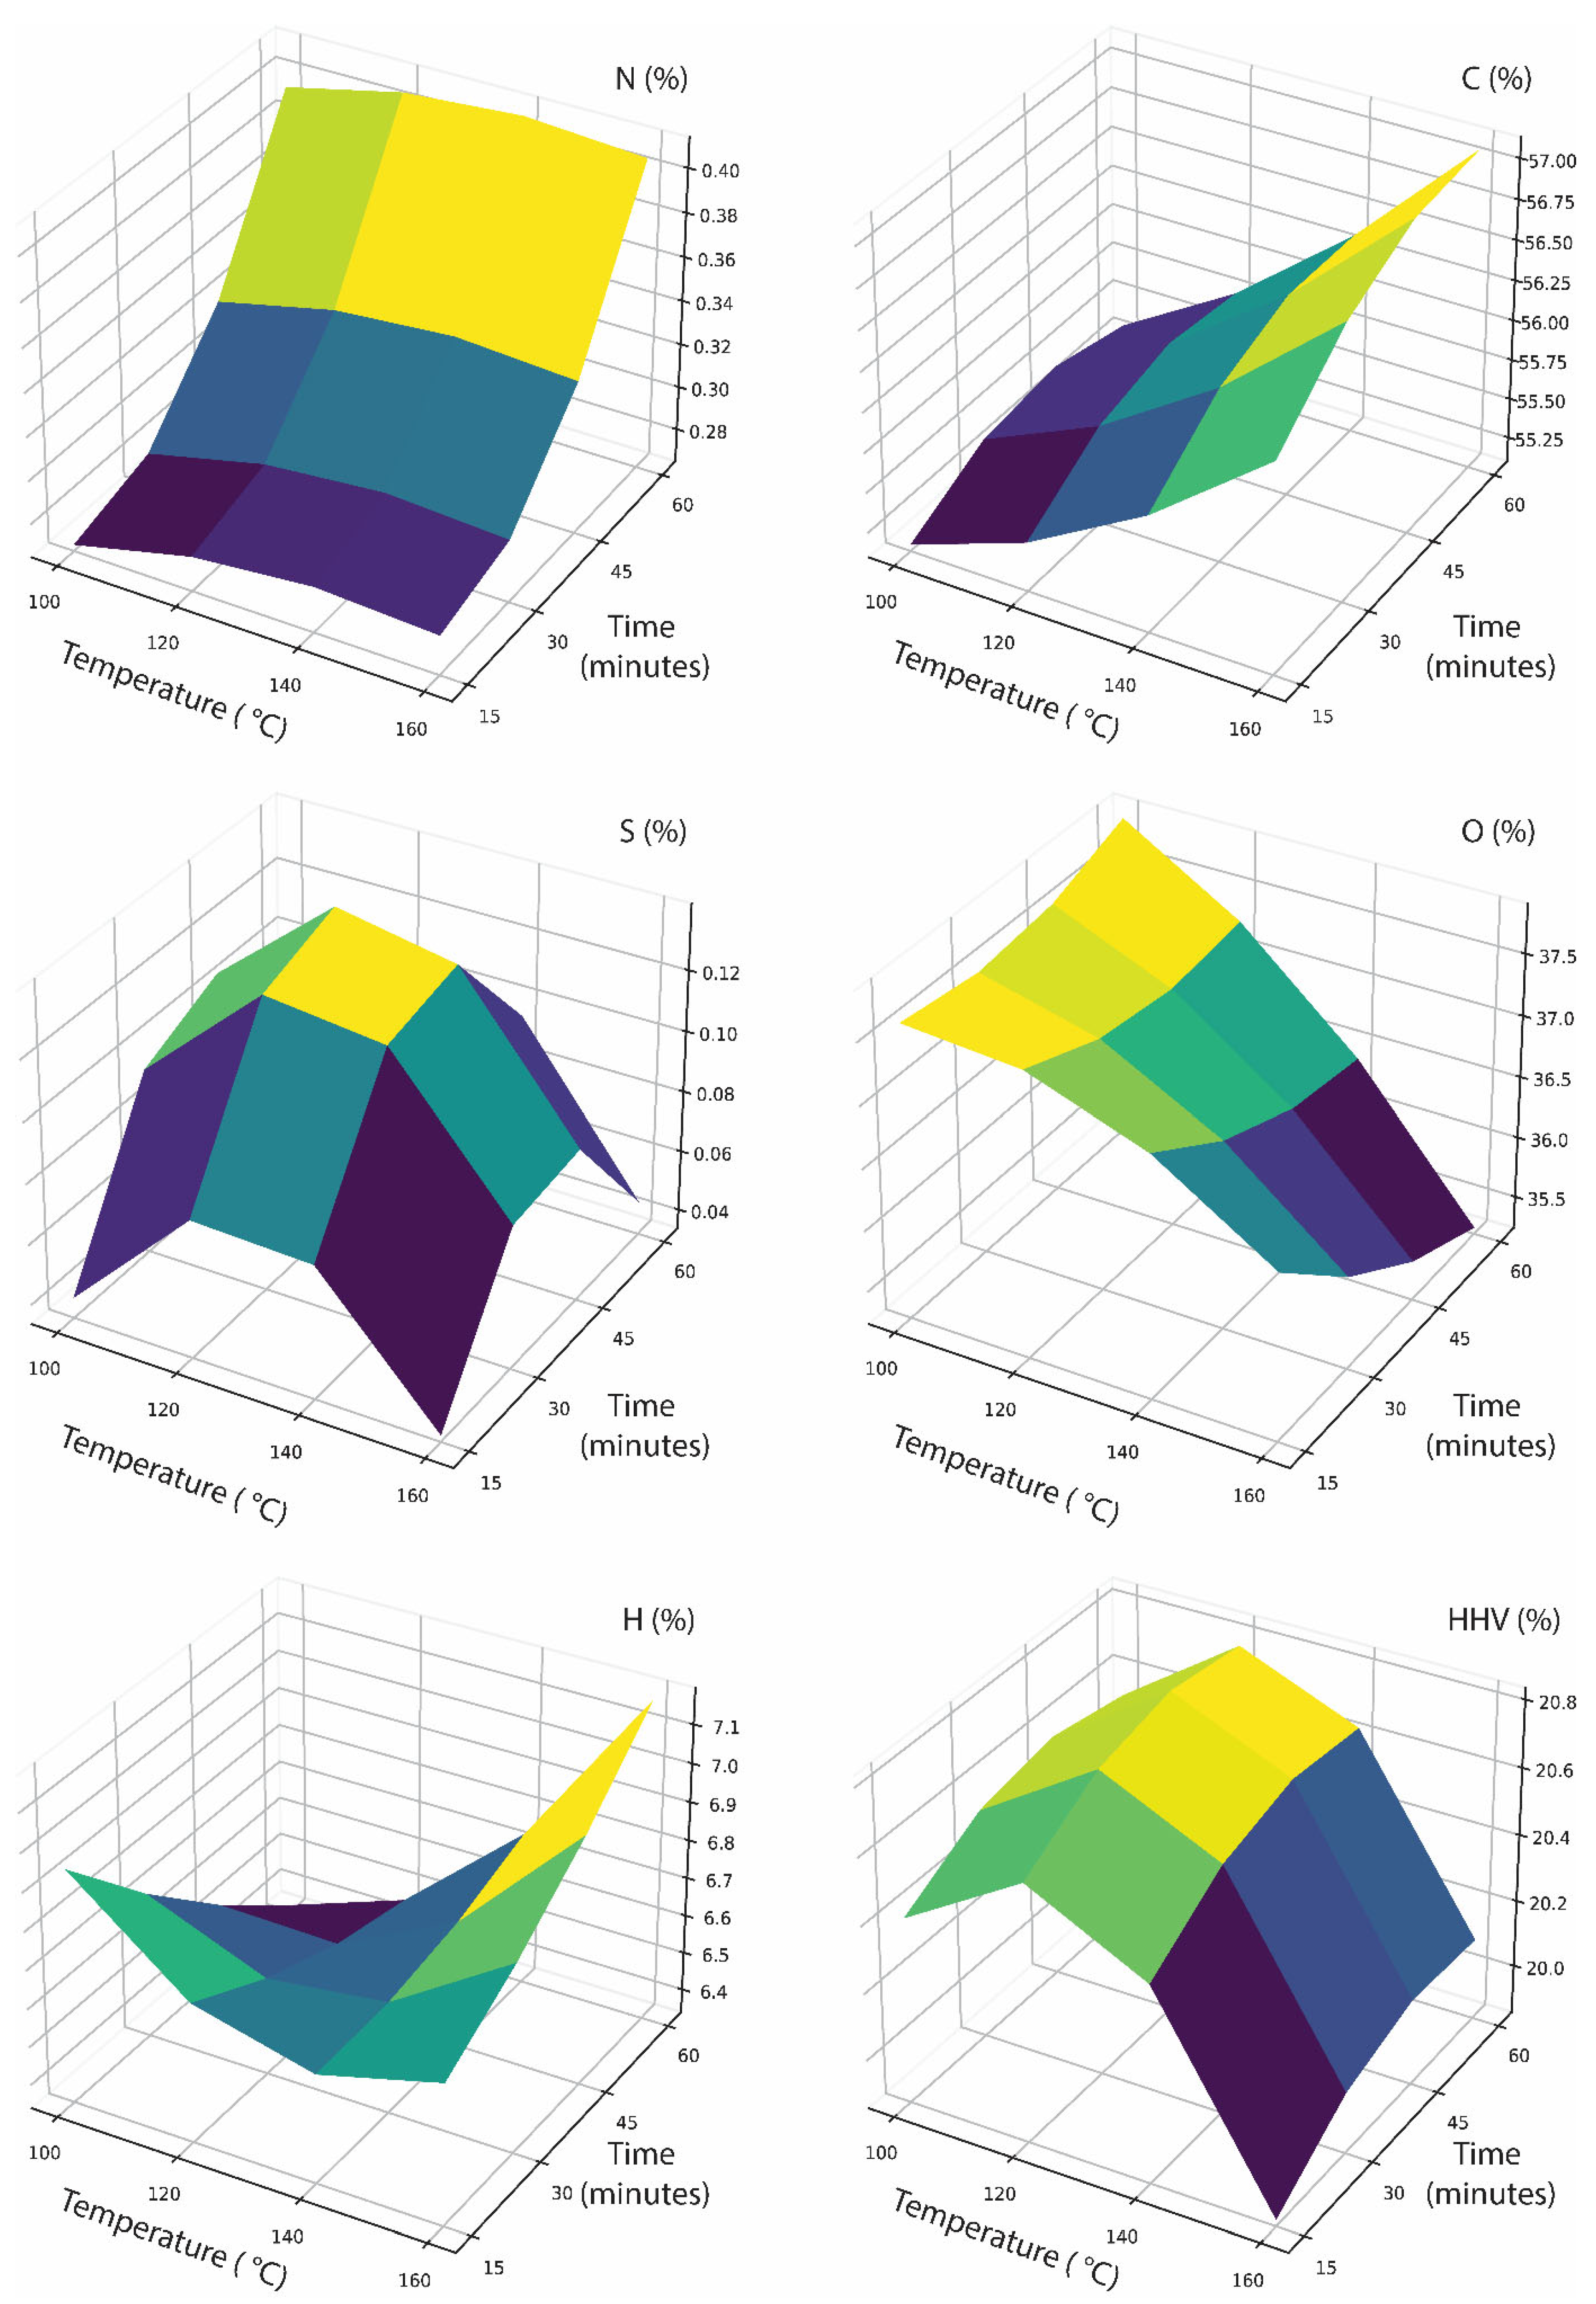
| Sample | Temp. (°C) | Time (min) | N (%) | C (%) | S (%) | O (%) | H (%) | HHV (MJ kg−1) |
|---|---|---|---|---|---|---|---|---|
| Istarski duguljasti | 100 | 15 | 0.31 ± 0.05 a | 54.88 ± 0.91 a | 0.07 ± 0.01 a | 37.73 ± 0.98 def | 7 ± 0.02 jklmn | 20.4 ± 0.19 fghi |
| 30 | 0.39 ± 0 a | 54.86 ± 0.51 a | 0.07 ± 0 a | 37.98 ± 0.45 def | 6.7 ± 0.05 efghijklm | 20.29 ± 0.02 defgh | ||
| 45 | 0.31 ± 0.02 a | 55.21 ± 0.37 ab | 0.07 ± 0 a | 37.69 ± 0.35 def | 6.73 ± 0 efghijklm | 20.75 ± 0.01 jkl | ||
| 60 | 0.19 ± 0.03 a | 55.01 ± 0.21 a | 0.06 ± 0 a | 38.92 ± 0.19 f | 5.81 ± 0.05 a | 20.59 ± 0.02 hijkl | ||
| 120 | 15 | 0.22 ± 0 a | 55.5 ± 0.23 ab | 0.06 ± 0 a | 37.92 ± 0.68 def | 6.29 ± 0.46 bcde | 20.36 ± 0.06 efghi | |
| 30 | 0.33 ± 0.12 a | 56.18 ± 0.02 abcd | 0.09 ± 0 a | 36.81 ± 0.08 bcdef | 6.59 ± 0.03 defghij | 20.82 ± 0.06 kl | ||
| 45 | 0.26 ± 0.01 a | 56.16 ± 0.19 abcd | 0.72 ± 0.09 b | 36.25 ± 0.3 abcd | 6.61 ± 0.01 defghijk | 20.57 ± 0.02 hijkl | ||
| 60 | 0.29 ± 0.01 a | 55.76 ± 0.12 abc | 0.07 ± 0 a | 36.83 ± 0.08 bcdef | 7.06 ± 0.21 klmn | 20.75 ± 0.01 jkl | ||
| 140 | 15 | 0.23 ± 0 a | 55.42 ± 0.01 ab | 0.07 ± 0.01 a | 37.48 ± 0.02 def | 6.8 ± 0.02 fghijklm | 20.49 ± 0 ghij | |
| 30 | 0.29 ± 0.01 a | 56.47 ± 0.06 abcd | 0.07 ± 0 a | 36.26 ± 0.04 abcd | 6.91 ± 0.02 hijklmn | 20.81 ± 0.08 kl | ||
| 45 | 0.33 ± 0 a | 56.05 ± 0 abcd | 0.07 ± 0 a | 37.1 ± 0.11 cdef | 6.45 ± 0.11 cdefg | 20.88 ± 0.2 l | ||
| 60 | 0.33 ± 0 a | 56.3 ± 3.13 abcd | 0.07 ± 0 a | 36.74 ± 3.15 bcde | 6.55 ± 0.01 cdefghi | 20.47 ± 0.01 ghij | ||
| 160 | 15 | 0.35 ± 0.01 a | 56.61 ± 0.28 abcd | 0.09 ± 0 a | 36.53 ± 0.28 abcde | 6.42 ± 0.01 cdef | 19.72 ± 0.09 ab | |
| 30 | 0.36 ± 0 a | 56.65 ± 0.1 abcd | 0.07 ± 0 a | 36.09 ± 0.1 abcd | 6.83 ± 0.01 fghijklmn | 19.54 ± 0.06 a | ||
| 45 | 0.42 ± 0.01 a | 57.11 ± 0.12 bcd | 0.08 ± 0 a | 35.33 ± 0.12 abc | 7.07 ± 0.01 lmn | 20.13 ± 0.06 cdef | ||
| 60 | 0.34 ± 0.02 a | 56.64 ± 0.01 abcd | 0.08 ± 0 a | 35.88 ± 0.01 abcd | 7.06 ± 0 lmn | 20.18 ± 0.01 cdefg | ||
| Rimski okrugli | 100 | 15 | 0.2 ± 0 a | 55.1 ± 0.05 a | 0.07 ± 0.01 a | 37.64 ± 0.46 def | 6.99 ± 0.41 ijklmn | 20.52 ± 0.17 hijk |
| 30 | 0.5 ± 0.03 a | 55.54 ± 0.03 ab | 0.07 ± 0 a | 36.94 ± 0.03 bcdef | 6.96 ± 0.03 hijklmn | 20.63 ± 0.09 ijkl | ||
| 45 | 0.21 ± 0 a | 55.2 ± 0 ab | 0.06 ± 0 a | 38.59 ± 0.22 ef | 5.94 ± 0.22 ab | 20.52 ± 0.02 hijk | ||
| 60 | 0.29 ± 0.01 a | 56.19 ± 0.26 abcd | 0.07 ± 0.01 a | 36.4 ± 0.57 abcd | 7.06 ± 0.33 lmn | 20.66 ± 0.01 ijkl | ||
| 120 | 15 | 0.22 ± 0 a | 56.22 ± 0.02 abcd | 0.06 ± 0 a | 36.73 ± 0.08 bcde | 6.77 ± 0.06 fghijklm | 20.73 ± 0.04 jkl | |
| 30 | 0.23 ± 0.01 a | 55.63 ± 0.06 abc | 0.08 ± 0 a | 37.53 ± 0.08 def | 6.53 ± 0 cdefgh | 20.66 ± 0.06 ijkl | ||
| 45 | 0.22 ± 0.01 a | 56.27 ± 0.11 abcd | 0.07 ± 0.01 a | 37.21 ± 0.22 cdef | 6.23 ± 0.11 abcd | 20.73 ± 0.04 jkl | ||
| 60 | 1.23 ± 1.07 b | 55.54 ± 0.09 ab | 0.07 ± 0 a | 37.02 ± 1.18 bcdef | 6.14 ± 0.02 abc | 20.6 ± 0.01 hijkl | ||
| 140 | 15 | 0.3 ± 0.01 a | 55.6 ± 0.09 ab | 0.07 ± 0 a | 37.19 ± 0.13 cdef | 6.84 ± 0.02 fghijklmn | 20.65 ± 0.08 ijkl | |
| 30 | 0.28 ± 0.01 a | 55.99 ± 0.02 abcd | 0.07 ± 0 a | 37.09 ± 0.02 cdef | 6.56 ± 0.01 cdefghij | 20.46 ± 0.03 ghij | ||
| 45 | 0.27 ± 0.02 a | 56.02 ± 0.02 abcd | 0.07 ± 0 a | 36.76 ± 0.04 bcde | 6.88 ± 0.03 ghijklmn | 20.87 ± 0.25 l | ||
| 60 | 0.24 ± 0 a | 55.69 ± 0.08 abc | 0.07 ± 0 a | 37.34 ± 0.05 cdef | 6.66 ± 0.02 defghijkl | 20.75 ± 0.02 jkl | ||
| 160 | 15 | 0.3 ± 0.02 a | 56.23 ± 0.36 abcd | 0.07 ± 0.01 a | 36.69 ± 0.37 bcde | 6.72 ± 0.01 efghijklm | 19.88 ± 0.02 bc | |
| 30 | 0.25 ± 0 a | 56.63 ± 0.03 abcd | 0.07 ± 0.01 a | 36.23 ± 0.04 abcd | 6.82 ± 0 fghijklmn | 20.45 ± 0.3 fghij | ||
| 45 | 0.33 ± 0 a | 57.56 ± 0.12 cd | 0.07 ± 0 a | 34.93 ± 0.12 ab | 7.11 ± 0 mn | 20.06 ± 0.04 cde | ||
| 60 | 0.42 ± 0 a | 57.84 ± 0.03 d | 0.07 ± 0 a | 34.42 ± 0.04 a | 7.25 ± 0.02 n | 20.02 ± 0.03 bcd | ||
| Statistical significance | n.s. | n.s. | n.s. | n.s. | ** | n.s. | ||
| Effect | DF | SS | |||||||
|---|---|---|---|---|---|---|---|---|---|
| Len. (mm) | Wid. (mm) | Thick. (mm) | Den. (g/cm3) | Vol. (cm3) | FM (g) | KM (g) | SM (g) | ||
| Sample | 1 | 478.07 * | 188.47 * | 3.69 | 0.01 | 0.11 * | 0.00 | 0.10 | 0.06 |
| Temp. | 3 | 10.18 | 11.68 | 12.53 | 1.05 * | 0.53 * | 0.11 | 0.00 | 0.10 |
| Time | 3 | 11.49 | 4.04 | 10.48 | 1.17 * | 0.19 * | 1.58 | 0.38 ** | 0.64 |
| Sample × Temp. | 3 | 4.84 | 0.95 | 6.20 | 0.71 * | 0.17 * | 0.76 | 0.16 | 0.31 |
| Sample × Time | 3 | 1.77 | 0.19 | 6.20 | 1.61 * | 0.37 * | 0.28 | 0.01 | 0.24 |
| Temp. × Time | 9 | 46.44 | 9.04 | 27.70 | 5.98 * | 1.55 * | 3.28 | 0.60 | 1.74 |
| Sample × Temp. × Time | 9 | 15.31 | 8.27 | 28.30 | 5.52 * | 1.84 * | 4.25 * | 0.80 ** | 1.97 ** |
| Error | 64 | 184.63 | 97.88 | 147.19 | 3.33 | 0.71 | 12.31 | 2.78 | 6.33 |
| Effect | DF | SS | |||||
|---|---|---|---|---|---|---|---|
| Moisture (%) | DM (%) | Ash (%) | Coke (%) | FC (%) | VM (%) | ||
| Sample | 1 | 0.15 * | 0.15 * | 0.00 | 5.25 * | 4.11 * | 5.15 * |
| Temp. | 3 | 82.85 * | 82.85 * | 0.14 * | 9.56 * | 22.13 * | 26.09 * |
| Time | 3 | 16.02 * | 16.02 * | 0.04 * | 3.21 * | 0.60 * | 19.85 * |
| Sample × Temp. | 3 | 0.68 * | 0.68 * | 0.01 | 3.99 * | 3.76 | 4.28 * |
| Sample × Time | 3 | 0.63 * | 0.63 * | 0.07 * | 2.70 * | 2.92 * | 2.33 * |
| Temp. × Time | 9 | 3.00 * | 3.00 * | 0.20 * | 11.19 * | 8.74 * | 15.04 * |
| Sample × Temp. × Time | 9 | 0.92 * | 0.92 * | 0.44 * | 6.50 * | 5.06 * | 5.71 * |
| Error | 64 | 0.70 | 0.70 | 0.16 | 4.95 | 4.74 | 6.57 |
| Effect | DF | SS | |||||
|---|---|---|---|---|---|---|---|
| N (%) | C (%) | S (%) | O (%) | H (%) | HHV (MJ kg−1) | ||
| Sample | 1 | 0.03 | 0.56 | 0.05 * | 0.76 | 0.03 | 0.20 * |
| Temp. | 3 | 0.13 | 33.68 * | 0.12 * | 48.62 * | 1.86 * | 7.23 * |
| Time | 3 | 0.31 ** | 3.50 ** | 0.11 * | 4.46 ** | 0.18 ** | 0.63 * |
| Sample × Temp. | 3 | 0.23 | 1.96 | 0.12 * | 3.42 | 0.56 * | 0.13 * |
| Sample × Time | 3 | 0.40 ** | 0.70 | 0.12 * | 4.47 ** | 0.55 * | 0.27 * |
| Temp. × Time | 9 | 1.08 * | 3.96 | 0.35 * | 9.55 ** | 3.13 * | 0.35 * |
| Sample × Temp. × Time | 9 | 0.84 ** | 4.58 | 0.35 * | 13.54 * | 4.75 * | 1.69 * |
| Error | 64 | 2.34 | 23.06 | 0.02 | 28.25 | 1.22 | 0.62 |
Disclaimer/Publisher’s Note: The statements, opinions and data contained in all publications are solely those of the individual author(s) and contributor(s) and not of MDPI and/or the editor(s). MDPI and/or the editor(s) disclaim responsibility for any injury to people or property resulting from any ideas, methods, instructions or products referred to in the content. |
© 2023 by the authors. Licensee MDPI, Basel, Switzerland. This article is an open access article distributed under the terms and conditions of the Creative Commons Attribution (CC BY) license (https://creativecommons.org/licenses/by/4.0/).
Share and Cite
Matin, A.; Brandić, I.; Voća, N.; Bilandžija, N.; Matin, B.; Jurišić, V.; Antonović, A.; Krička, T. Changes in the Properties of Hazelnut Shells Due to Conduction Drying. Agriculture 2023, 13, 589. https://doi.org/10.3390/agriculture13030589
Matin A, Brandić I, Voća N, Bilandžija N, Matin B, Jurišić V, Antonović A, Krička T. Changes in the Properties of Hazelnut Shells Due to Conduction Drying. Agriculture. 2023; 13(3):589. https://doi.org/10.3390/agriculture13030589
Chicago/Turabian StyleMatin, Ana, Ivan Brandić, Neven Voća, Nikola Bilandžija, Božidar Matin, Vanja Jurišić, Alan Antonović, and Tajana Krička. 2023. "Changes in the Properties of Hazelnut Shells Due to Conduction Drying" Agriculture 13, no. 3: 589. https://doi.org/10.3390/agriculture13030589
APA StyleMatin, A., Brandić, I., Voća, N., Bilandžija, N., Matin, B., Jurišić, V., Antonović, A., & Krička, T. (2023). Changes in the Properties of Hazelnut Shells Due to Conduction Drying. Agriculture, 13(3), 589. https://doi.org/10.3390/agriculture13030589