Abstract
Traditional methods of cow estrus monitoring technology are not suitable for the current needs of large-scale, intensive and welfare-based farming. There is a need to improve the detection rate of cow estrus and to reduce the emergency response caused by wearing contact devices. Furthermore, it is necessary to verify the practical effectiveness of the LOGISITC and SV (support vector machine) models for modeling cow estrus. In this paper, we have proposed a non-contact cow estrus monitoring method based on the thermal infrared images of cows and have proposed a lab-color-space-based feature extraction method for the thermal infrared images of cow eyes and vulvas. The test subjects were 10 Holstein cows, monitored on a fixed basis, to determine the best segmentation contour. The LOGISTIC and SVM (support vector machine) models were used to establish the cow estrus model using the thermal infrared temperature variation in cows in estrus and cows not in estrus. The experimental results showed that the heat detection rate of the LOGISTIC-based model was 82.37% and the heat detection rate of the SVM-based model was 81.42% under the optimal segmentation profile. The highest temperature in the eye and vulva of cows was the input, and the recall rate was above 86%. The heat monitoring method based on thermal infrared images does not cause stress to cows and meets the needs of modern dairy farming for welfare breeding.
1. Introduction
With the development of modern pastures, modern dairy farming has become an important part of Chinese agriculture. Dairy farming has important significance in promoting the agricultural economy, driving the structure of the agricultural industry, increasing the income of residents and improving the nutrition levels of the nation. Dairy farming is an efficient industry, and the stable development of dairy farming can effectively promote quality nutrition. The timely and accurate detection of cows in heat can improve the conception rate of cows to increase the economic benefits of dairy farms. A dairy cow has an estrous cycle of 16 to 21 days, and once the best mating time has been determined, an additional estrus cycle may be required. Consequently, the breeding cost will increase by RMB 336–672 (renminbi), and the milk production will decrease by 168–315 kg. The timely and accurate identification of cows in estrus can improve the conception rate of cows and increase the economic efficiency of farms [1]. With the development trend in dairy farming showing scale, intensification and welfare, there is a serious lack of technicians in the dairy farming industry. In order to increase the economic efficiency in some farms, farming technicians often take up different jobs [2,3]. Wearing contact devices such as pedometers can cause some stress to cows, and they can also become damaged by cows in their day to day use; however, the use of thermal infrared devices provides a stress-free method of collection that does not affect a cow’s daily life.
Cows in estrus are characterized by changes in certain signs, such as an increased body temperature, increased locomotion, climbing and being climbed, and certain other characteristics. The pedometer is a common device used in cow heat monitoring and its principle is to use acceleration sensors and gravity sensors to sense changes in cow movements. At-taras [4] et al. used the observation method to determine whether cows were in estrus by observing whether the cows showed climbing behavior, which was time-consuming and only 54.7% accurate. Moreover, Yang Yuqin [5] found that 90% of cows were in standing estrus based on the manual observation method to determine estrus. Jiang et al. [6] compared the pedometer detection method with the manual observation method, while Lvendahl et al. [7] used a pedometer based on an exponential smoothing algorithm to identify cows in estrus and to obtain the duration of estrus. Tan et al. [8], furthermore, built a cow estrus recognition model based on cow steps using the STROM framework, with an average delay of 2 s and an average accuracy of over 98.9% for pedometers worn on the legs and 85.71% for those worn on the neck.
Cows in estrus may exhibit straddling behavior and vulval swelling, and cows can be monitored for estrus using rectal monitoring [9]. Video analysis can also be used to identify cows in estrus by monitoring their crawling behavior [10,11,12,13,14]. Both Redden et al. [15] and Kyle [16] found that cows’ vaginal temperatures showed a trend of increasing and then decreasing when they were in estrus, and a link between the vaginal temperature and the core body temperature of cows was established. Conversely, Timsit [17], Lee [18], and Wataru [19] used swallowed or implanted temperature sensors to collect subcutaneous temperatures in the rumen, shoulder and neck of cows, and compared them with rectal temperatures, whereas Hoffmann [20] et al. found that the infrared temperature in the eye and vulva was a strong indicator of the rectal temperature in cows and was suitable for the automatic monitoring of body temperature. This laid the foundation for subsequent studies, and Talukder [21] et al., for example, obtained a 92% estrus detection rate in Holstein cows by monitoring the vulval temperature with an infrared camera. Church et al. [22] investigated the effect of the infrared temperature of the eye and the surrounding environment, and developed an automated body temperature collection system for cows. Furthermore, Uddin et al. [23] devised a strategy for sampling the coronary band of a cow’s eye and its forelimbs that could effectively determine the maximum temperature of a cow’s eye. Wang Man [24] used a cow’s hind ear canal as the temperature collection point and built a cow body temperature prediction model based on the ARIMA (autoregressive integrated moving average) model and Forest anomaly detection model. The results showed that the error of predicting a cow’s body temperature was within 2% and the accuracy of the anomaly check was above 98%; however, the device was a contact device, which caused a certain emergency response in the cow when worn. Additionally, Zhang Xian [25] used a non-contact infrared temperature acquisition device to achieve infrared temperature acquisitions in the eye and nose piece of cows under heat stress and found that the infrared temperature value located below the eye in the infrared image of a cow’s eye was higher and more representative of the actual temperature of the cow. The traditional manual and rectal detection methods, although more accurate for estrus detection, are not applicable in today’s intensive and large-scale farms. The use of pedometers and video analysis, however, to identify cows in heat using movement and climbing behavior as the heat characteristics does not allow for the identification of cows in heat at night or those in standing heat.
The ocular and vulvar areas of cows are not covered by dorsal hair and have a high vascular density, allowing for a better response to changes in body temperature. Infrared thermography (IRT) is a non-ionizing, non-invasive technique that monitors heat in the eye and vulvar areas of cows [26]. The temperature detection of cows in heat requires a non-contact, non-stressful way of identifying cows in heat by detecting the temperature characteristics in areas with little body hair coverage such as the eyes, vulva and rectum. The environment inside a barn is complex, however, which can lead to blurred edges in infrared images. In addition, the infrared temperature is easily affected by the ambient temperature and humidity, which affects the recognition of the infrared image features of cows. In order to realize a stress-free detection of estrus in cows, in this paper, we have proposed a method to extract infrared features from the eyes and vulvas of cows, which could batch process the infrared images. In addition, the highest temperature, lowest temperature and average temperature of the infrared region in the eye and vulva were obtained as experimental samples. Based on the estrus detection information obtained by the technician using the rectal detection method at the time of image acquisition, a cow estrus identification dataset was established using LOGISTIC and SVM. This method accelerates the processing of infrared images, reduces the errors and costs associated with manual labeling, and lays the foundation for subsequent research related to the monitoring of cow estrus based on infrared temperatures.
2. Materials and Methods
2.1. Animals, Feed and Housing
The experiment was conducted in October–November 2021 at Hohhot Ranch, Inner Mongolia, China (111°95′56″ E and 40°67′52″ N). Ten lactating Holstein cows (of breeding age, with 2 to 4 offspring) from Barn 3 of the Hehua Farm were used in this experiment. All the animals were kept under the same environmental and nutritional conditions to avoid any human influence on the experiment. The cows were housed in single-row free pens with free access to water. They were fed centrally at 8:00 a.m. and 3:00 p.m. daily. The animals were milked three times daily, at 7:00 a.m., 12:30 p.m. and 18:30 p.m., via automatic milking equipment.
2.2. Infrared Thermography Measurement
2.2.1. Acquisition Equipment
An infrared thermal imaging machine (FLIR A310, FLIR, Wilsonville, OR, USA) was selected for the test to collect infrared images in the eye and vulva of the 10 test cows. The size of the thermal imager (L × W × H, respectively) was 170 × 70 × 70 mm, the IR resolution was 320 × 240 pixels, the measurement accuracy was ±2 °C, the object temperature range was −20 to +120 °C, the thermal sensitivity was <50 mK, the detector type was a focal plane array, and the wavelength range was 7.5 to 13 μm. The device communicated with a laptop computer via an ethernet/IP protocol (Windows 10 system) to communicate and realize the transmission of the control commands, images, video streams and thermal radiation temperature data. The acquisition software was FLIR TOOLS.
2.2.2. Capture Solutions
An infrared thermography measurement was carried out at the same as the technician carried out their detection of cows in heat using the rectal test method, at approximately 8 a.m. daily. To ensure that the complete image area of the cow was captured, the center of the thermal imager lens was 810 mm from the ground and 1940–2200 mm from the cow’s head when collecting the infrared images of the eyes, and 1000–1200 mm from the cow’s buttocks when collecting the infrared images of the vulva, as shown in Figure 1.
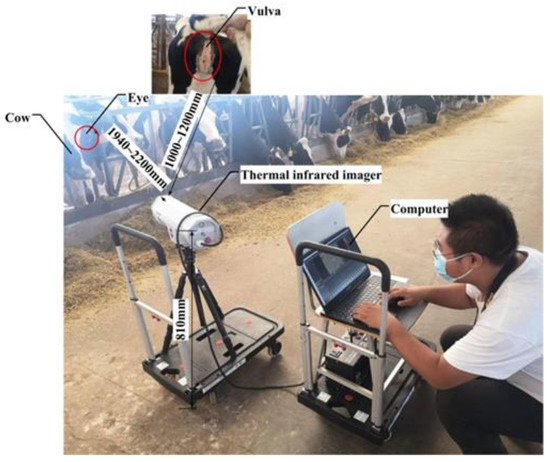
Figure 1.
Schematic diagram of thermal infrared image acquisition of dairy cows.
2.2.3. Thermal Infrared Image and Temperature Data Extraction
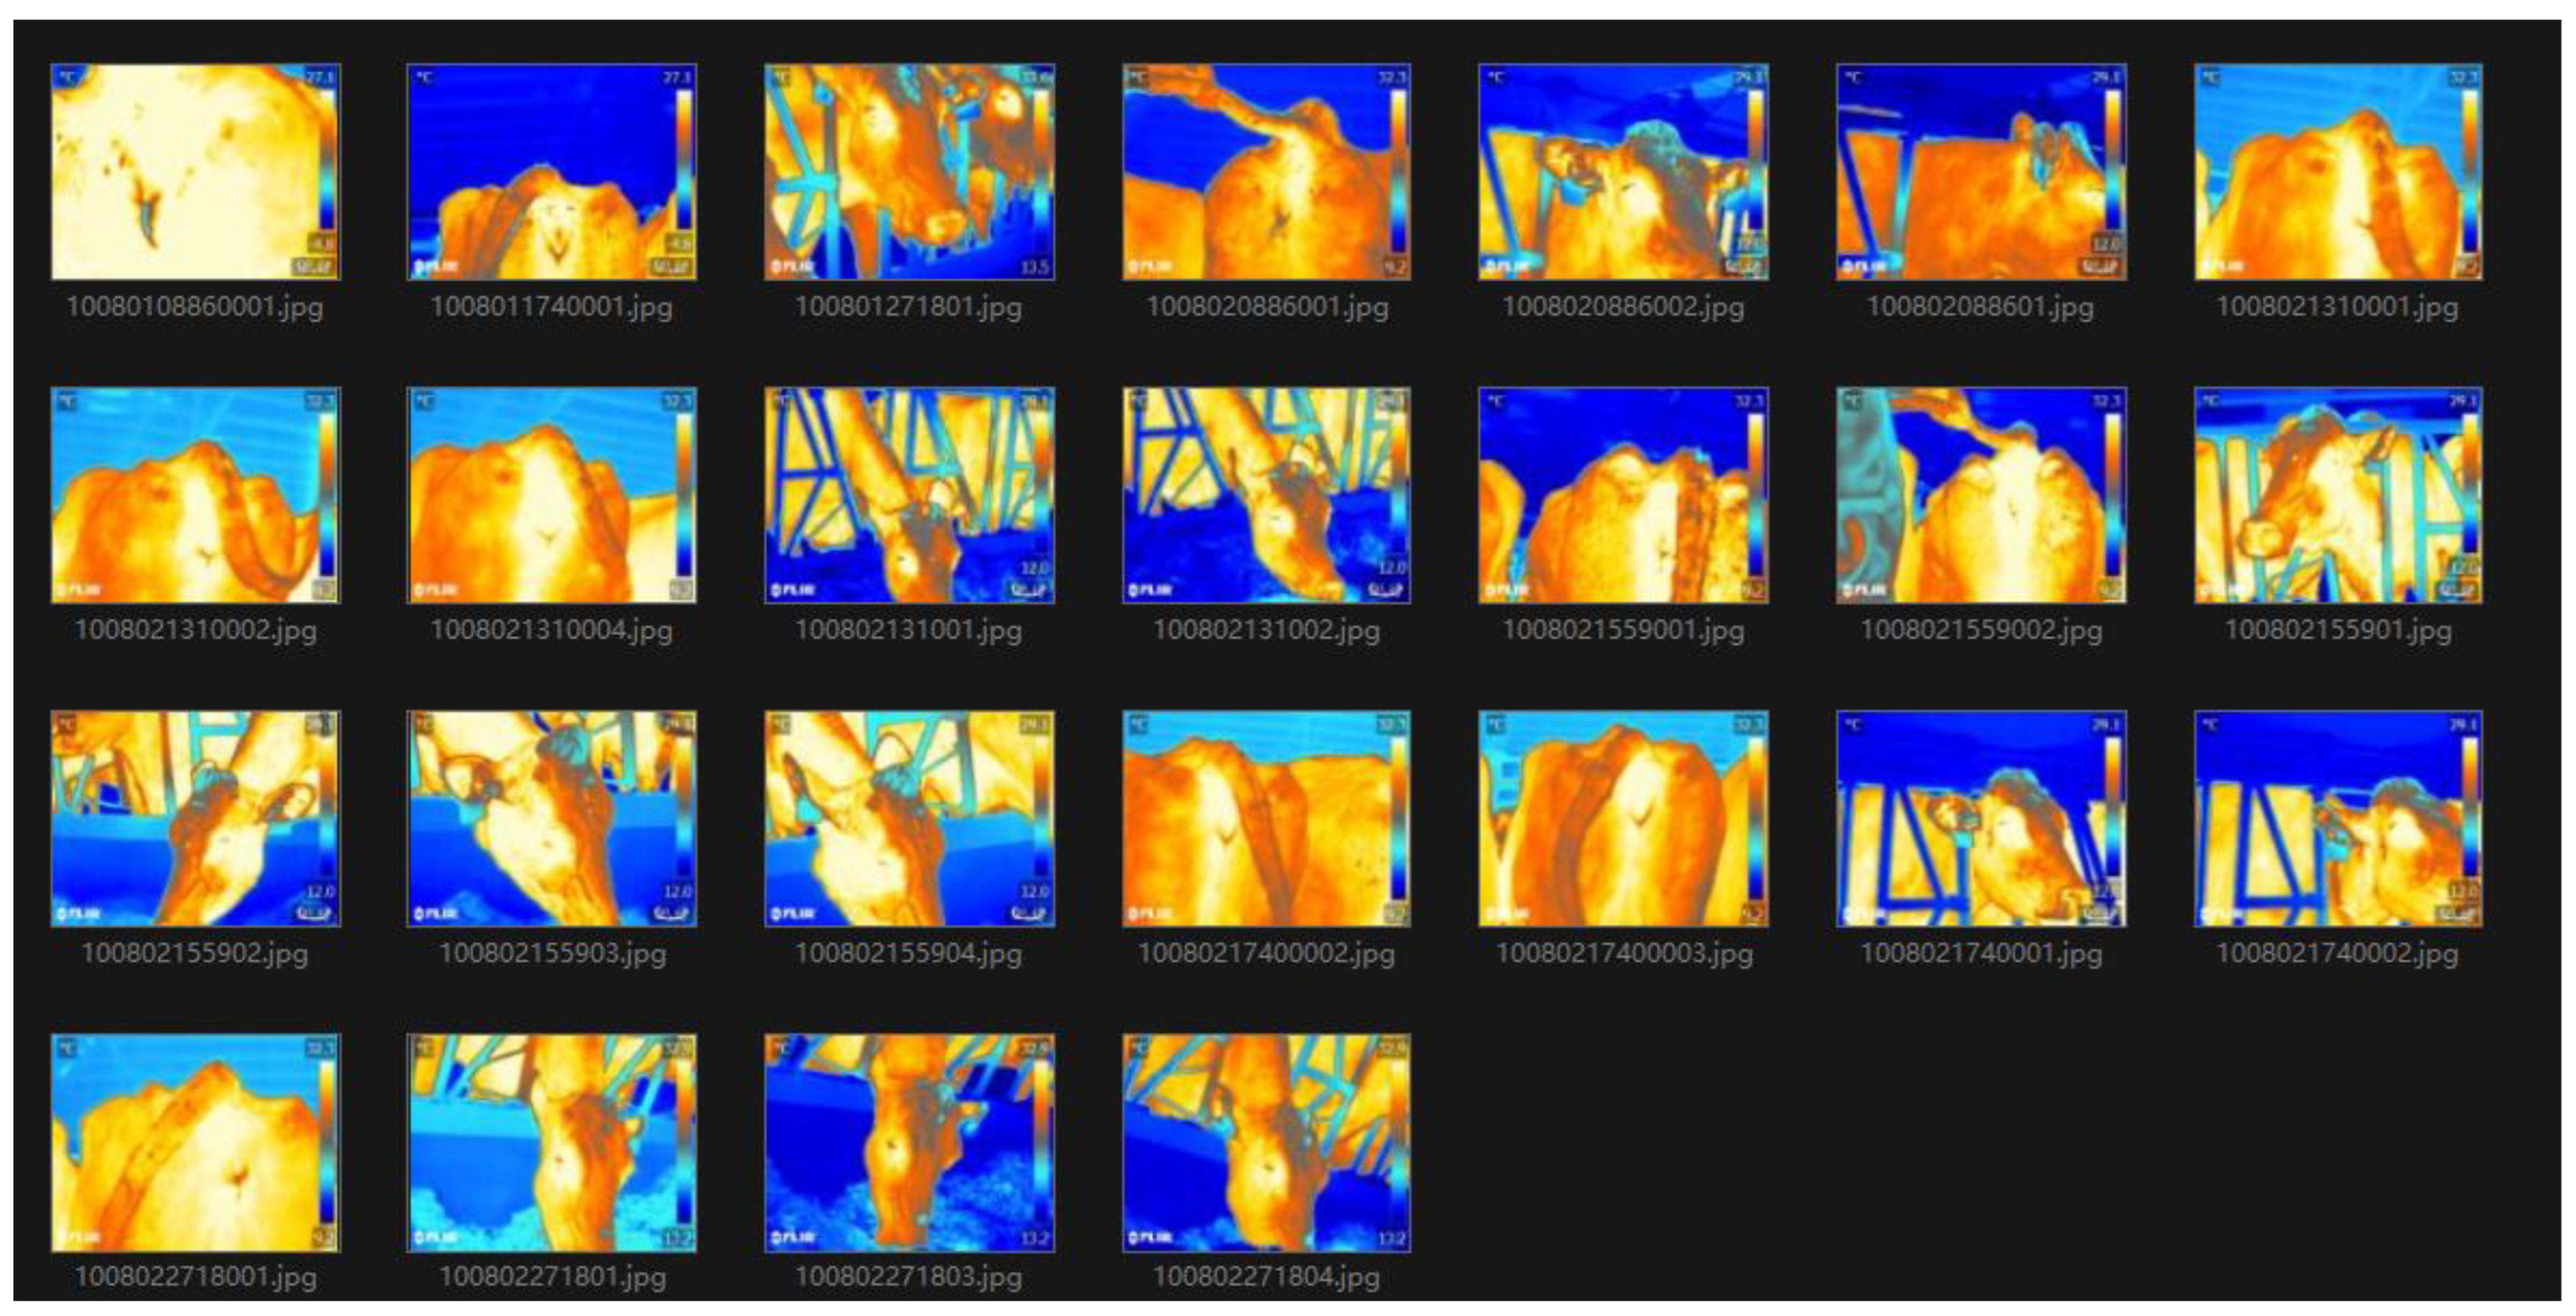
To ensure minimal interference with each cow, a combination of video recording and capture was used for the acquisition of the thermal infrared images of the cow’s vulva. The acquired thermal infrared video was stored in a “.seq” format at a frame rate of 30 frames per second (fps). The thermal infrared images of 320 × 240 pixels were exported to the “.jpg” format by the image analysis software. A total of 1242 thermal infrared images were acquired, with a resolution of 320 pixels × 240 pixels. In addition, 15 infrared video recordings were acquired, which were saved in an AVI format. The basic environmental information of the test subjects at the time of the thermal infrared image acquisition and carrying out the rectal detection method were recorded during the experiment. Moreover, data from additional cows in estrus were also collected to expand the experimental data. The shooting field of view is shown in Figure 2.
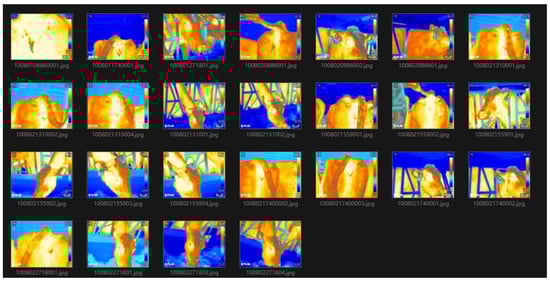
Figure 2.
Shooting field of view.
2.3. Ambient Temperature and Humidity Data Collection
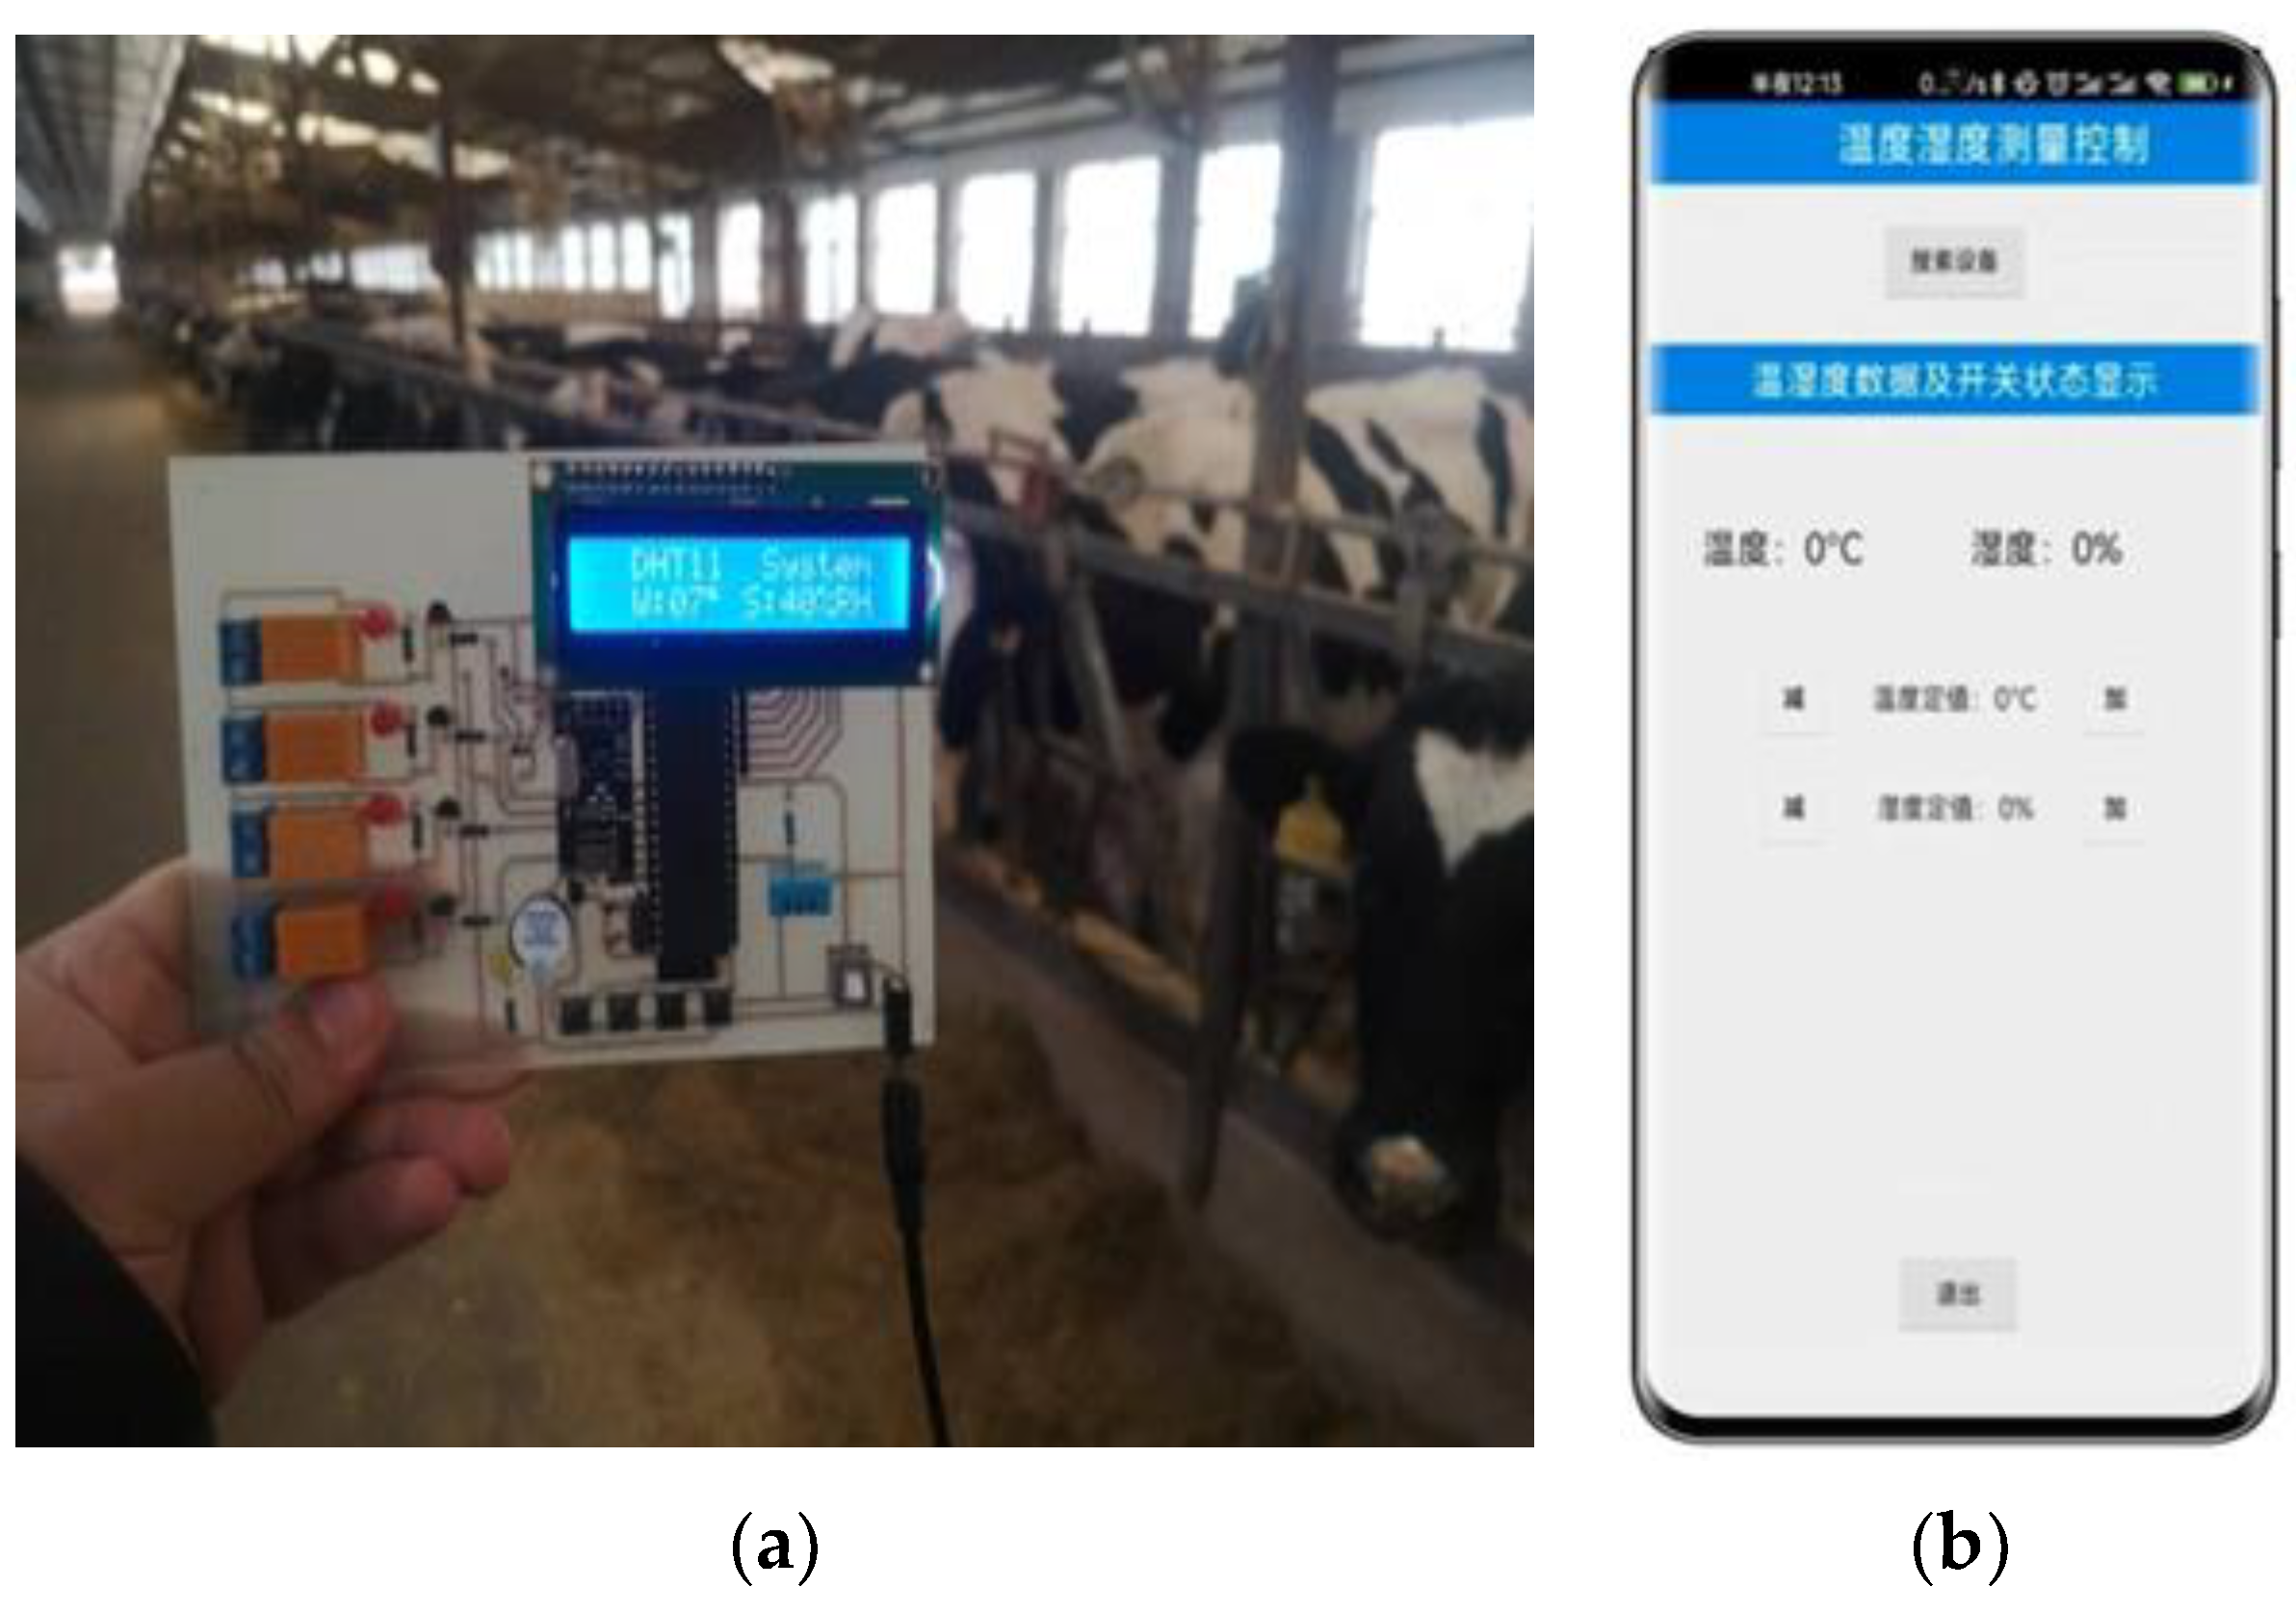
This study used a mobile temperature and humidity wireless acquisition device based on the STC89C52RC microcontroller, ESP8266WIFI module, DHT22 temperature and humidity acquisition module and LCD1602 module. This device was used to acquire the thermal infrared images of the cows’ eyes and vulvas, while simultaneously recording the ambient temperature and humidity. The physical diagram of the mobile temperature and humidity wireless acquisition device is shown in Figure 3b. Meanwhile, a temperature and humidity measurement and control APP was developed on a cell phone terminal to facilitate the recording and storage of the temperature and humidity data, as shown in Figure 3b.

Figure 3.
(a) Physical diagram of mobile temperature and humidity wireless collection device; (b) temperature and humidity measurement and control APP interface. “温度湿度测量控制” means Temperature and humidity measurement control; “搜索设备” means Search equipment; “温湿度数据及开光状态显示” means Temperature and humidity data and light status display; “温度” means Temperature; “湿度” means Humidity; “温度定值” means Temperature setting; “湿度定值” means Humidity setting; “加” means Addition; “减” means Subtraction; “退出” means Withdraw.
2.4. Experimental Data Pre-Processing
2.4.1. Normalization Process
In this study, the cow infrared images were normalized and pre-processed to effectively extract the cow infrared image features. The normalization process was implemented using the FILR TOOLS software, and the results are shown in Figure 4. The normalized infrared image features were more obvious when the eye area was brighter, indicating that the temperature was higher. In contrast, the head, face, ear and other areas had a lower infrared temperature due to the influence of back hair and mucus. Furthermore, the vulvar area had a lower temperature at the lower side of the vulva due to factors such as cow excretion and secretion.
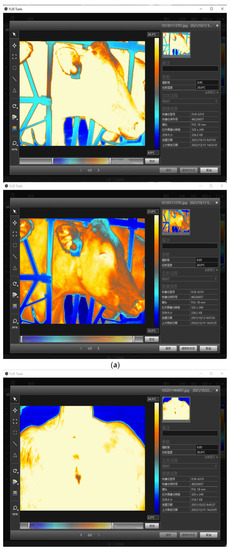
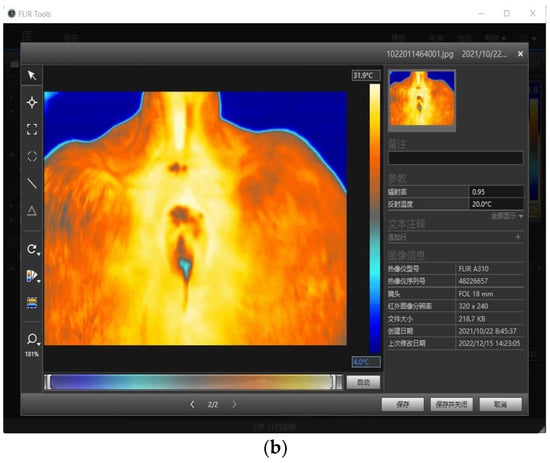
Figure 4.
Comparison of thermal infrared images of dairy cows before and after normalization. (a) Comparison of cow’s head before and after normalization treatment; (b) comparison of cow’s vulva before and after normalization treatment. “备注” means Remarks; “参数” means Parameters; “辐射率” means Irradiance; “反射温度” means Reflection temperature; “全部显示” means Show all; “文本注释” means Text notes; “添加行” means Add lines; “图像信息” means Image information; “热像仪型号” means Thermal imager model; “热像仪序列号” means Serial number of thermal imager; “镜头” means Lens parameter; “红外图像分辨率” means Infrared image resolution; “文件大小” means File size; “创建日期” means Creation date; “上次修改时间” means Last modification time; “自动” means Auto; “保存” means save; “保存并关闭” means save & close; “取消” means cancel.
2.4.2. Thermal IR Image Correction
Considering that the accuracy of the temperature measurement of the thermal imaging camera was easily affected by the environment, the data of the ambient temperature and humidity were corrected in this study. The designed mobile temperature and humidity wireless acquisition device was used to obtain the ambient temperature and humidity, data, and it was calibrated using the calibration formula shown in Equation (1):
where was the surface temperature of the measured object, tu was the ambient temperature, n was the thermal imaging camera parameters, and ε was the measured object that indicated the radiance.
The collected temperature and humidity data were manually input into the FLIR TOOLS software, as shown in Figure 5. The data included the highest temperature, lowest temperature and average temperature in the same area of the eye region before and after a temperature and humidity correction. The correction means could effectively exclude the influence of environmental factors on the measured temperature, and at the same time, could accurately obtain the characteristic profile temperature values.
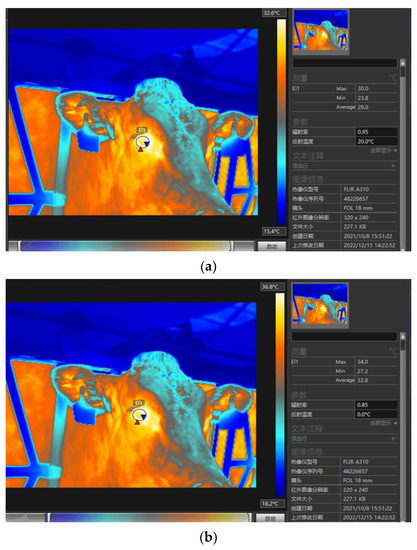
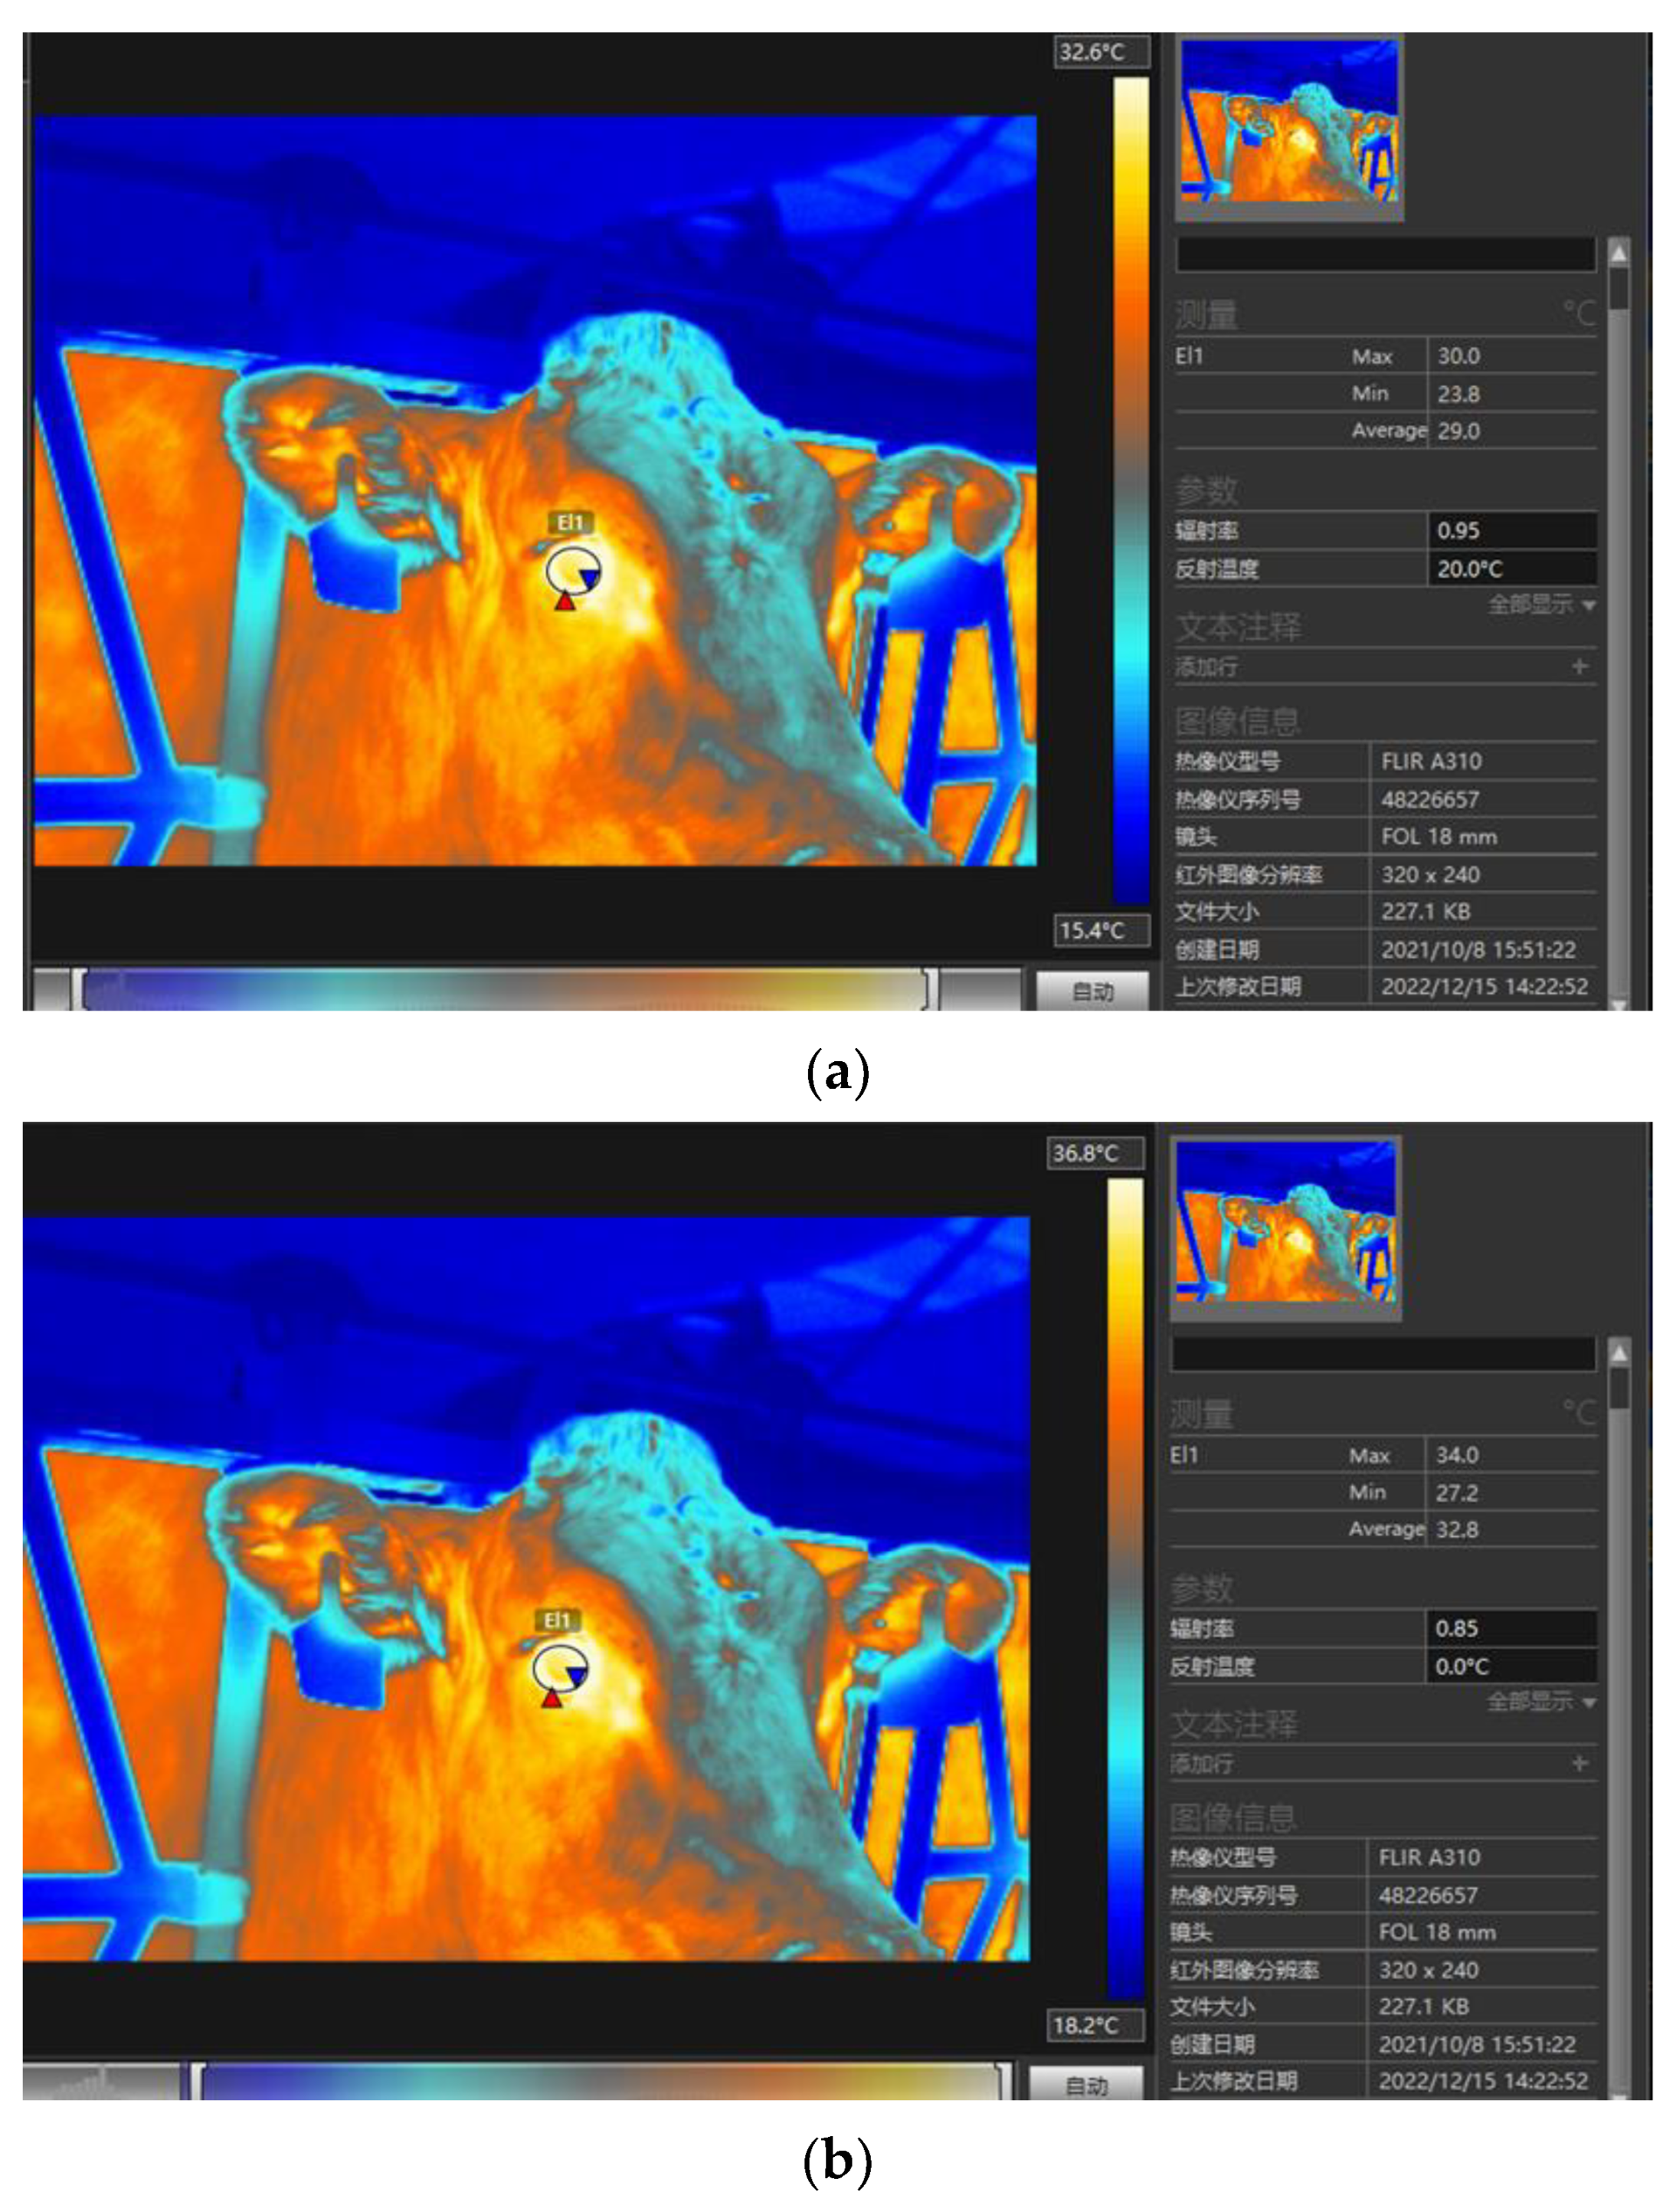
Figure 5.
Comparison before and after thermal infrared image correction. (a) Max: 30.0 °C, min: 23.8 °C, average: 29.0 °C, with thermal infrared image parameters before temperature and humidity correction. (b) Max: 34.0 °C, min: 27.2 °C, average: 32.8 °C, with thermal infrared image parameters after temperature and humidity correction. “测量” means Measurement; “参数” means Parameters; “辐射率” means Irradiance; “反射温度” means Reflection temperature; “全部显示” means Show all; “文本注释” means Text notes; “添加行” means Add lines; “图像信息” means Image information; “热像仪型号” means Thermal imager model; “热像仪序列号” means Serial number of thermal imager; “镜头” means Lens parameter; “红外图像分辨率” means Infrared image resolution; “文件大小” means File size; “创建日期” means Creation date; “上次修改时间” means Last modification time. “自动” means Auto.
2.4.3. Thermal IR Image Feature Extraction
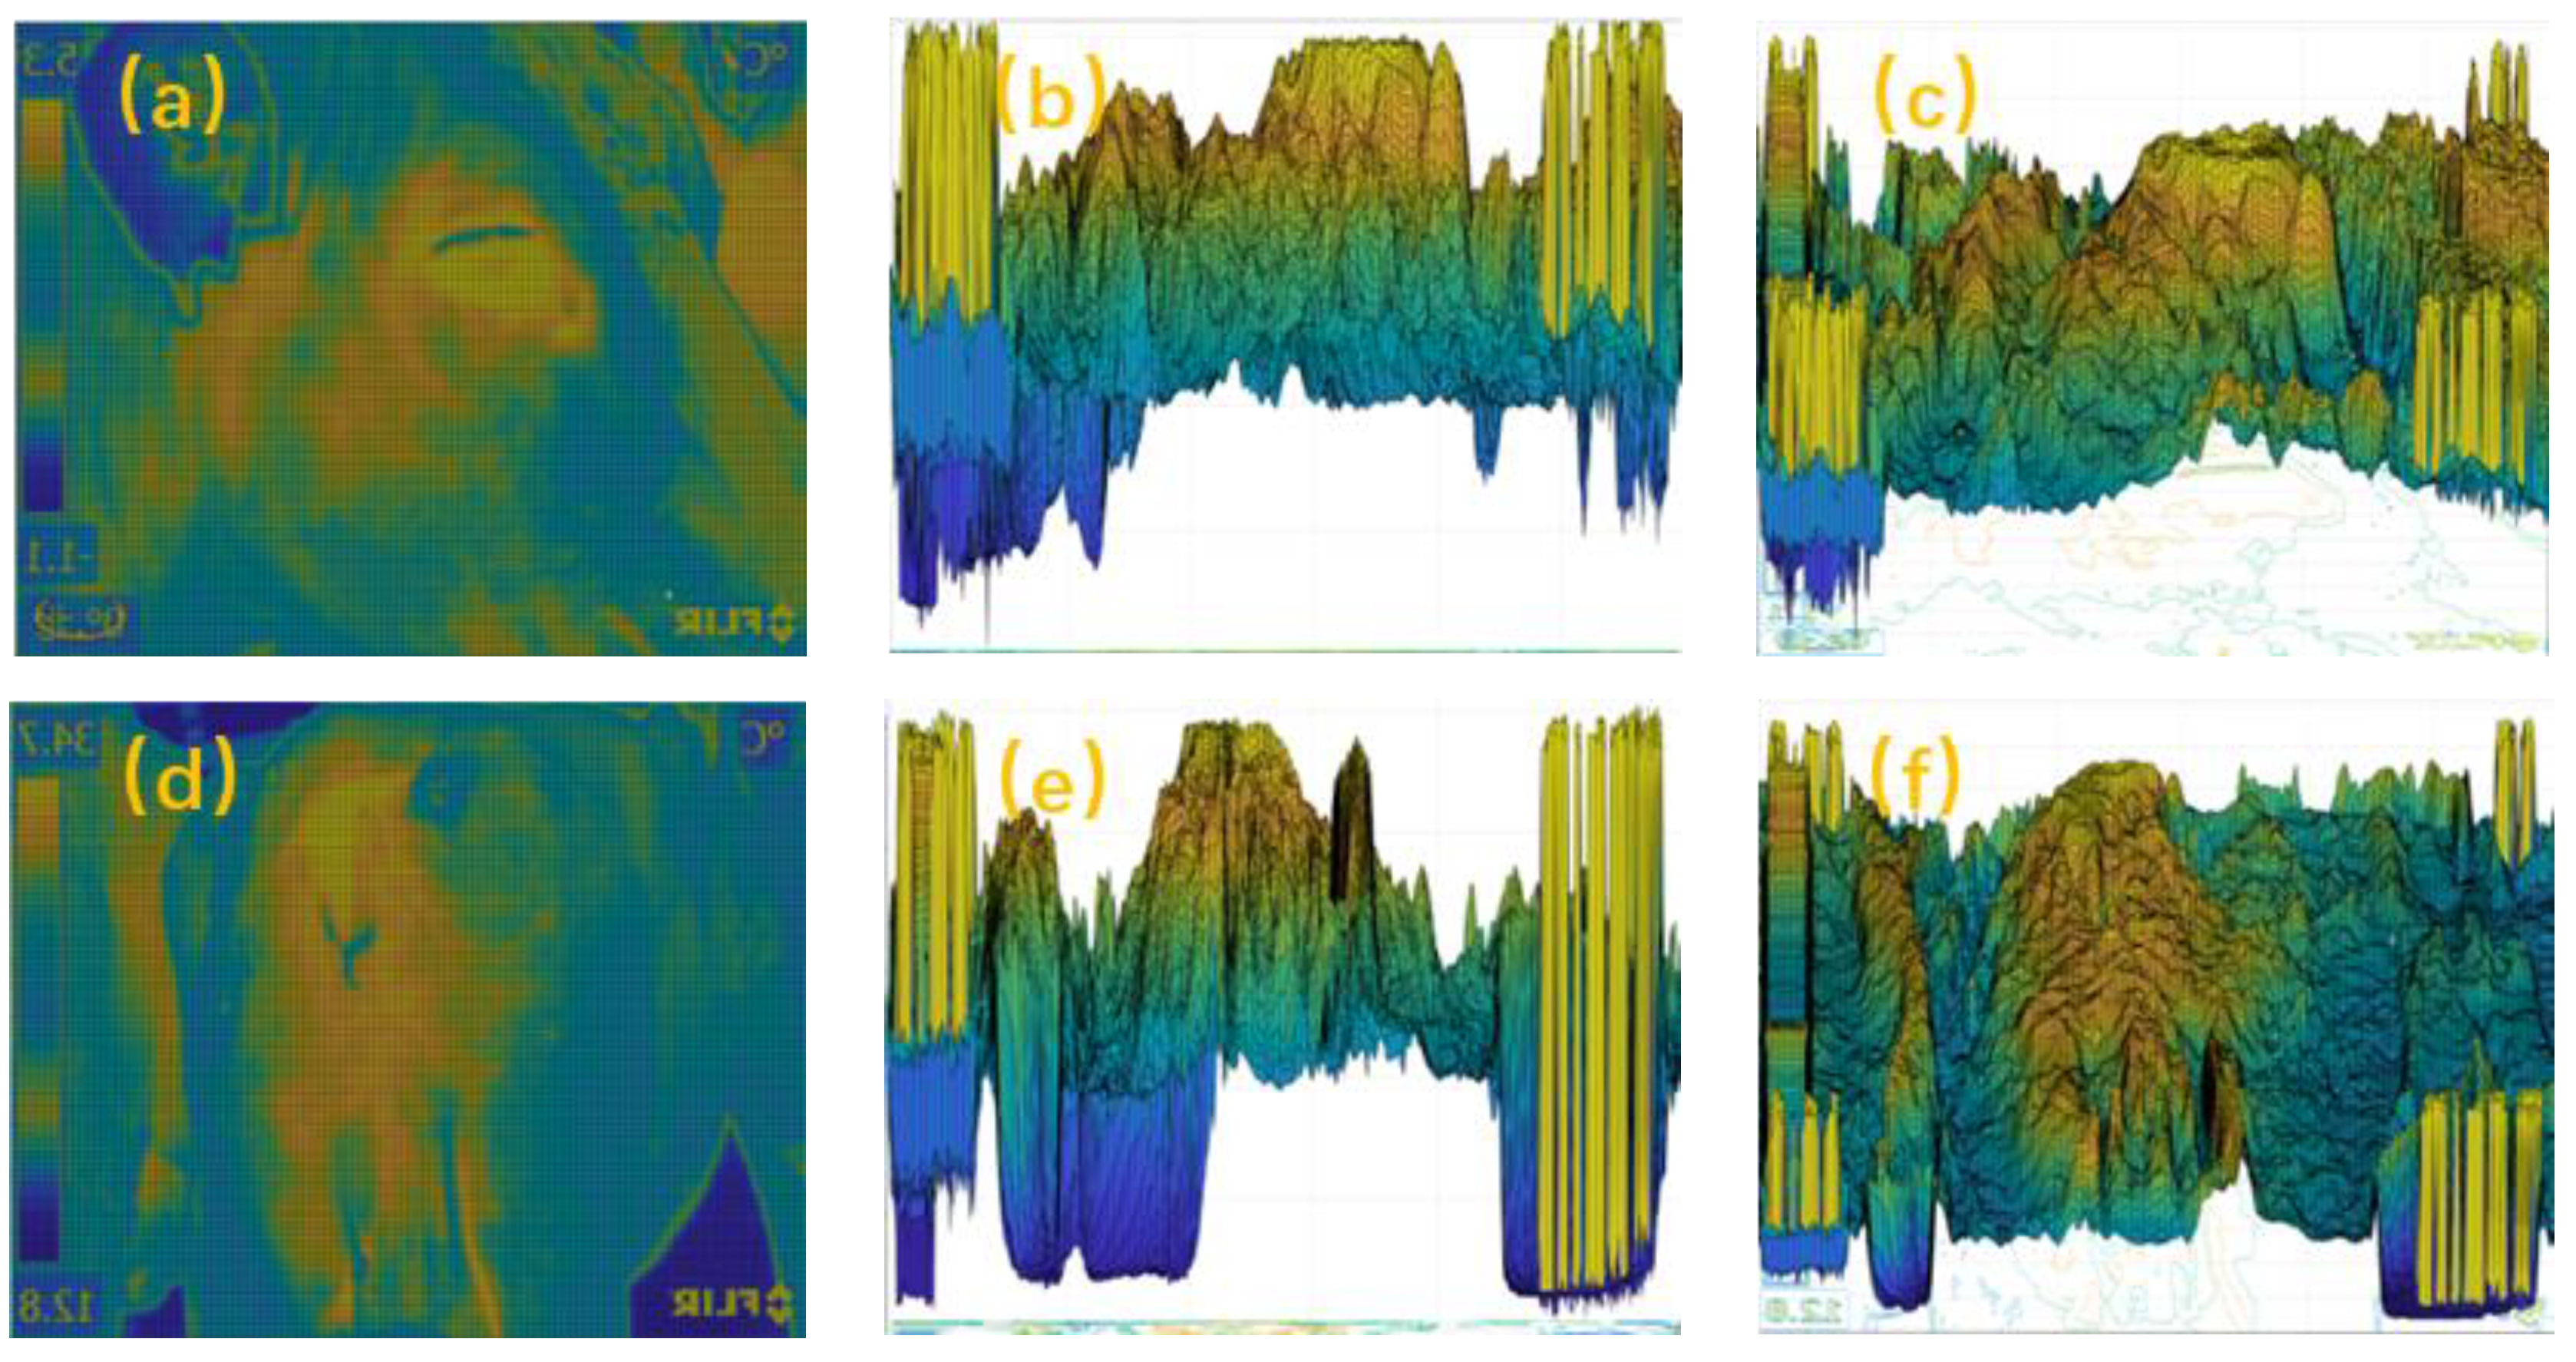
After normalization and correction for the environmental temperature and humidity, the characteristic contours of the cows’ eyes and vulvas at different temperatures were obtained using three-dimensional variation, as shown in Figure 1. The characteristic parts of the eye region are shown in the yellow boxed area in Figure 6a–c, and the characteristic parts of the vulvar region are shown in the yellow boxed area in Figure 6d–f. Among them, the heights in Figure 6b,e are infrared temperature values, and it can be seen that the eye and vulvar regions had higher and more concentrated temperatures and large block areas.
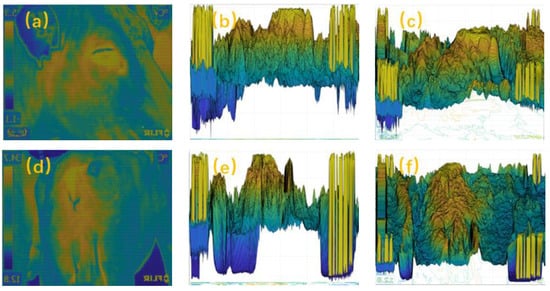
Figure 6.
Thermal infrared image feature map. (a) Eye plan view, (b) eye rotated 90° stereo view, (c) eye rotated 30° stereo view, (d) plan view of vulva, (e) stereoscopic view of 90° rotation of vulva, and (f) stereoscopic view of 30° rotation of vulva.
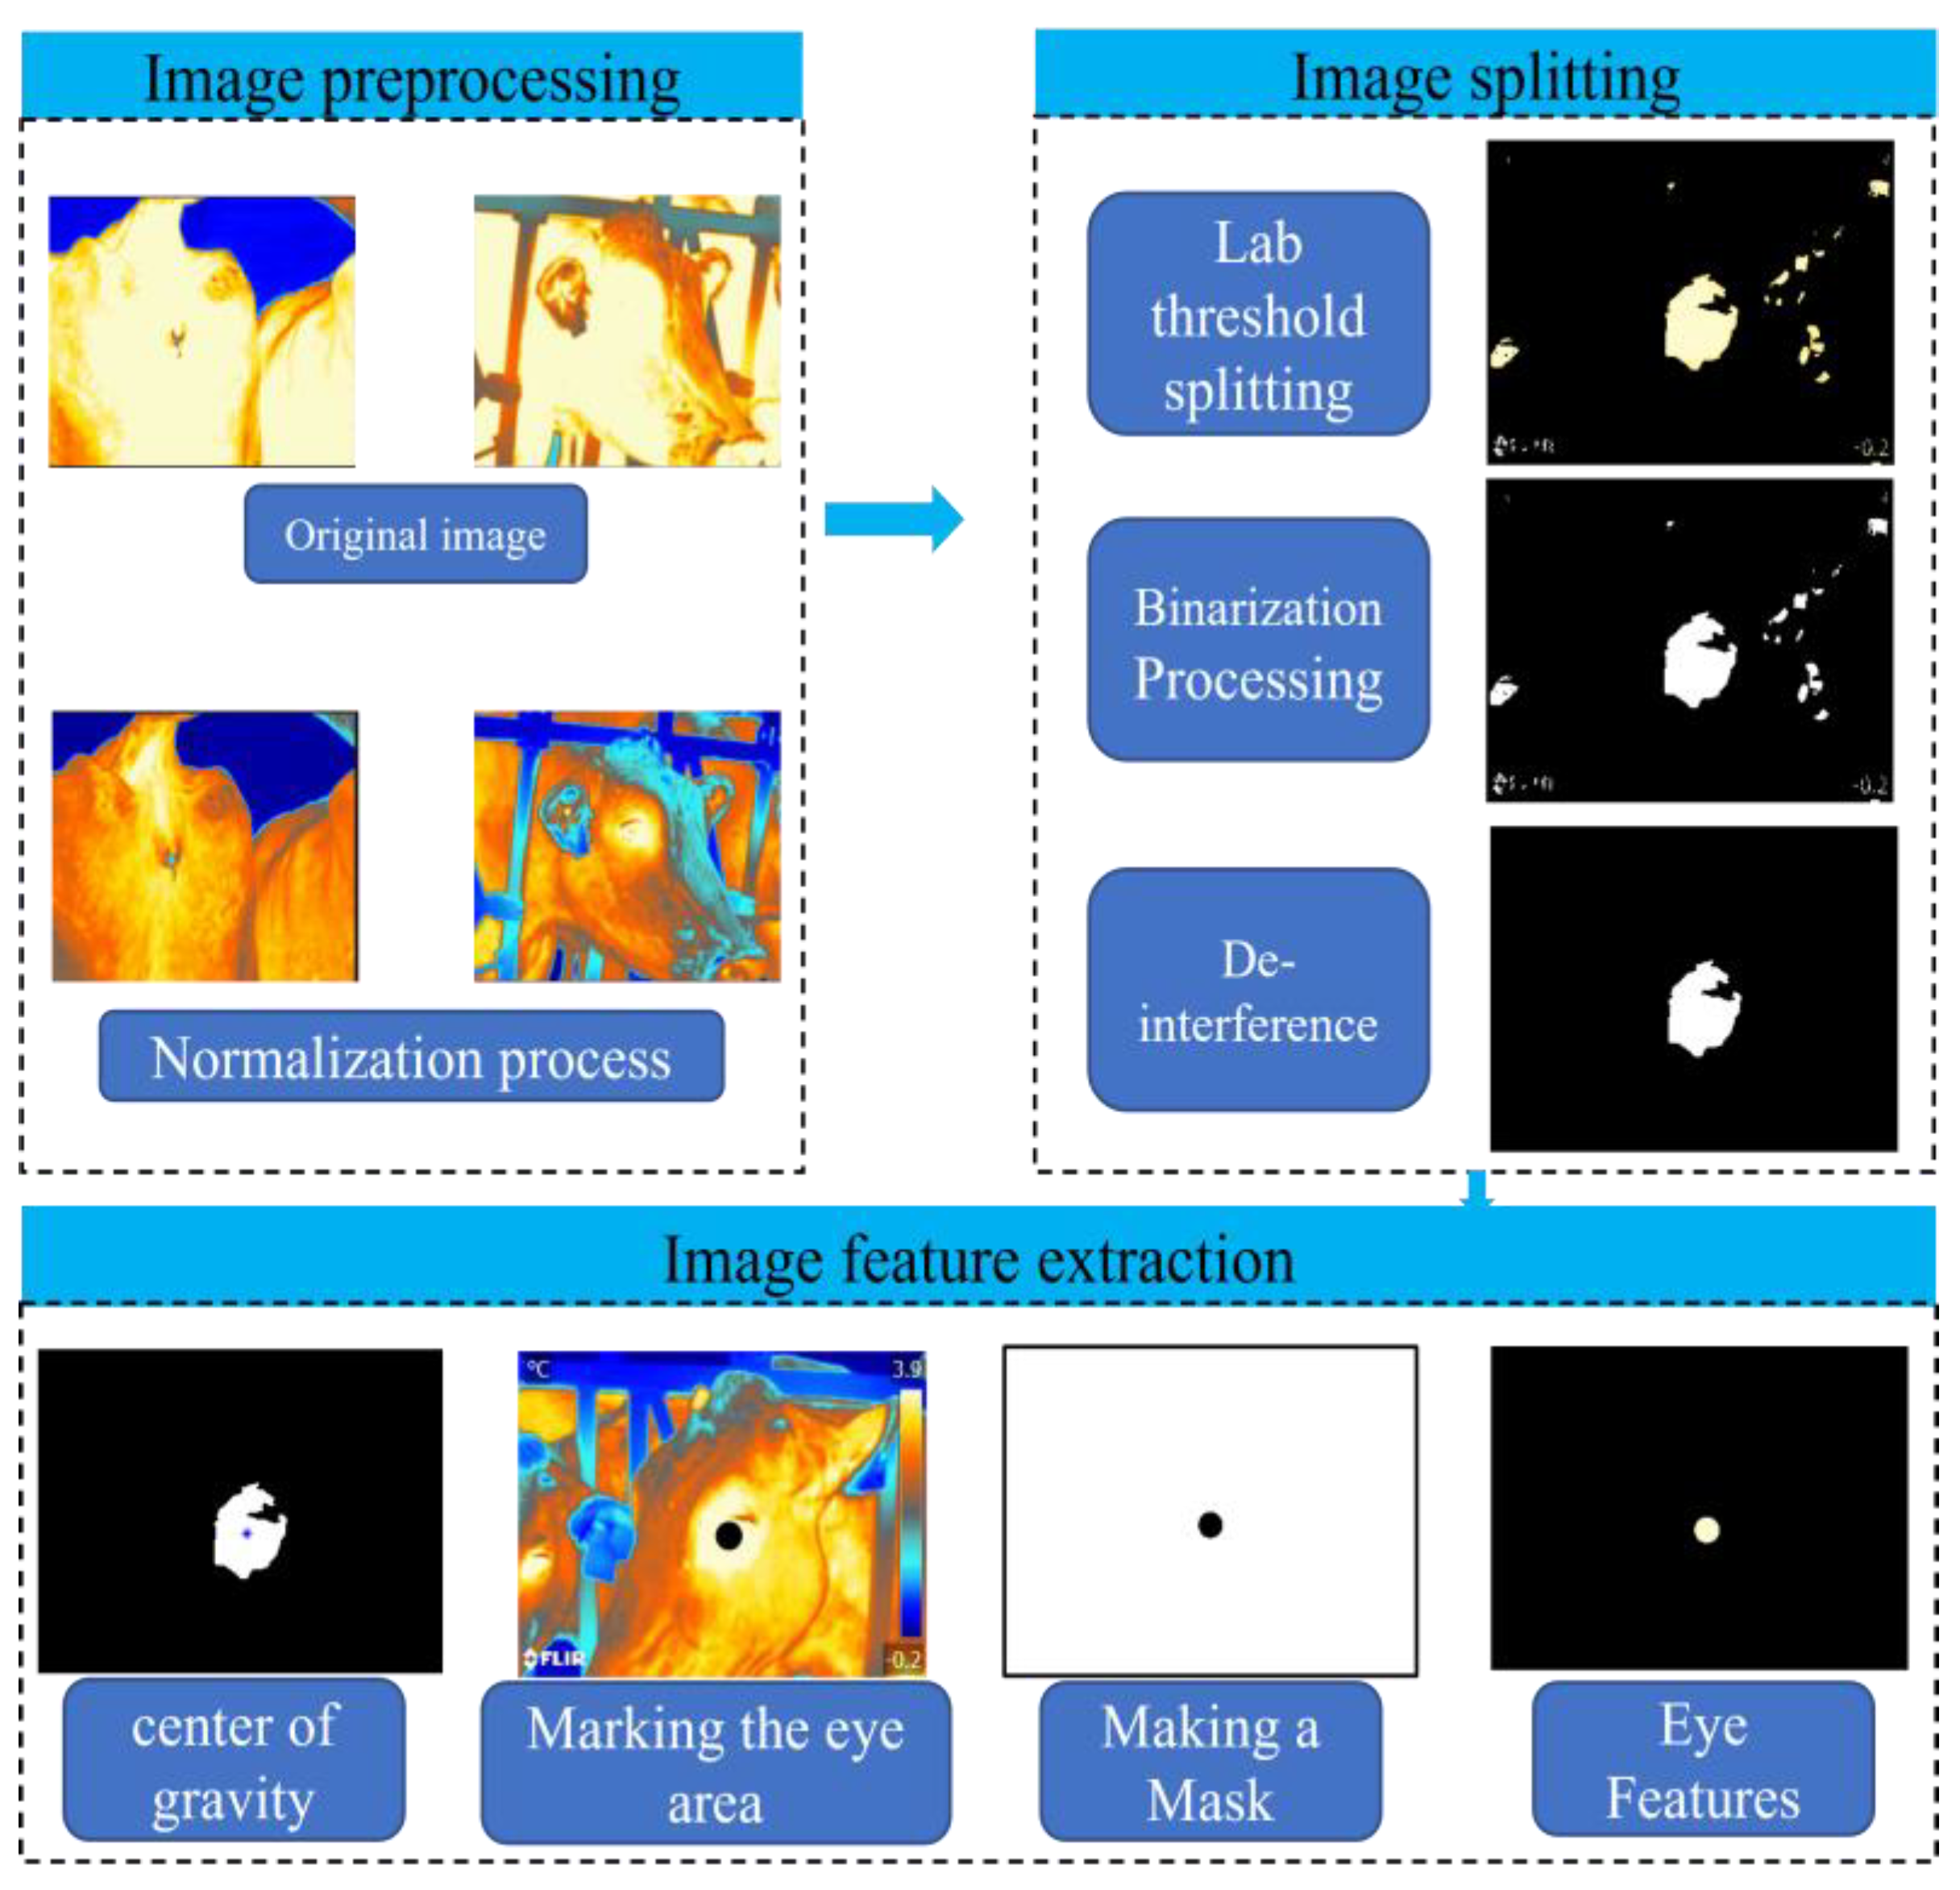
Due to the more complex shooting background, there were other regions with a higher temperature in the infrared images, which increased the difficulty of the eye and vulva identification. To this end, this study proposed a lab-color-space-based infrared feature extraction method based on the characteristics of the thermal infrared image database of the eyes and vulvas of cows. This can be divided into three parts: pre-processing, image segmentation processing, and an image feature extraction, using the size of the feature area of the thermal infrared image in the eye and vulva to remove interference. Taking the image of a cow eye area as an example, the calibration of the image center of mass was automatic. The processing of the infrared images by this method is shown in Figure 7.

Figure 7.
Flow chart of lab-color-space-based image extraction method.
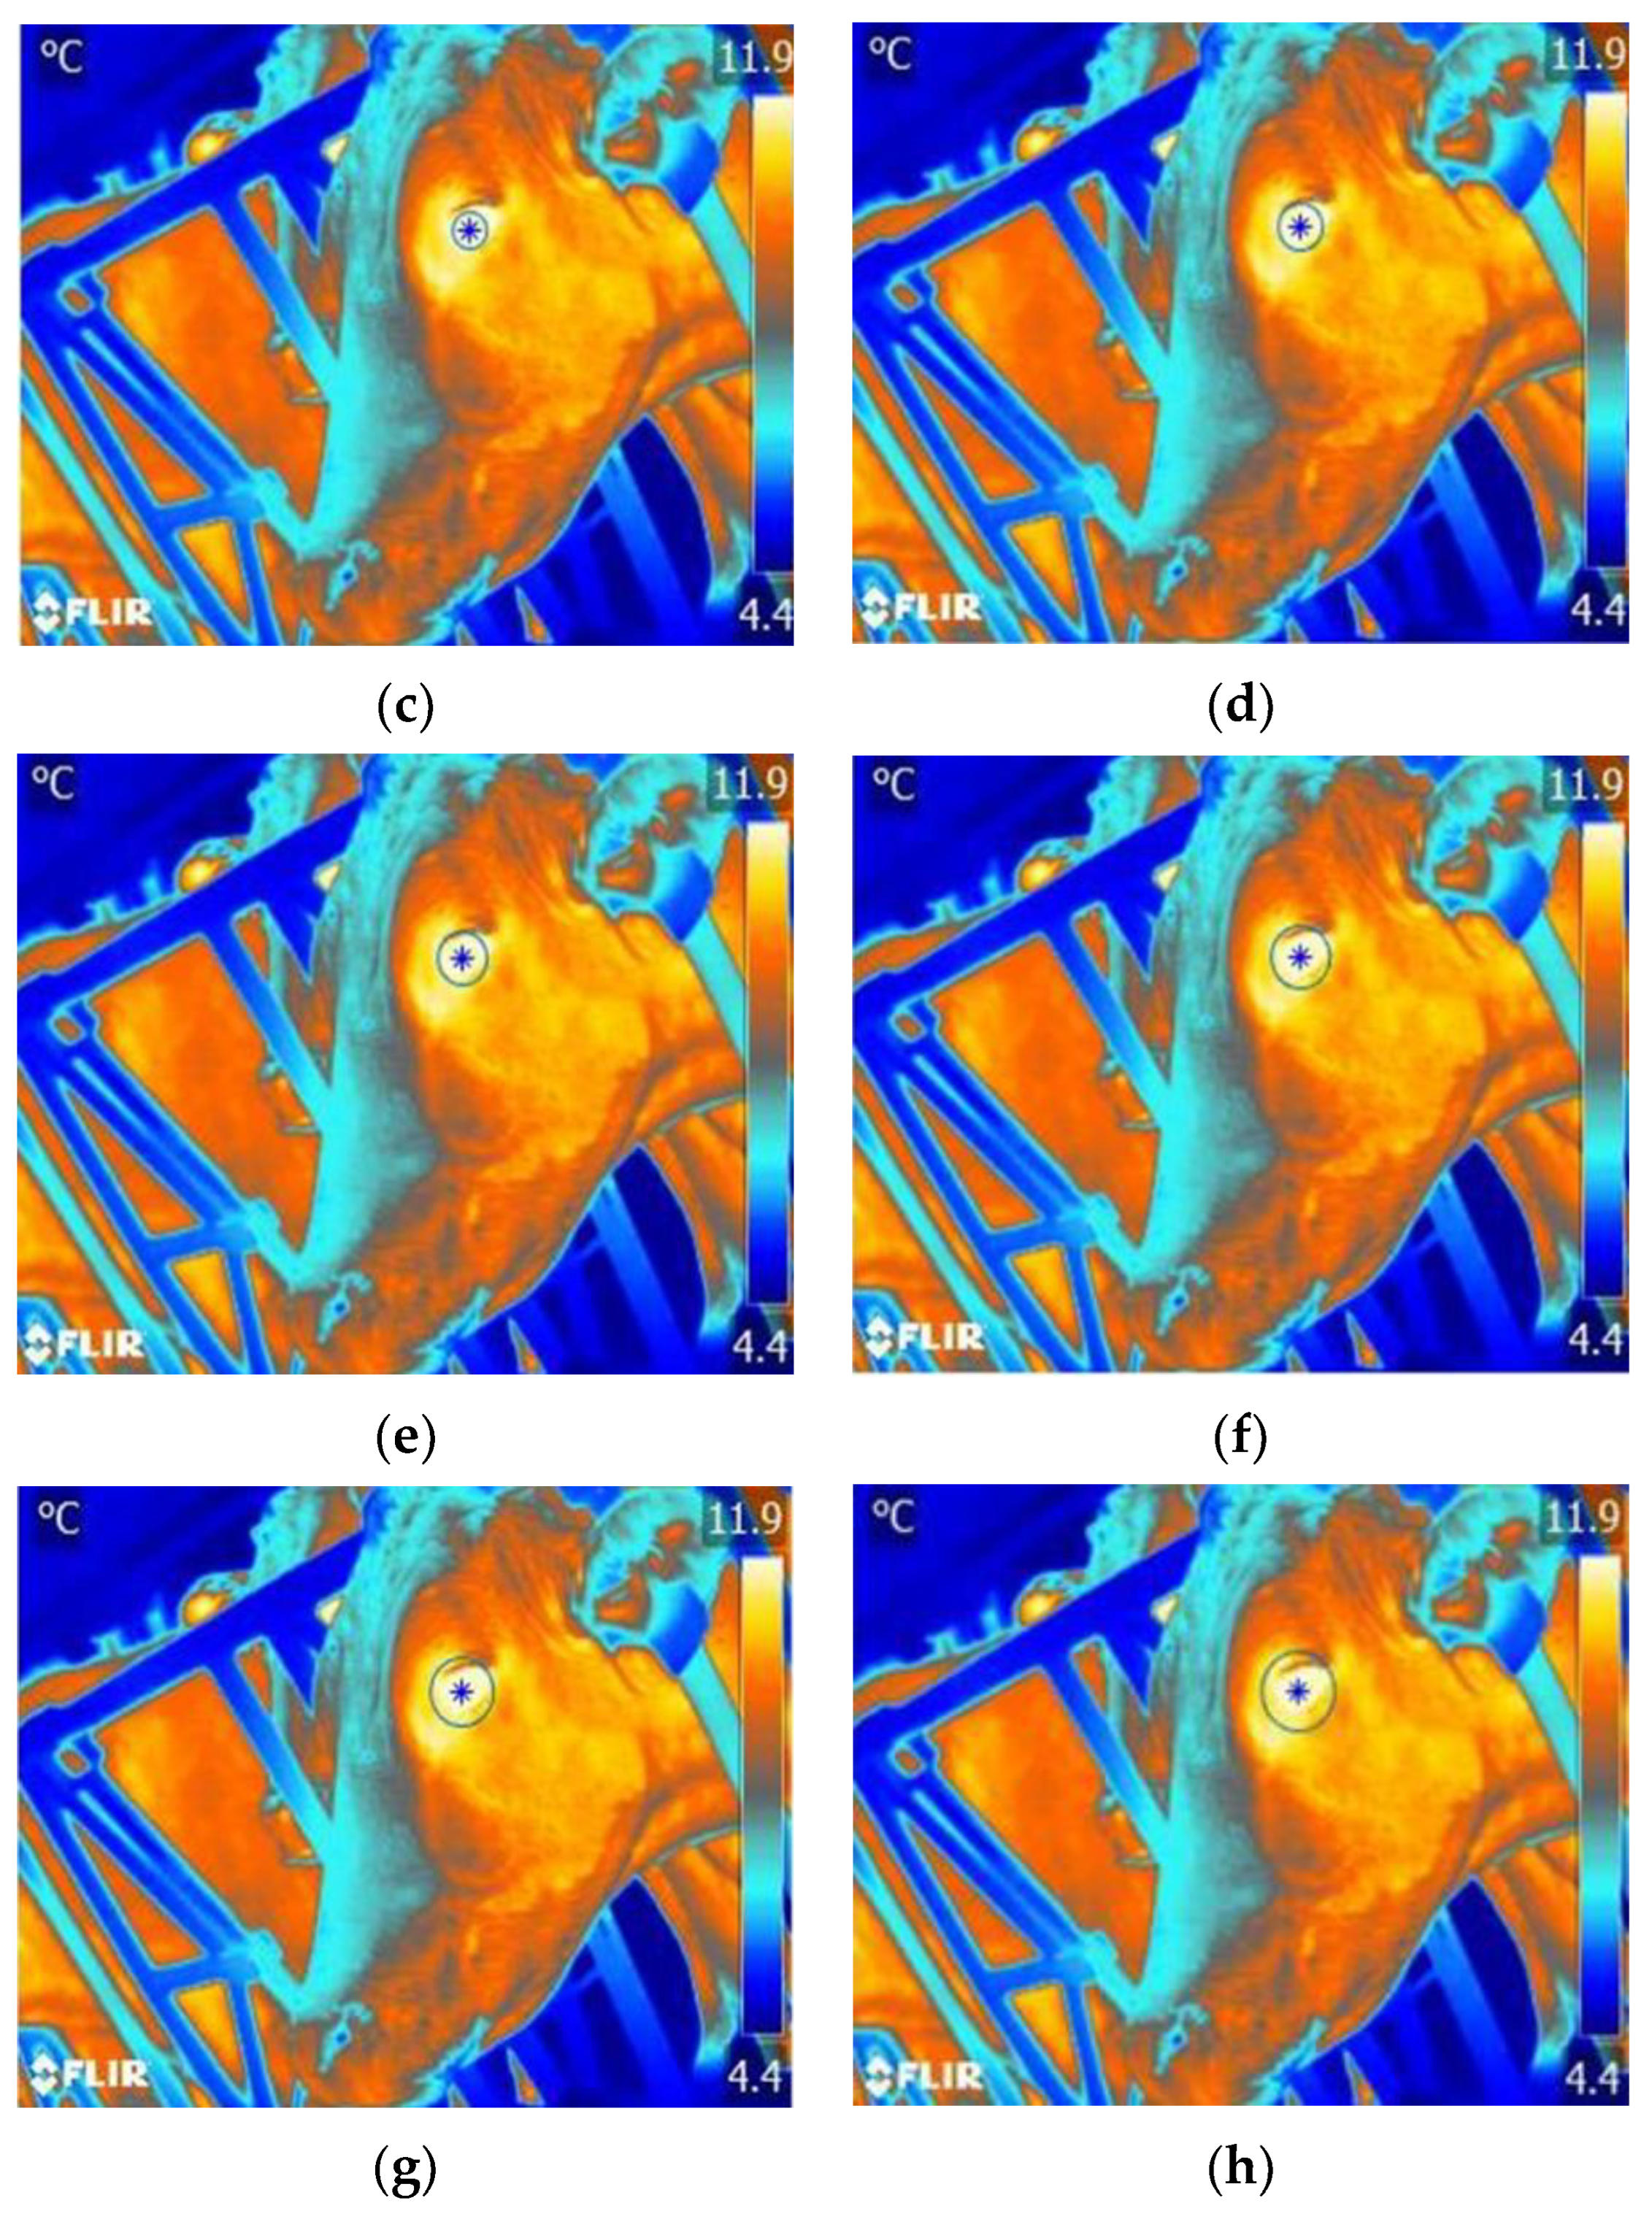
Experimentally, we found that the cows exhibited slight movements during the feeding and shooting process, resulting in irregular image contours in the image segmentation; therefore, this paper used the calculation method of the center of mass of irregular images to determine the specific locations in the eye and vulva. In addition, it used the center of mass as the center of a circle to further determine the specific ranges of the cow’s eye and vulva. Assuming that Figure 8 was a uniformly distributed plane, this paper used Equation (2) to calculate the center of mass of the irregular plane figure, i.e., the location of the center of mass in the eye and vulva. In addition, it used the center of mass as the center of a circle and r as the radius to further determine the specific contours of a cow’s eye and vulva:
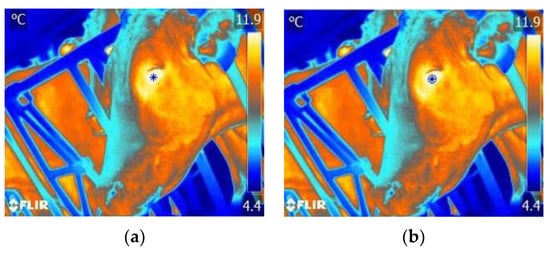
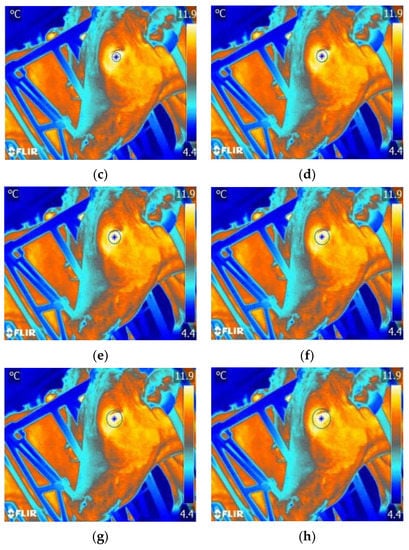
Figure 8.
Results of eye marking of cows with different radii. (a) r = 0, (b) r = 5, (c) r = 10, (d) r = 12, (e)r = 14, (f) r = 16, (g) r = 18, and (h) r = 20.
3. Construction of an Estrus Identification Method for Dairy Cows
3.1. Establishment of a Database of Thermal Infrared Temperatures of Cows in Heat
The infrared characteristic data (i.e., the maximum temperature, minimum temperature and average temperature) in the eye and vulva of cows were used as the input quantity. In addition, the estrus judgment arising from the rectal detection method on the same day was used as the output quantity (i.e., the estrus marker was 1 and the non-estrus marker was 0) to establish the cow estrus thermal infrared temperature dataset. The infrared images obtained during the test period were screened. Furthermore, the key frame extraction operation was performed on the infrared video to select the infrared images with a high definition, containing less than or equal to two heads of the target cows. A total of 1000 infrared images were tested. According to the proportion of cows in heat and cows not in heat, a fixed proportion of the data were randomly selected, and a total of 120 datasets of cows in heat and 280 datasets of cows not in heat were finally selected, giving a total of 400 datasets from which to construct the infrared temperature dataset of cows in heat.
3.2. A LOGISTIC-Based Method for Identifying Cow Estrus Behavior
LOGISTIC models belong to probabilistic nonlinear regression, which is a multivariate analysis method to study the relationship between dichotomous observations and some influencing factors [27,28]. Assuming that there are n features and z labels, and that each feature is multiplied by a regression coefficient ω, a regression equation for labels and features can be established, as shown in Equation (3):
Converting this to a vector representation, Equation (3) can be expressed as:
Bringing into Sigmoid function yields:
and when , it can be divided into a class. Supposing the input was (where x is the thermal infrared temperature and is the K-order vector of the thermal infrared temperature), then the output is . In this paper, 0 indicated cows not in heat and 1 indicated cows in heat. The connection function logit(p) function is shown in Equation (6):
In this paper, we set the parameter vector for the infrared temperature parameter vector as:
The incremental vector of IR temperature x was:
Thus, logit(p) can be expressed as:
and when the output Y remains unchanged, the input x can become a function of the divisible Hilbert space L2 (T), then the LOGISTIC regression model can become a LOGISTIC binary model:
where α is the infrared temperature parameter and β(t) is the infrared temperature parameter function.
A further assumptions is that:
The final dichotomous model relationship equation is then obtained as:
Both Equations (11) and (13) can be expressed as a LOGISTIC model for binary classification.
The parameters of the LOGISTIC model were set as follows: the number of features was set as six, features = size (data, six); the learning rate was 0.01, delta = 1; and the regular term coefficient was 0.2, lambda = 0.2.
3.3. SVM-Based Method for Identifying Cow Estrus Behavior
A support vector machine (SVM) can be used as the simplest and most effective linear classifier, showing many unique advantages in solving small samples, and nonlinear and high-dimensional pattern recognition [29,30]. It can be used for supervised learning classifications and can also be seen as a generalized form of a perceptual machine, where the SVM finds such a set of parameters from inside the optimal parameters obtained from the perceptual machine, and the shortest distance from the hyperplane determined by this parameter to the two classes of sample points is maximized.
Letting the shortest distance from the classification hyperplane to the two types of sample points be r, then the distance from any sample point to the hyperplane is:
Therefore, as long as ω and the displacement b are determined, it is possible to determine the only dividing hyperplane, based on the KKT (Karush–Kuhn–Tucker) condition, and the Lagrange formula can be derived to determine the boundary expressions of the dividing hyperplanes A1 and A2 as:
The number of support vector points was l, because most of the points were not support vector points; only the individual points on the marginal hyperplane were support vector points. Then, we simply summed the support vector points. was the feature vector of the cow infrared features; was the category marker (if the cow was in heat, it was marked as 1, and if it was not in heat, it was marked as −1); was the infrared temperature data tested; and the parameters of the SVM binary classification model were set as follows: choosing the e-SVR linear kernel function, and setting the e-SVR loss function C to 0.45 and P to 0.01, the value of g in the linear kernel function was 0.03125.
3.4. Identification Method Evaluation Index
Based on the common evaluation metrics for machine learning classification problems [31,32] and the related literature [33,34,35], this paper identified the evaluation metrics for cow estrus recognition trials as the error rate, recall rate and special effects. In the cow estrus behavior identification test, the positive category referred to cows in estrus and the negative category referred to cows not in estrus. The meanings and calculation formulae of each index were as follows.
- (1)
- Error rate: this index describes the relationship between the number of false estrus warning samples FP and the number of detected estrus samples during estrus recognition in cows, and measures the occurrence of false alarms during estrus behavior recognition. The lower the error rate, the fewer false alarms are present in the estrus identification:
- (2)
- Recall: referred to as sensitivity in some of the estrous behavior recognition literature; this metric reflects the probability that the target category will not be reached. A higher recall rate indicates a better classification of the model:
3.5. Estrus Behavior Identification
The accuracy validation of the estrus behavior recognition test involved testing the effectiveness of the method, i.e., whether the error rate could be reduced while the accuracy of estrus behavior recognition was guaranteed. The cow infrared temperature dataset was divided into a training set and a test set according to the ratio of 7:3, and was brought into the LOGISTIC model and SVM model. Each algorithm was run five times to calculate the average detection rate as a basis. To further validate the effectiveness of the cow estrus recognition model, models featuring the maximum, minimum and average temperatures of the eye and vulva, and models featuring the maximum temperatures of the eye and vulva were developed. The results of the cow estrus behavior recognition test are shown in Table 1.

Table 1.
Results of recognition test on the estrus behavior of dairy cows.
It can be seen from Table 1 that the detection rate of the estrus behavior of cows, with the highest temperatures of the eyes and vulvas as the input data, was higher than that with the highest, lowest and average temperatures of the eyes and vulvas as the input data. When the maximum temperatures of the cows’ eyes and vulvas were taken as the input, the detection rate of estrus based on the LOGISTIC model was 82.37%, and the detection rate of estrus based on the SVM model was 81.42%; therefore, the recognition result of cow estrus based on the LOGISTIC model was more reliable. Consequently, this method can more accurately identify the estrus behavior of cows, which is conducive to the promotion of cow breeding.
4. Results and Discussion
4.1. Optimal Segmentation Profile of Dairy Cows’ Eyes and Vulvas
Taking a thermal infrared image of a cow’s eye as an example, the labeling results were obtained with the contour parameters of radius r as 0, 5, 10, 12, 14, 16, 18 and 20, as shown in Figure 8.
Furthermore, the maximum, minimum and average temperatures in the marked area at different radii r contours were obtained for the eyes and vulvas of cows not in heat, and for the eyes and vulvas of cows in heat, as shown in Table 2 and Table 3 (where the ambient temperature was 10 °C and humidity was 70%).
Table 2.
Data table of maximum, minimum and average eye temperatures of anestrous and estrous cows with different profiles.
Table 3.
Data table of maximum, minimum and average temperatures of the vulva of anestrous and estrous cows with different profiles.
As can be seen from Table 2 and Table 3, when r = 0, it was only divided into one temperature point, which could not represent the eye and vulva region. In the interval from r = 5 to r = 20, the maximum temperature did not change with the increase in the contour range, and the minimum and average temperatures decreased, especially when r was increased to 14. The minimum and average temperature values decreased faster, which was due to the presence of eyelashes and skin around the cow’s eye and the effect of hair on the surface of the vulva. Therefore, in this paper, the thermal infrared images were divided into two categories, the eye and vulva, with different r values. The size of the r value was adjusted by increasing it by 0.5 within r = 12 to r = 14, and the maximum, minimum and average temperatures in the segmented area were counted. The results are shown in Table 4.
Table 4.
Data table of maximum, minimum and average temperatures of vulva of anestrous and estrous cows with different profiles.
Considering the overall segmentation effect of the segmentation radius to the cow’s eye and vulvar area, and the difference between the minimum and maximum temperatures in the segmentation area was ≤5 °C. It was finally determined that the cow’s eye area had a good generalization and marking effect when r = 12 was selected; the effect was better when r = 12.5 was selected for the cow’s vulvar area. The treatment results are shown in Figure 9 below.
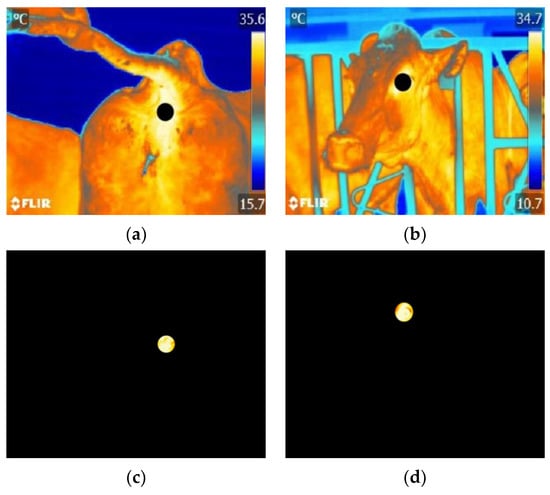
Figure 9.
Infrared image feature map of the eye and vulva. (a) Marker map in the vulva, (b) marker map in the eye, (c) characteristic map of the vulva, and (d) characteristic map of the eye.
4.2. Body Temperature Change Pattern of Dairy Cows
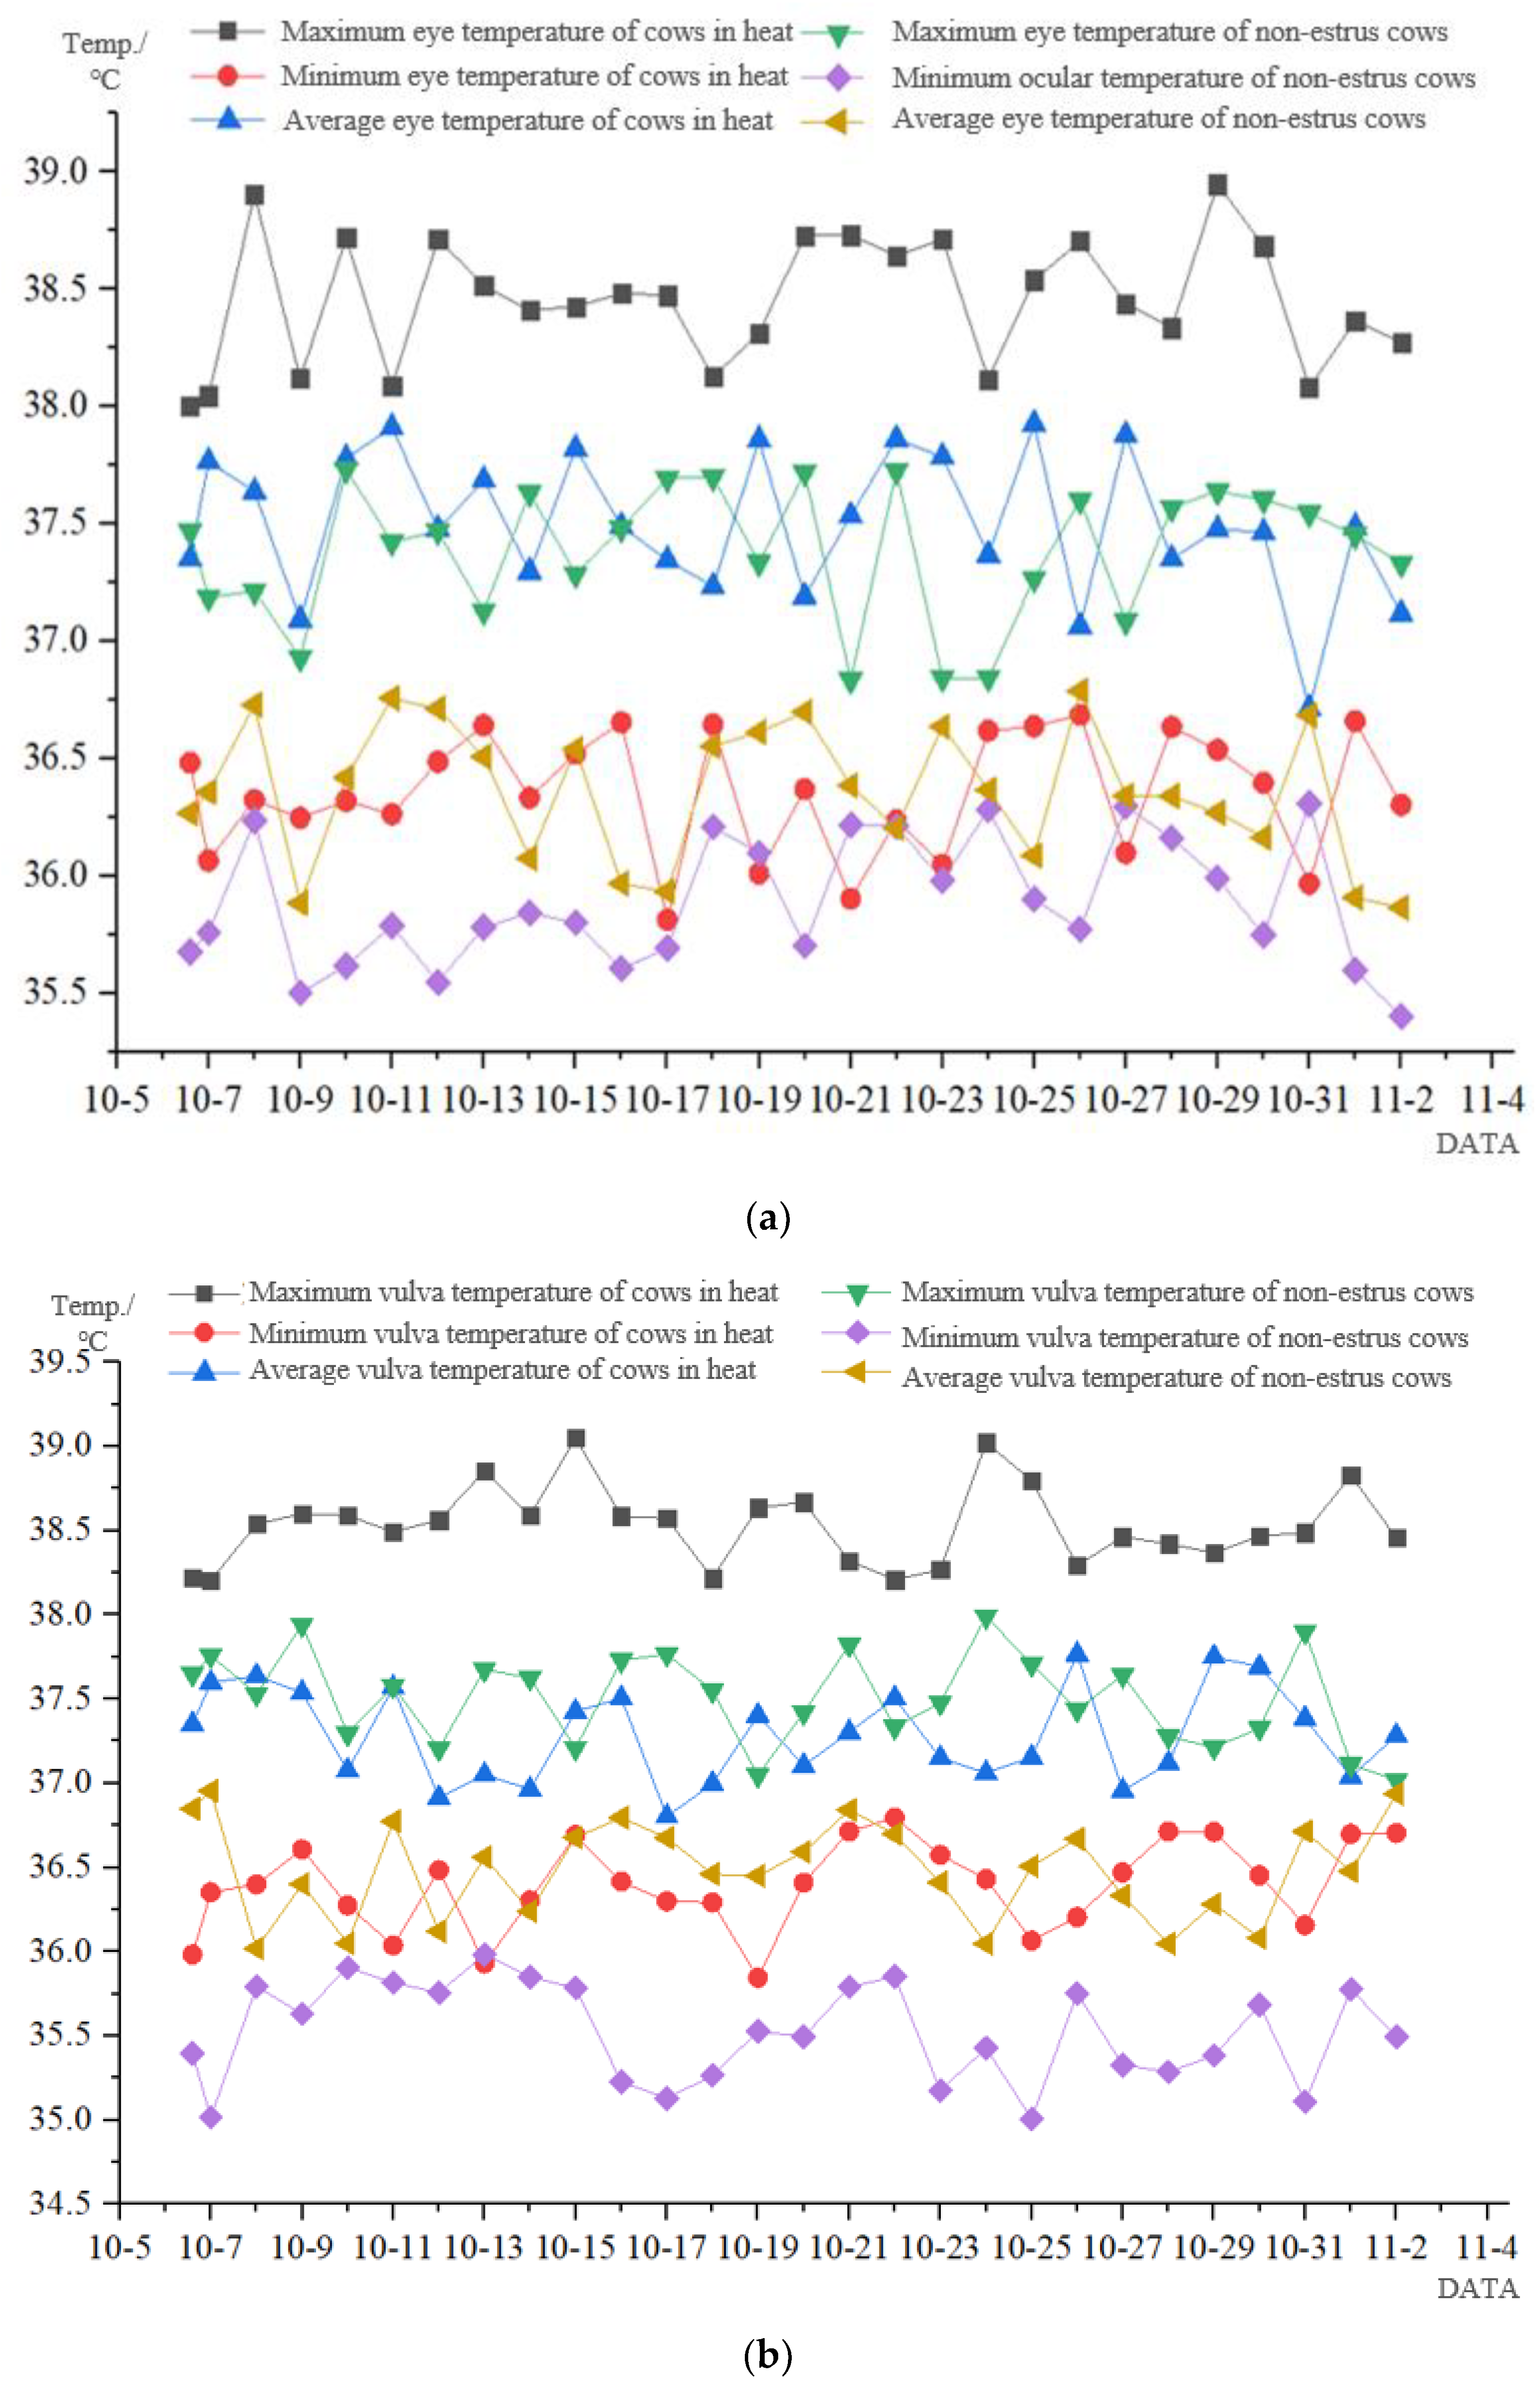
The eye and vulva temperatures were measured at the same time for 30 consecutive days for both the cows in heat and cows not in heat during an estrous cycle from October 6 to 4 November 2021. The stewartia plots of the maximum, minimum and mean eye and vulva temperatures for all the cows in estrus and all the cows not in estrus at a split contour of r = 12 for the eye and r = 12.5 for the vulva are shown in Figure 10. The results showed that the temperature in the eye and vulva of the estrous cows was elevated compared to the anestrous cows. This was thought to be due to the involvement of estrogen and prostaglandins, their vasodilatory effect, and the consequent increase in local surface temperature [36]. The cows in estrus and interestrus showed an increase in the maximum, minimum and average temperatures. The increase in the maximum temperature was the most pronounced, with an increase of 1–2 °C.
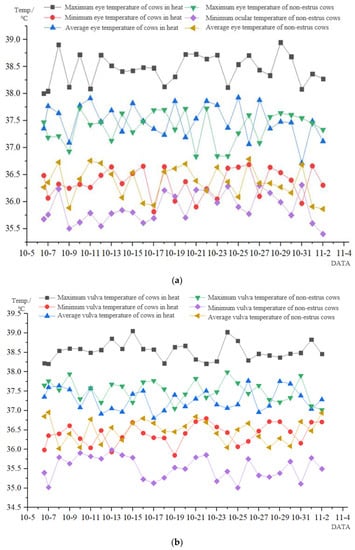
Figure 10.
Maximum, minimum and average ocular and vulvar temperatures of anestrous and estrous cows during an estrous cycle. (a) Graph of the variation in eye temperature in cows, and (b) graph of the variation in vulva temperature in cows.
4.3. Application of Thermal Infrared Technology in Estrus Monitoring
In this paper, the FLIR A310 thermal infrared image device was applied to acquire thermal infrared images of the eyes and vulvas of cows to analyze their body temperature change patterns. A cow estrus model was established to identify cows in estrus. In 1985, Hurnik, J.F. [37] explored and demonstrated the effectiveness of thermal infrared technology for body temperature monitoring and estrus monitoring in dairy cows. This paper extended this basis and verified that thermal infrared technology can be effectively applied in dairy cattle estrus monitoring. Similarly, Kang, H.K. [38] used thermal infrared technology for estrus monitoring in Korean native beef cattle. They used a thermal infrared basis to mark the beef cattle to determine their displacement and also record their weight change, in order to provide a comprehensive judgment regarding cow estrus changes. Although both applied thermal infrared technology, Kang, H.K. [39] mainly used a thermal infrared basis to determine the displacement distance of beef cows, which is less convenient but faster than temperature detection in terms of achievability. In addition, Sykes, D.J. [40] used a thermal infrared technique to distinguish estrus from interestrus in cows. Compared with this paper, both used a thermal infrared technique to divide the estrus cycle of cows into estrus and interestrus and found the most significant changes in vaginal signs in the vulvar area. We also found that changes in the eye temperature of the cows were also obvious during the experiment, and that changes in the eye and vulva temperatures could be used to measure the current estrous state of a cow.
5. Conclusions
- (1)
- A feature extraction method of cows’ eyes and vulvas using lab-color-space-based thermal infrared imaging was proposed. The influence of different contours on the maximum temperature, minimum temperature and average temperature after a feature thermal infrared image segmentation was discussed, and the best segmentation contour for cows’ eye and vulva feature extraction was determined. The optimum eye segmentation contour was found to be r = 12, and the optimal vulva segmentation contour was found to be r = 12.5.
- (2)
- When the optimal segmentation contour was used, the detection rate of cow estrus behavior recognition based on the LOGISTIC model was 82.37%. This was lower than that of the SVM model in terms of the error rate and higher in terms of the recall rate. The method proposed in this paper has the advantages of a high sensitivity and accuracy. The non-contact device used to collect the thermal infrared images from cows can greatly reduce their stress response, which meets the needs of welfare breeding in actual cow production.
This paper, however, still has some shortcomings:
- (1)
- It is currently only applicable to small-scale farming situations due to the limitations of the thermal infrared image acquisition method.
- (2)
- We did not monitor the different stages throughout the entire estrous cycle.
Author Contributions
Conceptualization: Z.W., S.W. and Z.Z.; methodology, Z.W., C.W. and Z.Z.; validation, Z.W., Y.D. and H.W.; formal analyses, Z.W., S.W. and Y.Z.; investigation, L.S.; resources, Y.D.; data curation, Z.W.; writing—original draft preparation, Z.W.; writing—review and editing, S.W., C.W., Y.Z. and Z.Z.; supervision, Z.Z.; project administration, Z.Z.; funding acquisition, Z.Z. All authors have read and agreed to the published version of the manuscript.
Funding
This research was funded by the Inner Mongolia Talent Development Fund and Key Projects of the Department of Education of Inner Mongolia Autonomous Region (No. NJZZ22509).
Institutional Review Board Statement
Not applicable.
Data Availability Statement
Not applicable.
Conflicts of Interest
The authors declare no conflict of interest.
References
- Wang, Z.; Zong, Z.Y.; Wang, H.J.; Yang, J.H.; Liu, G.Q.; Du, Y.J. Research status and development of digital detection methods for cow estrus. China Feed. 2021, 21, 134–138. [Google Scholar]
- Yang, J.X.; Jiao, H.C.; Sun, F.M.; Lin, H. Investigation and Analyswas on the Current Situation of Utilization of Dairy Cattle Breeding Facilities and Equipment in China. Chin. J. Anim. Sci. 2021, 57, 260–264. [Google Scholar]
- Pan, Y.Z.; Wang, H.; Xiong, B.H.; Jiang, L.S. Application of Estrus Monitoring System in Digital Management of Dairy Cows. Chin. J. Anim. Nutr. 2020, 32, 2500–2506. [Google Scholar]
- At-Taras, E.E.; Spahr, S.L. Detection and characterization of estrus in dairy cattle with an electronic heatmount detector and an electronic activity tag. J. Dairy Sci. 2001, 84, 792–798. [Google Scholar] [CrossRef]
- Yang, Y.Q. Oestrus identification in dairy cattle. Qinghai J. Anim. Husb. Vet. Med. 2007, 4, 65. [Google Scholar]
- Jiang, X.X.; Deng, S.Y.; Liu, W.; Wei, X.Y.; Ai, L. Identification Effects of Pedometer on Estrus of Holstein Cows during Peak Lactation Period. Anim. Husb. Feed Sci. 2014, 6, 63–65. [Google Scholar]
- Lvendahl, P.; Chagunda, M. On the use of physical activity monitoring for estrus detection in dairy cows. J. Dairy Sci. 2010, 93, 249–259. [Google Scholar] [CrossRef] [PubMed]
- Tan, Y.; He, D.J.; Guo, Y.Y.; Zhang, Z.R. Design and lmplementation of Real-time Monitoring System for Cow Estrus Based on Storm. J. Agric. Sci. Technol. 2018, 20, 83–90. [Google Scholar]
- Sakaguchi, M.; Fujiki, R.; Yabuuchi, K.; Takahashi, Y.; Aoki, M. Reliability of estrous detection in Holstein heifers using a radiotelemetric pedometer located on the neck or legs under different rearing conditions. J. Reprod. Dev. 2007, 53, 819. [Google Scholar] [CrossRef]
- Wang, H.; Zhao, X.F. Methods for estrus identification of high yield cows. Mod. Anim. Husb. 2009, 6, 22. [Google Scholar]
- Liu, Z.C.; He, D.J. Recognition Method of Cow Estrus Behavior Based on Convolutional Neural Network. Trans. Chin. Soc. Agric. Mach. 2019, 50, 186–193. [Google Scholar]
- Liu, Z.C.; Liu, Y.J. Design of wireless monitoring system for cow estrus crawling behavior based on Android. Heilongjiang J. Anim. Sci. Vet. Med. 2019, 15, 55–59 + 179. [Google Scholar]
- Zhang, Z.R. Research on detection of cow estrus information based on video analyswas. Northwest AF Univ. 2018. [Google Scholar]
- Geers, R.; Puers, R.; Goedseels, V.; Wouters, P. Electronic identification, monitoring and tracking of animals. CAB Int. 1997. [Google Scholar]
- Redden, K.D.; Kennedy, A.D.; Ingalls, J.R.; Gilson, T.L. Detection of estrus by radiotelemetric monitoring of vaginal and ear skin temperature and pedometer measurements of activity. J. Dairy Sci. 1993, 76, 713–721. [Google Scholar] [CrossRef] [PubMed]
- Kyle, B.L.; Kennedy, A.D.; Small, J.A. Measurement of vaginal temperature by radiotelemetry for the prediction of estrus in beef cows. Theriogenology 1998, 49, 1437–1449. [Google Scholar] [CrossRef] [PubMed]
- Timsit, E.S.; Assié; Quiniou, R.; Seegers, H.; Bareille, N. Early detection of bovine respiratory dwasease in young bulls using reticulo-rumen temperature boluses. Vet. J. 2011, 190, 136–140. [Google Scholar] [CrossRef]
- Lee, Y.; Bok, J.D.; Lee, H.J. Body temperature monitoring using subcutaneously implanted thermo -loggers from holstein steers. Asian-Australas. J. Anim. Sci. 2016, 29, 299–306. [Google Scholar] [CrossRef]
- Wataru, I.; Shuichi, I.; Dawasuke, K.; YuichiIto, J.T.; Michiko, T. Monitoring of the core body temperature of cows using implantable wireless thermometers. Comput. Electron. Agric. 2019, 163, 104849. [Google Scholar]
- Gundula, H.; Mariana, S.; Chrwastian, A.; Sandra, R.M.; Werner, B. Monitoring the body temperature of cows and calves using video recordings from an infrared thermography camera. Vet. Res. Commun. 2013, 37, 91–99. [Google Scholar]
- Talukder, S.; Kerrwask, K.L.; Ingenhoff, L. Infrared technology for estrus detection and as a predictor of time of ovulation in dairy cows in a pasture -based system. Theriogenology 2014, 81, 925–935. [Google Scholar] [CrossRef] [PubMed]
- Church, J.S.; Hegadoren, P.R.; Paetkau, M.J.; Partau, C.C.; Regev-Shoshani, G.; Schaefer, A.L.; Schwartzkopf-genswein, K.S. Influence of environmental factors on infrared eye temperature measurements in cattle. Res. Vet. Sci. 2014, 96, 220–226. [Google Scholar] [CrossRef] [PubMed]
- Uddin, J.; Mcneill, D.M.; Lwasle, A.T.; Phillips, C.J. A sampling strategy for the determination of infrared temperature of relevant external body surfaces of dairy cows. Int. J. Biometeorol. 2020, 64, 1–10. [Google Scholar] [CrossRef]
- Wang, X. Design and Implementation of temperature prediction detection platform for cows. Anhui Agric. Univ. 2020, 38, 212–225. [Google Scholar]
- Zhang, X. Study on diagnoswas method of heat stress in dairy cow based on infrared thermal imaging technology. Fujian Agric. For. Univ. 2016. [Google Scholar]
- Mota-Rojas, D.; Pereira, A.M.F.; Wang, D.; Martínez-Burnes, J.; Ghezzi, M.; Hernández-Avalos, I.; Lendez, P.; Mora-Medina, P.; Casas, A.; Olmos-Hernández, A.; et al. Clinical Applications and Factors Involved in Validating Thermal Windows Used in Infrared Thermography in Cattle and River Buffalo to Assess Health and Productivity. Animals 2021, 11, 2247. [Google Scholar] [CrossRef]
- Dilixiati, Y.; Zhou, J.P.; Xu, Y.; Fan, X.P.; Yalikun, S. Cotton pest monitoring based on LOGISTIC algorithm and remote sensing image. J. South China Agric. Univ. 2022, 43, 87–95. [Google Scholar]
- Meng, Y.F.; Liang, J.Y. Linear regularized functional LOGISTIC model. J. Comput. Res. Dev. 2020, 57, 1617–1626. [Google Scholar]
- Li, Z.P.; Guo, J.X.; Guo, Y.; Li, X.L.; Zhang, L.L.; Huang, H. Design and test of the grading system for kernel-free white grapes with support vector machine. Food Mach. 2021, 37, 106–111 + 246. [Google Scholar]
- Zhang, J.W.; Jiang, Q.; Liu, X.R.; Ma, X.J. Prediction of vibration response for pipeline of cascade pumping station based on PSO-SVM algorithm. Trans. Chin. Soc. Agric. Eng. 2017, 33, 75–81. [Google Scholar]
- Ostersen, T.; Cornou, C.; Krwastensen, A.R. Detecting oestrus by monitoring sows’ vwasits to a boar. Comput. Electron. Agric. 2010, 74, 51–58. [Google Scholar] [CrossRef]
- Cornou, C.; Vinther, J.; Krwastensen, A.R. Automatic detection of oestrus and health dwasorders using data from electronic sow feeders. Livest. Sci. 2008, 118, 262–271. [Google Scholar] [CrossRef]
- Cornou, C. Automated oestrus detection methods in group housed sows: Review of the current methods and perspectives for development. Livest. Sci. 2006, 105, 1–11. [Google Scholar] [CrossRef]
- Ren, X.H.; Liu, G.; Zhang, M.; Si, Y.S.; Zhang, X.Y.; Ma, L. Dairy cattle’s behavior recognition method based on support vector machine classification model. Trans. Chin. Soc. Agric. Mach. 2019, 50 (Suppl. 1), 290–296. [Google Scholar]
- Yuan, P.S.; Ren, S.G.; Zhai, Z.Y.; Xu, H.L. Chrysanthemum phenotypic classification based on semi-supervwased active learning. Trans. Chin. Soc. Agric. Mach. 2018, 49, 27–34. [Google Scholar]
- Bertoni, A.; Mota-Rojas, D. Lvarez-Macias A findings related to changes in vascular microcirculation using infrared thermography in the river buffalo. J. Anim. Behav. Biometeorol. 2020, 8, 288–297. [Google Scholar] [CrossRef]
- Hurnik, J.F.; Webster, A.B.; Deboer, S. An investigation of skin temperature differentials in relation to estrus in dairy cattle using a thermal infrared scanning technique. J. Anim. Sci. 1985, 61, 1095–1102. [Google Scholar] [CrossRef] [PubMed]
- Kang, H.K.; Park, G.T.; Na, Y.J. PSII-16 Thermal sensor-based multiple object tracking system for estrus detection in Korean native beef cattle. J. Anim. Sci. 2019, 97 (Suppl. 3), 238–239. [Google Scholar] [CrossRef]
- Sykes, D.J.; Couvillion, J.S.; Cromiak, A. The use of digital infrared thermal imaging to detect estrus in gilts. Theriogenology 2012, 78, 147–152. [Google Scholar] [CrossRef]
- Marquez, H.; Ambrose, D.J.; Schaefer, A.L. Evaluation of infrared thermography combined with behavioral biometrics for estrus detection in naturally cycling dairy cows. Animal 2021, 15, 100205. [Google Scholar] [CrossRef] [PubMed]


Disclaimer/Publisher’s Note: The statements, opinions and data contained in all publications are solely those of the individual author(s) and contributor(s) and not of MDPI and/or the editor(s). MDPI and/or the editor(s) disclaim responsibility for any injury to people or property resulting from any ideas, methods, instructions or products referred to in the content. |
© 2023 by the authors. Licensee MDPI, Basel, Switzerland. This article is an open access article distributed under the terms and conditions of the Creative Commons Attribution (CC BY) license (https://creativecommons.org/licenses/by/4.0/).