1. Introduction
The dairy sector plays an essential role in the national economy. It is crucial for promoting the long-term and stable development of animal husbandry, the food industry, and the consumer economy, regulating people’s nutritional patterns, enhancing physical quality, and raising living standards [
1,
2,
3]. Raw milk is the origin of the entire dairy industry supply chain and the foundation and foothold of development, serving as the “first workshop” of the dairy production industry chain [
4]. China’s dairy industry has proliferated since the Reform and Opening-Up in the late 1970s. The number of cows and the output of raw milk in China increased roughly 18 and 31 times, respectively, from 1978 to 2020. China’s current output ranks fifth globally, immediately after India, the European Union, the United States, and Pakistan. However, compared with China’s huge domestic demand for milk, China still needs to import raw milk in large quantities. Other high-yield countries, such as EU countries including Germany, France, the Netherlands, Poland, and Italy, have a significant surplus of milk relative to domestic consumption. Therefore, China’s raw milk production needs to be further expanded. However, China’s raw milk production is confronted with problems such as high production costs, stringent environmental constraints, and weak industrial interest linkages [
5,
6,
7,
8,
9]. The extensive and inefficient mode of operation seriously restricts the further development of China’s dairy industry. How to increase the production efficiency of raw milk and realize the transition from “a country with high milk production” to “a country with high-efficiency milk production” has become the key to further developing China’s dairy industry.
In recent decades, the Chinese government has been seeking ways to increase the production efficiency of raw milk, and the scale of production is one of the most important experiences. There are many problems with small farms, such as low economic benefits, poor anti-risk ability, lack of scale efficiency and quality assurance of dairy products, etc.
The small number of large-scale farms and the excessive number of retail farmers have been considered as weaknesses in the development of China’s dairy industry. Therefore, China has been actively advocating large-scale farming. Since the first time “large-scale dairy farming” was proposed in the Guiding Opinions on Promoting the Modernization of Livestock and Poultry Breeding issued in 2004, almost all government documents related to the dairy industry issued later mentioned “large-scale dairy farming”. In 2008, the document the Outline of the Plan for the Rectification and Revitalization of the Dairy Industry proposed to promote large-scale and standardized farming. In 2015, the central government allocated 1 billion yuan to subsidize more than 900 farms (communities) with more than 300 cows on hand. In 2018, the document Opinions on Further Promoting the Revitalization of Dairy Industry proposed to support the development of farmers’ moderate scale aquaculture. In 2022, the document Action Plan for Improving the Competitiveness of the Dairy Industry during the “the 14th Five-Year Plan” proposed to cultivate and expand family farms, dairy farmers’ cooperatives, and other moderate-scale breeding entities. With the support of the policy, the scale level of raw milk production in China has increased rapidly. From 2004 to 2020, the stock of dairy cows in China was nearly the same, at about 11 million. However, the number of dairy farms in China increased from more than 2 million in 2004 to fewer than 0.7 million in 2020. The proportion of large farms with more than 100 cows has increased from less than 20% in 2004 to nearly 70% in 2020, and the proportion of large farms with more than 1000 cows has increased from less than 10% to nearly 50%. The trend of large-scale dairy farming is becoming increasingly obvious. It is worth noting that in the process of large-scale dairy farming, the policy has gone through the transition from “the larger the better” to “moderate scale”. The production factors should be reasonably allocated according to the actual situation and establish suitable large-scale farms. Based on this, all raw milk production in this paper is divided into four modes: free-range, small-scale, medium-scale, and large-scale, which helps to compare the production efficiency of raw milk of different scales and study how to improve the production efficiency based on scale heterogeneity.
There are two main streams of research on raw milk production efficiency. The first is the evaluation and decomposition of production efficiency. Production efficiency can be measured by total factor productivity (TFP) or technical efficiency (TE), which can find the source of efficiency difference while evaluating the efficiency of decision objects and provide direction for efficiency improvement. Australia’s production efficiency improved dramatically from the 1980s to the 1990s, according to Kompas and Che’s (2003) measurements of Australian dairy farms’ total factor productivity from 1979 to 1999 [
10]. The average technical efficiency of raw milk production in Quebec, Canada, was estimated by Singbo and Larue to be around 88% over a decade using panel data from 2001 to 2010 [
11]. Ma et al. found that the average technical efficiency of New Zealand’s dairy production from 2010 to 2013 was 78.8% [
12]. In China, Ma et al. used various methods to analyze the sources of TFP growth for raw milk production [
13,
14]. They found that the determinants of efficiency growth differed by period, with the former being technological advancement and the latter being technical efficiency.
The second stream of research focuses on the influencing factors of production efficiency. Analyzing influencing factors is the key to finding the path to efficiency growth. Feeding size, skill training, and the ratio of cows raising income to total income all significantly impact the production efficiency of raw milk, according to Cao et al. [
15]. Sauer and Latacz-Lohmann found that investment in technology and education is essential for sustaining efficiency improvement [
16]. Additionally, raw milk production efficiency is significantly influenced by the downstream market integration level [
17], multi-functional indicators [
18], breeding experience, organization [
19], feed inputs, farmer income [
20], the concentrate-to-roughage ratio [
21], non-agricultural work [
22], labor costs, depreciation of fixed assets [
23], and weather and climate [
24].
Numerous quantitative methods have been created to study efficiency since Koopmans (1951) initially proposed technical efficiency. The two widely adopted methods are Data Envelopment Analysis (DEA) and the Stochastic Frontier Approach (SFA) [
25,
26]. DEA can be applied to multi-output Decision Making Units (DMUs) and does not need to determine the linear expression between input and output variables. However, it does not consider the impact of random shocks on output or incorporate random disturbance terms into efficiency factors, which may lead to inaccurate efficiency measurement results. SFA has an edge in handling erratic disturbances. It is possible to determine the precise relationship between the explained and explanatory variables. It can also determine and test the estimated parameters by building a suitable production function and fitting the production frontier. However, it is less practical than DEA in efficiency decomposition and calls for an explicit distributional assumption for the production function and inefficiency term [
27,
28,
29]. These two techniques are most commonly used in the relevant study on the production efficiency of raw milk. For example, Peng [
20], Ma et al. [
30], and Njuki et al. [
24] used the SFA model to examine the production efficiency of Chinese raw milk. Madau et al. [
31], Liu et al. [
23], and Świtłyk et al. [
32] adopted the DEA method. It is worth noting that data sources can significantly influence the research findings. Using survey data from the primary raw milk-producing regions in 2004, Cao revealed that farmers’ technical efficiency loss was 30% [
15]. They also noted that the scale of feeding significantly impacted the technical efficiency of raw milk production. However, based on data from 2005 to 2007, Peng measured the technical efficiency loss of raw milk to be 8.9%, significantly lower than that in Cao’s study. Additionally, contrary to Cao’s assertion, Peng’s study demonstrated that the feeding scale has no significant impact on technical efficiency [
15,
20].
Previous studies provide important references for this study, but there are still some deficiencies. First, the method is singularly focused on measuring the production efficiency of raw milk in China. Most of methods use the classic single DEA or SFA. The usual process is using DEA and SFA to measure the efficiency and then exploring the determinants [
20,
24,
30,
31,
32,
33]. However, as mentioned in the literature review above, both models have certain defects. Therefore, the strategy of the paper is to cut and combine the two methods to retain the advantages and remove the disadvantages. When calculating the efficiency of raw milk and describing the current situation, the DEA method is adopted, which is simple, convenient, and applicable, and more in line with practical requirements. The SFA method is used in the analysis of influencing factors, which can not only examine the relationship between inputs and outputs, but also consider random impacts. The research conclusion is more accurate. Second, the input–output indicators of raw milk efficiency measurement differ across studies, and there has been little analysis and comparison on this difference [
15,
20,
30,
31,
32,
34]. This paper uses Jean-Baptiste Say’s classic theory of three factors of production as the basic framework, combining indicators by relevant papers to build the input–output indicator system and carrying out a detailed comparative discussion on the impact of this difference in indicator selection in the fifth part. Third, there is less discussion on the robustness of raw milk production efficiency [
35,
36,
37,
38,
39,
40,
41]. There are many alternative treatments in the measurement of raw milk production efficiency and analysis of influencing factors, such as the alternative selection of input indicators, regression methods, influencing factors, etc. It is unknown whether these differences will have an impact on the research conclusions, and if they do, what impact they will have. However, in fact, it may be these difference that cause the differences and even contradictions in the current research literature on raw milk. The paper analyzes robustness in
Section 5 and is the first study to systematically explore these differences. Fourth, studies on the production efficiency of raw milk in China are based on data with short time periods, and the characteristics of the production efficiency of the dairy industry in a long period of time are difficult to reflect. The data in this paper are from 2004 to 2020. In addition, the data come from the Compilation of National Agricultural Product Cost-Benefit Data (hereinafter referred to as "Compilation"), which is the most authoritative macro data source in the whole industry.
The key scientific problem of this paper is how to improve the production efficiency of raw milk in China. To solve this problem, the rest of this paper is designed as follows:
Section 2, methods, indicators, and data, introduces the methods used, the selected indicators system, and the data.
Section 3 analyzes the spatial–temporal efficiency characteristics. The DEA-Malmquist model is used to describe the distribution characteristics of raw milk production in China from the perspective of time and space, so that readers can understand the basic situation of raw milk efficiency in China and lay a foundation for the following study of influencing factors. In
Section 4, determinants of efficiency, the SFA model is used to examine the impacts from the perspective of internal factors (input elements) and external factors.
Section 5 is robustness analysis.
Section 6 is conclusions and next steps. It summarizes the research conclusions and practical significance, puts forward research suggestions, and summarizes the research deficiencies and ideas for future research.
2. Materials and Methods
2.1. Research Methods
2.1.1. DEA-Malmquist
DEA is an excellent method created by Charnes and Cooper in 1978 to evaluate the relative effectiveness of multi-input and multi-output DMUs using a mathematical programming model [
42,
43]. Assuming that there are j DMUs in the system, and each DMU has i input indicators and r output indicators, the fractional programming model for evaluating the DMU j can be presented as follows:
where
θ denotes the production efficiency of the DMU;
,
, respectively, mean the slack variables of the output index and input index;
,
, respectively, mean the input and output of the DMU; and
represents the weight of the DMU. When the optimal solution θ* = 1,
=
= 0, the DMU is valid for DEA, and the combination of the input and output of the decision-making unit is optimal.
The DEA model examines the relative performance of each production unit in the same period. Each period lacks a benchmark for vertical comparison since the production frontiers differ after the time variable is added. As a result, it is not applicable to panel data and has great limitations. The Malmquist index can effectively make up for its defects. It can not only evaluate the panel data with time factors but also realize the decomposition of efficiency. The Malmquist index was originally proposed by Malmquist in 1953. After combining with the DEA model, it has been widely used in productivity measurement [
44,
45,
46].
The Malmquist indexes, which are, respectively, referred to by the technology
in
t and
t + 1 periods, can be expressed as
Taking the geometric mean of the two, the Malmquist index, measuring the productivity change from period
t to period
t + 1, is obtained:
where
,
represent the input and output of period
t + 1 and period
t, respectively;
represent the distance function of period
t and period
t + 1, respectively, with the technology
of period
t as a reference
The Malmquist index can be decomposed into the technical efficiency change index and the technological change index, and technical efficiency can be further decomposed into pure technical efficiency and scale efficiency change as follows:
where the first item represents the change of pure technical efficiency under the assumption of variable scale; the second item represents the change of scale efficiency; and the third item represents technological change. When the index value is greater than 1, the efficiency improves; when the index value is equal to 1, the efficiency is unchanged; when the index value is less than 1, the efficiency decreases.
2.1.2. SFA
DEA can be applied to multi-output Decision Making Units (DMUs) and does not need to determine the linear expression between input and output variables. However, it does not consider the impact of random shocks on the output or incorporate random disturbance terms into efficiency factors, which may lead to inaccurate efficiency measurement results. SFA has an edge in handling erratic disturbances. It is possible to determine the precise relationship between the explained and explanatory variables. It can also determine and test the estimated parameters by building a suitable production function and fitting the production frontier. In view of the shortcomings of data envelopment analysis in the analysis of the input–output factor relationship and random impact, this paper intends to use the stochastic frontier analysis method to further explore the input elasticity and driving factors of raw milk production efficiency.
SFA was first proposed by Aigner, Lovell, and Schmidt as a parametric frontier estimation technique for multiple inputs and single output. By setting proper functions and input–output variables, it uses function fitting to generate an unbiased estimation of the relationship between input and output. The stochastic frontier analysis allows for the existence of random interference by separating it from the inefficient efficiency item [
47,
48]. The model is constructed as follows:
Take the logarithm of both sides of the equation to obtain
where
represents the actual output of the DMU
i in year
t;
represents the input of the DMU
i in year
t; β represents the parameter to be estimated; and
represents the theoretical output.
represents the compound perturbation term, where
is the random disturbance item, and
is the technical inefficiency item.
The SFA model can further analyze the influencing factors of technical efficiency. The functional form of technical inefficiency is as follows:
where
is the explanatory variable that is the factor affecting the technical efficiency;
represents the parameter to be estimated; and
is the random disturbance term.
2.2. Input–Output Indicators
Reasonable input–output indicators are the basis and premise of efficiency measurement. The output indicators of raw milk generally use raw milk production, by-product output value, and gross output value. Input indicators generally use concentrated feed, roughage, labor hours, capital input, and other production costs [
15,
20,
23].
In terms of input indicators, this paper uses Jean-Baptiste Say’s classic theory of three factors of production as the basic theoretical framework to build an indicator system with reference to the relevant literature [
15,
20,
24,
31,
32,
49,
50]. According to Say’s theory, production is composed of three basic forms: land, labor, and capital. Land refers to all natural resources invested in production, including land, energy, and other forms; labor refers to the time and energy people spend in the production process; capital is the durable goods for producing other goods, including equipment, materials, etc. In terms of land, the main natural resource for raw milk production is land. However, according to Compilation, the total cost of free-range farming in all regions of China in 2020 is 17,300 yuan per cow and the cost for land is 11.93 yuan per cow; the total cost of small-scale is 18,447 yuan and 64.14 yuan for land; the total cost of medium-scale is 23,740 yuan and 87 yuan for land; the total cost of large-scale is 28,882 yuan and 158 yuan for land. The land cost accounts for no more than 1%. The impact of land on output is small. On the other hand, the data of land cost in some provinces are missing, especially in free-range farming mode. Therefore, the paper does not include land cost in the input indicator system. In terms of labor input, the quantity or time of labor input is generally used, and labor cost can also be used. This paper adopts the amount of labor, which can avoid the inflation between different years and the price differences between different regions. In terms of capital investment, raw milk production mainly includes feed cost and fixed asset cost. Feed input, including refined feed and coarse feed, accounts for a large proportion, which is the most important input for milk production. In addition, in order to measure comprehensively the cost input in the actual production, this paper will include water costs, fuel and power costs, medical and epidemic prevention costs, tool and material costs, repair and maintenance costs, and other direct costs into input indicators to build an “other costs” index. To sum up, the paper chooses the cost of concentrated feed, the cost of roughage, the other costs (including water, fuel and power, medical and epidemic prevention, tools and materials, repair and maintenance costs, and other direct costs), the depreciation expense of fixed assets, and labor quantity as input indicators.
In terms of output indicators, the paper chooses raw milk production as the output indicator due to its three advantages. First, the gross output value reflects the output of dairy farmers. Raw milk by-products mainly include bull calves, fattening and culling cows, breeding cows, manure, and subsidy income, while raw milk production mainly refers to milk output, which is more accurate. Second, most input factors of raw milk, such as concentrated feed, roughage, fixed assets, epidemic prevention, and labor, play limited roles in shaping the output of by-products. In other words, changes in these input factors have little impact on the output of by-products. In this regard, such poor correlations cannot satisfy the requirement of strong causality of the input–output indicators in DEA and SFA models. Third, the output of by-products is only a small component of the total output. In 2020, each province’s average output value of by-products accounted for less than 10% of the total output value. Due to the small proportion, even if any raw milk production is included in the by-product output, it will not cause severe errors in the efficiency measurement.
It is worth noting that although the relevant literature is close in the direction of input and output indicators, there are great differences in specific indicators. For example, Switchlyk used labor time, feed, and equipment costs as input indicators [
32], while Ma used breeding costs, labor costs, inventory costs, feed costs, management costs, other costs, farm size, and herd size [
12]. The input–output indicators in studies about China are also not completely unified [
15,
20,
23]. This paper believes that different index choices will affect the results of efficiency measurement and the analysis of influencing factors, thus causing errors in the results. It will further discuss these issues in detail through empirical analysis in
Section 5, Robustness Analysis.
Previous research used different indicators to assess raw milk efficiency. This study examined the indicators in detail in the robustness analysis section. In order to eliminate the biased impact of price inflation on the efficiency measurement, this paper set 2003 as the base period, and it adjusted the indicators “concentrated feed cost” and “roughage cost” using the “feed price index” in the price index of agricultural production. Similarly, it adjusted the “asset investment” and “other expenses” using the “price index of agricultural means of production.”
2.3. Data Sources
The input and output indicator data are from the Compilation from 2004 to 2020. The Compilation divides raw milk production into four modes: free-range, small-scale, medium-scale, and large-scale. Representative provinces/autonomous regions/municipalities (from now on, provinces) were selected for statistics every year, but some provinces may have missing data in some years. In order to ensure the completeness and scientific of the data, the provinces selected for the research samples have missing data for at most two years. The study areas in the paper include six provinces (Guangxi, Henan, Jilin, Shanxi, Shaanxi, Xinjiang) and “ average” under the free-range mode, 13 provinces (Fujian, Guangxi, Hebei, Heilongjiang, Henan, Hunan, Jilin, Liaoning, Inner Mongolia, Ningxia, Shanxi, Shandong, Yunnan) and “average” under the small-scale mode, 14 provinces (Anhui, Beijing, Chongqing, Fujian, Heilongjiang, Henan, Gansu, Jilin, Inner Mongolia, Ningxia, Shanxi, Shanghai, Shaanxi, Tianjin) and “average” under the medium-scale mode, and 12 provinces (Anhui, Fujian, Guangdong, Heilongjiang, Henan, Hubei, Gansu, Jiangsu, Liaoning, Qinghai, Xinjiang, Zhejiang) and “average” under the large-scale mode. The above “average” is not the average of the sample provincial data, but the average of more provincial in the Compilation. It is a new DMU that represents the average level of more provinces in the country, given by the Compilation. The number of input indicators selected in this paper is large, but the DMUs are few. Adding the “average” DMU can enhance the accuracy of the efficiency measurement and reduce the deviation. In addition, the “average” DMU can help identify more effective information. The indexes “feed price index” and “price index of agricultural means of production” from 2004 to 2020 are both from the National Bureau of Statistics (NBS). A total of 9163 samples were collected. The data consist of one output indicator and ten input indicators of 49 units over 17 years. The mean value was used to fill in 106 missing data.
4. Determinants of Efficiency
Given the shortcomings of the DEA model in analyzing the relationship between input and output factors and stochastic shocks, this paper used the SFA model to further explore the input–output elasticity of raw milk and the driving factors of production efficiency.
4.1. Modeling
4.1.1. Setting of the Stochastic Frontier Basic Model
The paper first assumed that raw milk production obeys the transcendental logarithmic production function form and then adjusted the function according to statistical tests. The time span of the sample data is long, so it is assumed that there is a technological change
t and that the technological change is related to input factors. The SFA basic model is as follows:
where
represents the raw milk production in province
i in year
t;
is the input amount of the
jth input factor in year
t in the province
i.
j = 1, 2, 3, 4, 5, representing the concentrated feed, roughage, other costs, fixed assets, and labor quantity, respectively;
t is a time trend variable, representing technological change;
is a compound error term, where
is an inefficiency term and
is a random item;
β is an unknown parameter.
4.1.2. Test Methods and Assumptions
In order to determine the form of the SFA model, it is necessary to test the hypothesis on the form of the production function and the inefficiency term. The generalized likelihood ratio (LR) test was adopted. The null hypothesis is
, and the alternative hypothesis is
. The likelihood function values of the null hypothesis and the alternative hypothesis are
,
, respectively. The statistic LR of the likelihood ratio test is as follows:
The null hypothesis holds if the statistic LR obeys the mixed chi-square distribution, . The analysis framework of the paper is combined to test the production function form (hypothesis test , , and inefficiency function (hypothesis test , , . The assumptions are as follows:
: Production function form test. The null hypothesis is . If the null hypothesis is rejected, the translog production function form should be used.
: Technological change test. The null hypothesis is . If the null hypothesis is rejected, there is a technological change.
: Technical non-neutrality test. The null hypothesis is . If the null hypothesis is rejected, technological change is related to input factors.
: Applicability test of the SFA model. The null hypothesis of the model is . If the null hypothesis is rejected, the inefficiency term exists.
: Time-varying test of technical efficiency. The null hypothesis is . If the null hypothesis is rejected, it is time varying.
: The distribution hypothesis of the inefficiency item. The null hypothesis is . If the null hypothesis is rejected, it obeys the truncated normal distribution.
4.1.3. Analysis of Test Results
The test results for the six null-hypothesis stochastic frontier production function models are reported in
Table 3. Regarding relevant studies, the critical value of the confidence level of the mixed chi-square test was set to 5%. According to
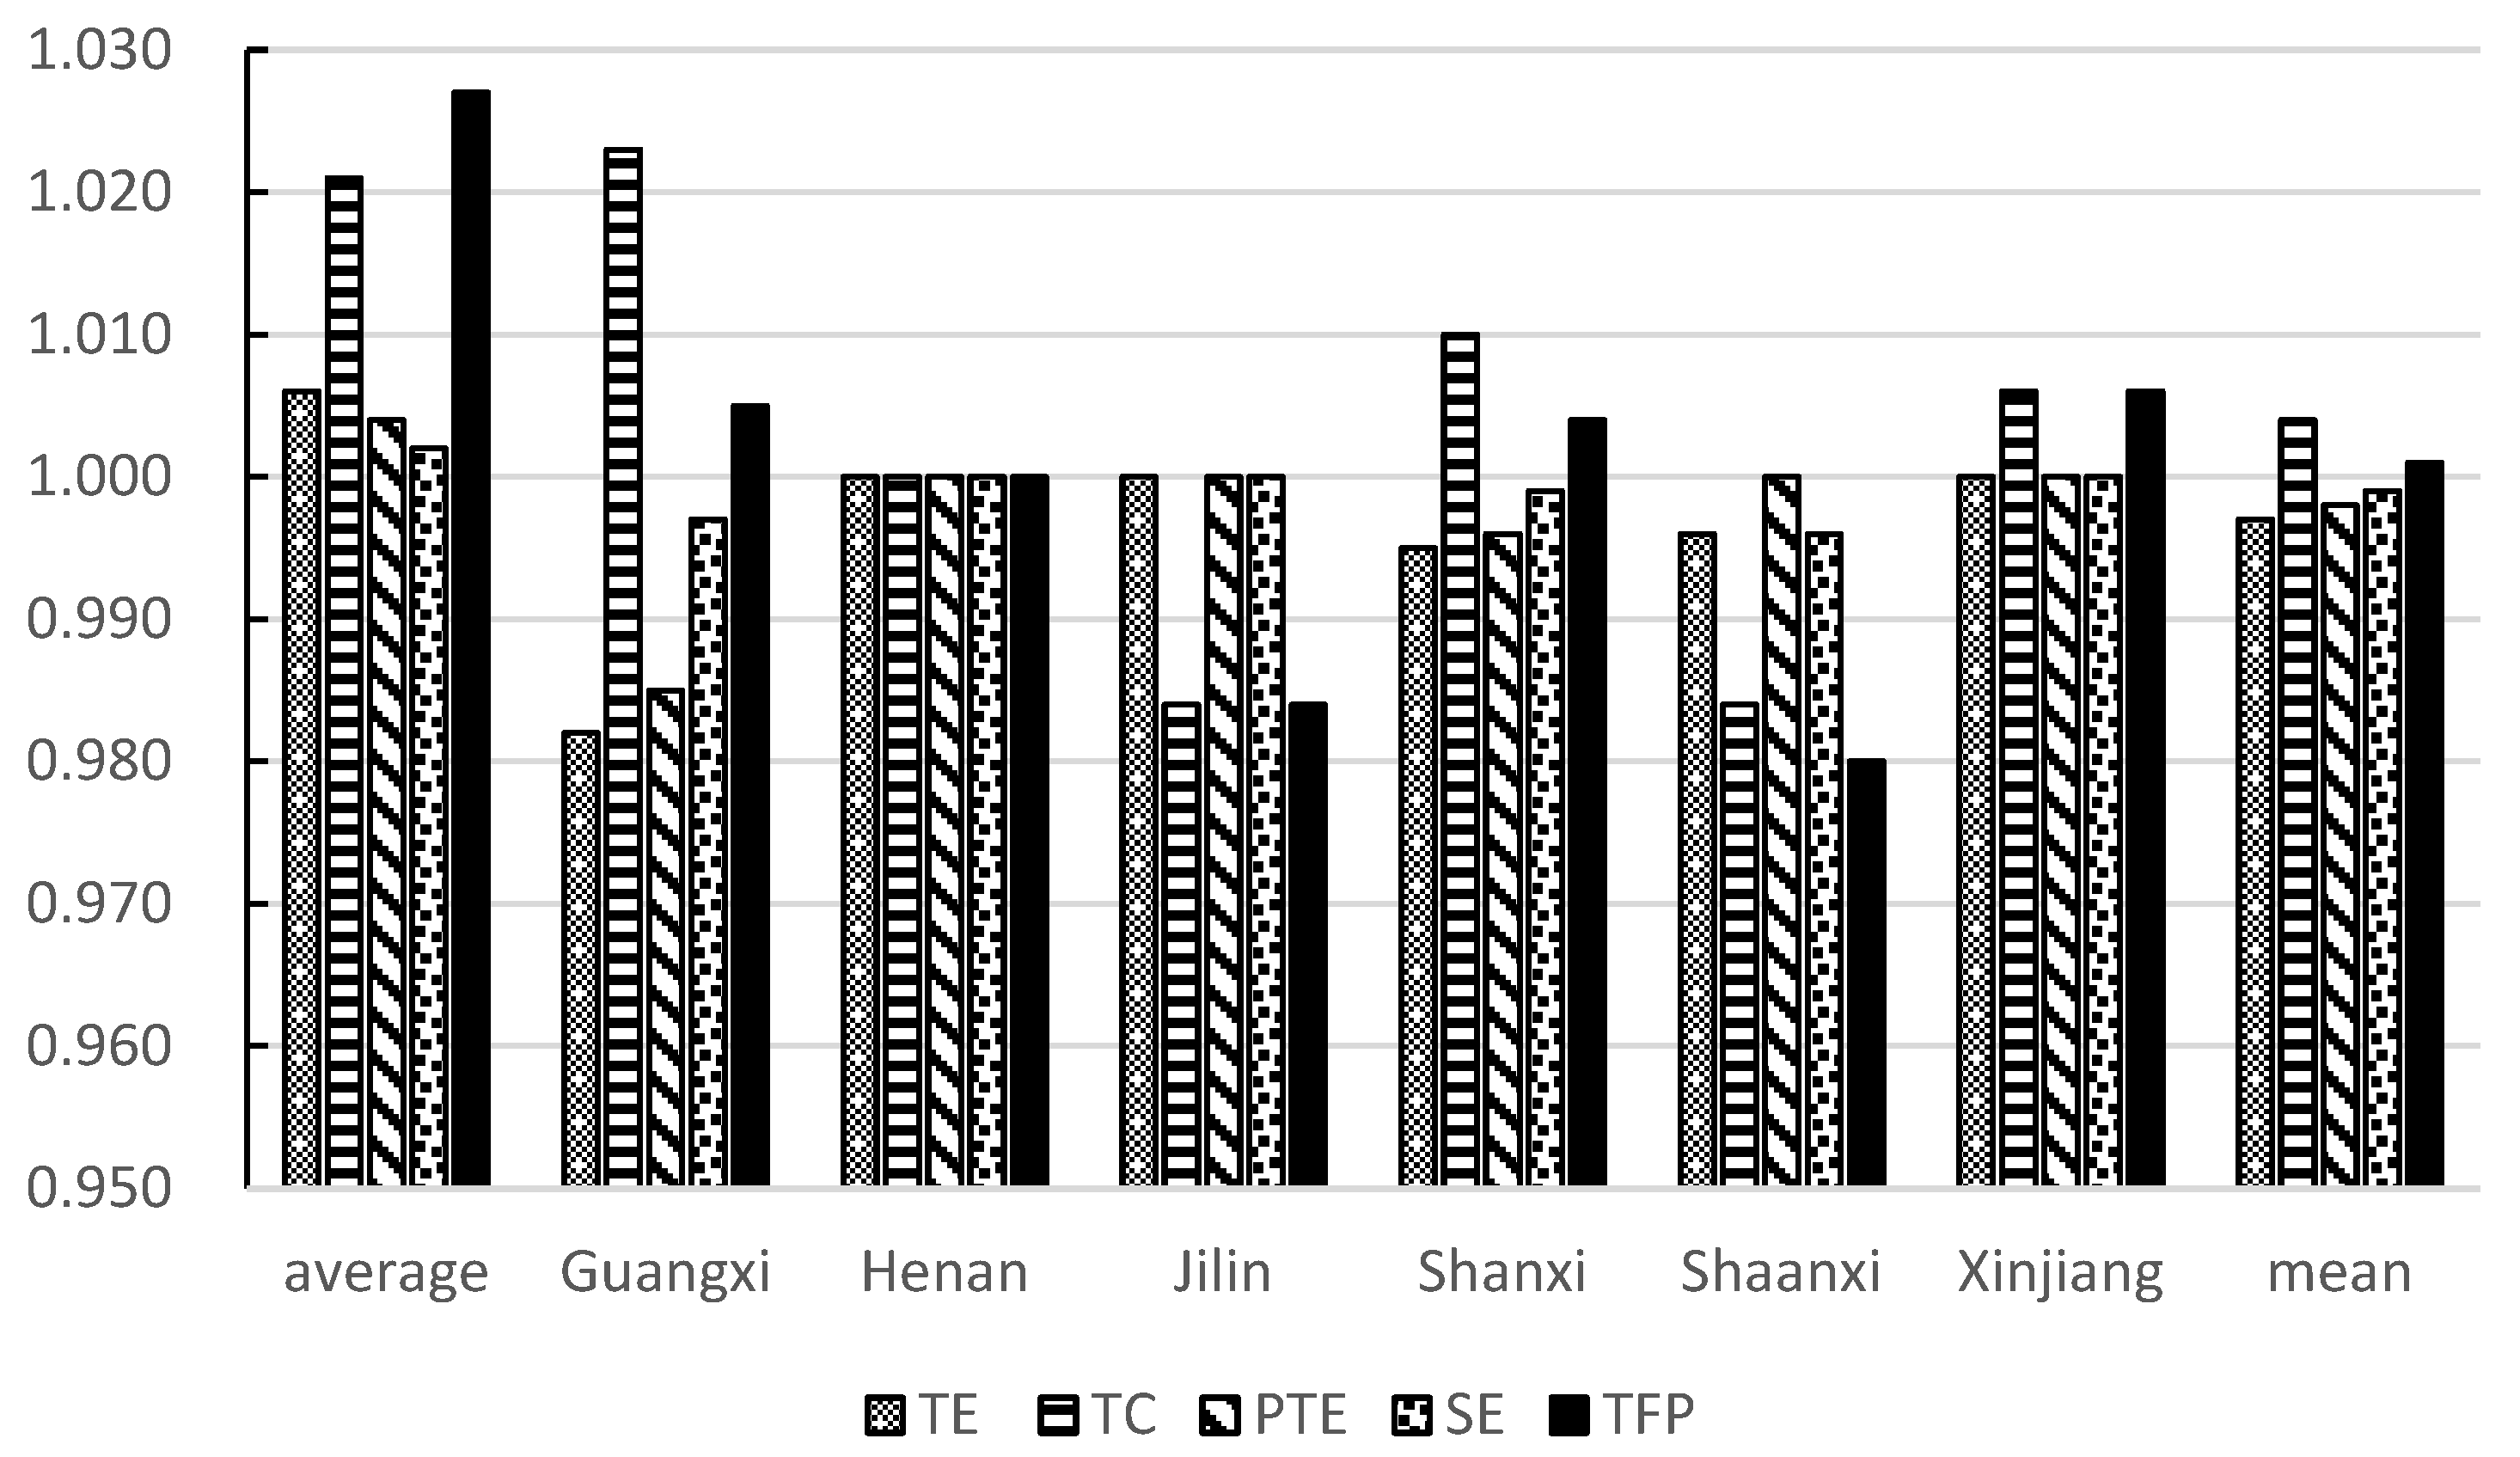
Table 3, the stochastic frontier function modeling of the four modes of raw milk was quite different. From the perspective of functional form, free-range, medium-scale, and large-scale productions were consistent with the preset basic functional form, while small-scale production obeyed the Cobb–Douglas production function, and there was no technical change term. From the test of the inefficiency item, there was no inefficiency item in the production of free-range raw milk, which means it is not suitable for the stochastic frontier model. It also demonstrated that free-range production had extremely high-efficiency levels—close to the production frontier. The production inefficiency items of medium-scale and large-scale stayed the same with time, indicating that their production efficiency has hardly changed in the past 17 years. In addition, the inefficiency items of free-range, small-scale, and large-scale all obeyed a half-normal distribution.
4.2. Analysis of the Input–Output Relationship
According to the test results in
Table 3, the SFA model was established for each mode. The free-range model used Stata 17 to estimate the parameters of the sample panel data by the least squares method. The other three models used Frontier 4.1 to estimate the parameters by the maximum likelihood method. The estimation results are shown in
Table 4 and
Table 5. The gamma, eta, and LR values are shown in
Table 4. The model fitting was significant.
In general, the nature of raw milk production varied by model. The direction and extent of the influence of the same input factors on the output differed across modes. Theoretically, input and output should show a positive coefficient. However, some showed a negative relationship, and the reasons need further exploration. In addition, the overall input–output elasticity showed a downward trend with the scale expansion, indicating that the marginal effect of raw milk output would gradually decrease with the expanded scale.
In terms of concentrated feed, the input–output elasticity of raw milk in the medium-scale mode was relatively strong. It had a significant negative impact, possibly due to the excessive input of concentrated feed in medium-scale production. The factor coefficient of the small-scale concentrated feed was significantly positive. Its elasticity was much greater than other input factors in small-scale production, indicating that concentrated feed is the key factor in improving the raw milk output in small-scale modes. The coefficients of free-range and large-scale concentrate feed inputs were not statistically significant.
In terms of roughage, both free-range and small-scale input–output elasticities were small, indicating that the increase of roughage input had a limited effect on improving the output. The direction of the medium-scale factor coefficient was opposite to that of elasticity. This result illustrates that the roughage element had no effect on yield improvement but could promote yield by interacting with other elements. However, it should also be noted that the interaction terms of the medium-scale were insignificant, so there may be a deviation in the conclusion. The large-scale roughage input coefficient was not significant.
In terms of other costs, free-range and small-scale factor inputs positively affected output, and medium-scale and large-scale statistics were insignificant. Due to the variety of other expenses included, it is necessary to further decompose the internal cost structure to analyze the reasons for elasticity.
In terms of the fixed assets, the input–output elasticity of the free-range mode was significantly negative, which illustrates that there are better choices than increasing fixed-asset input for free-range dairy farmers. Due to the very small scale of free-range farming, it is difficult to give full play to the economic benefits of investment in fixed assets such as technology, equipment, and workshops. With the expansion of scale, the economic benefits of fixed assets can gradually appear. This was also indirectly verified by the significantly positive coefficients of the variables in the other three modes.
Finally, only the free-range mode showed a significantly positive result in labor quantity.
4.3. Analysis of Influencing Factors
4.3.1. Theoretical Analysis and Index Selection
Many studies have discussed the factors affecting the production efficiency of raw milk, and the classical literatures and views are as follows.
In terms of natural conditions, soil quality [
17], weather, and climate [
24] may have an impact on raw milk production efficiency. The soil quality influences production and efficiency by affecting the quality of the grass. The weather and climate not only affect the feed quality but also directly affect the milk production performance of cows.
In terms of personal traits of farmers, farming experience [
18], age [
15], and education [
16] may have impacts on raw milk production efficiency. Generally speaking, the older, more experienced, and better educated the farmer is, the more scientific and efficient the dairy farming is.
In terms of farming mode characteristics, the influencing factors include feeding scale [
15], organizational mode [
19], feed input [
20], and concentrate to roughage ratio [
21]. The larger the feeding scale, the lower the scale cost, which is conducive to improving economic efficiency. The organizational model is similar to the idea of feeding scale. Both the feed input and the ratio of concentrate to roughage ratio indicate that the feed structure will affect the production efficiency of raw milk, but the specific level of input is uncertain.
In terms of market and trade characteristics, Laure argues that the degree of integration of downstream markets and the degree of commercialization of farms have impacts on raw milk production efficiency, with commercialized farms being more efficient [
17].
In terms of farming operation characteristics, investment in innovative technologies [
16] and depreciation of fixed assets [
23] reflect the investment in heavy assets, and the investment in technology, equipment, and plants, etc., will obviously have a significant impact on efficiency. The proportion of cattle income to total income [
15] and off-farm work [
22] reflect the importance of raw milk production to total income. With a higher proportion of income from dairy farming, the herders will value dairy farming more as their main source of income, and thus it generally be more productive. On the contrary, it will be less efficient when dairy farming is only a part-time job. Off-farm work is similar to the idea of the proportion of cattle income to total income. In addition, wage level and labor cost [
23,
51] also have impacts on efficiency. However, the function mechanism is not clear. On the one hand, the increase of wage level may stimulate the enthusiasm of employees. However, on the other hand, it will also increase the pressure of farm operations.
Although there are many factors influencing raw milk in relevant studies, most of them have fixed scenarios to which they apply. For example, natural conditions are mostly based on different countries. They generally do not vary much within the same country or region. Personal traits of farmers are generally more commonly studied based on individual farms and less often on macro open-source data. Taking into account the actual situation of raw milk production in China and the availability of macro data, we chose the proportion of concentrate to roughage consumption, raw milk price, wage level, and ratio of fixed assets to total assets as the influencing variables. There is a gap in the level of economic development between different provinces, so there is a large gap in milk price, wages, and asset investment, which may be important reasons for the efficiency gap between different provinces. In addition, medical and epidemic prevention investment can be added as an independent variable of production efficiency. Medical and epidemic prevention appears as a key task, and the main objectives in the important governmental plans, such as Opinions on Further Promoting the Revitalization of Dairy Industry and Action Plan for Improving the Competitiveness of the Dairy Industry During the “the 14th Five-Year Plan”, should be adopted. The medical and epidemic prevention expenses and wage levels were logarithmically treated. The variables are described below (
Table 6). The data were all from the Compilation.
4.3.2. Empirical Results
Referring to the method of Battese and Coelli (1995) [
52], the “one-step” model was adopted:
where
δ is an unknown parameter. The variables
A,
B,
C,
D, and
E represent the concentrate-to-roughage ratio, medical and epidemic prevention investment, raw milk price, wage level, and the ratio of fixed assets to total assets, respectively.
The regression results using Frontier 4.1 are shown in
Table 7, and model fitting was significant according to test coefficients. A positive coefficient indicates a negative correlation between the variable and production efficiency, and a negative coefficient indicates a positive correlation.
Table 7 shows that the pre-set variables had excellent significance on the production efficiency of raw milk, though the influence varied by production scale. The overall significance of medical and epidemic prevention among the five variables was poor. The small-scale medical and epidemic prevention and the large-scale wage level showed no significant effects.
In terms of the concentrate-to-roughage ratio, the medium-scale model showed a negative coefficient, indicating that the increased ratio would improve the production efficiency of raw milk. The yield and quality of raw milk depend primarily on the feed. This, nevertheless, does not mean that more concentrated feed can increase production or that more roughage can reduce costs. A reasonable feed structure can reduce feed costs and maximize the production performance of raw milk.
The coefficient of medical and epidemic prevention expenses was negative in the small-scale model. Medical and epidemic prevention is an important link in the dairy farming process. The occurrence of epidemics will cause substantial losses to the pastures. Therefore, medical and epidemic prevention expenditures are necessary for raw milk production. However, it should be noted that the expenditures on medical and epidemic prevention will not bring direct benefits. The decision about resource investment in reducing risks of loss is a game process. The investment decision should consider the epidemic risk, the size of medical and epidemic prevention expenditures, and other actual situations. Small-scale raw milk production has fewer losses and risks due to disease outbreaks than large-scale. According to the regression results, the current small-scale production is unsuitable for further investment, and the medium-scale and large-scale productions can be strengthened.
In terms of raw milk price, the three significant coefficients are all negative. The conclusion does not match the general perception that the higher the raw milk price, the higher the efficiency. According to He et al. [
53], although milk price will increase profit margins, it will reduce demand at the same time. Dairy farmers can only reduce losses by reducing production, thereby reducing production efficiency. The high cost of producing raw milk, not the price of raw milk, is the real cause of China’s low production efficiency. Domestic raw milk is at a disadvantage in competition with foreign raw milk. With the increase in the price of domestic raw milk, its market share will further shrink. This is the reason why it is difficult to stimulate the improvement of production efficiency with increased milk price.
The coefficients of wage level were positive in the small-scale and medium-scale models. These results indicated that the increase in income will improve the production efficiency of raw milk under the current production level. Increasing employee wages can effectively stimulate enthusiasm for work and improve production efficiency. The large-scale model showed a negative but insignificant coefficient of wage level. When employee wages or efficiency reach a relatively high level, the marginal effect of wages and labor will gradually decrease. The increase in wages has a limited effect on employee motivation, and employee motivation has a limited effect on production efficiency. The production profit is also directly related to the wage level. Increased wages directly reduce the production profit, which affects the normal input of other resources, thus affecting production efficiency. Therefore, there will be an insignificant or even negative relationship between wage level and production efficiency.
The coefficients of fixed assets were negative for medium-scale production but positive under other scales at the significance level of 1%. Generally speaking, increasing fixed assets mean that the farm invests more in modern technology/equipment and refines professional management of cow breeding, which can enhance the control of production and operation and improve resource allocation efficiency. The negative result of fixed assets in medium-scale production reflects the problems in using related assets. High investment in fixed assets imposes a heavier burden on dairy farm management. Blindly expanding production scale and equipment will cause capital pressure and capacity waste, thus negatively affecting overall production efficiency.
5. Discussion of Robustness
In the research on determinants of the production efficiency of raw milk, robustness analysis is weak, with few studies specifically analyzing robustness [
11,
12,
17,
18]. Even if they do, they only focus on the core explanatory variables [
8]. Expanding to the whole field of economy and management, the robustness of determinants of efficiency are rarely mentioned in many articles [
35,
36,
37,
38,
39,
40,
41]. Of course, some scholars have carried out some work on efficiency robustness, such as replacing variables [
54], adjusting the TFP calculation [
55], propensity score matching to test for sample selection bias [
56], correlation coefficients to measure variable covariance [
57], etc.
The reason for poor robust analysis of raw milk efficiency may be that the stochastic frontier model is highly demanding, requiring multiple tests before use. In addition, the parameter estimation of inefficiency equation regression is not based on the least squares method. Many classical robustness tests and refinements have difficulties in combination with SFA.
It is the inadequacy of robust studies of efficiency that has led to differences and even contradictions between some conclusions of raw milk efficiency. Of course, that is not to say that these conclusions are wrong, but it is possible that these conclusions have their own special application scenarios. It is inappropriate to use them to reflect the situation of the whole industry. To enhance the robustness of conclusions, this paper collates the factors that may affect robustness by comparing the relevant literature and then conducting empirical tests. The paper shows that these factors include five aspects. The first is the choice of regression method, which mainly includes the SFA one-step method [
33,
58,
59] and the Tobit two-step method [
41]. The second is the choice of input–output indicators. Scientific theory can only point out the general direction of indicators, but there is still disagreement in the choice of specific indicators. The third is the problem of endogeneity, with possible omitted variables, individual or year fixed effects, etc. [
60]. The fourth is the problem of sample selection bias [
56], which requires sub-sample regressions or split-year regressions [
61]. The fifth is the discussion of other robustness issues, such as possible multicollinearity between variables [
57].
5.1. Regression Method: Tobit Model Instead of “One-Step” Regression
The Tobit model can solve the problem of bias and inconsistency in the “two-stage” regression method. The Tobit regression results are shown in
Table 8. Overall, most of the five preset variables are significant factors affecting the production efficiency of raw milk, which is consistent with the “one-step” regression. However, the direction and magnitude of the coefficients of specific variables are quite different. The coefficients of the Tobit regression results are all small. In addition, the results of the concentrate-to-roughage ratio and the medical and epidemic prevention are significantly different from those in “one-step” regression.
5.2. Indicators: Change Input–Output Indicators
Previous research scarcely discussed the robustness of indicators. This is because the selection of input–output variables is relatively mature when evaluating the efficiency of raw milk production in China, forming a relatively stable set of variables. In addition, to examine the efficiency of raw milk from a macro level, the adjustment space of indicators is narrower due to the limitation of data sources. In addition to milk production, previous related studies also used the “output value of main and by-products” or the “output of main products + output value of by-products” as output variables, which were compared in the index selection section. There is a fundamental difference in the contents they represent, which is related to research direction rather than indicator selection. Some studies did not distinguish between them in detail. The difference in selecting input variables is mainly due to data limitations (e.g., missing data of some relevant indicators) of the Compilation. Some studies discarded the missing data, while others filled in the data, leading to differences in the indicator selection. It is generally believed that the index value of these missing data is not large, so the bias of production efficiency caused by the two data processing methods is limited. To verify whether it will affect the robustness of the research results, this study used three indicators (direct cost, indirect cost, and labor cost) and four indicators (concentrated feed cost, roughage cost, fixed assets, and labor input), respectively, to replace the original input variables. After changing the input–output indicators, there were great differences in efficiency measurement, space-time distribution, the input–output relationship, and influence factors. The final influencing factor coefficients are shown in
Table 9 and
Table 10.
Overall, the results of the new indicators can still show that driving factors have a significant impact on production efficiency, but there are obvious differences in the direction and significance of some specific coefficients, which is inconsistent with the previous assumptions. The choice of input–output factors will significantly impact the robustness of production efficiency. From this point of view, if the data allow more detailed inputs and outputs, the five-indicator scheme in this paper should be adopted.
5.3. Endogenesis: SFA with the Two-Way Fixed-Effects
The two-way fixed-effects model was used to improve the problem of missing variables. The least squares dummy variable method was used for reference to transform the fixed effects of provinces and years into dummy variables. The study introduced (
n − 1) province dummy variables into the influencing factors of production efficiency. The variable value of the corresponding province is 1, and the other is 0. Similarly, each production mode introduced 16 dummy variables of the year. Some dummy variables in the results are significant, indicating that fixed effects exist. The regression results considering fixed effects are shown in
Table 11.
Table 11 shows that after considering fixed effects, part of the explanation is borne by dummy variables, so most of the coefficients become smaller. However, considering that the fixed effect did not generally change the conclusion, it is reasonable to ignore the fixed effect in the literature. On the one hand, the differences in policy support, geographical environment, and other factors among raw milk regions have limited impacts on efficiency, and the significance of the fixed effect is not high enough. On the other hand, some fixed effects have already acted on explanatory variables.
5.4. Sample Bias: Grouped Regression by Year
The nature of production may change considerably over the years. The original data were grouped by year for modeling and regression. The results are shown in
Table 12. It was found that the nature of the production function, the elasticity of input and output, and the significance of the influencing factors changed greatly. The time selection had a greater impact on production efficiency.
5.5. Other Issues: Discussion of Multicollinearity
The variables of the inefficient model may have multicollinearity. The correlation coefficient matrix between variables is shown in
Table 13. There was a strong correlation if the correlation coefficient >0.8.
According to the results, the price of raw milk has a strong correlation with the wage level. The possible reason is that an increase of the wage level leads to the increase of raw milk production cost, so the price of raw milk must be raised under the condition of constant output. According to
Table 7, the significance of small-scale and medium-scale is very strong, and multicollinearity will not affect their conclusions, because the strong correlation of variables weakens the significance of the conclusion. The raw milk price or wage level of the large-scale can be deleted for avoiding multicollinearity. The regression results are as follows (
Table 14). t was found that the overall significance is stronger, indicating that the wage level of mass production has a certain impact on production efficiency.
6. Conclusions and Extensions
Based on the input–output data of raw milk from 2004 to 2020, this paper estimated the production efficiency of raw milk in China using the DEA-Malmquist model and analyzed its spatial and temporal distribution. It then explored the input–output relationship and influencing factors of raw milk production efficiency using the SFA model. Finally, robustness was discussed by analyzing the contradictions and shortcomings of current research.
The study draws several valuable conclusions. First, as a whole, the production efficiency of raw milk in China from 2004 to 2020 fluctuated upward and showed specific regular geographic distribution characteristics, but there were few spatial–temporal differences. Concretely, large-scale production efficiency is the best, and large-scale dairy farming has a comparative advantage. Second, the production nature of the factors differs among production modes. The overall input needs to be increased continually, but some factors may necessitate a slower input in specific cases. Third, the concentrate-to-roughage ratio, medical and epidemic prevention investment, raw milk price, wage level, and fixed assets significantly affect raw milk production efficiency. The influencing factors to improve efficiency must be analyzed according to different production modes. Fourth, the research on the production efficiency of raw milk is less robust. The effect of production efficiency, spatial–temporal distribution, the input–output relationship, and influencing factors vary greatly by treatment method, especially regression methods and the selection of input–output indicators and years. This explains why some research conclusions are different. Some previous studies are difficult to apply to practice because they did not fully consider the actual situation. At the same time, it reminds us that efficiency improvement measures should not be generalized but must be specifically analyzed in combination with practical problems.
Based on the above conclusions and empirical results, the following suggestions and measures are proposed.
First, vigorously promote moderate scale farming and give full play to the farming advantages of different regions. The large-scale production has the best efficiency performance in the four production modes, with a TFP of 1.007, much higher than the other modes. Therefore, China should continue to vigorously develop large-scale farming with 500 head or more to improve the total factor productivity and the comprehensive competitiveness of raw milk. Technological progress is the source of productivity improvement in most provinces, but the volatility of technological progress is dramatic, which indicates that the external environment for raw milk production is not stable. We should strengthen the long-term stability and development mechanism of industry technology progress, organizational innovation, policy regulation, and market environment maintenance. Specific development measures for each scale can be obtained from the analysis of the al distribution characteristics of efficiency. In terms of free-range farming, it should pay attention to the west and south, where free-range efficiency will be higher; in terms of small-scale, attention should be focused on the northeast, where all three provinces are facing a rapid decline; the medium scale should be concentrated to the production areas around big cities, where the farming mode fits in with the scale.
Second, the allocation of dairy farming input factors should be optimized. On the whole, a sustained increase of element input is conducive to an increase in raw milk output. Specifically, free-range families should not to invest too many assets; small-scale farms should strengthen the input of concentrate feed; medium-scale farms should reduce concentrate feed input and carry out moderate fixed-asset input; large-scale farms should continue to carry out continuous investment in fixed assets, the marginal benefit of which is still high.
Third, production from the perspectives of concentrate to roughage, medical and epidemic prevention, raw milk prices, wage levels, and the proportion of fixed assets should be adjusted. (1) There is room for further optimization of China’s current feed structure, and the proportion of refined feed should be increased appropriately to improve the efficiency of raw milk production. However, it should be noted that only reasonable and moderate feed structures maximize production efficiency. Therefore, the appropriate structural proportion should be constantly adjusted in practice according to the changes in the prices of various factors. (2) From the perspective of empirical results, it is currently not advisable to increase medical and epidemic prevention inputs for small-scale production, while the medium-scale and large-scale should continue to invest. However, from the perspective of reality, both small farms and large farms should try to ensure enough medical investment, as neither large nor small farms can bear the consequences of animal epidemics. The government should strengthen the overall layout of disease prevention and strengthen subsidies for herdsmen. (3) Pay attention to the optimization of breeding costs. It is difficult to fundamentally improve the production efficiency of raw milk with milk price. On the contrary, an increase of milk price will decrease the efficiency of dairy farmers. We can only focus on reducing production costs, of which feed costs are the most important. Feed costs account for a large part of raw milk production costs. China’s high feed prices and dependence on imports have led to high breeding costs. In this regard, we should learn from New Zealand and other countries and develop high-quality and low-cost feed, optimize costs from the root, and improve efficiency. (4) Establish appropriate wage standards that ensure the enthusiasm of staff and avoid the cost pressures on the farm. (5) The proportion of investment in fixed assets should be adjusted according to their own actual situation. At present, small farms should not invest too much in fixed assets, as it is difficult to recover the investment. Larger farms can carry out moderate investment, but attention must be paid to avoid capital pressure and efficiency waste.
Fourth, efficiency improvement actions should be fully based on the specific situation. From the robustness discussion in the fifth part, we found that the conclusions under different scales, times, and indicators have certain differences. Therefore, we should not follow the overall trend in the actual efficiency improvement actions of aquaculture plants. Instead, we should carry out targeted research and actions based on our own region, farming scale, actual input and output, and length of future planning.
The present study comprehensively analyzes China’s raw milk production efficiency, detailing data collection and processing, method selection, variable processing, modeling, and robust comparison. It obtained some meaningful conclusions and provided specific thinking paths and reference suggestions for improving the production efficiency of raw milk in China. It is conducive to in-depth understanding of the characteristics of raw milk production in China, thus contributing to promoting the transformation and upgrading of raw milk production and realizing the transition from “a country with high milk production” to “a country with high-efficiency milk production”. This paper has several deficiencies, some of which are worthy of further discussion. First, the representativeness of data is not optimal. On the one hand, this paper has few production-efficiency DMUs. It is questionable whether the overall picture of China’s raw milk production efficiency can be fed back. After all, this paper studies the production efficiency of some provinces. On the other hand, this paper takes provinces as decision objects, and the relevant data are all averaged, which may reduce the efficiency differences between production entities. Therefore, the production efficiency of raw milk in this paper is high, while the efficiency measured based on the pasture is low, and the gap is large. Second, the discussion of heterogeneity is insufficient. Due to data limitations, the DMUs selected for each mode in this paper are inconsistent, so heterogeneity research cannot be well conducted. However, according to the research results in this paper, we speculate that the production properties of different production modes are different. If we show the heterogeneous factors of different raw milk production, the strategies for improving raw milk efficiency will be more targeted and biased. Third, additional influencing factors and mechanisms need to be further explored. Previous studies have identified extra influencing factors, such as experience, education, and the integration degree of downstream markets. Whether and how these factors affect the production efficiency of raw milk deserves further verification and analysis. These limitations can be addressed if the specific pasture in each province can be taken as the DMU, and the corresponding data can be collected.


