Abstract
Pesticide spray drift has been a worldwide concern in terms of potential environmental pollution and ecosystem damage. This study defined the main drift reduction agent (DRA) characteristics that help to understand the drift formation process in agricultural spraying. Seven various DRAs and water were evaluated. Three solutions were created based on the following materials: calcium dodecylbenzenesulfonate, benzenesulfonic acid, C10-13-alkyl derivatives, and calcium salt. Drift measurements were performed by means of the open circuit-type wind tunnel and in the field under conditionally controlled conditions. Air-injector flat spray nozzles and standard flat spray nozzles were used during trials. The spray pressure was 4.0 bar. Solutions were sprayed at different wind speeds (from 2 m s−1 to 10 m s−1, increasing every 2 m s−1). Studies have shown that wind speed and nozzle design have the greatest influence on spray drift. For all DRA solutions studied, the standard flat spray nozzles resulted in ground spray drift, both in the wind tunnel and in the field, which was about two times higher than that of air-injector flat spray nozzles. The spraying of water and all DRA solutions with the air-injector flat spray nozzle showed that all new solutions statistically significantly reduced the drift both in the tunnel and in the field. Ground-drift studies in the wind tunnel showed a trend towards a less intense drift reduction in DRA droplets with increasing wind speed. With DRA7e, the drift can be reduced by up to 56% (at a wind speed of 4 m s−1) and up to 30% (at 10 m s−1). The effect of the solutions on the reduction in spray drift is significantly lower when spraying with standard flat spray nozzles. Spray drift can then be reduced by up to 30% (at a wind speed of 4 m s−1) and up to 12% (at 10 m s−1) for DRA7e.
1. Introduction
To improve the yield and provide an optimal environment for plant growth and to control pests, weeds, and diseases in plants, pesticide (either chemical or biological agents) application is critical in agricultural practice [1,2,3]. The annual global utilization of pesticides is approximately 2 million tons, of which 24% is used in the United States, 45% in Europe, and the rest 25% in the remaining parts of the world [4]. Pests present a serious risk to agriculture, with global annual crop production losses falling up to 40%, according to the FAO [5,6]. Without the protection provided by pesticides, these losses could reach 70–80% [6,7].
The chemical application of pesticides is both one of the most important processes in agricultural production as well as one of the most dangerous agricultural operations. Pesticide applications lead to the contamination of soil not only in the agricultural fields but also in adjacent surface waters and off-crop areas through several sprayed droplets transport processes, such as spray drift, evaporation, deposition, and after-rain events, such as runoff and erosion or drainage [1,8]. Pesticides may be hazardous for both humans and animals [3].
Pesticides are typically applied as spray droplets which are formed when the liquid is sprayed through a hydraulic nozzle [9]. When pesticides are applied to a target plant, part of the pesticides has the potential to enter the surrounding environment and produce new chemicals [10]. Pesticide droplets may be subject to downwind drift, evaporation, retention, adherence, bouncing, or shattering on the soil surface during plant spraying [11,12]. All cases that are not droplet retention on the plant surface are harmful to the environment. Spray drift has always been one of the major concerns in the spray application industry. It is defined as the physical movement of pesticide droplets or particles through the air at the time of pesticide application or soon thereafter from the target site to any non- or off-target site due to wind conditions [13,14]. Pesticide drift is divided into sedimentary (ground) spray drift (falling droplets due to gravity) and airborne spray drift when gaseous and aerosolized pesticides are transported to remote distances [15,16].
Spray droplet size was considered a primary factor affecting spray drift [9,17]. In agricultural sprays, pesticide-containing aqueous droplets historically of a size range within 1–100 μm are produced by the breakup of liquid sheets sprayed from nozzles over crops and fields according to the American Society of Agricultural and Biological Engineers standard S-572 [18]. It is commonly assumed that spray portions with a diameter below 100 μm should be considered susceptible to drift and it clearly also depends on the wind velocity during application [13,16]. In general, the description of droplet distribution refers to the median value of the distribution in relation to the total volume median diameter (VMD). VMD (or Dv50) is volume diameter, indicating that 50% of the spray volume comprises smaller droplets [19]. During the spray process, fine spray droplets are more sensitive to off-target translocation by wind, which causes them to travel long distances and be deposited on neighboring crops or water sources [9,18]. Hong et al. [17] stated that smaller droplets remain in the air longer and are carried farther away by winds. Larger droplets maintain their initial velocity longer than smaller ones and are more likely to be deposited on the intended targets. Previous studies have reported that up to 30% and more (mostly depending on weather conditions) of sprayed pesticides can be lost to drift [20,21]. In addition to weather conditions, spray drift is also influenced by the spray technique and the crop properties [9,20].
With the increasing information concerning the potential risk of pesticides on human health and the environment, numerous mitigation measures for pesticide exposure via spray drift have been developed. They can be divided into technical, technological, organizational, and chemical.
1.1. Technical Means
In agricultural sprayers, nozzles are used in the spraying process. The diameter of the sprayed droplets is strongly influenced by the type of nozzle and the operating pressure. As the solution leaves the nozzle, it tends to form a liquid sheet. Larger droplets are formed when the sheet breaks up closer to the nozzle, whereas smaller droplets are formed when the sheet remains stable and undergoes stretching and thinning before disintegrating [16]. Nozzles should provide adequate plant coverage and ensure the uniform distribution of the sprayed liquid over the entire width of the sprayer boom [22,23]. The most common nozzles used in agriculture are flat-fan and hollow cone nozzles, which produce flat and conical liquid sheets, respectively [18]. Drift reduction using specifically designed equipment, particularly nozzles, has been common for more than 20 years and is part of the regulatory system for protecting surface water from spray drift in many European countries [15]. Drift-reducing nozzles differ in their effectiveness and must be ranked and classified according to their level of drift reduction (50%, 75%, and 90%) compared with a standard flat spray nozzle [15,24,25]. According to the European Food Safety Authority (EFSA), drift-reducing nozzles and other certified drift-reduction technologies or techniques can be considered a risk mitigation measure [25]. The air induction nozzle has become one of the most common techniques for controlling spray drift [26,27]. The use of mechanical shields over boom sprayers and pneumatic shields, i.e., air assist technologies, is also an effective drift-reducing means [22,28]. All technologies generating larger droplets will benefit drift mitigation: low-pressure, pre-orifice, deflector, induction chamber, and air inclusion [13].
1.2. Technological Means
The adjustments of the agricultural sprayer have a considerable influence on the quality of spraying, and at the same time on the drift of droplets. The technological parameters of agricultural sprayers, such as nozzle (boom) height over plants, spray angle, and sprayer travel speed, are thus related to the initial physical factors of droplets and the drift-capability of the spray [13]. Results show an increase in spray drift with the increasing travel speed of the sprayer [29]. The negative impacts of spray drift can be mitigated by the reduction in spray nozzle height over sprayed plants [30]. Balsari et al. [31] stated that coarser sprayed droplets and lower boom height create a smaller drift. However, in praxis, a boom height of 0.5 m is mostly used. The nozzle spacing and the spray angle determine the correct spray height for each nozzle. Wide-angle nozzles also produce smaller droplets, offsetting some of the advantages of a lower boom height [32]. Before spraying the crops, the rate of spray and working pressure is determined for the solution. Smaller droplets are generated by higher pressures [16] and high liquid flow rates [33]. VMD decreased with the increasing flow rates. The initial speed of the sprayed liquid was larger as the flow rate increased, leading to high kinetic energy for fragmentation [33]. Researchers have reported that spraying with a site-specific application rate could help to decrease the number of pesticides in fruits used in precision agriculture by as much as 30–40% or more, with the pesticides deposited on the targets as opposed to most of the pesticides being lost in the surroundings when using conventional pesticide application [34].
1.3. Organizational Means
To ensure the proper use of plant protection products, the European Directive 2009/128/CE (current consolidated version: 26/07/2019) requires the regular technical inspection of sprayers used in Europe [35,36]. Drift reduction measures are also agreed upon in the international standards developed within ISO on methods for the field measurement of spray drift (ISO 22866:2005) and the drift classification of spraying equipment (ISO 22369-1:2006; ISO 22369-2:2010). The European Directive 2009/128/EC for sustainable pesticide use proposes the establishment of buffer zones as a drift-reducing measure in addition to the drift-reducing technologies. Buffer zones are defined as areas of land that allow the treatment area to be separated from non-target areas in order to mitigate the pollution caused by pesticide treatments [19,35]. The use of no-spray or (no-crop) buffer zones and the reduction in exposure using vegetative or artificial windbreaks are among the other mitigation measures for spray drift-reducing technologies [24,37]. Spray drift can be managed by choosing a suitable spraying time. While droplet size is related to susceptibility to drift, wind speed, wind direction, and atmospheric stability are weather factors that influence spray drift and deposition [17]. As wind velocity increases, the drift distance increases and more spraying droplets are lost from the target area [17,38]. Air velocity interacts with sprays because of the wind and the driving speed of the sprayer. It should be pointed out that travel speed is generally not restricted by national regulations as wind conditions during spraying operations are [13]. High air temperatures (over 30 °C) and low relative humidity (less than 60%) decrease the droplet size during transportation and result in more drift due to droplet evaporation [21].
1.4. Chemical Means
The present study is mainly focused on the influence of chemical measures on spray drift. The use of formulated products (spray adjuvants) is a part of agricultural application efforts to minimize spray drift emission. Spray adjuvants are products added to the spray solution with specific functions [39]. There are many types of spray adjuvants with classifications such as surfactants, spreaders, stickers, deposition aids, activators, humectants, anti-foamers, wetting agents, and drift reduction agents (DRA) [40]. DRAs, among other techniques, reduce spray drift by modifying the physical and chemical properties of the pesticide solution, thus producing larger droplets upon spraying that are less prone to drift [16,41]. Adjuvants used in water have been effective at increasing droplet size and reducing the amount of liquid dispensed in small, drift-able size particles [42] and affect droplet diameter and the relative span of the droplet size spectrum, which can lead to better atomization and produce more uniform droplets [43]. DRAs are designed to reduce drift by decreasing the elasticity of droplets, which modifies the breakup of the fluid after it leaves the nozzle [44]. When a certain concentration of adjuvant is added, the spray angle and fan width decreases [45]. The surface tension and viscosity of the spray solution are already considered the most important factors that influence spray drift [9]. Surfactant molecules caused a change in not only surface tension but also the surface concentration of molecules, which affects the spray droplet formation [15]. Solutions with lower dynamic surface tension in view of the droplet surface age reduced the spray droplet drift [46]. The spray angle can be achieved, and spray drift can also be reduced by the addition of polymers into the formulation, which increases its extensional viscosity [44]. The effectiveness of water-soluble adjuvants decreases as air pressure increases [42]. It has been claimed that DRA can reduce spray drift by 50 to 80% [32].
Soaps and oils of various types were some of the materials first used as spray adjuvants [40]. Water-soluble synthetic polymers (polyacrylamide, hydrolyzed polyacrylamide, poly(ethylene oxide), and polyvinyl polymers) were the dominant components of most of the adjuvants that were first designed and marketed for spray drift control [40,44]. Among the utilized polymer-based DRAs are polysaccharides, such as xanthan gum and guar gum [42,44]. Silicone is also used to change the physical and chemical properties of the spray solution, such as surface tension and shear extensional viscosity [9,43]. Most commercial DRAs are based on high molecular weight polymers and possess enhanced extensional viscosity [16].
Polymer-based DRAs are prone to mechanical degradation during spraying which reduces their performance and can produce oversized drops, thus reducing the efficacy of the spray [44]. Polymers have little effect on the surface tension of spray solutions, which is mostly controlled by surfactants.
DRA can also include paraffin-based petroleum oil, modified vegetable oil, and nonionic surfactants. In the study by Griesang et al. [47], the spray drift of the twinjet nozzle was reduced by 80% by using a mixture of phosphatidylcholine (lecithin) and propionic acid in the concentration of 0.125%. However, for the other models of nozzles, the adjuvant did not reduce the spray drift to significant levels.
However, until recently, there was no consensus regarding the impact of spray liquids properties on droplet size and spray drift [48]. A deep understanding of the possible interactions among multiple components in each formulation and the resulting effects on spray performance is still essential. The study by Katzman et al. [16] demonstrates the complex effect of chemical adjuvants and the urgent need to further explore and understand their environmental impact. Some of the most promising prospective active substances in the development of DRAs are calcium dodecyl benzenesulfonate, benzene sulfonic acid, C10-13-alkyl derivatives, and calcium salt.
However, there is limited scientific research regarding the physical properties of the newly developed DRAs on spray drift reduction since much of the previous research has focused on the other active substances of DRAs.
The objective of this study was to evaluate and compare the downwind spray drift of newly developed drift reduction agents depending on the wind speed and two different nozzles in the wind tunnels and in field conditions.
2. Materials and Methods
Experimental tests were conducted in 2021–2022 at the Department of Agricultural Engineering and Safety, Vytautas Magnus University Agriculture Academy in Lithuania. Techniques to measure spray drift and drift potential included those based on field measurements and the use of wind tunnels. From an experimental point of view, the main use of wind tunnels was to produce stable air flows as compared to field conditions [49].
2.1. Drift Reduction Agents and Their Properties
Seven spray drift reduction agents (DRA) were used in the experiments. The liquids sprayed consisted of tap water mixed with recommended concentrations of DRAs. Detailed information on DRAs and recommended concentrations are shown in Table 1.

Table 1.
DRA composition and recommended concentration.
The static (equilibrium) surface tension of each of the seven DRA solutions mentioned was measured with a Digital Tensiometer Easy Dyne (Krüss, Germany) using the Wilhelmy plate technique. The static surface tension of each solution was an averaged value of three measurements only when the deviation of three measurement values was less than 1%. The dynamic surface tension of DRA solutions was measured using a bubble pressure tensiometer BP50 (Krüss, Germany). A minimum of three replicates were carried out for each liquid. The tests were performed at room temperature (+22 °C). The viscosity of solutions (at +20 °C) was determined by using SVM™ 3000 Stabinger Viscometer™ from Anton Paar. The densities (g cm−3) of the DRAs were determined by weighing a volume of 100 mL of the sample. The surface tension, density, and viscosity of the DRA solutions and control (water) are shown in Table 1.
2.2. Wind Tunnel
The wind tunnel (Figure 1) [46] for the experiments was developed according to the methodology described by Farooq et al. [50]. The wind tunnel cross-section increased from 0.9 × 0.9 m at the entrance to 1 × 1 m at the exit with a slope of 0.5°. The chamber was 5 m long in total.
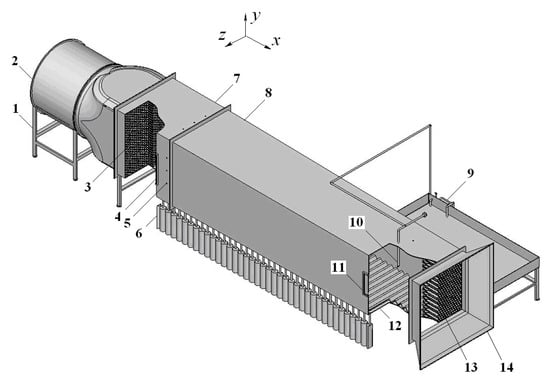
Figure 1.
Wind tunnel for spray drift experiments: 1—frame; 2—suction fan with electric motor; 3, 13—air flow straighteners; 4, 11—window; 5—air velocity measurement place; 6—flask; 7—connection chamber; 8—investigation chamber; 9—spray supply equipment; 10—nozzle; 12—corrugated tin; 14—air intake section.
A ducted axial suction fan ML 1004 DT (Electrovent, Italy) with an impeller diameter of 1000 mm, 10 plastic material airfoil blades, and an electric motor 7SM3 160L4 (power, 15 kW and rotation, 1465 min–1) (Smem, Monza, Italy) were used (Figure 1). Electric motor and impeller rotation speed was controlled using a variable frequency drive Delta VFD-C2000. With the variation of the motor and impeller rotation speed frequency, the lateral wind speed within the wind tunnel (in the opposite direction of the x axis) was also subject to variation from 2 m s–1 to 10 m s–1. To estimate the air velocity within the wind tunnel, measuring equipment [51] that consisted of nine thermal anemometer FS5A sensors (Innovate sensor technology, Switzerland) was used. A grid with nine air velocity sensors was installed across the tunnel cross-section upstream of the nozzle. The configuration was performed by comparing the values obtained to readings of a thermo-anemometer DO9847 (Delta OHM, Italy) air flow measurement device with an accuracy of ±0.05 m s–1 and ±0.1 m s–1, respectively, when the air flow speed was in the range of 0–2 m s–1 and 0–10 m s–1. The measurement error of the complete measurement system was below 2%.
2.3. Spray Drift Experiments in a Wind Tunnel
The fluid sprayed into the wind tunnel was supplied by a Pentair Hypro Shurflo Standard Table Spray 220 VAC, (Pentair PLC, Minneapolis, MN, USA). The nozzle (10 in Figure 1) was positioned at a height of 50 cm (this spray height value is commonly used in agricultural praxis) above the surface of the corrugated tin (12) (i.e., above the liquid collection flasks (6)).
The following nozzles were used for the experiments: air-injector flat spray nozzle Lechler IDK 120-04 (Lechler GmbH, Metzingen, Germany) and standard flat spray nozzle Lechler ST 110-04 (Lechler GmbH, Germany). The flow rate when spraying water and DRA1–DRA4 differs slightly and amounts 1.82 ± 0.03 l min–1 at pressure of 4.0 bar. By using DRA5–DRA7, the flow rate was 1–2% lower. The nozzle was positioned to investigate the effect of lateral air flow on spray drift, i.e., to simulate the conditions under which the wind direction is 90° to the direction of movement of the sprayer when spraying in the field. The major axis of the nozzle spray trace ellipsis (length 170 cm at an air velocity of 0 m s−1) was parallel to the wind tunnel x axis (Figure 1). The spray solution flowed into the collection flasks (6). Solution carried further than a half-length of major axis (85 cm) from the nozzle was considered to be spray drift. A total of 30 L of water or DRAs were sprayed for each experiment. Each test was repeated 3 times. The liquid in each of the 44 flasks was determined and calculated as a percentage.
Water-sensitive paper was a useful tool for assessing spray coverage and airborne spray drift in wind tunnels. Water-sensitive paper sized 26 × 250 mm (Syngenta Crop Protection AG, Switzerland) was used in the airborne spray drift trials (Figure 2) [46]. The paper was placed upright at a 4 m distance from the nozzle in the wind tunnel (Figure 1) and spray duration was 5 s. Spray coverage was defined as the percentage of droplet stain area on the 26 × 250 mm water-sensitive paper. Spray coverage was measured at 0.1 m, 0.2 m, 0.3 m, 0.4 m, and 0.5 m height above the corrugated tin.
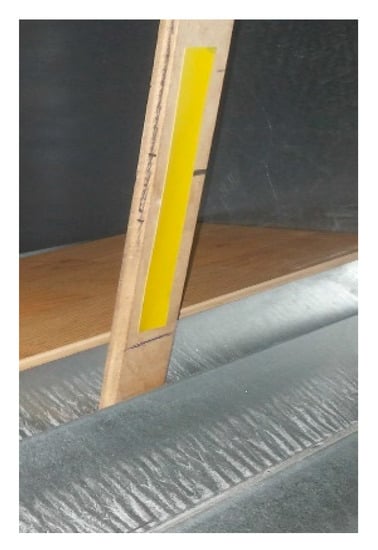
Figure 2.
Water-sensitive paper position (in direction of the y axis from corrugated tin) in the wind tunnel.
The droplet coverage determination data were processed using Gimp 2.8 and DepositScan software [52]. The details of the structure of the wind tunnel and the spray coverage measurement setup have been reported in previous research by our group [46].
2.4. Spray Drift Experiments in Field
To understand the spray drift reduction agent (DRA) distribution in the natural environment, the field experiments were carried out during the daytime from 10:00 AM to 4:00 PM. Air temperature was 10 ± 2 °C, and relative humidity was 75 ± 4%.
A wind machine was designed and manufactured for field research (Figure 3). It consisted of two identical axial fans ML 1004 DT (Electrovent, Italy) with an impeller diameter of 1000 mm, 10 plastic material airfoil blades, an electric motor 7SM3 160L4 (power, 15 kW, and rotation, 1465 min–1) (Smem, Monza, Italy), deflectors, and a flow straightener. Fans were controlled by two variable frequency drives, Delta VFD-C2000. Frequency converters changed the air flow (wind) speed from 2 m s–1 to 10 m s–1 every 2 m s–1. Three newly developed DRAs, namely DRA5e, DRA6e, and DRA7e, were tested in field studies and compared to water. The sprayer attached to the tractor was filled with a prepared solution of the corresponding preparation. For the ground spray drift study, stands (4) were driven into the ground on the surface of the field (Figure 3), which were 1.5, 2.0, 3.0, 4.0, 5.0, 7.5, 10.0, 15.0, and 20.0 m away from the spray zone (target zone) of the sprayer boom (2) (according to ISO 22866:2005). The stands (4) were nailed in such a way that the height of their upper part, where the water-sensitive paper was fixed, was 0.1 m from the ground surface. The sprayer boom (2) was raised to a height of 0.6 m from the ground. Thus, the spray height reached 0.5 m.
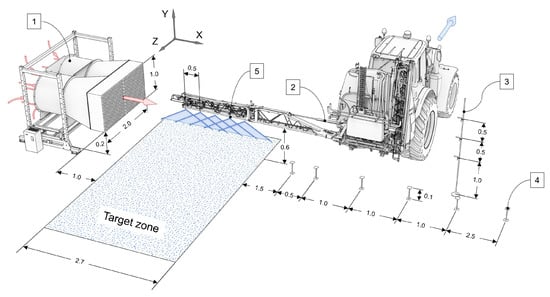
Figure 3.
Setup for field spray drift experiments: 1—fans with frequency converters and air flow straighteners 0.25 m in length; 2—sprayer boom; 3—airborne spray drift setting rod with water sensitive paper attachment points; 4—ground spray drift stands with water sensitive paper attachment points; 5—nozzle. Note: ground spray drift stands at 10, 15, and 20 m away from the spraying area of the sprayer are not shown in the picture.
For the airborne spray drift study, a rod (3 in Figure 3) was driven into the ground on the field’s surface, which was 5.0 m away from the spraying area (target zone) of the sprayer boom (2). At the height of 1.0, 1.5, and 2.0 m, metal plates were welded to the stand, to which water-sensitive paper was attached.
In the field tests, the same nozzles as in the wind tunnel were used: air-injector flat spray nozzles Lechler IDK 120-04 and standard flat spray nozzle Lechler ST 110-04 (Lechler GmbH, Germany). The difference is that in the field tests, not one, but five new nozzles (5) of the corresponding type were installed in the sprayer boom (2) (Figure 3). The target zone of the sprayer was 2.7 m. The spraying pressure was 4.0 bar. The driving speed of the tractor with the sprayer (in the opposite direction of the z axis) was 5 km h–1. When the tractor was traveling at this speed, the sprayer boom was in the air flow zone of the fans for 1.45 s.
To determine the stability of the air flow, its speed moving away from the fan was studied. Five thermal anemometer FS5A sensors (Innovate sensor technology, Switzerland) were set at the height of the center of the fan blades and the width of the two fans, which was 2.0 m. The air flow speed was measured at a distance of 1.0–6.0 m every 1.0 m (Figure 4), moving away from the fans (Figure 3, in direction of the x axis). The results of the study are presented in Figure 5.
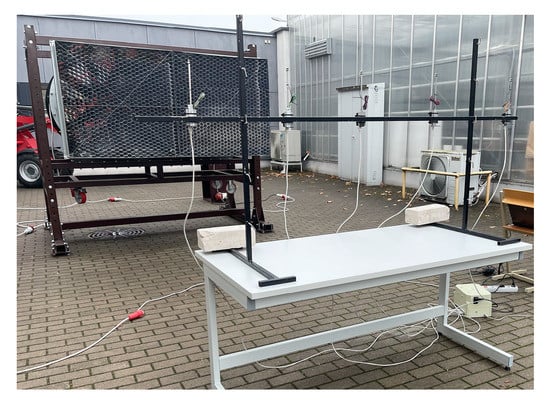
Figure 4.
Air velocity determination equipment.
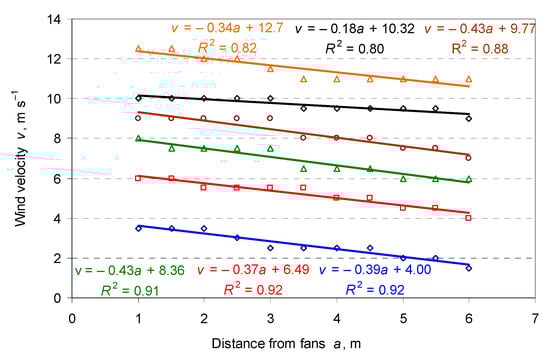
Figure 5.
Variation of air velocity with distance from the fans.
The droplet coverage (on water sensitive paper) determination data were processed using Gimp 2.8 and DepositScan software. Three replicate measurements were carried out for each experimental DRA spray solution and for water.
For the description of droplet distribution, the numerical values of Dv10, Dv90, and Dv50 (or volume median diameter VMD) were determined using DepositScan software. A dimensionless parameter, i.e., relative span (RS) was also calculated. RS was used to measure the spread of the droplet sizes in the spray and quantifies the uniformity of the droplet size distribution. The particle RS was calculated through the following equation: RS = (Dv90 − Dv10)/Dv50 [43].
2.5. Statistical Analysis
For the statistical evaluation of the research results, an ANOVA module with the statistical software Statistica 10.0 was used. Arithmetic averages, standard deviations, and confidence intervals were determined at the p < 0.05 probability level.
3. Results and Discussion
3.1. Ground Spray Drift Research in a Wind Tunnel
Douzals et al. [53] state that one of the most effective and common methods for investigating the dispersion of liquid sprayed by a nozzle is the wind tunnel test. The lateral air velocities chosen in this study are in the range of 2–10 m s−1; however, 6–10 m s−1 are higher than those recommended for spraying agricultural crops. The influence of 6–10 m s−1 velocities on droplet drift was investigated because the wind is rarely constant during spraying operations and gusts often occur. This is particularly true for large fields or fields located in the coastal zone. In the case of commercial (DRA1, DRA2, DRA3, DRA4) and newly developed (DRA5e, DRA6e, DRA7e) solutions, as well as in the case of water (control), a significant increase in the droplet ground spray drift was observed for all the tested solutions, including water, when the air velocity increased from 2 m s−1 to 10 m s−1, at 2 m s−1 intervals (Figure 6). In wind tunnel experiments, other researchers have also found that the fraction of droplets carried downwind increases progressively from 50% to 80% when the air velocity is increased from 2 m s−1 to 10 m s−1 [54]. Al Heidary et al. [13] found that the drift of the spray increases with increasing wind speeds from 2 m s−1 to 4 m s−1 and 7.5 m s−1. Experimental studies have shown that the best result regarding droplet drift, i.e., the lowest drift, was achieved by spraying a newly developed solution, DRA7e, based on benzenesulfonic acid and calcium salt. The correct selection of the class and concentrations of so-called surfactants can significantly reduce the potential risk of drift in agriculture during the application of various products [39], thus increasing the efficiency of the application of solutions [55]. Our study found that increasing the air velocity from 2 m s−1 to 10 m s−1 increased the droplet drift of the DRA7e solution from 1580 m to 5987 mL, corresponding to 5.3% and 20.0%, respectively. Comparing the ground spray drift of the DRA7e solution with that of the water, DRA1, DRA2, DRA3, DRA4, DRA5e, and DRA6e at a lateral air velocity of 2 m s−1, the drift of the DRA7e solution was found to be lower by 48%, 46%, 21%, 22%, 18%, and 12%, respectively. Increasing the lateral air velocity to 4 m s−1 resulted in a lower drift of 56%, 44%, 35%, 36%, 27%, and 7%, respectively, and reaching the highest lateral air velocity tested, i.e., 10 m s−1, resulted in a lower drift of 28%, 24%, 23%, 17%, 15%, and 5%, respectively. Wang et al. [43] suggested that DRA can reduce the drift of spray liquid droplets by up to 65%. Itmeç et al. [56] found that the use of drift-reducing agents reduced ground spray drift by up to 60% at wind speeds of 3.5 m s−1. Other authors have suggested that these agents can reduce droplet drift by 20 to 50% [32]. Comparing commercial solutions and water with each other, the best droplet drift result was achieved by spraying a solution of DRA4 (droplet drift varied from 2050 mL to 7047 mL, corresponding to 6.8% and 23.5%) based on the fatty ester of vegetable oil. A comparison of the drift of the commercial and newly developed solutions with the control showed that all the solutions tested had a lower droplet drift than the control. A comparison of the drift of the commercial and newly developed solutions with the control showed that the drift of the droplets from all the solutions tested was lower than that of the control. When the lateral air velocity varied from 2 m s−1 to 10 m s−1 at 2 m s−1 intervals, the droplet drift of DRA1 was found to be lower than the control (H2O) by 2.9%, 22%, 10%, 6%, and 5%, respectively. For DRA2, it was lower by 2.9%, 21%, 15%, 8%, and 7%; for DRA3—34%, 32%, 14%, 8%, and 13%; for DRA4—33%, 31%, 16%, 18%, and 16%; for DRA5e—36%, 40%, 21%, 22%, and 19%; for DRA6e—41%, 53%, 24%, 23%, and 24%; for DRA7e—48%, 56%, 35%, 27%, and 28%. Drift-reducing agents reduce the dispersion of the sprayed liquid by altering the physical and chemical properties of the liquid, resulting in larger droplets that are less likely to drift when sprayed [16,41]. Materials designed to reduce drift reduce the elasticity of the droplets, which alters the break-up of the liquid as it leaves the nozzle [44] and reduces the spray angle [45]. In our research, DRA5e, DRA6e, and DRA7e were most effective in terms of spray drift reduction. This is due to the higher viscosity of these solutions (Table 1). A higher viscosity leads to a lower number of small diameter droplets [57]. Smaller diameter liquid droplets are known to be less resistant to wind and their spray drift increases.
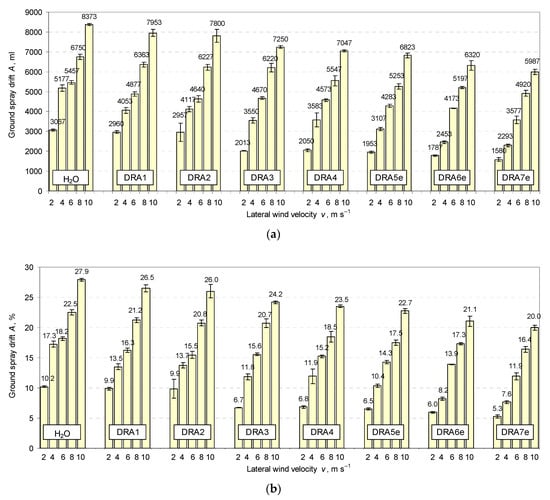
Figure 6.
Droplet ground spray drift as a function of lateral air velocity and solution type for air-injector flat spray nozzle spraying in a wind tunnel: (a) ml; (b) %.
For all solutions and water tested, a significant increase in droplet ground spray drift was observed for all solutions and water with increasing lateral air velocity from 2 m s−1 to 10 m s−1 when sprayed with standard flat spray nozzles (Figure 7). Itmeç et al. [56] also found that droplet drift increases with increasing air velocity, irrespective of the type of solution sprayed. At the highest lateral air velocity (10 m s−1), our study found the lowest drift (11,670 mL or 38.9%) when spraying the newly developed solution DRA7e compared to the other solutions and water studied. The effect of wind on spray drift changes with changing droplet shape [58]. The lowest drift was observed when spraying the DRA7e solution and at lateral air velocities of 2 m s−1, 4 m s−1, 6 m s−1, and 8 m s−1, which varied from 3750 mL, i.e., 12.50% to 10,130 mL, i.e., 33.80%, respectively. The drift potential decreases with decreasing the fraction of small droplets in the solution and with the decreasing of the spray rate [59,60,61]. According to Matthews [62] and Guler et al. [63], droplets with a diameter greater than 100 μm are less likely to drift. Landim et al. [64] and Itmeç et al. [56] found that drift-reducing agents in solutions reduce the proportion of droplets smaller than 100 μm and increase the uniformity of droplet size. Comparing four commercial solutions (DRA1, DRA2, DRA3, and DRA4) with each other, the lowest droplet drift was found for DRA4. At the highest lateral air velocity, the droplet drift of the DRA4 solution was lower than DRA1 and DRA3 by about 4%, lower than DRA2 by about 2%, and lower than the control by about 5% but higher than that of the newly developed solutions (DRA5e, DRA6e, and DRA7e) by about 0.2%, 1.0%, and 8.0%, respectively.
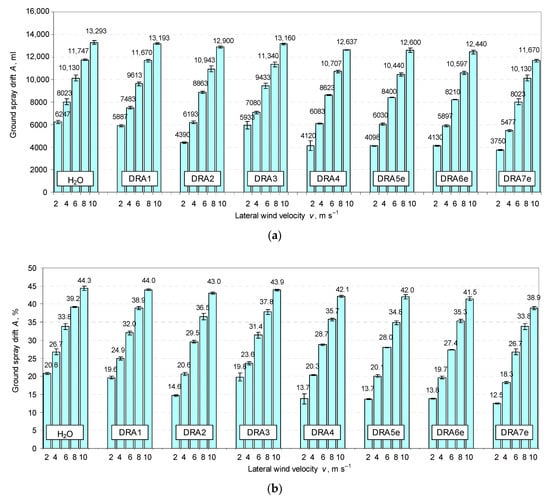
Figure 7.
Droplet ground spray drift as a function of lateral air velocity and solution type when sprayed with standard flat spray nozzles in a wind tunnel: (a) ml; (b) %.
According to the experimental results, air velocity, solution, and nozzles have a major influence on ground spray drift. When comparing the air-injector flat spray nozzles with standard flat spray nozzles, there is a significant drift of the sprayed liquid: about two times higher with the standard flat spray nozzles (Figure 8). This result was not surprising as air-injector flat spray nozzles are known to generate larger droplets than standard flat spray nozzles. Larger droplets are less susceptible to winds due to their greater mass. Griesang et al. [47] suggested that nozzle patterns influence droplet size characteristics and drift. Therefore, in some cases, the greater the reduction in drift, the more it is influenced by the nozzles rather than by the solution used. Itmeç et al. [56] found that increasing the spray pressure from 3 bar to 5 bar increases the droplet drift of sprayed solutions. Hofman and Solseng [32] state that the selection of suitable nozzles depending on the pesticide to be sprayed is particularly important. Our experimental studies demonstrated that for both nozzles studied, the lowest droplet drift was obtained when spraying the newly developed solution DRA7e, compared to two other newly developed solutions, four commercial solutions, and the control. The lowest droplet drift was found for solution DRA4 when comparing the commercial solutions with each other and with the control. When the commercial solution DRA4 was compared with the control when sprayed with air-injector flat spray nozzles at different lateral air velocities (from 2 m s−1 to 10 m s−1 at 2 m s−1 intervals), the droplet ground spray drift was found to be lower in the DRA4 solution by about 33, 31, 16, 18, and 16%, respectively (Figure 8). Under the same spray conditions, the droplet drift found for the DRA4 solution compared to the DRA7e solution was higher by about 22, 36, 22, 11, and 15% for the DRA4 solution, respectively. When the DRA4 solution was sprayed with standard flat spray nozzles at different lateral air velocities (from 2 m s−1 to 10 m s−1, at 2 m s−1 intervals), the droplet drift was found to be lower for DRA4 solution than for the control by about 34, 24, 15, 9, and 5%, respectively, and higher by about 9, 10, 7, 5, and 8%, respectively, than for DRA7e. With increasing lateral air velocity (from 2 m s−1 to 10 m s−1), the droplet ground spray drift increases in a linear dependence, while with a standard flat spray nozzle, the numerical value of the drift increases by ~3.5 percentage points with an increase in air velocity of 1 m s−1, and with an air-injector flat spray nozzle it increases by ~2 percentage points.
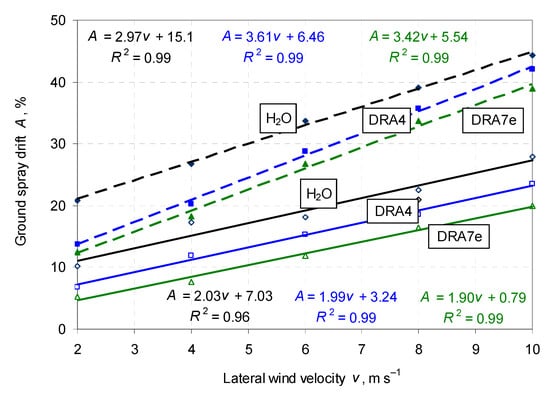
Figure 8.
Droplet ground spray drift as a function of lateral air velocity and solution type for air-injector flat spray ( ) and standard flat spray (
 ) nozzles in a wind tunnel.
) and standard flat spray () nozzles in a wind tunnel.
3.2. Airborne Spray Drift Research in a Wind Tunnel
During the airborne spray drift tests, it was observed that there is a significant difference in spray drift between adjacent (2 m s−1 and 4 m s−1, and between 4 m s−1 and 6 m s−1) lateral air velocities, and it was therefore decided to carry out the tests with two more intermediate wind speeds (3 m s−1 and 5 m s−1). The ground spray drift tests showed that the drift of the newly developed solutions was lower when compared to the four commercial solutions and water, so the airborne spray drift tests were conducted using an air-injector flat spray nozzle to spray water and the three newly developed solutions (DRA5e, DRA6e, and DRA7e) (Table 2). From the experimental studies, it was observed that the droplets coated the water-sensitive paper at lower heights compared to the water spray control. It was also observed that at a lateral air velocity of 2 m s−1, the coverage of solutions DRA6e and DRA7e was zero, as there was not a single droplet on the water-sensitive paper. Comparing the solutions tested, at a wind speed of 8 m s−1 at a height of 0.1 m, the DRA7e solution had the lowest number of droplets (194.3 ± 33.7) and the lowest coverage (10.0 ± 0.9%).
Table 2.
Water-sensitive paper coverage (upper line, %) and number of droplets (lower line) with the air-injector flat spray nozzle spraying in the wind tunnel, 4 m from the nozzle (0.1–0.5 m height measured vertically in direction of the y-axis from corrugated tin, Figure 1).
Ground spray drift tests in a wind tunnel with a standard flat spray nozzle showed that the drift of the solutions is more than two times higher than with the air-injector flat spray nozzle (Figure 8). As the effectiveness of the standard flat spray nozzle spraying was not established, it was decided to use only the two previously best-performing solutions, DRA6e and DRA7e, for these tests (Table 3). In the airborne spray drift wind tunnel tests, it was observed that the results obtained for both solutions were very similar, i.e., there is no significant difference in this parameter. At lower wind speeds of 2, 3, and 4 m s−1, DRA7e showed better results, but in the other three wind speed ranges, DR6e showed slightly lower coverage and droplet count. When comparing the coverage of the solutions using the two different nozzles, the airborne spray drift was about four to five times higher with the standard flat spray nozzles than with air-injector flat spray nozzles.
Table 3.
Water-sensitive paper coverage (upper line, %) and number of droplets (lower line) when spraying with the standard flat spray nozzle in the wind tunnel, 4 m from the nozzle (0.1–0.5 m height measured vertically in direction of the y-axis from the corrugated tin, Figure 1).
3.3. Ground Spray Drift and Airborne Spray Drift Research in Field Conditions
Field experimental studies with air-injector flat spray nozzles mounted on a sprayer boom showed the highest water-sensitive paper coverage of 20 m with both water and the newly developed solutions (DRA5e, DRA6e, and DRA7e) at wind speeds of 8 and 10 m s−1 (Table 4). Water-sensitive paper coverage with the newly developed solutions was found to be up to 66% lower than that of water. At the lowest wind speed (2 m s−1), water-sensitive paper coverage was found to be up to 5 m for all the solutions tested, but DRA7e had the lowest coverage (only 0.1%; the number of droplets was 5.7 ± 3.2) compared to the other solutions tested.
Table 4.
Water-sensitive paper coverage (upper line, %) and number of droplets (lower line) when spraying with a sprayer with five air-injector flat spray nozzles, depending on the target zone of the sprayer.
Our findings (Table 4) are consistent with those of De Schampheleire et al. [57]. They found that the lower the dynamic surface tension value, the more deposition occurs near the nozzle and less away from the nozzle. Comparing the results of DRA5e, DRA6e, and DRA7e at the highest wind speed (10 m s−1), it was found that the lower the dynamic surface tension value (DRA6e solution, Table 1), the more deposition occurs near the target zone of sprayer (1.5 m). Droplet deposition was higher for DRA6e than for DRA5e and DRA7e, 26% and 6%, respectively (Table 4). However, when analyzing the results obtained at a distance of 20 m, it can be seen that DRA7e reduces drift the most successfully, although its dynamic surface tension is higher than DRA6e.
After determining the coverage and the number of droplets of the water-sensitive paper, the numerical values of the droplet size parameters Dv10, Dv50, and Dv90 were determined. The calculated Dv90 numerical value means that 90% of the sprayed droplets have a droplet size equal to or less than the Dv90 value. Dv50 (or VMD) is the volume mean diameter. Similarly, the numerical value of Dv10 indicates that 10% of the sprayed volume consists of droplets smaller than these values. The analysis of the water-sensitive papers showed that the numerical values of the parameters Dv10, Dv50, and Dv90 decrease with distance from the target zone of the sprayer (Figure 9). The results show that droplets with smaller diameters are carried further away. While the Dv50 value for droplets deposited at a distance of 5 m was 180 ± 14 μm, at a distance of 20 m this value was almost three times lower. It was also found that with increasing distance L, the droplets are more uniform, as shown by the functional decrease in RS (Figure 10). The dispersion of the drifted droplets size, depending on the DRAs, was very similar to the results for the DRA7e solution shown in Figure 9.
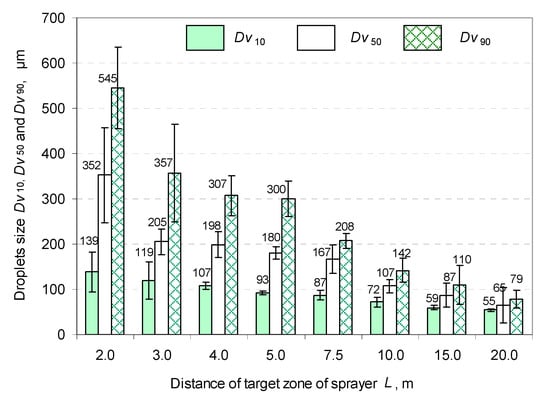
Figure 9.
Droplet size parameters Dv10, Dv50, and Dv90 as a function from distance of target zone of sprayer L when spraying DRA7e with a sprayer with five air-injector flat spray nozzles (lateral wind velocity v = 10 m s−1).
Figure 10.
Relative span RS of droplets as a function from distance of target zone of sprayer L when spraying DRA7e with a sprayer with five air-injector flat spray nozzles (lateral wind velocity v = 10 m s−1).
Airborne spray drift studies observed water-sensitive paper coverage with the droplets of sprayed liquids (water and new solutions) reaching up to 1.5 m of lateral air velocities of 2 and 4 m s−1 (Table 5). At lateral air velocities of 6, 8, and 10 m s−1, water-sensitive paper coverage reached up to 2 m, but water-sensitive paper coverage and the number of droplets decreased with increasing distance for all variants studied. The proportion of droplets carried by the wind was lower for all new solutions developed compared to water. Summarizing the ground spray drift and airborne spray drift experiments, it can be seen that the best result was obtained with the spray solution DRA7e, which is based on benzenesulfonic acid and calcium salt.
Table 5.
Water-sensitive paper coverage (upper line, %) and number of droplets (lower line) at 5 m from the target zone of the sprayer (1.0–2.0 m height measured vertically in direction of the y-axis from ground, Figure 3) by five air-injector flat spray nozzles with a sprayer.
Field experimental studies have shown that both ground spray drift and airborne spray drift are significantly higher with standard flat spray nozzles compared to air-injector flat spray nozzles. When spraying with standard flat spray nozzles, the ground spray drift was found to be as high as 20 m at lateral air velocities of 8 and 10 m s−1 for all the DRAs studied. In DRA5e and DRA7e, solution droplets were detected up to 7.5 m and in DRA6 up to 5 m at the lowest lateral air velocity of 2 m s−1 (Table 6). For the three newly developed DRA solutions, the lowest drift was found for DRA5e in this study, in contrast to previous studies where the best result was obtained for DRA7. In the case of this study, the nozzle pattern may have had a greater influence on droplet drift than the solution [47].
Table 6.
Water-sensitive paper coverage (upper line, %) and number of droplets (lower line) for five standard flat spray nozzles on a sprayer, depending on the target zone of the sprayer.
When sprayed with standard flat spray nozzles, airborne spray drift has a greater positive effect at 2 m height with solution DRA7e compared to solutions DRA5e and DRA6e at lateral air velocities of 8 and 10 m s−1 (Table 7). Studies showed that the drift of solution DRA7e at 2 m height was reduced by about 53% and about 65%, respectively, compared to DRA5e and by about 61% and 58% compared to DRA6e. At 1.5 m, the reduction was about 15% at a lateral air velocity of 8 m s−1 compared to DRA6e and about 13% at a lateral air velocity of 10 m s−1.
Table 7.
Water-sensitive paper coverage (upper line, %) and the number of droplets (lower line) at 5 m from the target zone of the sprayer (1.0–2.0 m height measured vertically in direction of the y-axis from ground, Figure 3) when sprayed with five standard flat spray nozzles using a sprayer.
4. Conclusions
Studies have shown that wind speed and nozzle design have the greatest influence on droplet drift. For all the solutions studied, standard flat spray nozzles produced ground spray drift about two times higher, both in the wind tunnel and in the field, than air-injector flat spray nozzles. For both water and all solutions, air-injector flat spray nozzle spraying was found to reduce drift for all new solutions, both in the tunnel and in the field. Ground-drift studies in the wind tunnel showed a trend towards the less intense drift reduction in DRA droplets with increasing wind speed. With DRA7e, the drift can be reduced by up to 56% (at 4 m s−1) and up to 30% (at 10 m s−1) by an air-injector flat spray nozzle. The effect of the solutions on the reduction in droplet drift is significantly lower when spraying with standard flat spray nozzles. Drift can then be reduced by up to 30% (at 4 m s−1) and up to 12% (at 10 m s−1) for DRA7e by using a standard flat spray nozzle. When comparing the coverage of water-sensitive papers by solution drift droplets using two different nozzles, the airborne spray drift was about four to five times higher with the standard flat spray nozzle than with the air-injector flat spray nozzle.
As the lateral wind speed increases (from 2 m s−1 to 10 m s−1), the ground spray drift of the droplets increases linearly. While with a standard flat spray nozzle the numerical value of the drift increases by ~3.5 percentage points for a 1 m s−1 increase in air velocity, with an air-injector flat spray nozzle it increases by about 2 percentage points. The analysis showed that the numerical values of the parameters Dv10, Dv50, and Dv90 decrease with distance from the target zone of the sprayer. Droplets with smaller diameters are carried further away. While the Dv50 value for DRA7e solutions droplets deposited at a distance of 5 m was 180 ± 14 μm, at a distance of 20 m, this value was almost three times lower when the wind velocity was 10 m s−1. It was also found that with the increasing distance from sprayer, the droplets are more uniform. Summarizing the ground spray drift and airborne spray drift experiments, it can be seen that the best result was achieved with the spray solution DRA7e, which is based on benzenesulfonic acid and calcium salt.
The static and dynamic surface tension and density of the droplets in DRA7e are very similar compared to DRA5e and DRA6e. Only the viscosity of the solutions at 0.1% concentration differs: while the viscosity of DRA7e is 0.7 mPa s, the viscosity of both DRA5e and DRA6e is about 3 times higher. It can be concluded that the last-mentioned parameter had a decisive influence on the droplet drift. When comparing the number of droplets drifted over a given distance in a lateral wind of the same velocity, DRA7e was the one with the highest droplet drift reduction. For example, in a 10 m s−1 wind, about 250 droplets of DRA5e, about 200 droplets of DRA6e and about 160 droplets of DRA7e were drifted over a distance of 2 m. Correspondingly, at a distance of 10 m, 40 droplets each of DRA5e and DRA6e and about 27 droplets of DRA7e were drifted, although the spray distribution parameters Dv50 and RS did not differ significantly.
Author Contributions
Conceptualization, E.Z., D.S. and J.I.; methodology, D.S., T.J. and R.Z.; software, A.A.; validation, T.J. and D.S.; formal analysis, A.A.; investigation, T.J., E.Z., C.V.P. and C.S.; resources, J.I.; data curation, D.S. and T.J; writing—original draft preparation, D.S., A.K. and K.L.; writing—review and editing, A.A., A.K., K.L. and E.Z.; visualization, T.J.; supervision, D.S.; project administration, R.Z.; funding acquisition, J.I. All authors have read and agreed to the published version of the manuscript.
Funding
This article has been prepared in the framework of the EU EUREKA project No. 01.2.2-MITA-K-702-10-0001 “Anti-drift agent’s research and new formulation development”, under the measure No. 01.2.2-MITA-K-702 “Promoting the commercialization and internationalization of R&D results”.
Institutional Review Board Statement
Not applicable.
Data Availability Statement
The data presented in this study are available in the article.
Conflicts of Interest
The authors declare no conflict of interest.
References
- Knauer, K. Pesticides in surface waters: A comparison with regulatory acceptable concentrations (RACs) determined in the authorization process and consideration for regulation. Environ. Sci. Eur. 2016, 28, 13. [Google Scholar] [CrossRef] [PubMed]
- Sharma, A.; Kumar, V.; Shahzad, B.; Tanveer, M.; Sidhu, G.P.S.; Handa, N.; Thukral, A.K. Worldwide pesticide usage and its impacts on ecosystem. SN Appl. Sci. 2019, 1, 1446. [Google Scholar] [CrossRef]
- Zangina, U.; Buyamin, S.; Aman, M.N.; Abidin, M.S.Z.; Mahmud, M.S.A. A greedy approach to improve pesticide application for precision agriculture using model predictive control. Comput. Electron. Agric. 2021, 182, 105984. [Google Scholar] [CrossRef]
- Singh, P.; Singh, V.K.; Singh, R.; Borthakur, A.; Madhav, S.; Ahamad, A.; Mishra, P.K. Bioremediation: A sustainable approach for management of environmental contaminants. In Abatement of Environmental Pollutants; Springer: Berlin/Heidelberg, Germany, 2020; pp. 1–23. [Google Scholar] [CrossRef]
- FAO. Climate change fans spread of pests and threatens plants and crops, new FAO study. In The Food and Agriculture Organization of the United Nations. Accessed January 26, 2022, from FAO—News Article: Climate Change Fans Spread of Pests and Threatens Plants and Crops, New FAO Study; FAO: Rome, Italy, 2022. [Google Scholar]
- Pesticides. The Use of Pesticides in Developing Countries and Their Impact on Health and the Right to Food. European Parliament’s Committee on Development. Available online: https://www.europarl.europa.eu/thinktank/en/document/EXPO_STU(2021)653622 (accessed on 26 January 2022).
- Popp, J.; Pető, K.; Nagy, J. Pesticide productivity and food security. A review. Agron. Sustain. Dev. 2013, 33, 243–255. [Google Scholar] [CrossRef]
- Sybertz, A.; Ottermanns, R.; Schäffer, A.; Scholz-Starke, B.; Daniels, B.; Frische, T.; Roß-Nickoll, M. Simulating spray series of pesticides in agricultural practice reveals evidence for accumulation of environmental risk in soil. Sci. Total Environ. 2020, 710, 135004. [Google Scholar] [CrossRef]
- Hilz, E.; Vermeer, A.W. Spray drift review: The extent to which a formulation can contribute to spray drift reduction. Crop. Prot. 2013, 44, 75–83. [Google Scholar] [CrossRef]
- Tudi, M.; Daniel Ruan, H.; Wang, L.; Lyu, J.; Sadler, R.; Connell, D.; Phung, D.T. Agriculture development, pesticide application and its impact on the environment. Int. J. Environ. Res. Public Health 2021, 18, 1112. [Google Scholar] [CrossRef]
- Dorr, G.J.; Wang, S.; Mayo, L.C.; McCue, S.W.; Forster, W.A.; Hanan, J.; He, X. Impaction of spray droplets on leaves: Influence of formulation and leaf character on shatter, bounce and adhesion. Exp. Fluids 2015, 56, 143. [Google Scholar] [CrossRef]
- Roten, R.L.; Post, S.L.; Werner, A.; Hewitt, A.J.; Safa, M. Volumetric validation of mass balance using a computational phase Doppler approach for disc core nozzles. Crop. Prot. 2016, 79, 128–134. [Google Scholar] [CrossRef]
- Al Heidary, M.; Douzals, J.P.; Sinfort, C.; Vallet, A. Influence of spray characteristics on potential spray drift of field crop sprayers: A literature review. Crop. Prot. 2014, 63, 120–130. [Google Scholar] [CrossRef]
- Unitesd States Environmental Protection Agency. Spray drift. US EPA: Washington, DC, USA, 2022. [Google Scholar]
- Butler Ellis, M.C.; Lane, A.G.; O′Sullivan, C.M.; Jones, S. Wind tunnel investigation of the ability of drift-reducing nozzles to provide mitigation measures for bystander exposure to pesticides. Biosyst. Eng. 2021, 202, 152–164. [Google Scholar] [CrossRef]
- Katzman, D.; Bohbot-Raviv, Y.; Dubowski, Y. Does polyacrylamide-based adjuvant actually reduce primary drift of airborne pesticides. Sci. Total Environ. 2021, 775, 145816. [Google Scholar] [CrossRef] [PubMed]
- Hong, S.W.; Park, J.; Jeong, H.; Lee, S.; Choi, L.; Zhao, L.; Zhu, H. Fluid dynamic approaches for prediction of spray drift from ground pesticide applications: A review. Agronomy 2021, 11, 1182. [Google Scholar] [CrossRef]
- Makhnenko, I.; Alonzi, E.R.; Fredericks, S.A.; Colby, C.M.; Dutcher, C.S. A review of liquid sheet breakup: Perspectives from agricultural sprays. J. Aerosol Sci. 2021, 157, 105805. [Google Scholar] [CrossRef]
- Torrent, X.; Gregorio, E.; Rosell-Polo, J.R.; Arnó, J.; Peris, M.; Van de Zande, J.C.; Planas, S. Determination of spray drift and buffer zones in 3D crops using the ISO standard and new LiDAR methodologies. Sci. Total Environ. 2020, 714, 136666. [Google Scholar] [CrossRef] [PubMed]
- Perine, J.; Anderson, J.C.; Kruger, G.R.; Abi-Akar, F.; Overmyer, J. Effect of nozzle selection on deposition of thiamethoxam in Actara® spray drift and implications for off-field risk assessment. Sci. Total Environ. 2021, 772, 144808. [Google Scholar] [CrossRef]
- Xue, S.; Xi, X.; Lan, Z.; Wen, R.; Ma, X. Longitudinal drift behaviors and spatial transport efficiency for spraying pesticide droplets. Int. J. Heat Mass Transf. 2021, 177, 121516. [Google Scholar] [CrossRef]
- Zhao, H.; Xie, C.; Liu, F.; He, X.; Zhang, J.; Song, J. Effects of sprayers and nozzles on spray drift and terminal residues of imidacloprid on wheat. Crop. Prot. 2014, 60, 78–82. [Google Scholar] [CrossRef]
- Kluza, P.A.; Kuna-Broniowska, I.; Parafiniuk, S. Modeling and prediction of the uniformity of spray liquid coverage from flat fan spray nozzles. Sustainability 2019, 11, 6716. [Google Scholar] [CrossRef]
- Reichenberger, S.; Bach, M.; Skitschak, A.; Frede, H.G. Mitigation strategies to reduce pesticide inputs into ground-and surface water and their effectiveness; a review. Sci. Total Environ. 2007, 384, 1–35. [Google Scholar] [CrossRef]
- Charistou, A.; Coja, T.; Craig, P.; Hamey, P.; Martin, S.; Sanvido, O.; Chiusolo, A.; Colas, M.; Istace, F. Guidance on the assessment of exposure of operators, workers, residents and bystanders in risk assessment of plant protection products. EFSA J. 2022, 20, 7032. [Google Scholar] [CrossRef]
- Abdelmotalib, H.M.; Dafsari, R.A.; Seung-Hwa, Y.; Lee, J. Computational study of internal flow characteristics of the air induction nozzle. Int. J. Mech. Sci. 2021, 204, 106578. [Google Scholar] [CrossRef]
- Dafsari, R.A.; Yu, S.; Choi, Y.; Lee, J. Effect of geometrical parameters of air-induction nozzles on droplet characteristics and behaviour. Biosyst. Eng. 2021, 209, 14–29. [Google Scholar] [CrossRef]
- Henry, R.S.; Claussen, S.; Kruger, G.R. A comparison of an unhooded and hooded sprayer for pesticide drift reduction. J. Agric. Eng. 2014, 1, 43–51. [Google Scholar] [CrossRef]
- Van de Zande, J.; Stallinga, H.; Michielsen, J.M.G.P.; Van Velde, P. Effect of Sprayer Speed on Spray Drift. In Proceedings of the International Conference on Pesticide Application for Drift Management, Waikoloa, Hawaii, 27–29 October 2004; pp. 339a–339j. [Google Scholar]
- Grella, M.; Marucco, P.; Balafoutis, A.T.; Balsari, P. Spray drift generated in vineyard during under-row weed control and suckering: Evaluation of direct and indirect drift-reducing techniques. Sustainability 2020, 12, 5068. [Google Scholar] [CrossRef]
- Balsari, P.; Gil, E.; Marucco, P.; Van de Zande, J.C.; Nuyttens, D.; Herbst, A.; Gallart, M. Field-crop-sprayer potential drift measured using test bench: Effects of boom height and nozzle type. Biosyst. Eng. 2017, 154, 3–13. [Google Scholar] [CrossRef]
- Hofman, V.; Solseng, E. Reducing Spray Drift; North Dakota State University: Fargo, ND, USA, 2001. [Google Scholar]
- He, Y.; Wu, J.; Fu, H.; Sun, Z.; Fang, H.; Wang, W. Quantitative analysis of droplet size distribution in plant protection spray based on machine learning method. Water 2022, 14, 175. [Google Scholar] [CrossRef]
- Abbas, I.; Liu, J.; Faheem, M.; Noor, R.S.; Shaikh, S.A.; Solangi, K.A.; Raza, S.M. Different sensor based intelligent spraying systems in Agriculture. Sens. Actuators A Phys. 2020, 316, 112265. [Google Scholar] [CrossRef]
- Sustainable Use of Pesticides. Directive 2009/128/EC of the European Parliament and of the Council of 21 October 2009 Establishing a Framework for Community Action to Achieve the Sustainable Use of Pesticides. 2009. Available online: https://eur-lex.europa.eu/LexUriServ/LexUriServ.do?uri=OJ:L:2009:309:0071:0086:en:PDF (accessed on 1 February 2022).
- Vanella, G.; Salyani, M.; Balsari, P. Effect of the nozzle adaptor of sprayer calibrator on flow rate measurements. Crop. Prot. 2011, 30, 1043–1047. [Google Scholar] [CrossRef]
- FOCUS. Landscape And Mitigation Factors In Aquatic Risk Assessment. 2007. Available online: https://esdac.jrc.ec.europa.eu/public_path/projects_data/focus/lm/docs/FOCUS%20LM%20Volume%201%20v2_0.pdf (accessed on 1 February 2022).
- Wang, G.; Han, Y.; Li, X.; Andaloro, J.; Chen, P.; Hoffmann, W.C.; Lan, Y. Field evaluation of spray drift and environmental impact using an agricultural unmanned aerial vehicle (UAV) sprayer. Sci. Total Environ. 2020, 737, 139793. [Google Scholar] [CrossRef]
- De Oliveira, R.B.; Antuniassi, U.R.; Gandolfo, M.A. Spray adjuvant characteristics affecting agricultural spraying drift. Eng. Agrícola 2015, 35, 109–116. [Google Scholar] [CrossRef]
- Lan, Y.; Hoffmann, W.C.; Fritz, B.K.; Martin, D.E.; Lopez, J.D. Spray drift mitigation with spray mix adjuvants. Appl. Eng. Agric. 2008, 24, 5–10. [Google Scholar] [CrossRef]
- Wang, S.; Li, X.; Zhou, H.; Fan, D.; Lv, X. Influence of tank-mix adjuvants on spray drift in wind tunnel. In Proceedings of the 2020 ASABE Annual International Meeting, 2000045, American Society of Agricultural and Biological Engineers, Omaha, NE, USA, 13–15 July 2020. [Google Scholar] [CrossRef]
- Hanks, J.E. Effect of drift retardant adjuvants on spray droplet size of water and paraffinic oil applied at ultralow volume. Weed Technology 1995, 9, 380–384. [Google Scholar] [CrossRef]
- Wang, S.; He, X.; Song, J.; Wang, S.; Jia, X.; Ling, Y. Effects of xanthan gum on atomization and deposition characteristics in water and Silwet 408 aqueous solution. Int. J. Agric. Biol. Eng. 2018, 11, 29–34. [Google Scholar] [CrossRef]
- Lewis, R.W.; Evans, R.A.; Malic, N.; Saito, K.; Cameron, N.R. Polymeric drift control adjuvants for agricultural spraying. Macromol. Chem. Phys. 2016, 217, 2223–2242. [Google Scholar] [CrossRef]
- Dexter, R.W. The effect of fluid properties on the spray quality from a flat fan nozzle. In Pesticide Formulations and Application Systems; Viets, A.K., Tann, R.S., Mueninghoff, J.C., Eds.; STP 1400; ASTM International: Philadelphia, PA, USA, 2001; Volume 20, pp. 27–43. [Google Scholar]
- Bauša, L.; Steponavičius, D.; Jotautienė, E.; Kemzūraitė, A.; Zaleckas, E. Application of rape pod sealants to reduce adverse environmental impacts. J. Sci. Food Agric. 2018, 98, 2428–2436. [Google Scholar] [CrossRef]
- Griesang, F.; Decaro, R.A.; Dos Santos, C.A.M.; Santos, E.S.; De Lima Roque, N.H.; Da Costa Ferreira, M. How much do adjuvant and nozzles models reduce the spraying drift? Drift in agricultural spraying. Am. J. Plant Sci. 2017, 8, 2785–2794. [Google Scholar] [CrossRef]
- Zhang, X.; Xiong, L. Effect of adjuvants on the spray droplet size of pesticide dilute emulsion. Colloids Surf. A Physicochem. Eng. Asp. 2021, 619, 126557. [Google Scholar] [CrossRef]
- Nuyttens, D.; Taylor, W.A.; De Schampheleire, M.; Verboven, P.; Dekeyser, D. Influence of nozzle type and size on drift potential by means of different wind tunnel evaluation methods. Biosyst. Eng. 2009, 103, 271–280. [Google Scholar] [CrossRef]
- Farooq, M.; Wulfsohn, D.; Ford, R.J. Wind tunnel for spray drift studies. Can. Agric. Eng. 1996, 38, 283–289. [Google Scholar]
- Kiniulis, V.; Juknevičius, D.; Andriušis, A.; Jovarauskas, D.; Steponavičius, D. Experimental study of air flow variation in a combine harvester threshing apparatus. In Mechanika. In Proceedings of the 21th International Conference, Kaunas, Lithuania, 12–13 May 2016; pp. 137–143. [Google Scholar]
- Zhu, H.; Salyani, M.; Fox, R.D. A portable scanning system for evaluation of spray deposit distribution. Comput. Electron. Agric. 2011, 76, 38–43. [Google Scholar] [CrossRef]
- Douzals, J.P.; Heidary, M.A.; Sinfort, C. Spray deposition in a wind tunnel: A kinetic approach of wind speed effects. Asp. Appl. Biol. 2016, 131, 299–309. [Google Scholar]
- Stankevičius, D.; Steponavičius, D.; Kemzūraitė, A. The effect of symmetrical twin flat nozzle on spray drift. Agroengineering Energetics 2020, 25, 88–92. [Google Scholar]
- Preftakes, J.C.; Schleter, J.J.; Kruger, G.R.; Weaver, D.K.; Peterson, K.D. Effect of insecticide formulation and adjuvant combination on agricultural spray drift. PeerJ 2019, 7, 7136. [Google Scholar] [CrossRef] [PubMed]
- Itmeç, M.; Bayat, A.; Bolat, A.; Toraman, M.C.; Soysal, A. Assessment of Spray Drift with Various Adjuvants in a Wind Tunnel. Agronomy 2022, 12, 2377. [Google Scholar] [CrossRef]
- De Schampheleire, M.; Nuyttens, D.; Baetens, K.; Cornelis, W.; Gabriels, D.; Spanoghe, P. Effects on pesticide spray drift of the physicochemical properties of the spray liquid. Precis. Agric. 2009, 10, 409–420. [Google Scholar] [CrossRef]
- Kruger, G.R.; Klein, R.B.; Ogg, C.L.; Vieira, B.C. Spray Drift of Pesticides. Nebraska Extension Publication. 2019. Available online: https://extensionpublications.unl.edu/assets/pdf/g1773.pdf (accessed on 15 February 2022).
- Hewitt, A.J. Spray drift: Impact of requirements to protect the environment. Crop. Protection 2000, 19, 623–627. [Google Scholar] [CrossRef]
- Stainier, C.; Destain, M.F.; Schiffers, B.; Lebeau, F. Droplet size spectra and drift effect of two phenmedipham formulations and four surfactants mixtures. Crop. Prot. 2006, 25, 1238–1243. [Google Scholar] [CrossRef]
- Machado, B.B.; Spadon, G.; Arruda, M.S.; Goncalves, W.N.; Carvalho, A.C.P.L.F.; Rodrigues, J.F. A smartphone application to measure the quality of pest control spraying machines via image analysis. In Proceedings of the 33rd Annual ACM Symposium on Applied Computing, Pau, France, 9–13 April 2018; pp. 956–963. [Google Scholar] [CrossRef]
- Matthews, G.A. Developments in application technology. Environmentalist 2007, 28, 19–24. [Google Scholar] [CrossRef]
- Guler, H.; Zhu, H.; Ozkan, H.E.; Derksen, R.C.; Yu, Y.; Krause, C.R. Spray characteristics and drift reduction potential with air induction and conventional flat-fan nozzles. Trans. ASABE 2007, 50, 745–754. [Google Scholar] [CrossRef]
- Landim, T.N.; da Cunha, J.P.A.R.; Alves, G.S.; Marques, M.G.; Silva, S.M. Interactions between adjuvants and the fungicide azoxystrobin+benzovindiflupyr in hydraulic spraying. Agric. Eng. 2019, 39, 600–606. [Google Scholar] [CrossRef]


Disclaimer/Publisher’s Note: The statements, opinions and data contained in all publications are solely those of the individual author(s) and contributor(s) and not of MDPI and/or the editor(s). MDPI and/or the editor(s) disclaim responsibility for any injury to people or property resulting from any ideas, methods, instructions or products referred to in the content. |
© 2023 by the authors. Licensee MDPI, Basel, Switzerland. This article is an open access article distributed under the terms and conditions of the Creative Commons Attribution (CC BY) license (https://creativecommons.org/licenses/by/4.0/).