Abstract
Real-time crop harvest data acquisition from harvesters during harvesting operations is an important way to understand the distribution of crop harvest in the field. Most real-time monitoring systems for grain yield using sensors are vulnerable to factors such as low accuracy and low real-time performance. To address this phenomenon, a real-time grain yield monitoring system was designed in this study. The real-time monitoring of yield was accomplished by adding three pairs of photoelectric sensors to the elevator of the corn kernel harvester. The system mainly consists of a signal acquisition and processing module, a positioning module and a visualization terminal; the signal acquisition frequency was set to 1 kHz and the response time was 2 ms. When the system operated, the signal acquisition and processing module detected the sensor signal duration of grain blocking the scrapers of the grain elevator in real-time and used the low-potential signal-based corn grain yield calculation model constructed in this study to complete the real-time yield measurement. The results of the bench tests, conducted under several different operating conditions with the simulated elevator test bench built, showed that the error of the system measurement was less than 5%. Field tests were conducted on a Zoomlion 4YZL-5BZH combined corn kernel harvester and the results showed that the average error of measured yield was 3.72%. Compared to the yield measurement method using the weighing method, the average error of the bench test yield measurement was 7.6% and the average error of yield measurement in field trials with a mass flow sensor yield measurement system was 16.38%. It was verified that the system designed in this study has high yield measurement accuracy and real-time yield measurement, and can provide reference for precision agriculture and high yield management.
1. Introduction
Real-time monitoring of crop yield is a key technology to achieve agricultural intelligence. Farmers can make quantitative decisions on planting, fertilization, spraying, variable inputs and positioning implementation plans for the next season’s agricultural production management based on the distribution of yield in the field [1]. The accuracy and timeliness of crop yield measurement are important criteria to evaluate a real-time yield monitoring system. Currently, there are two methods for yield measurement systems: estimating yield before crop harvest, and directly obtaining yield data during crop harvest.
Crop yield estimation is carried out by following three main methods: (1) remote sensing [2,3,4,5,6,7], (2) UAV hyperspectral [8,9,10,11,12,13], (3) modeling of crop growth conditions [14,15,16,17,18,19]. The remote sensing method and UAV hyperspectral method use remote sensing imagery and the crop canopy spectrum to predict crop yield through vegetation index. Modeling crop growth conditions aim to simulate yield studies by simulating the physiological process from seedling emergence to maturity. This method of crop yield estimation has a very high efficacy, but there are some limitations: the size of the spatial scale of sampling affects the estimation accuracy, the model parameters are difficult to obtain accurately and they are affected by the crop variety and growth, which leads to a large influence of uncertainty.
In the process of crop harvesting, sensors can be installed on the combine harvester to obtain the current crop yield directly in the process of harvester operation, and the information of crop yield distribution in the field can be more accurate. There are currently two methods of adding sensors to harvesters: adding sensors to the inside of the grain elevator of the harvester and adding sensors to the location of the grain outlet of the harvester. Zandonadi [20] installed a torque sensor inside the grain elevator of the harvester and designed a yield measurement system based on the correlation characteristics between the tension on the tensioning side of the grain elevator chain and the shaft torque; the test showed that the maximum error of yield measurement was 4.9%. Veal [21] retrofitted tension sensors to the grain elevator chains and used the relationship between the tension on the grain elevator chains and the mass of the harvested grain for yield measurement. The method of measuring yield by adding sensors inside the grain elevator of the harvester did improve the accuracy of yield measurement, but the sensors were costly and difficult to install. To address this problem, Mcnaull [22] installed a grain flow sensor at the grain outlet of the harvester to measure the force generated by the momentum change before and after the grain impacted to achieve real-time measurement of grain quality. Shoji [23] obtained the rotational speed of the screw conveyor winch by adding a speed sensor to determine the mass of grain released each time for yield measurement. Some scholars have also added microwave sensors [24] and capacitance module sensors [25] to the location of the grain outlet of the harvester, using the sensors to measure the moisture content of the grain passing through during harvest for yield measurement. In the method employing the external installation of sensors, the installation of sensors was relatively convenient but the real-time performance of yield measurement of these methods was low or, in other cases, there was insufficient research carried out on the subject. In order to improve real-time yield measurement, Chaiyan [26] used a mass flow sensor to record the flow rate of rice at harvest, converted the flow rate into a digital signal for processing and validated the system in a field test, which had the advantage of real-time yield display. However, the yield measurement accuracy of the system was low, and its minimum yield measurement error was 12.5%. Momin [27] obtained the average yield of sugarcane per hectare in real-time by installing a weighing sensor in the auxiliary trough, but this yield monitoring method requires large changes to the granary and more time to clean the granary. At present, there are few studies on yield measurement systems that can be easily retrofitted with sensors and achieve both high yield accuracy and real-time yield measurement.
In this study, a real-time grain yield measurement system based on photoelectric sensors was designed. For the problem of difficult and costly sensor installation, we adopted the method of installing sensors on the outside of the corn kernel harvester elevator and used low-cost photoelectric sensors. To improve the accuracy of yield measurement, we obtained a computational model of the cumulative low-potential time of grain blocking the photoelectric sensors with grain mass by building a simulated elevator bench. Finally, the operating tracks of the harvester were obtained in real-time through the positioning module of the system. Compared with the existing real-time grain yield monitoring systems, the system in this study was low cost, simple and possessed a stable installation structure, achieving high yield measurement accuracy and real-time yield measurement.
2. Materials and Methods
2.1. Grain Yield Monitoring System Development
2.1.1. Grain Yield Monitoring Principle
The overall structure design of the grain yield monitoring system designed in this study is shown in Figure 1. It mainly consists of photoelectric sensor, signal acquisition and processing module, positioning module and visualization terminal. Three pairs of photoelectric sensors are installed on both sides of the elevator of the corn kernel harvester in a horizontal arrangement, as shown in Figure 1b. The grain is transported to the silo by the scrapers inside the grain elevator; using the scrapers to transport the grain will block the infrared light of the photoelectric sensors. The sensor output signal potential from high to low is measured according to the principles of real-time yield measurement. As shown in Figure 1c, Tn, Tn’ and Tn’’ are the output time of low-potential signals by the sensors when the infrared of the three pairs of photoelectric sensors is blocked by the grain and the scrapers. T4 is the output time of low-potential signals by the sensors when the scrapers are blocked by the sensors. The weight of grain entering the granary in the combine harvester is obtained by measuring the duration of low-potential signals’ output from the photoelectric sensors, using the yield estimation model constructed in this study.
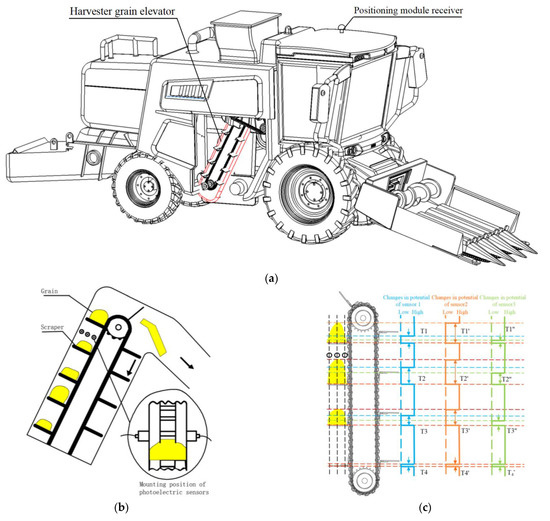
Figure 1.
Grain yield monitoring principle: (a) overall structure diagram of yield monitoring system; (b) photoelectric sensors mounting position; (c) changes in sensor potentials.
2.1.2. Grain Yield Monitoring System Design
The grain yield monitoring system mainly consists of signal acquisition and processing module and positioning module. The signal acquisition and processing module mainly consist of ADC acquisition unit, data processing unit, communication unit, power supply unit, etc. The response time of the system is 2 ms, in which the ADC acquisition unit collects the signals of the photoelectric sensors with the acquisition frequency of 1 kHz. The response time of the photoelectric sensor is 2.5 ms with the selection of E3F-20C/L-type (NPN-type) infrared sensor. The data processing unit can calculate the collected data by yield model and the communication unit will display the calculation results on the page. The power supply unit is powered by a 12 V battery, which is stepped down to 5–3.3 V by the signal acquisition and processing module for powering the ADC acquisition system circuit, data processing unit, communication system circuit and other peripheral circuits. A filtering circuit is introduced to protect all unit circuits. The positioning module adopts Beijing Beidou Xingtong C200-AT-S model (positioning accuracy is 2.5 cm), which is used to obtain information on the trajectory and operating speed of the harvester in the field. The schematic diagram of the yield monitoring system is shown in Figure 2.
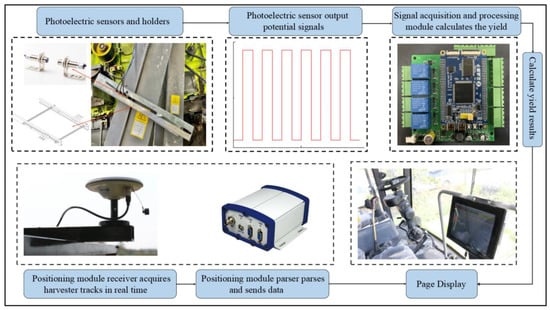
Figure 2.
Schematic diagram of yield monitoring system.
2.2. Yield Calculation Model
2.2.1. Model Construction for Yield Calculation
In order to facilitate the establishment of the relationship between the signal duration of the grain obscuring photoelectric sensors and the grain mass, a grain elevator test bench was built in this study, as shown in Figure 3. According to the actual measured data of Zoomlion 4YZL-5BZH combine harvester grain elevator, the length and width of grain elevator bench are 14 cm and 21 cm, respectively. The grain elevator scraper is installed on the grain elevator chain; its length, width and depth are 11 cm, 7 cm and 1.5 cm respectively. The interval of adjacent scraper is 14 cm, the tilt angle of bench is the actual measured tilt angle of 26°. The side wall of the lift conveyor is installed with photoelectric sensors. The motor drives the sprocket to rotate and the scraper to follow the operation to simulate the operation of the actual combine harvester. The front and side of the grain elevator are made of transparent panels, and the i-SPEED high-speed camera (shooting frequency of 150,000 frames/s) is used to shoot the shape of the grain pile during the operation of the elevator. The pictures of the pile were converted to HSV (color space) to set the grain color threshold and to obtain the shape and area of the grain pile profile in the state of being lifted and transported, as shown in Figure 4a.
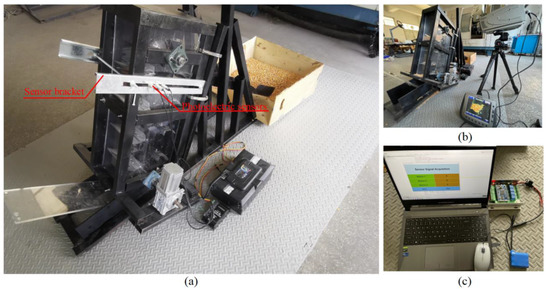
Figure 3.
Physical diagram of the grain elevator bench: (a) elevator simulation bench; (b) high speed shooting; (c) acquisition sensor signal.
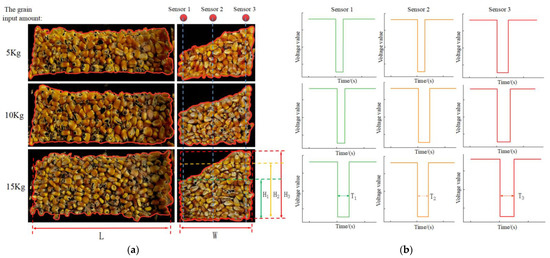
Figure 4.
Different grain input feeding amount tests: (a) outline of grain pile shapes; (b) Sensor feedback signals.
Different masses of corn were poured from the grain inlet, and after 50 shots of the bench simulation test, the contour map of the grain pile after image processing was obtained partially, as shown in Figure 4a. In the process of being lifted, the shape of the grain pile was mostly prisms with right-angle trapezoidal profile on its side. Its volume can be calculated from the side area of the grain pile and the length of the scraper (Figure 4, L). The side area of the grain pile can be calculated from the width of the scraper (Figure 4, W) and the height (Figure 4, H) corresponding to when the photoelectric sensors were blocked by the grain pile. Since the length and width of the scraper are fixed values, the volume of the grain pile is only related to the height corresponding to the photoelectric sensor when it is blocked by the grain pile. However, during the process of the photoelectric sensors being blocked by the grain pile, the scraper of the grain elevator will also block the photoelectric sensors at the same time, which will have an impact on the yield calculation results. Therefore, the value of time T4 of output low-potential signal of sensors blocked by the scraper are measured in advance and the yield calculation model is corrected; that is, the Formula (1) is processed:
where Tx is the total time of photoelectric sensors’ low output for eliminating the effect of the scraper (x = 1, 2, 3), Txn is the total time of photoelectric sensors’ low output when the photoelectric sensors are blocked by the grain pile and the scrapers (x = 1, 2, 3) and T4n is the total time of photoelectric sensors’ low output low the photoelectric sensors are blocked by the scrapers.
In order to obtain a more accurate formula for calculating the volume of the grain pile, this paper compares two ways of calculating the side area of the grain pile: the first one uses the corresponding heights H1 and H3 when the grain pile blocks photoelectric sensor 1 and photoelectric sensor 3 for trapezoidal area calculation. The second one uses the corresponding heights between H1, H2 and H3 when the grain pile blocks photoelectric sensor 1, 2 and 3 for segmented trapezoidal area calculation, which is divided into two segments, H1–H2 and H2–H3, between the areas (H1, H2, H3 as shown in Figure 4a). The side profiles in Figure 4a were processed according to the two area calculation methods, and the area values of the side profile we re extracted by the image processing method. The area results obtained from the calculation are compared with the area results obtained from the image processing; the results are shown in Table 1. The difference between the segmented calculation of the side areas compared with the whole profile calculation was smaller, so the segmented trapezoidal area calculation was used in the yield calculation model to reduce error in this paper. For the grain pile volume in the lift state, the calculation formula is:
where V is the volume of the grain pile, is the speed of the hoist scraper running and L and W are the length and width of the scraper, respectively.

Table 1.
Area values of the side profiles.
When measuring T4 in advance, the output potential of the photoelectric sensors will change from high to low after the scrapers block the photoelectric sensors. Therefore, the duration of a single high level is the time when the sensor is not blocked in the adjacent scraper. Thus, the running speed of the scraper in the grain elevator can be calculated by the distance L1 of the adjacent scraper and the time T5 of a single high-potential time. Since there is a positive proportionality coefficient between the mass and volume of the grain pile as ρ of the linear relationship, Equation (2) is converted as follows:
where m is the grain mass, is the grain density, L1 is the distance between adjacent scrapers and T5 is the duration of a single high-potential time in the photoelectric sensor output potential.
There is, therefore, a proportional relationship between the grain mass and the cumulative low-potential time T of the three photoelectric sensors, calculated as:
where k is the ratio of the photoelectric sensors output value T to the grain mass.
2.2.2. Determination of Model Coefficient Fitting for Yield Calculation
In order to determine the model coefficients (values of k) for yield calculation, this study fitted the proportionality coefficient in Equation (4) by collecting the sensors’ data during the operation of the elevator and the actual weight of the corn at the grain outlet. The bench test was carried out with corn kernels with a moisture content of 15%. The weighing device used for the calibration was a ZZ-02 bench scale with a weighing range of 0–150 kg and a division value of 20 g. During the test, the corn was poured in from the grain inlet at a rate of 0.5 kg/s. The motor drove the chain shaft and, thus, the scraper, and the corn was poured into the grain box through inertia after rising to the highest point. The actual combine harvester will work at different harvesting speeds and different numbers of rows, resulting in differences in the amount of grain fed during harvesting, so the bench test was divided into 4 kinds of grain input amount: 0 kg, 5 kg, 10 kg and 15 kg. The 0 kg of grain is used in the calibration group to eliminate the effect of the scrapers’ thickness blocking the photoelectric sensors. The 4 feed rates were tested 30 times each.
Based on the data from the bench tests, we obtained the accumulated low-potential time of the output of the three photoelectric sensors in each set of tests after eliminating the influence of the scraper; this result was represented on the horizontal axis. The actual weight of the corn at the corresponding grain outlet was represented on the vertical axis. We obtained the discrete distribution of data points as shown in Figure 5, where the data points can be more evenly distributed near the positive proportional auxiliary line. It can be concluded that the photoelectric sensors’ output low-potential accumulation time T and the actual weighing quality is a positive proportional relationship. Therefore, in the SPSS 23 software regression analysis, a linear regression fit without a constant term was used and the fitted k value for the measured data under the three amounts of grain fed was 0.202. The effect of the fitted linear relationship was significant, with R2 of 0.988. Based on this, the value of k in the grain yield calculation model can be considered as 0.202. Therefore, a proportional relationship between the mass of grain in the lift and the cumulative low-potential time T of the three pairs of photoelectric sensors is obtained as follows:
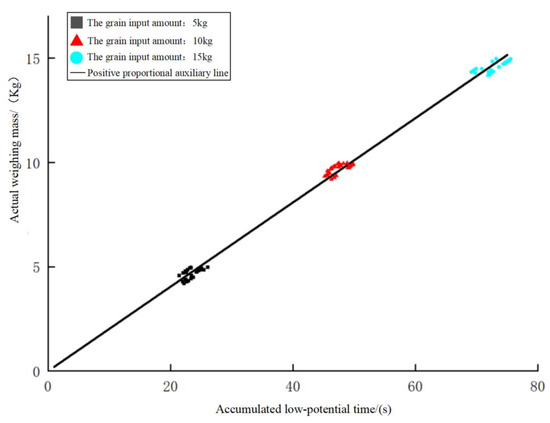
Figure 5.
Fitted line between bench test data and low-potential accumulation time at different feed rates.
2.3. Validation of Yield Measurement Model Accuracy
The actual harvesting operation of the maize seed harvester may vary in terms of harvesting speed, number of rows harvested and the undulation of the ground in the field, resulting in different grain feed, hoist sprocket speed and elevator tilt angle. Therefore, three working conditions were set up in this paper to verify the accuracy of the yield calculation model.
Working condition 1 was when the motor speed was 150 r/min and the tilt angle of the elevator was 26°. We verified the accuracy of the yield measurement with 3 grain input amounts (5 kg, 10 kg, 15 kg).
Working condition 2 was when the grain input amount was 10 kg and the elevator was tilted at an angle of 26°. We verified the accuracy of the yield measurement with 3 motor speeds (120 r/min, 150 r/min, 190 r/min).
Working condition 3 was when the grain input amount was 10 kg and the motor speed was 150 r/min. We verified the accuracy of the yield measurement with 3 tilt angles of the elevator (20°, 26°, 30°). Each variable condition was tested 5 times in each working condition, for a total of 15 tests.
2.4. Field Test
2.4.1. Testing Conditions
A field test of the cereal yield monitoring system was carried out at the Anhui Agricultural University’s Wanbei Comprehensive Experiment Station from September to October 2021. The area of corn planted in the experimental station is 5 hm2. The variety of corn planted in the field was “Anong 591”. The highest yield of the variety was 11.249 (t/hm2). The average temperature during harvest was 28 to 32 °C. As shown in Figure 6a, the grain yield monitoring system was installed on a Zoomlion 4YZL-5BZH combine harvester with 129 kW power, 2.93 m cutting width and 3.2 m3 granary volume. The Beidou positioning receiver of the grain yield monitoring system (the signal acquisition and processing module) was mounted on top of the harvester cockpit. The positioning signal processor and the display were mounted in the cockpit; the scenarios are shown in Figure 6.
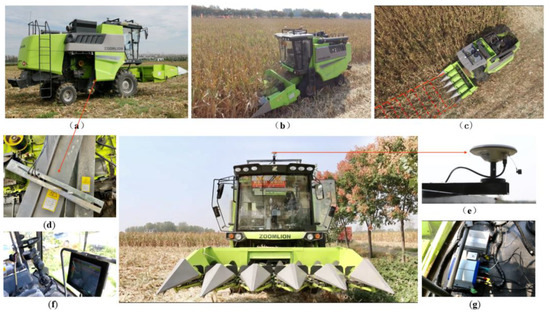
Figure 6.
Field test scenes: (a) elevator position; (b) harvest scenes from field tests; (c) yield grids; (d) mounting position of the sensor; (e) BeiDou signal receiver; (f) display mounting position; (g) data processing side.
2.4.2. Field Harvest Tests
The test scenario of the cornfield harvesting test is shown in Figure 6b. When the field harvesting test conducted, the display showed, in real-time, the current weight of grain, the current total yield and the current driving route calculated by the signal acquisition and processing module. When the harvester’s granary was full, the system was suspended and the weighbridge weighed the harvester before unloading operation. After each full granary, the current system model calculated mass data; actual weighing mass data and harvester driving track data were recorded. In the harvest test, the combine harvested at a speed of 5 km/h.
2.5. System Real-Time Validation Tests
To verify the real-time performance of the real-time grain yield monitoring system in this paper, as shown in Figure 6c, harvesting areas were divided into yield grids, according to the harvester width. These rows were about 3 m wide with a straight-line distance of 1 m of driving. The aim was to compare the accuracy of yield measurement within the yield grid to verify the real-time performance of the feedback data of the system at harvest. During the test, grain storage bags were positioned at the corn harvester’s grain outlet. The harvesting operation was suspended when the path data transmitted by the Beidou differential positioning module in real-time reached 1 m. The grain storage bag was unloaded and weighed, and the calculated quality data and the actual weight of the system model were recorded. The experiment was conducted 10 times with a total of 10 yield grids.
3. Results and Discussion
3.1. Validation Results of Yield Measurement Model Accuracy
The data obtained in the three working conditions are substituted into Equation (5) for yield calculation, and the relative error of their actual grain weighing mass is shown in Figure 7 below.
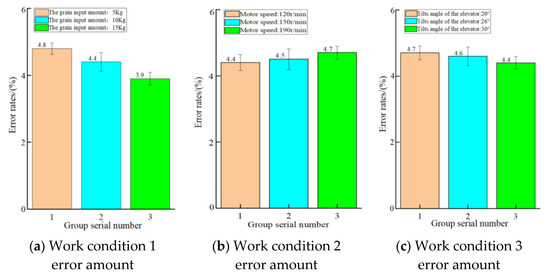
Figure 7.
Relative error value of calculated mass and actual weighing mass.
In working condition 1, the average relative errors between the model’s calculated mass and the actual mass were 4.8 %, 4.4 % and 3.9 % for the grain feed of 5 kg, 10 kg and 15 kg, respectively, with an overall average error of 4.36%.
In working condition 2, the average relative errors between the model’s calculated mass and the actual mass were 4.4%, 4.5% and 4.7% for the motor speed at 120 r/min, 150 r/min and 190 r/min, respectively, with an overall average error of 4.53%.
In working condition 3, the average relative errors between the calculated mass of the model and the actual mass were 4.7%, 4.6% and 4.4% for the tilt angle of the elevator at 20°, 26° and 30°, respectively, with an overall average error of 4.56%. We can conclude that the errors of the yield monitoring system model, using the bench constructed in this study, are less than 5%. The accuracy of yield measurement can meet the requirements of real-time yield monitoring.
3.2. Field Trial Test Results
We used Equation (5) as the calculation model function of the real-time grain yield monitoring system. Using the monitoring system in the field harvest experiments, six groups of model-generated mass and actual mass data were acquired, as shown in Figure 8. The calculated mass of the system in groups 2, 3 and 5 was greater than the actual weighing mass; the error rate of yield measurement in the 6 field harvest tests were 6.6%, 2.6%, 3.15%, 5.08%, 2.7% and 2.16%; the maximum relative error rate was 6.6% and the average relative error rate was 3.72%, with small error fluctuations. According to the results of our study, the grain yield monitoring system possesses advantages for crop yield detection in large areas.
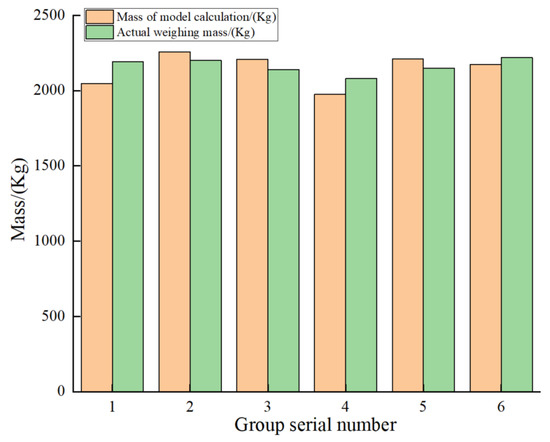
Figure 8.
Field harvesting test data.
3.3. System Real-Time Validation Test Results
The system model calculated the quality of the data of the actual weights of 10 yield grids in the experiment, as shown in Figure 9. The overall yield grid model’s calculated quality is 34.785 kg, the overall actual weighing quality is 34.953 kg and the overall relative error rate is 0.4%. Among these, the quality of the system calculated by the model in the 3rd, 6th, 7th and 9th yield grids is higher than the quality of the actual weight. The highest relative error rate of yield measurement in the 10 yield grids is 3.08% and the average relative error rate is 1.79%. The relative error rate is low, and it can be concluded that the system designed in this study demonstrates strong real-time performance.
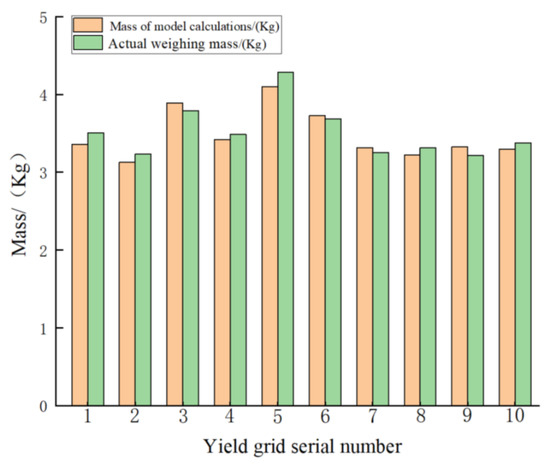
Figure 9.
System real-time validation test data.
3.4. Discussion
In this study, we developed a real-time yield monitoring system for combine harvester grain. We constructed a computational model of the accumulated low-potential time when the photoelectric sensor is obscured by the grain and fitted the model coefficients. The yield measurement accuracy and real-time performance of the system was measured through a bench test and field test. In this study, the real-time yield monitoring system for combine harvester grain was compared with the mass flow sensor-based system [26], the weighing-type yield measurement method [27] and the one pair of photoelectric sensor-based yield monitoring system [28] to evaluate the accuracy of the yield measurement system in bench tests and in field tests. Scholars [26] developed a monitoring system for rice yield that can display the yield of rice in real-time, but the accuracy of yield measurement of the system in this paper is much higher than the previous yield monitoring system. According to the research [27], the weight-based yield measurement method adds a load cell to the grain outlet of the harvester. However, scholars only built a simulated bench and only tested under bench conditions using wheat and corn at different environmental moisture levels, whereas this study carried out bench and field tests, which are more practical. In the literature [28], scholars used only one pair of photoelectric sensors and used the model for yield calculation. In the model constructed in this study, however, we used three pairs of photoelectric sensors, built a simulated bench and used a high-speed camera to capture the grain pile’s operation status, which can make the yield calculation model more accurate.
To verify the superiority of the system used in this study, we built a test bench based on the weight-based yield measurement method, as shown in Figure 10, using the method shown in the literature [27]. The yield accuracy of the yield monitoring system was compared under the bench test and the field test, and real-time validation was illustrated. In terms of yield measurement accuracy, the results of bench tests and field tests are shown in Table 2.
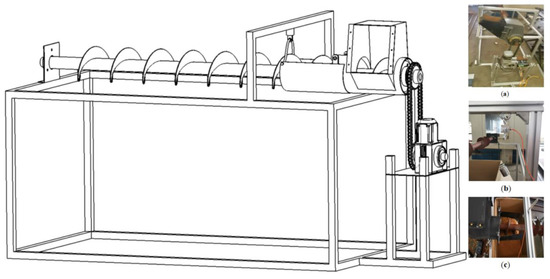
Figure 10.
Test bench for weighing method of yield measurement. (a)actual view of the bench;(b) load cell calibration; (c)weighing method yield test.

Table 2.
Comparison of test results.
In the bench test, under different working conditions of grain input amount, the errors of yield measurement in this study were: 5.1%, 4.4% and 4.5%. The errors of yield measurement by the weighing yield measurement method were 8.2%, 7.9% and 6.8%. At the bench motor speed of 150 r/min and 190 r/min, the measurement errors of this study were 4.6% and 4.5%, and the measurement errors of the weighing method were 7.2% and 6.9%. The yield measurement error in the research [28] is 6.76% when the motor speed of the bench is 190 r/min.
In field tests, the average error of yield measurement in this study was 3.72% and the average error of yield measurement in the literature [28] was 3.83%. The above results showed that the yield measurement error rate of the system designed in this study was lower than that of the other yield measurement methods, regardless of whether it was measured in a bench test or a field test. In terms of real-time yield measurement, the system we developed, and the systems developed in [26] and [28] have real-time capabilities, but only this study verified the strong real-time capability of the proposed system by verifying whether the yield monitoring system possessed high yield measurement accuracy in a short harvest.
The results show that the yield monitoring system in this study is superior than the above three yield measurement methods, because this study adopts three pairs of photoelectric sensors whose signal acquisition units have a high acquisition frequency. In order to improve the accuracy of the yield calculation model, we constructed the yield calculation model by capturing the state of the grain pile when it was lifted in the grain elevator with a high-speed camera to ensure that the grain yield can be calculated accurately. Meanwhile, the system in this study was verified in real-time to ensure that the yield data could be fed back in real-time at the time of harvesting.
In summary, the real-time grain yield monitoring system designed in this study achieved high yield measurement accuracy in real-time. This enables field managers to ascertain the regional harvesting situation of field crops during the harvesting process in real-time and achieve accurate management of the field.
4. Conclusions
Most existing real-time grain yield monitoring systems uses sensors, which are limited by factors such as yield measurement accuracy and insufficient real-time yield measurement. This study designed a real-time grain yield monitoring system for combine harvesters. The system achieved a high yield measurement accuracy and can obtain the current yield of the field area in real-time during the operation of the harvester. Firstly, after simulating the grain elevator bench test, the coefficient of the yield calculation model of this study was 0.202, according to the test data of different grain feeding amounts. Secondly, the yield calculation model was applied and the bench yield measurement test was conducted for three working conditions. The results showed that the average errors of yield measurement were 4.67%, 4.54% and 4.45%. Finally, field tests and real-time yield measurement verification were conducted, and the average yield measurement error of the system was 3.72%. The results show that the system in this study can be advantageous in large-area crop yield detection and can provide real-time crop yield distribution data for field managers.
Author Contributions
Writing—original draft preparation, S.C.; writing—review and editing, Y.Y. and Q.M.; validation, H.H. and D.A.; supervision, J.Q. and J.L. All authors have read and agreed to the published version of the manuscript.
Funding
The research in this article was funded by the National Natural Foundation of China Youth Fund Project (51905004), the University Synergy Innovation Program of Anhui Province (Grant No. GXXT-2020-011).
Institutional Review Board Statement
Not applicable.
Data Availability Statement
Not applicable.
Conflicts of Interest
The authors declare no conflict of interest.
References
- Liu, R.; Sun, Y.; Li, M.; Zhang, M. Development and application experiments of a grain yield monitoring system. Comput. Electron. Agric. 2022, 195, 106851. [Google Scholar] [CrossRef]
- Mann, M.L.; Warner, J.M. Ethiopian wheat yield and yield gap estimation: A spatially explicit small area integrated data approach. Field Crops Res. 2017, 201, 60–74. [Google Scholar] [CrossRef] [PubMed]
- Ahmad, I.; Saeed, U.; Fahad, M. Yield forecasting of spring maize using remote sensing and crop modeling in Faisalabad-Punjab Pakistan. J. Indian Soc. Remote Sens. 2018, 46, 1701–1711. [Google Scholar] [CrossRef]
- Chen, Y.; Mo, W.; Mo, J.; Ding, M. Monitoring of sugarcane growth based on the fused remote sensing NDVI series and ground seeding survey. Trans. Asabe 2021, 63, 1795–1804. [Google Scholar] [CrossRef]
- Gumma, M.K.; Kadiyala, M.; Panjala, P. Assimilation of remote sensing data into crop growth model for yield estimation: A case study from India. J. Indian Soc. Remote Sens. 2022, 50, 257–270. [Google Scholar] [CrossRef]
- Young, L.J. Agricultural Crop Forecasting for Large Geographical Areas. Annu. Rev. Stat. Its Appl. 2019, 6, 173–196. [Google Scholar] [CrossRef]
- Djurfeldt, G.; Hall, O.; Jirström, M.; Archila Bustos, M.; Holmquist, B.; Nasrin, S. Using panel survey and remote sensing data to explain yield gaps for maize in sub-Saharan Africa. J. Land Use Sci. 2018, 13, 344–357. [Google Scholar] [CrossRef]
- Pi, W.; Du, J.; Bi, Y. 3D-CNN based UAV hyperspectral imagery for grassland degradation indicator ground object classification research. Ecol. Inform. 2021, 62, 101278. [Google Scholar] [CrossRef]
- Nasi, R.; Viljanen, N.; Kaivosoja, J. Estimating biomass and nitrogen amount of barley and grass using UAV and aircraft based spectral and photogrammetric 3D features. Remote Sens. 2018, 10, 1082. [Google Scholar] [CrossRef]
- Ballesteros, R.; Ortega, J.F.; Hernandez, D. Combined use of agro-climatic and very high-resolution remote sensing information for crop monitoring. Int. J. Appl. Earth Obs. Geoinf. 2018, 72, 66–75. [Google Scholar] [CrossRef]
- Fan, J.; Zhou, J.; Wang, B. Estimation of maize yield and flowering time using multi-temporal UAV-based hyperspectral data. Remote Sens. 2022, 14, 3052. [Google Scholar] [CrossRef]
- Habte, A.; Worku, W.; Gayler, S. Model-based yield gap analysis and constraints of rainfed sorghum production in Southwest Ethiopia. J. Agric. Sci. 2020, 158, 855–869. [Google Scholar] [CrossRef]
- Fu, Y.; Huang, J.; Shen, Y. A satellite-based method for national winter wheat yield estimating in China. Remote Sens. 2021, 13, 4680. [Google Scholar] [CrossRef]
- Begueria, S.; Maneta, M.P. Qualitative crop condition survey reveals spatiotemporal production patterns and allows early yield prediction. Proc. Natl. Acad. Sci. USA 2020, 117, 18317–18323. [Google Scholar] [CrossRef]
- Zhao, Y.; Vergopolan, N.; Baylis, K. Comparing empirical and survey-based yield forecasts in a dryland agro-ecosystem. Agric. For. Meteorol. 2018, 262, 147–156. [Google Scholar] [CrossRef]
- Wang, J.C.; Holan, S.H.; Nandram, B. A Bayesian Approach to Estimating Agricultural Yield Based on Multiple Repeated Surveys. J. Agric. Biol. Environ. Stat. 2012, 17, 84–106. [Google Scholar] [CrossRef]
- Basso, B.; Liu, L. Seasonal crop yield forecast: Methods, applications, and accuracies. Adv. Agron. 2019, 154, 201–225. [Google Scholar]
- Liu, L.; Basso, B. Linking field survey with crop modeling to forecast maize yield in smallholder farmers’ fields in Tanzania. Food Secur. 2020, 12, 537–548. [Google Scholar] [CrossRef]
- Liu, Z.; Yin, Y.; Pan, J. Yield gap analysis of county level irrigated wheat in Hebei province, China. Agron. J. 2019, 111, 2245–2254. [Google Scholar] [CrossRef]
- Zandonadi, R.S.; Stombaugh, T.S.; Shearer, S.A. Laboratory performance of a mass flow sensor for dry edible bean harvesters. Appl. Eng. Agric. 2009, 26, 11–20. [Google Scholar] [CrossRef]
- Veal, M.w.; Shearer, S.A.; Fulton, J.P. Development and performance assessment of a grain combine feeder house-based mass flow sensing device. Trans. ASABE 2010, 53, 339–348. [Google Scholar] [CrossRef]
- Mcnaull, R.P. Development of a Real-time Algorithm for Automation of the Grain Yield. Monitor Calibration. PhD Dissertion, Lowa State University, Ames, IW, USA, 2016. [Google Scholar]
- Shoji, K.; Matsumoto, L.; Kawamura, T. Impact-by-impact sensing of grain flow on jidatsu combine. Eng. Agric. Environ. Food 2011, 4, 1–6. [Google Scholar] [CrossRef]
- Nelson, S.O.; Trabelsi, S.; Lewis, M.A. Microwave sensing of moisture content and bulk density in flowing grain and seed. Trans. Asabe 2016, 59, 429–433. [Google Scholar]
- Development of a grain yield monitoring system for 55 kW full-type multi-purpose combines. PhD. Dissertion, Chungnam National University, Daejeon, Korea, 2016.
- Sirikun, C.; Samseemoung, G.; Soni, P. A grain yield sensor for yield mapping with local rice combine harvester. Agriculture 2021, 11, 897. [Google Scholar] [CrossRef]
- Chung, S.-O.; Choi, M.-C.; Lee, K.-H. Sensing Technologies for Grain Crop Yield Monitoring Systems: A Review. J. Biosyst. Eng. 2016, 41, 408–417. [Google Scholar] [CrossRef]
- Jin, C.; Cai, Z.; Yang, T. Design and Experiment of Yield Monitoring System of Grain Combine. Trans. Chin. Soc. Agric. Mach. 2022, 53, 1–17. [Google Scholar]
Disclaimer/Publisher’s Note: The statements, opinions and data contained in all publications are solely those of the individual author(s) and contributor(s) and not of MDPI and/or the editor(s). MDPI and/or the editor(s) disclaim responsibility for any injury to people or property resulting from any ideas, methods, instructions or products referred to in the content. |
© 2023 by the authors. Licensee MDPI, Basel, Switzerland. This article is an open access article distributed under the terms and conditions of the Creative Commons Attribution (CC BY) license (https://creativecommons.org/licenses/by/4.0/).