Review

Development, Validation, and Application of Building Energy Simulation Models for Livestock Houses: A Systematic Review

by
Andrea Costantino
Institute of Animal Science and Technology, Universitat Politècnica de València, Camino de Vera s.n., 46022 Valencia, Spain
Agriculture 2023, 13(12), 2280; https://doi.org/10.3390/agriculture13122280
Submission received: 13 October 2023 / Revised: 8 December 2023 / Accepted: 11 December 2023 / Published: 15 December 2023
(This article belongs to the Special Issue Optimization of Livestock Housing Management)

Abstract

:
The need to improve the sustainability of intensive livestock farming has led to an increasing adoption of Building Energy Simulation (BES) models for livestock houses. However, a consolidated body of knowledge specifically dedicated to these models is lacking in literature. This gap represents a significant obstacle to their widespread application and scalability in research and industry. The aim of this work is to pave the way for scaling the adoption of BES models for livestock houses by providing a comprehensive analysis of their application, development, and validation. For this aim, a systematic review of 42 papers—selected from over 795 results from the initial database query—is carried out. The findings underscored a growing body of research that involves BES models for different purposes. However, a common approach in both model development and validation is still lacking. This issue could hinder their scalability as a standard practice, especially in industry, also considering the limitations of BES models highlighted in this work. This review could represent a solid background for future research since provides an up-to-date framework on BES models for livestock houses and identifies future research opportunities. Moreover, it contributes to increasing the reliability of BES models for livestock houses by providing some recommendations for their validation.

1. Introduction

1.1. Background

Animal-derived food products play a significant role in ensuring food security. They account for approximately 25% of the total global protein intake and contribute approximately 18% to global calorie consumption [1]. A substantial share of those food products comes from intensive livestock systems, which contribute to feeding at least 1.3 billion people [2]. In intensive systems, livestock is farmed in livestock houses that are designed and managed to minimize costs and maximize production [3]. Climate control plays a central role in the management of this type of livestock house due to its remarkable impact on different domains of livestock production [4]. Previous works have pointed out how providing adequate indoor climate conditions and avoiding heat stress affects animal productivity in both quantitative [5,6] and qualitative terms [7,8].
Mechanical climate control systems are widely implemented in intensive livestock houses, leading to considerable energy consumption that significantly contributes to the overall energy use of the livestock facilities. Supplemental heating represents up to 96 % of the total thermal energy consumption (around 140 k W h t h m 2 a 1 ) in broiler houses, while ventilation can account between 40 % (up to 11 k W h e l   m 2 a 1 [9]) and 70 % [10] of the total electrical energy consumption. In laying hen houses, ventilation can represent around half of the total electrical energy consumption (20 k W h e l   m 2 a 1 ). Similarly, ventilation and localized heating in pig houses can amount to nearly 50 % (37   k W h e l   m 2 a 1 ) of the total electrical energy consumption [9].
The energy consumption due to climate control has a noteworthy influence from various perspectives. From a financial point of view, it represents a running cost for farmers. In contract broiler production, the cost of energy may be preponderant for growers. Providing heating and electrical energy to the farm may represent a cost that ranges between EUR 0.06 [10] and EUR 0.32 [11] per broiler, depending on the considered context. In contract broiler production, thermal and electrical energy account for 25% and 12% of the total variable costs for the grower, respectively [11]. The energy consumption due to climate control also has a negative impact from the environmental point of view. Greenhouse Gas (GHG) emissions related to on-farm energy use account for up to 8 % of the total from the broiler supply chain, 4 % from the egg supply chain, and 3 % from the pork supply chain [12]. Such high GHG emissions are due to the fact that electricity from the grid and fossil fuels still represent the main energy sources adopted in livestock farms [13], with further negative impacts on food security. The price of livestock commodities (e.g., meat and dairy), in fact, closely follows the oil price which is characterized by a high volatility [14]. This results in higher production costs and increased business risks for the farmers, leading to a subsequent rise in the price of the final products [15].

1.2. Building Energy Simulation (BES) Models for Livestock Houses

To reduce energy consumption due to climate control, improve indoor climate conditions, and decrease the dependence of livestock systems on fossil fuels, new solutions have been studied in recent years, with a focus on passive solutions [16,17] or the implementation of renewable energy technologies, such as geothermal [18] and aerothermal [19] heat pumps, photovoltaic panels [20], and biogas-fed combined heat and power units (CHPs) [21]. Evaluating the effectiveness and the potential of these solutions is a challenging task, typically accomplished via experiments or numerical simulations, which are often performed using Building Energy Simulation (BES) models. BES models are physics-based mathematical models that allow for the estimation of a building energy performance and indoor climate conditions under a given set of boundary conditions and inputs [22]. The use of BES models for analyses of livestock houses has considerably increased in recent years, especially for performing preliminary analyses and system optimizations due to their cost effectiveness, flexibility, and time efficiency. Moreover, BES models are also considered one of the pillars for future energy performance certification schemes for livestock houses [23].
In contrast, BES models are well established in the building sector, where they have been adopted for decades by researchers and practitioners to predict and analyze the energy use and indoor environmental conditions of buildings for human occupancy [24]. The use of BES models is considered crucial for the assessment of the environmental and energy-related impacts of those buildings [25]. The crucial role of BES models in the building sector has led to the development of a vast body of knowledge. Several studies, in fact, are present in the literature providing comprehensive overviews of the state of the art and insights on specific topics. For example, several works have focused on the development and calibration of BES models [22,26,27], as well as on specific modeling topics, such as the estimation of the infiltration rate [28], the modeling of the occupant behavior [29], and thermal zoning [30].

1.3. Research Gap, Aim, and Contributions of This Work

BES models could play a crucial role even in assessing the environmental and energy-related impacts of livestock houses. Although livestock houses share commonalities with buildings for human occupancy, several specificities (e.g., higher ventilation air flow rates and the use of evaporative cooling) make the energy modeling of livestock houses a separate modeling activity [31], which are worth specific and thorough investigations. However, the existing literature lacks a well-established and consolidated body of knowledge specifically dedicated to BES models for livestock houses. This gap poses a significant obstacle to the scalability of BES models, hindering a widespread application in the livestock sector. Only via the establishment of a comprehensive body of knowledge a growing number of BES models can be developed and validated robustly, using standardized and widely accepted methodologies. This paves the way for making BES models a standard practice in both research and, more crucially, industry. The widespread use of BES models during livestock house design and management stages, in fact, may positively impact several aspects, such as energy efficiency.
The objective of this work is to pave the way for scaling the adoption of BES models for livestock houses in livestock sector by providing a comprehensive analysis of the application, development, and validation of BES models. In addition, a discussion about the limitations that should be overcome to scale their adoption among researchers and practitioners. To achieve this objective, the research efforts made in recent years are encapsulated via a systematic review. This review stands as a pioneer in the literature, being the first—according to the author’s knowledge—to delve into the specific topic of BES models for livestock houses. This paper provides valuable insights into the current state of the art by examining several aspects of the development, validation, and application of BES models for livestock houses. Furthermore, it discusses the main limitations of BES models that should be overcome to enhance their scalability and highlight future research directions.
This paper delivers the following scientific contributions:
  • The presentation and thorough critical comparison of the BES models for livestock houses developed in recent years. By doing so, a pioneering and comprehensive overview of this specific area is provided.
  • A critical examination of the validation procedures adopted in BES models for livestock houses accompanied by insightful recommendations to enhance and harmonize the validation process of future BES models. The final aim is to increase the reliability of these models.
  • A critical discussion about the limitations that should be overcome to make BES models a standard practice, especially in industry.
The outcomes of this review consolidate the existing body of knowledge about BES models for livestock houses and represent strong references for enhancing the quality of current and future investigations in this field. Moreover, the results of this work could contribute to establishing the use of BES models as a standard practice in the livestock sector with positive impacts on energy efficiency, environmental impacts, and operational costs.
The paper is structured as follows. After this introductory section (Section 1), the comprehensive methodology employed for this systematic review and the analyses of the retrieved BES models is presented (Section 2). Then, the main results are presented, and the identified BES models are analyzed and compared (Section 3). A critical discussion (Section 4) examines the limitations of BES models that may hinder their scalability and suggests some recommendations for BES validation. Moreover, a discussion about how BES models can contribute to a more environmentally sustainable and resilient livestock sector is provided. Finally, the concluding remarks are provided (Section 5).

2. Materials and Methods

2.1. Review Methodology

The selection process of the academic publications analyzed in this review relies on the methodology adopted in similar works present in the literature [32,33]. The selection process consists of the following steps: (1) scope delimiting; (2) logic grid creation; (3) definitions of the literature database, search rules, and screening criteria; (4) database search; and (5) identification, pre-screening, and final screening. Each one of these steps is described in the following subsections.

2.1.1. Scope Delimiting

The scope of this review is delimited by defining three inclusion conditions. To be included, the retrieved papers must fulfill all of them, which are as follows:
  • The paper should be focused on livestock houses in intensive systems. Papers focused on other livestock systems (e.g., extensive or backyard systems) as well as on other farm structures (e.g., biodigesters or milking parlors) are out of the scope of this review.
  • The paper should be focused on climate control and/or energy aspects. Papers focused on other topics, such as gaseous emissions and waste management, are out of the scope of this work.
  • In the paper, a physics-based BES model for livestock houses should be adopted.
The last inclusion condition (C) excludes Computational Fluid Dynamics (CFD) and Data-Driven (DD) models from the scope of this review. Even though CFD and DD models are also adopted to analyze livestock houses, they are characterized by some distinctive features that set them apart from BES models.
CFD is a computer-based technique aimed at characterizing, interpreting, and quantifying fluid transport phenomena via a numerical solution of the conservation equations [34]. CFD models provide data for each point of the computational domain simultaneously [35]. Thus, they can accurately estimate the airflow behavior and temperature distributions within the enclosure [36]. For this reason, CFD models are usually applied to livestock houses to study ventilation, thermal distribution, heat transfer rates, gaseous emissions, and the dispersion of odors and minor contaminants [34,35]. One of the main disadvantages of CFD simulations is that running simulations can be time-consuming and require significant computing resources [37], especially when turbulent flows are analyzed. Turbulence models, in fact, are usually too computationally expensive to allow routine simulations [35] and to be included in optimization processes, where thousands of simulations are needed [34]. For this reason, analyses performed using CFD simulations are usually limited to hours or days [37].
While CFD models are mainly focused on fluid flow analyses, BES models are mainly focused on the simulation of the building thermal behavior and the performance of climate control systems to primarily investigate energy aspects. However, their focus has also expanded to include the analysis of the indoor thermal environment [36]. Usually, BES models assume the indoor air to be well mixed, with a uniform distribution of air temperature, velocity, humidity, and contaminant contents over the building [36]. This simplification with respect to CFD models enables BES models with a short computing time [37], which makes them suitable for routine simulations, optimization processes, and long period analyses. General examples of applications of BES models are the optimization of building design at the envelope and system level, as well as the assessment of the overall building energy use, thermal load under design conditions, and possible overheating risk [38].
While physics-based BES models are based on physical equations (e.g., heat and mass balance equations) to simulate the thermal behavior of the building, DD models use mathematical methods (e.g., statical methods or artificial learning techniques) to deduce the hidden relationship between inputs and outputs [39]. Thus, the development of DD models requires less in-depth knowledge of the involved physical phenomena. In contrast, adequate datasets are required. These features make DD models particularly well suited for analyzing the system performance of existing buildings, enabling a more accurate estimation of the future system performances under specific boundary conditions [38]. On the other hand, being based on physical equations, BES models can be developed even when the investigated building/system is not real, making them especially suitable for the design stage and the preliminary analyses of experimental solutions. Similarly, not depending on data for their development, forward BES models can also be developed when the investigated variables are difficult to acquire, for example, thermal loads.
Considering the distinctive features regarding the development and applications of BES models highlighted earlier, the scope of this review is limited exclusively to them. Such specific focus ensures a deeper comprehension of the analyzed BES models, apples-to-apples comparisons between them, and detailed analyses of their potentialities and limitations in the specific context of livestock houses.

2.1.2. Logic Grid Creation

Once the scope limits were defined, a logic grid of keywords and alternative terms was created and is reported in Table 1. First, the main keywords were selected. They are “livestock”, “hous*”, “energ*”, and “model*”. The asterisk wildcard was used for the truncation to include in the search significant variations of the same word, such as housing and houses for “hous*”. For each keyword, alternative terms were identified to make the search broader and more extensive. The identified alternative terms are reported in the rows below each keyword in Table 1. As visible in the table, several alternative terms were identified—especially for “livestock” and “hous*”—to minimize possible biases in the keyword selection. Please note that the asterisk wildcard was used only for those terms that were considered to have significant variations. Minor variations due to plural or misspellings are directly considered by the search engine of scientific databases.

2.1.3. Definitions of the Literature Database, Search Rules, and Screening Criteria

The literature database adopted for this research was Scopus®. The search was limited to English research papers that were published in peer-reviewed scientific journals. This criterion was set since these publications were considered of higher quality than grey literature, tertiary literature, and conference papers. A 25-year time span was considered for the research. Thus, only papers published between 1998 and 2023 were included in the research.

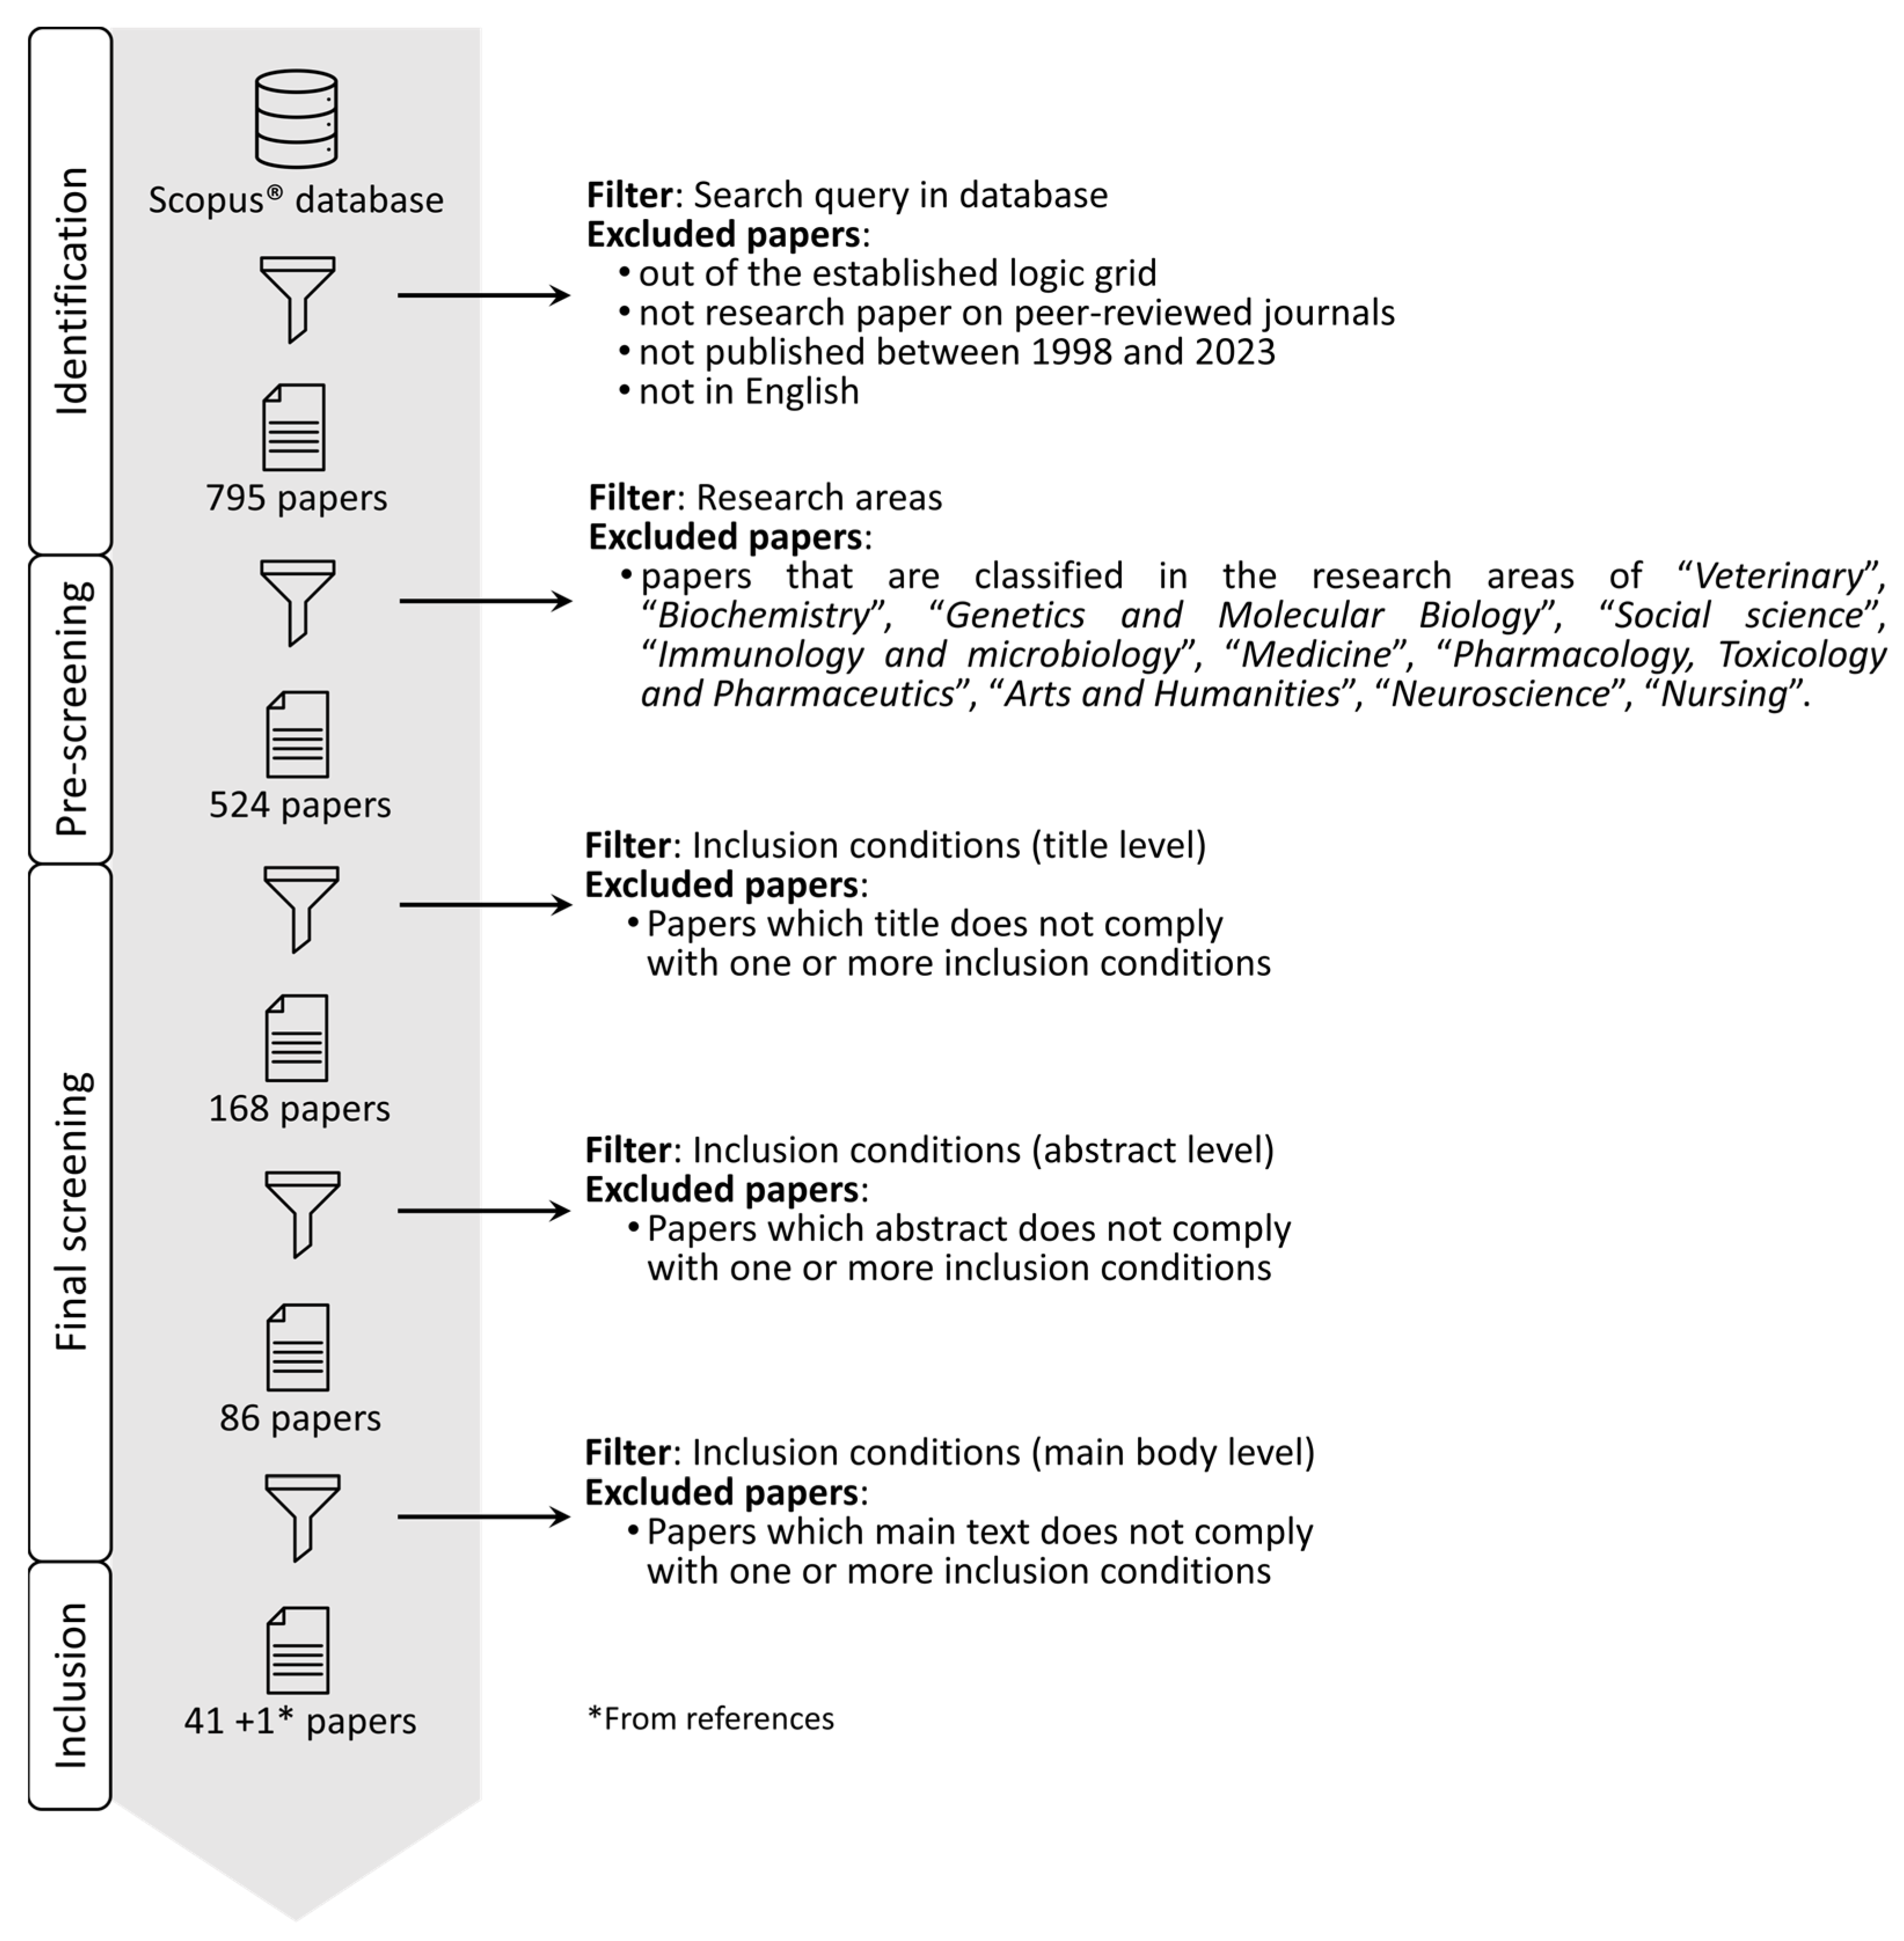
2.1.4. Database Search

The database search was performed in July 2023. The keywords and the alternative terms were concatenated as follows. Each keyword and its alternative terms (the ones in the same column as the keyword in Table 1) are concatenated using the Boolean operator OR. The keywords “livestock” and “hous*” are concatenated using the operator PRE/n, where n was set equal to one. This operator limits the search to those works in which the first term (livestock) in the query precedes the second one by, at maximum, one term. This choice was led by the need to focus the search specifically on livestock houses. Similarly, the keywords “energy*” and “model*” were concatenated using the operator PRE/n. Here, n was set equal to three. Also, in this case, the choice was led by the need to focus specifically on energy models but include among the results those word combinations in which “energy*” and “model*” appear separated by additional terms, such as in “energy simulation model”. Finally, the keywords “house*” and “energy” are concatenated by the Boolean operator AND. The search was extended to the title, abstract, and keywords of scientific papers. The entire query introduced in the Scopus® database is reported in Appendix A.

2.1.5. Identification, Pre-Screening, and Final Screening

The database search identified 795 scientific papers, which were pre-screened to further limit the search. To this aim, the manual filters of the database were used to exclude the papers from subject areas that were considered out of the scope of this review, namely “Veterinary”, “Biochemistry, Genetics and Molecular Biology”, “Social science, Immunology and microbiology”, “Medicine”, “Pharmacology, Toxicology and Pharmaceutics”, “Arts and Humanities”, “Neuroscience”, and “Nursing”. After the pre-screening, 524 papers were considered for the final screening, as schematized in Figure 1.
The final screening was performed considering the scope of the work delimitations presented in Section 2.1.1. Thus, a paper is included in this review only if fulfills the inclusion conditions A, B, and C. This fulfillment is evaluated at three different and consecutive levels: title, abstract, and paper main body. The number of papers excluded at each level is reported in Figure 1. During the final screening, it stood out that some papers adopted a specific BES model that was developed in a previous work. Since the publication year of that work fell within the 25-year time span considered in this review, that work was included. After the final screening, 42 papers were included in this review.

2.2. Analysis Methodology

The 42 papers are then critically analyzed, focusing on their application, development, and validation.
The first part of the analysis regards model application (Section 3.1). The retrieved research papers are analyzed to identify their main research focus, the investigated type of livestock house, and the type of ventilation, whether mechanical or natural. This analysis is performed to provide an overview of the possible applications of BES models. Additional bibliographical details about the paper (publication year and journal title) are provided to give a more detailed overview of the status of the literature regarding the considered modeling activity. The second part of the analysis (Section 3.2) is focused on model development and discerns the type of model, the type of analysis (dynamic or steady state), and the simulation time step. This comparative approach offers a detailed overview of the predominant approaches adopted in BES models for livestock houses. Additional analyses extend to the key energy parameters estimated by the models, along with an assessment of model validation status. This analysis is performed because can provide a valuable reference for researchers and practitioners interested in evaluating specific energy parameters within a framework of reliable prior works. The last part of the analysis (Section 3.3) examines the pivotal aspect of model validation. A thorough exploration of validated BES models compares the diverse validation procedures. The comparison criteria include validated parameters, duration of the validation period, granularity of the data, goodness-of-fit indexes, and adoption of validation thresholds. This examination is performed to provide insights into the robustness and reliability of the analyzed BES models and valuable information for performing the model validation in future research.

2.3. Bias Risk and Limitations

This work has specific bias risks and limitations that have to be considered when analyzing the outcomes. Some bias risks are identified in the database search that was limited to a single database (Scopus®) and focused only on papers published in English journals during the last 25 years. Proceedings papers, book chapters, and grey literature (e.g., reports and working papers) are excluded from this review. Hence, relevant studies may be missing from the present review. Nonetheless, this bias is considered to have a minor impact on the results of this review. The major contributions on the analyzed topic (BES models), in fact, are estimated to be published mostly in international journals, and the considered time span is deemed suitable to encompass the latest advances in this field. Future reviews could further investigate journals in other languages as well as other literature sources by leveraging different databases.
A possible limitation of this review is its focus limited to BES models only, with the exclusion of both CFD and DD models from its scope, as detailed in Section 2.1.1. On one hand, this limitation of the scope of the work enables deeper and specific analyses focused on BES models. On the other hand, the exclusion of CFD and DD models limits the overall comprehension of numerical modeling adopted to investigate livestock houses from the point of view of climate control and energy use. Future reviews may focus on the simulation models that were excluded in this review. Specifically, the use of CFD models for agricultural buildings—both greenhouses and livestock houses—was recently analyzed by Bournet and Rojano [34]. A similar review may be performed for DD models, especially considering the spreading use of artificial intelligence.
An additional limitation pertains to the scope of analyses conducted in this review. While this review focuses on some specific aspects of BES models, it is important to note that other relevant aspects may be neglected, presenting a potential limitation to the work. However, being the first systematic review specifically focused on this topic, it lays the foundation for further works that could systematically investigate other aspects, contributing to a more exhaustive examination of this research field.

3. Results

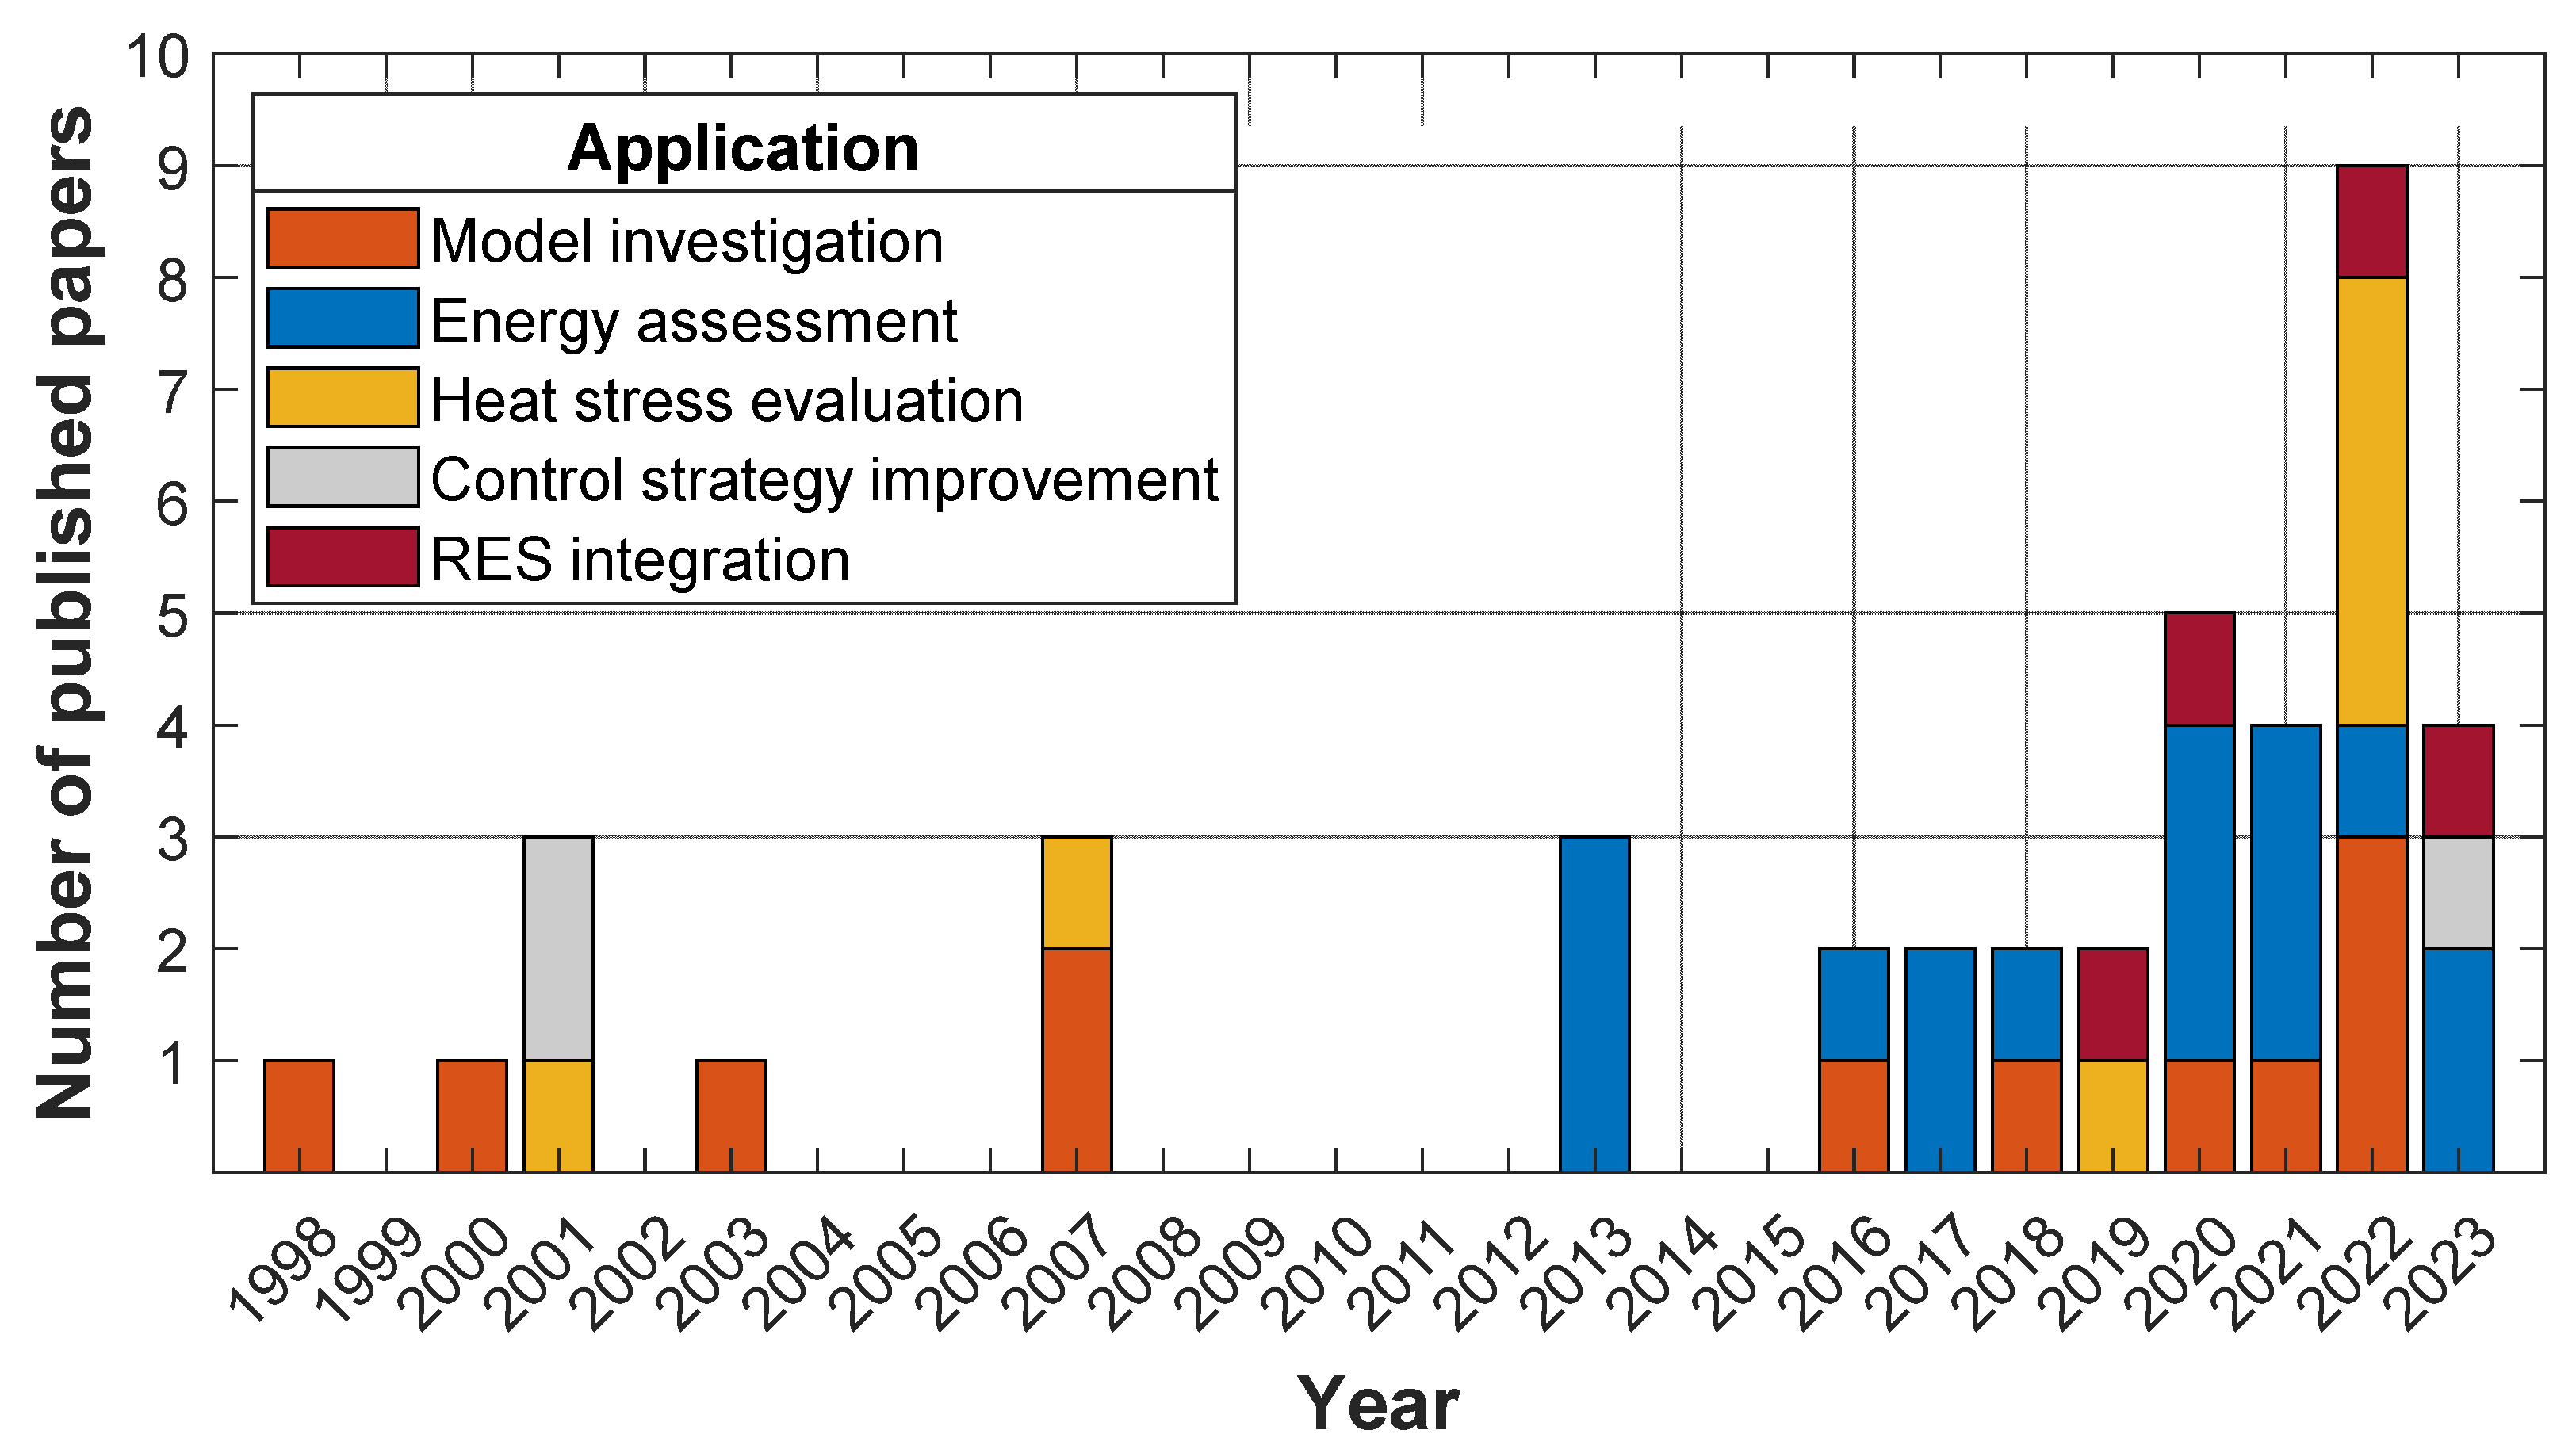
3.1. BES Models for Livestock Houses: Applications

The analysis of the included papers makes it possible to identify five main categories of applications of BES models for livestock houses, namely
  • Model investigation;
  • Energy assessment;
  • Heat stress evaluation;
  • Control strategy improvement;
  • Renewable Energy Source (RES) integration.
Please note that additional and more specific categories of applications of BES models could be identified. However, the applications have been deliberately confined to five categories to enhance comprehension and facilitate the comparison.
In Table 2, the 42 included papers are organized according to the previously identified categories of application. From the table, it stands out that model investigation is a common application of BES models. The aim of several works, in fact, is investigating how to develop a BES model for specific or generic livestock houses. This is more common in the oldest works included in this review that aimed at establishing the first methodologies for the energy simulation of livestock houses. Examples of this type of work are the ones of Cooper et al. [40] and Liberati and Zappavigna [41]. Both aimed at developing a general methodology for the energy simulation of generic livestock houses with mechanical or natural ventilation. Other works focus on specific modeling aspects rather than general modelling methodologies. For example, Lee et al. [42] focused on how to estimate the evaporation rate from duck-house litter, while Shin et al. [43] specifically focused on how to calibrate the modeled fan electrical energy consumption.
Another application of BES models is the energy assessment with different focuses. For example, BES models are used to estimate the thermal loads of the livestock house, as performed by Qi et al. [44], Nawalany and Sokołowski [45], and Izar-Tenorio et al. [46]. In other cases, energy assessments are performed for evaluating energy efficient solutions—as performed by Kwak et al. [20] and Jackson et al. [16]—with a specific focus on the envelope, as in Costantino et al. [17], Axaopoulos et al. [47], and Wang and Xue [48]. The energy assessment performed by Si et al. [49] aimed at estimating the overall carbon and water footprint of pig farms. In other cases, BES models are adopted for estimating the indoor climate conditions to assess the heat stress of livestock in different contexts. For example, Mikovits et al. [50] evaluated the pig heat stress in Central Europe between 1981 and 2017, while Schauberger et al. [51] extended this evaluation in a projection to 2030. Gonçalves et al. [52] evaluated the possible heat stress risk considering different types of roof tiles. Other works adopt BES models for improving different control strategies, as performed by Shin et al. [53] through weather forecasting data, or by Lambert et al. [54] with a focus on humidity control. Recently, energy simulation models have also been adopted for analyzing the integration of RES technologies in livestock houses, as carried out by Tyris et al. [19] and Manolakos et al. [55]—with heat pumps—and Tan et al. [21] and Omar et al. [56], with biogas systems. It is worth mentioning that Kwak et al. [20] included a photovoltaic system in their energy assessment.
Table 2 also reports the investigated type of livestock house and the adopted type of ventilation, whether mechanical or natural. As visible from the table, the developed models primarily simulate livestock houses for monogastric animals, mainly poultry and pigs. Among the poultry-related BES models, the majority center on broiler houses. Only two models (Wang et al. [57] and Zhao et al. [58]) focus on laying hen houses, and the other two of them (Lee et al. [42,59]) focus on duck houses. In the case of pig houses, most models simulate fattening pig houses, although there is also a notable presence of models focused on piglet houses. Nguyen-Ky and Pentillä [60] and Menconi et al. [61] stand out as the sole contributors focused on livestock houses for ruminants. The former focused on a dairy barn, while the latter on a sheepfold. Lastly, three studies take a broader approach by examining generic livestock houses. These include the works of Turnpenny et al. [62], Liberati and Zappavigna [41], and Cooper et al. [40]. Developed for generic livestock houses, the last two mentioned works are the only ones that encompass both mechanical and natural ventilation, while almost the totality of the others is focused on mechanically ventilated livestock houses. The sole exceptions are the works of Lee et al. [59], Gonçalves et al. [52], Nguyen-Ky and Pentillä [60], Omar et al. [56], and Wang and Xue [48], which are focused on naturally ventilated livestock houses. This preponderant focus on mechanically ventilated livestock houses could be due to two reasons. On one hand, mechanically ventilated livestock houses are characterized by higher energy consumption [9]. Thus, they are the focus of more investigations aimed at improving their energy performance. On the other hand, it is complex to perform detailed fluid analysis and estimate the natural ventilation flow rate using BES models. This aspect may limit their versatility and scalability, as discussed later in the text.
Table 2. Applications for the Building Energy Simulation models analyzed in the review. The type of simulated livestock house is reported with the type of ventilation in brackets (M: Mechanical, N: Natural). The journal and the publication year are reported per each analyzed work.
ApplicationReferenceLivestock House
(Type of Ventilation)
JournalPublication Year
Model
investigation
Lee et al. [59]Duck house (N)Biosystems Engineering2022
Shin et al. [43]Piglet house (M)Biosystems Engineering2022
Costantino et al. [31]Fattening pig house (M)Applied Energy2022
Nguyen-Ky and Pentillä [60]Dairy barn (N)Applied Engineering in Agriculture2021
Lee et al. [42]Duck house (M)Biosystems Engineering2020
Costantino et al. [63]Broiler house (M)Energy and Buildings2018
Hamilton et al. [64]Broiler house (M)Advances in Mechanical Engineering2016
Liberati and Zappavigna [41]Generic house (N/M)Transactions of the ASABE2007
Silva et al. [65]Broiler house (M)Revista Brasileira de Engenharia Agrícola e Ambiental2007
Wagenberg et al. [66]Fattening pig house (M)Biosystems Engineering2003
Schauberger et al. [67]Fattening pig house (M)International Journal of Biometeorology2000
Cooper et al. [40]Generic house (N/M)Journal of Agricultural Engineering Research1998
Energy
assessment
Si et al. [49]Fattening pig house (M)Science of the Total Environment2023
Qi et al. [44]Nursery + fattening pig house (M)Agriculture2023
Nawalany and Sokołowski [45]Broiler house (M)Energies2022
Costantino et al. [17] 1Broiler house (M)Journal of Cleaner Production2021
Kwak et al. [20] 2Piglet house (M)Energy Strategy Reviews2021
Panagakis et al. [68] 1Broiler house (M)CIGR Journal2021
Costantino et al. [69]Broiler house (M)Biosystems Engineering2020
Izar-Tenorio et al. [46]Broiler house (M)Journal of Cleaner Production2020
Wang et al. [57]Laying hen house (M)Computers and Electronics in Agriculture2020
Jackson et al. [16]Fattening pig house (M)Biosystems Engineering2018
Jackson et al. [70]Fattening pig house (M)Energy and Buildings2017
Axaopoulos et al. [47] 1Fattening pig house (M)Transactions of the ASABE2017
Wang and Xue [48] 1Piglet house (N)Transactions of the ASABE2016
Zhao et al. [58]Laying hen house (M)Biosystems Engineering2013
Menconi et al. [61] 1Sheepfold (M)Journal of Agricultural Engineering2013
Park et al. [71]Fattening pig house (M)Computers and Electronics in Agriculture2013
Heat stress
evaluation
Scherllin-Pirscher et al. [72]Fattening pig house (M)Atmosphere2022
Cho et al. [73]Broiler house (M)Agriculture2022
Schauberger et al. [51]Fattening pig house (M)Agronomy2022
Gonçalves et al. [52]Broiler house (N)Revista Brasileira de Engenharia Agrícola e Ambiental2022
Mikovits et al. [50]Fattening pig house (M)International Journal of Biometeorology2019
Haeussermann et al. [74]Fattening pig house (M)Transactions of the ASABE2007
Turnpenny et al. [62]Generic house (M)Global Change Biology2001
Control strategy improvementShin et al. [53]Piglet house (M)Energy2023
Lambert et al. [54]Fattening pig house (M)Canadian Biosystems Engineering2001
Gates et al. [75]Broiler house (M)Computers and Electronics in Agriculture2001
RES 3
integration
Tyris et al. [19] 4Broiler house (M)Energies2023
Tan et al. [21] 5Broiler house (M)Energy2022
Omar et al. [56] 5Broiler house (N)Renewable Energy2020
Manolakos et al. [55] 4Broiler house (M)Computers and Electronics in Agriculture2019
1 Focus on envelope solutions. 2 A photovoltaic system is considered. 3 RES: Renewable Energy Source. 4 Focus on a heat pump. 5 Focus on a biogas system.
In Table 2, the journals where the analyzed works were published are reported. As visible from the table, most of the analyzed works were published in journals focused on agricultural engineering, mainly “Biosystems Engineering”, “Computers and Electronics in Agriculture”, and “Transaction of the ASABE”, which are the journals with the highest numbers of publications. However, the publications in journals dealing with energy topics, such as “Energy” and “Energy and Buildings”, confirm the multidisciplinary nature of this modeling activity. In Table 2, the inclusion of publication years for each work serves to offer insights into the evolution of the analyzed research area over the duration covered by this review (1998–2023). To make this evolution clearer, the annual publication count throughout the timeframe covered in this review is presented in the stacked bar chart of Figure 2. The chart shows a notable surge in research involving BES models for livestock houses since 2016. In the period from 1998 to 2015, only 12 works were published, while the subsequent period, from 2016 onward, witnessed a remarkable increase, with an additional 30 publications. Furthermore, in the most recent years, a pronounced upward trajectory has become evident, with over half of the total works considered (22/42) having been published since 2020. This upswing in research output could have been driven by the increasing concern over the environmental impact of livestock systems. It is no mere coincidence that this surge in the volume of published research occurred during the same period when significant policy initiatives, such as the European Green Deal with its Farm to Fork Strategy [76], were approved. This upward trend underscores the emerging and increasingly prominent nature of this research area. The sub-bars of Figure 2 indicate the publication count specifically referred to the five categories of applications of the BES models identified within this review. The sub-bars highlight how, in the first part of the considered timespan (1998–2007), the main applications were model investigation, control strategy improvement, and heat stress evaluation. Pretty recently (from 2013), BES models have started to be used for energy assessments and RES integration (from 2019).

3.2. BES Models for Livestock Houses: Development

The BES models included in this review are critically analyzed and compared to highlight their main differences. This critical comparison is summarized in Table 3, where the main features of the analyzed BES models are presented and compared. Specifically, the table shows the differences in terms of the type of model, the type of analysis (steady-state or dynamic), simulation time step, and investigated energy parameters. Moreover, the table indicates if the considered BES models estimate the indoor air relative humidity ( φ a i r _ i ) and whether the model validation was performed.
Table 3 points out significant differences between the analyzed BES models. Considering the total 42 analyzed works, a customized energy simulation model was developed in 27 of them. In the remaining 15 works, the BES model was implemented using a ready-to-use simulation tool. Customized energy models rely on a set of customized equations specified by the modeler to define the boundary conditions, solve thermal balance, and simulate the system performance [31]. The development of a customized energy model is an approach that is adopted for both steady-state and dynamic models, and it represents the first solution, in chronological terms, adopted for the energy simulation of livestock houses, as noticeable by comparing Table 2 and Table 3. In contrast, the adoption of ready-to-use simulation tools for the energy simulation of livestock houses is more recent, and it is preferred to perform dynamic simulations. In this second approach, the simulation model is implemented via physics-based software able to simulate the building and the HVAC system, once the required inputs are introduced via the tool interface. In most cases, these tools are adopted for analysis on an hourly or shorter time basis, as shown in the fourth column of Table 3.
Amongst the customized dynamic models, different approaches are adopted. To simulate dynamically the thermal behavior of the analyzed livestock houses, some of the analyzed works [21,31,63] adopt the simple hourly method presented in the ISO 13790 standard [77]. This method is based on the thermal–electrical analogy between the simulated building and an equivalent electrical network with 5 resistance and 1 capacitance (5R1C), which represent the heat transfer resistances and the lumped fabric heat capacity, respectively. By solving the thermal balance, the hourly heating/cooling loads and the lumped indoor air temperature are estimated. Two approaches can be found in the literature to solve the balance. The first one is based on a Crank–Nicholson scheme with hourly time steps, as proposed by the ISO 13790 standard itself. The second approach is based on a network analysis solved via a numerical method (Runge–Kutta algorithm) in the time steps in which the indoor air temperature is in free-floating conditions [31]. The other customized and dynamic BES models indicated in Table 3 are developed with different approaches. The simulation models of Tyris et al. [19], Park et al. [71], and Gates et al. [75] were implemented in the Simulink® environment. The energy balances of Park et al. [71] were based on two differential equations to calculate the air temperature of the room and pit, respectively. A similar approach was adopted for the dynamic mass balance equations for the estimation of the concentration of dust, water vapor, ammonia, and carbon dioxide in both the room and the pit. Gates et al. [75] also used a differential equation to describe the sensible energy balance of the enclosure. Its solution is obtained using a numerical method (Runge–Kutta algorithm) to provide the indoor air temperature. Liberati and Zappavigna [41] used two differential equations to define the dynamic sensible and latent heat balances. The thermal behavior of each building element is modeled using a one-dimensional Fourier equation solved via the finite difference method. It is worth pointing out that the model considers the possibility that the floor surface can be either dry or wet due to the presence of manure, urine, and water. Differential equations are used for the dynamic energy and mass balances also in the works of Haeussermann et al. [74] and Wagenberg et al. [66].
As mentioned before, ready-to-use simulation tools represent the alternative mainly to customized models for performing dynamic analysis. Cross-referencing the publication year in Table 2 and the model type in Table 3, it stands out that the use of ready-to-use simulation tools for the development of BES models for livestock houses is quite a new approach in the literature. The first application of these tools—in the framework of this review—was found in 2013, with the work of Menconi et al. [61]. In the following years, a growing number of BES models were developed via ready-to-use simulation tools, becoming a consolidated approach for the energy simulation of livestock houses. This growth could be attributable to various factors, mainly the increasing accessibility to computing capacity, the emergence, the enhancements of the existing ones. Additionally, it has to be highlighted the maturation of a well-established body of knowledge in the application of ready-to-use simulation tools to human-occupied buildings, which facilitated their adaptation to livestock houses. Table 3 shows that the most frequently adopted ready-to-use simulation tools are EnergyPlus (E+) [78] and Transient System Simulation Tool (TRNSYS) [79], which were employed in 12 out of the 15 works that adopt ready-to-use simulation tools. Thus, E+ and TRNSYS can be considered the current standard in ready-to-use tools for the energy simulation of livestock houses. This preference for these two tools is also confirmed by a comparative evaluation performed by Kwak et al. [20]. Starting from the results of a previous wider analysis on the capabilities of several ready-to-use building simulation tools [80], Kwak et al. [20] ranked E+ as the best option (39 out 40 points), followed by TRNSYS and Environmental Systems Performance—Research (ESP-r) [81] (both with 35 out 40 points). Besides E+ and TRNSYS, three other ready-to-use simulation tools were used in the framework of the analyzed works, as visible in Table 3. Nawalany and Sokołowski [45] adopted WUFI plus [82], Nguyen-Ky and Pentillä [60] adopted IDA Indoor Climate and Energy (IDA ICE) [83], while Wang et al. [57] preferred to use Designer’s Simulation Toolkit (DeSt) [84]. The simulation time steps adopted in ready-to-use simulation tools are generally shorter than in customized models, ranging between five minutes and one hour, as visible from the works of Cho et al. [73] and Shin et al. [53], respectively.
Steady-state models are less complex than dynamic ones and usually adopt longer simulation time steps. The steady-state models considered in the framework of this review, in fact, adopt simulation time steps that go from 30 min [67] to two hours [65]. Usually, steady-state models are based on static equations that describe the steady-state thermal balance of the livestock house. The reduced complexity of steady-state models and their longer simulation time steps require less computing capacity for running the simulations compared to the dynamic models, which often rely on numerical methods to solve differential equations. Even though today, the availability of computing capacity has increased remarkably compared to the past, some recent works are still based on steady-stated simulation models. This happens mainly when the system dynamic is not a central point of the analysis and/or there is a need to simplify the overall model. In some cases, in fact, the BES models are only a part of broader models that encompass several system models. The first case can be found, for example, in Si et al. [49] who estimate the energy consumption of a pig farm using a steady-state energy balance for assessing the overall carbon and water footprint of the farm. In this case, the dynamic effects of the system were not considered due to the scope of the analysis. The second case can be found, for example, in Omar et al. [56], who coupled a steady-state dynamic model of a broiler house to a model of a biogas system, which was the main focus of the work. This analysis highlights that a common and shared approach for the development of BES models of livestock houses is still not present in scientific literature. This lack of standardization poses a significant obstacle to their widespread adoption, particularly in industry.
All the analyzed models can estimate the indoor air temperature ( θ a i r _ i ), and many of them embed a dynamic or steady-state moisture balance for the estimation of the indoor air relative humidity ( φ a i r _ i ), as visible from Table 3. This feature is of the uttermost importance in those works that specifically aim at evaluating the livestock thermal stress via indexes that also include the effect of φ a i r _ i , as carried out by Cho et al. [73] or Schauberger et al. [51]. Some of the analyzed works enable the calculation of the thermal loads ( ϕ ) that can be defined as the instantaneous amount of heat that has to be provided or removed to/from the enclosure to maintain the air set point temperature. Heating ( ϕ H ) and cooling ( ϕ C ) loads are crucial parameters required for sizing the HVAC system of the livestock house. When ϕ H and ϕ C are integrated over time, they are theoretical energy needs ( Q ) for heating ( Q H ) or cooling ( Q C ). Other outputs of some of the analyzed BES models are the energy consumption ( E ) for heating ( E H ) or for fan operation ( E f a n ) for indoor air quality control and cooling. The main difference with the energy needs ( Q ) is that the performance of the HVAC system has to be simulated for the estimation of E . For this purpose, the works in which E f a n is estimated adopt different solutions for simulating the fan performance. For example, Shin et al. [43] adopted the part-load-factor model starting from the results of the fan motor test, while Costantino et al. [31] modeled the fans using their specific fan performance based on manufacturer data. Some recent works simulated livestock houses equipped with heat pumps. Manolakos et al. [55] simulated the heat pump to estimate its electrical energy consumption for heating ( E H ) and mechanical cooling ( E C ). Tyris et al. [19] adopted the same approach, and they included the energy consumption due to dehumidification in their estimations.
Another element of interest that is highlighted in Table 3 is the validation status of the models, meaning whether the models were validated or not. As visible from the last column of the table, not all the BES models were validated. Specifically, the model validation was performed in 21 works, and 3 works adopted a model that was validated in a previous work. In the remaining 18 works, model validation was not performed. Even though the presence of model validation may depend on the aim and scope of the work, the lack of validation seems to be more common in the oldest works analyzed in this review. Probably, the spread of low-cost, reliable sensors in recent years has facilitated the acquisition of real datasets needed for experimental validation. The main aspects regarding model validation are discussed in more detail in the following section.

3.3. BES Models for Livestock Houses: Validation

The adopted validation procedures are critically compared in Table 4, with a focus on the duration of the validation periods, the validated parameters ( θ a i r _ i , φ a i r _ i , E H , and E f a n ), the adopted Goodness-of-Fit (GoF) indexes, and the considered validation thresholds. All the validations performed in the works reported in Table 4 are performed against real monitored data. The only exception is the work of Manolakos et al. [55] that proposes a different approach by comparing the E H estimated by the model to the E H numerically estimated by a previous energy audit [85].
The first four columns of Table 4 show which parameters were validated in each model. Please note that the adopted symbols convey specific meanings:
  • “✓” signifies the validation was performed for that parameter;
  • “☓” denotes the validation was omitted for that parameter;
  • “-” indicates the validation was not possible for that parameter because it cannot be estimated by the simulation model.
As visible from the table, almost all the considered models validate the estimation of θ a i r _ i , with the only exceptions of Manolakos et al. [55] and Zhao et al. [58]. In Manolakos et al. [55], the validation of θ a i r _ i was omitted because energy audit results were used instead of monitored data. Thus, no monitored θ a i r _ i values were available for the validation. In Zhao et al. [58], the omission of θ a i r _ i could be attributable to the aim of the work, which is mainly focused on the energy requirements and related costs of various laying systems. In both cases [55,58], the validation of the estimated E H was performed. The models’ estimation of φ a i r _ i was validated in many works, while very few of them validated the energy parameters. Most of the models previously presented in Table 3, in fact, estimate thermal loads ( ϕ ) and theoretical energy needs ( Q ) that cannot be measured, being purely theoretical parameters.
Table 4 also highlights the number of data (sample size) that were adopted for the validation and for calculating the GoF indexes together with the duration of the validation period. As visible from the table, the duration of the validation period is remarkably different amongst the analyzed works and ranges between 48 h [41] and one year [45,55]. The sample size used for the validation of the indoor climate conditions ( θ a i r _ i and φ a i r _ i ) is usually higher than the ones used for the validation of energy parameters ( E H and E f a n ). This is because θ a i r _ i and φ a i r _ i are often validated by adopting the same time step of the BES model. In contrast, E H and E f a n are usually validated considering the whole energy consumption over the entire validation period. For this reason, for example, Shin et al. [43] validated θ a i r _ i using 504 samples (hourly values), while E f a n was validated using 21 samples that represent the daily energy consumption over the same number of days. The same approach was adopted by Costantino et al. [63], who validated θ a i r _ i and φ a i r _ i on an hourly basis (1200 samples), while E H and E f a n were validated over the entire period (1 sample each). In contrast, Shin et al. [53] and Costantino et al. [31] adopted a different approach since they used the same number of samples for both indoor climate conditions and E f a n . This approach could be considered more accurate since it considers the dynamics of the system.
The last two columns of Table 4 show the calculated GoF indexes and the thresholds that were adopted to consider the model as validated. As visible, several different GoF indexes are adopted for the validation of the simulation models. The definitions and the formulations of the reported GoF indexes are presented in Appendix B. Three main approaches regarding GoF indexes and their thresholds can be identified amongst the analyzed works. In the first approach, GoF indexes are calculated and then compared to established thresholds. Usually, in this approach, the Root Mean Square Error ( R M S E ), the Coefficient of Variations of the R M S E ( C V R M S E ), and the Normalized Mean Bias Error ( N M B E ) are adopted and then compared with the thresholds defined by specific guidelines and protocols on building energy simulation. The main reference documents in this sense are provided by ASHRAE (Guideline 14 [86] and Fundamentals Handbook [87]), the International Performance Measurements and Verification Protocol (IPMVP) [89,91,92], and the Federal Energy Management Program (FEMP) [88,90]. This approach was used, for instance, by Cho et al. [73], Costantino et al. [31], and Nguyen-Ky and Pentillä [60]. In other cases, the thresholds are defined in the work itself, without referring to the previously mentioned documents. This second approach is adopted, for example, by Nawalany and Sokołowski [45] and Silva et al. [65]. Nawalany and Sokołowski [45] set the thresholds for the coefficient of determination ( R 2 ) and the Goodness of Fit ( G O F ) at values higher than 75 % and 80%, respectively. Silva et al. [65] considered the model validated since the standard error between measured and simulated values is lower than the one calculated between the two sensors inside the livestock house. A similar approach was adopted by Haeussermann et al. [74], who considered the BES model reliable because the standard deviations ( σ ) of the differences between simulated and measured values were within the accuracy of the adopted sensors. The last approach relies on calculating GoF indexes to provide an extent of the error, but without considering any established threshold. This last approach was adopted, for example, by Qi et al. [44] and Lee et al. [59]. The only exception to those three approaches is in the work of Jackson et al. [70], who do not provide any numerical assessment of the error between the simulated and monitored θ a i r _ i data. A graphical comparison (a line plot) is given to provide an extent of the reliability of the simulation model.
A final note is dedicated to the topic of model calibration, which is closely linked to model validation. Model calibration means fine-tuning model parameters so that the predicted values closely match with the measured ones. The topic of model calibration was not faced in the framework of this review because the scientific literature on the topic is very scarce. Very few works amongst the ones analyzed in this review face this topic. It is worth mentioning that the work of Shin et al. [53] is entirely focused on calibration aspects, with a special focus on the calibration of the modeled fans. Moreover, they performed an optimization-based calibration on θ a i r _ i by considering calibration parameters as the infiltration rate and the equipment load. The work of Nguyen-Ky and Pentillä [60] also thoroughly discussed the performed optimization-based calibration, providing several details about the optimization parameters, their initial values, and the adjusting range. The seven considered optimization parameters regard the cow emissions (heat, CO2, and vapor emissions), the thermophysical properties of the curtain wall window (its thermal, solar, and visible transmittance), and its opening curve, defined as the ratio of opening area and total window area as a function of the outdoor air temperature. An optimization-based calibration was adopted by Costantino et al. [63] who considered as a calibration parameter the direct saturation effectiveness of the evaporative pads. Silva et al. [65] performed the model calibration via a consecutive approximation approach for estimating a correction factor for the heat sources of the livestock house.

4. Discussion

4.1. Toward BES Models as a Standard Practice in the Livestock Sector

As pointed out, there has been a remarkable recent increase in the use of BES models in literature. However, it has to be remarked that the current predominant use of BES models is limited mainly to research applications, with minimal integration into actual industry practices. To facilitate the broader adoption of BES models as a standard practice in research and, more crucially, in industry, concerted efforts should focus on overcoming some specific limitations that are hindering the scalability and versatility of BES models for livestock houses.
The complex modeling methods at the basis of BES models, especially dynamic ones, are one of the main limitations that could prevent their scalability. Developing a reliable dynamic BES model is a time-consuming process, which requires a deep multidisciplinary knowledge of the involved physical phenomena, the building, and the systems. Ready-to-use simulation tools may, in part, overcome this limitation because the main equations are pre-defined, as well as some equipment. However, some customizations can also be required in ready-to-use simulation models to adjust them to the simulation of livestock houses because ready-to-use simulation models were primarily developed for human-occupied buildings. To definitively overcome this limitation, the research efforts made in recent years could be channeled toward the development of a ready-to-use BES model specifically developed for the application to livestock houses. In this way, energy simulation of livestock house could have a shared approach and practitioners could have a well-established ready-to-use tool.
Another disadvantage of BES models is the limitation in performing detailed fluid analyses due to the reasons previously mentioned in Section 2.1.1. This limitation mainly affects their versatility because it narrows down the scope of application to totally enclosed livestock houses with mechanical ventilation. Thus, ruminant housing systems—mainly dairy barns—are usually not analyzed using BES models, as is also pointed out in Table 2. CFD [93] or DD [94] models are usually preferred for naturally ventilated buildings or when hybrid ventilation systems, a combination of mechanical and natural ventilation, are adopted. Extending the applicability of BES models to partially enclosed houses or totally enclosed livestock houses with natural ventilation is challenging because the accurate estimation of the natural ventilation flow rate gains complexity because of wind effects, thermal buoyancy forces, and their combination [93]. Some recent works tried to overcome this limitation with different approaches. Nguyen-Ky and Pentillä [60], for example, adopted the mass–pressure balance method directly embedded in IDA ICE to estimate the natural ventilation flow rate. Another possible approach to solve this problem is the co-simulation between BES and CFD models, as performed by Lee et al. [59] for evaluating the wind pressure coefficients necessary to estimate the natural ventilation rate. This approach seems promising because can provide more accurate estimations about energy use and indoor environmental conditions by using the complementary information provided by BES and CFD models [95]. However, these more accurate estimations have to be counterweighted by an increased computational time. A study performed in the context of the building sector showed that a co-simulation required approximately four hours to run, while the simulation performed only via the BES model required only a few seconds [96]. Such high computational time may hinder the adoption of co-simulation by practitioners. Thus, future works may investigate the specific application of BES-CFD co-simulation to livestock houses, focusing on the variables that should be transferred between the models to find a tradeoff between computational time and more accurate estimations.
Finally, another limitation that could be attributed to BES models—and simulation models in general—is their reliability. Model validation is crucial in this perspective. However, this review underscored that the approaches regarding model validation vary significantly amongst the analyzed works. As previously shown in Table 4, some of the analyzed works validated the models by estimating the extent of the model error via specific GoF indexes that are then compared with thresholds established by protocols. Other works only calculate the GoF indexes to provide an extent of the model error without comparing them to any thresholds. Finally, some other works do not validate the model and do not provide any indication of the model reliability. Starting from this premise, it appears necessary to harmonize the validation procedure amongst BES models for livestock houses. This task poses a complex challenge because, while there exists an extensive body of knowledge on validating energy models for human-occupied buildings [97,98], the scientific literature regarding the validation of BES models for livestock houses is notably scarce. Certainly, many approaches could be borrowed from the validation procedures of BES models for human-occupied buildings. However, the development of specific procedures is encouraged for BES models for livestock houses due to their significative differences with other building types. A similar approach was adopted to ensure the prediction quality of CFD models for livestock houses [35]. This development represents a complex task that deserves to be analyzed in future specific works. However, some valuable recommendations for model validation can be drawn from the results of this work.

4.2. Recommendations for BES Model Validation

4.2.1. Perform Model Validation

The first recommendation regards the necessity of validating all the models, whether they are customized models or are implemented in ready-to-use tools. This recommendation is provided because it has to be considered that a difference exists between customized models and the ones implemented using ready-to-use simulation tools. The former, in fact, are usually developed from scratch, while the latter are based on software that was previously verified by the developers. Model verification and validation are both necessary to quantify and build credibility in numerical models [99], but they are two different processes. Model verification can be defined as “the process of determining that a model implementation accurately represents the developer’s conceptual description of the model and its solution” [99]. In contrast, model validation can be defined as “the process of determining the degree to which a model is an accurate representation of the real world from the perspective of the intended uses of the model” [87]. Thus, differences in predictions that may be caused by algorithmic differences or coding errors were previously identified by the developers [87] in ready-to-use tools. In contrast, those differences should be carefully identified by the modeler in customized BES models through a debugging operation. Hence, model verification represents a step toward the accurate representation of the real world by the model, but it does not exempt the models from the validation, which makes them suitable for their intended use. This holds particularly true, especially considering that ready-to-use tools were primarily developed for environments for human (rather than for livestock) occupancy and comfort and then adapted to livestock houses. This adaptation makes the validation even more recommended.

4.2.2. Prefer Empirical Validation

The second recommendation regards the methodological basis of the validation. This review underscores that empirical validation is the most adopted methodology for the validation of BES models for livestock houses. According to the ASHRAE Fundamental Handbook [87], empirical validation relies on the comparison of the simulation results to monitored data. Indoor climate conditions— φ a i r _ i and, especially, θ a i r _ i —are the variables that are usually monitored for this purpose. The use of θ a i r _ i as a validation parameter enables the validation even for those models that, excluding the HVAC system, focus solely on simulating indoor climate conditions and thermal loads, without considering energy consumption. In these cases, the validation of θ a i r _ i is the main way to evaluate the accuracy of the model in estimating the livestock house thermal behavior. When the HVAC system is incorporated into the model, it is advisable to monitor the energy consumption for a comprehensive comparison with simulated data. In this case, the evaluation extends beyond assessing the estimation of the thermal behavior of the building to also encompass the reliability in the estimation of the HVAC system performance. This paper does not delve into specific details on how to conduct a monitoring campaign, as this topic is considered beyond the scope of our current work. However, comprehensive information can be explored in the existing literature and the references provided in Table 4. The only crucial aspect emphasized in this context is the duration of the validation period, which should be sufficiently extended to accurately capture the dynamic effects of the building and the changes in the boundary conditions, such as the variation in air set point temperature or the ventilation air flow rate. This is considered a crucial element because those changes are considered one of the main specificities of livestock houses when compared to buildings for human occupancy [31]. Moreover, it seems recommendable to consider a validation period that encompasses the operation of various climate control systems—e.g., heating system, ventilation, and evaporative cooling—and their control logic.
Currently, performing empirical validations has been eased, compared to the past, thanks to the widespread availability of accurate sensors and advancements in Internet of Things (IoT) technologies that are playing a key role in smart farming. Moreover, most of the recently built livestock houses are equipped with digital systems for the monitoring and acquisition of several parameters, providing valuable datasets for empirical validation. However, if real data are not available, two alternative methodologies in compliance with the ASHRAE Fundamentals Handbook [87] and ASHRAE Standard 140 [100] could be adopted, namely the analytical verification and the intermodal comparison. The former relies on the comparison of model results to results from a known analytical solution or a generally accepted numerical method, while the latter relies on the comparison of the model to another [87]. In this last case, the results from a customized model could be compared with the results from a ready-to-use tool, as carried out in previous studies [101].

4.2.3. Choose GoF Indexes with Defined Thresholds

The last recommendation provided in this work regards one of the most critical aspects of model validation. It is the identification of the GoF indexes and the thresholds that should be respected for deeming the model validated when empirical validation is performed. Various GoF indexes (e.g., M A E , M a x A E , and M B E ) can be adopted to evaluate the model error, as reported in Table 4. Additional indexes with related insights about their use can be found in [102]. A first recommendation that could be provided is to always specify the formulation of the adopted GoF indexes, to consistently clarify how they were calculated, as there may be slightly different formulations in the literature. It is noteworthy that only a subset of the considered GoF indexes has established thresholds that make it easier to define whether the model can be considered validated. In Table 5, some GoF indexes with their thresholds that can be used for the BES model validation in future works are reported. Please note that the table is not intended to provide an exhaustive list, but it only reports some of the GoF indexes and the respective thresholds that were identified in this review. Their formulation is provided in Appendix B.
The first identified GoF index is the N M B E , whose threshold is fixed in the interval 10 % , + 10 %   for hourly data. In the case of monthly data, that interval reduces being 5 % , + 5 %   . These thresholds are provided by ASHRAE Guideline 14 [86] and the FEMP [90], even though slight differences exist between the adopted nomenclatures and formulations. According to FEMP [88], the N M B E is a metric for the accuracy of the model estimations compared to measured data. However, it has to be considered that N M B E in a GoF index is subject to cancellation errors, meaning that the combination of positive and negative differences between measured and simulated data reduces the N M B E . For this reason, it is recommended to evaluate it together with the C V R M S E to avoid such cancellation errors. C V R M S E indicates the overall uncertainty of the prediction [90], and the lower its value, the better the estimation. According to ASHRAE Guideline 14 [86] and the FEMP [90], the C V R M S E should be positive and lower than 30 % when hourly data are used or lower than 15 % when monthly data are used. IPMVP [91] suggests thresholds for the same indexes, and, as visible in Table 5, they are more restrictive than the ones of both ASHRAE Guideline 14 [86] and the FEMP [90]. It has to be pointed out that all the previously presented thresholds were originally developed for being used with measured and simulated data on energy consumption. Nevertheless, this review highlighted that their use is generally accepted in literature to evaluate the robustness of the model estimation regarding other variables, such as θ a i r _ i and φ a i r _ i .
Another GoF index that is recommended to be used for the model validation is R 2 , which indicates how close the simulated variables are to the regression line of the measured ones [73]. ASHRAE Fundamentals [87] primarily suggests the use of R 2 to gauge the goodness-of-fit of univariate regression models for estimating the energy consumption of a building. However, the analyzed literature shows that, in many works, this GoF index was used for validating different types of models -not only univariate regression models- with respect to the predictions of θ a i r _ i and φ a i r _ i , as carried out by Cho et al. [73], Lee et al. [59], and Shin et al. [43]. The threshold of R 2 is fixed in the interval + 75 % , + 100 %   , as reported in ASHRAE Fundamentals [87] and FEMP [90]. Another index that can be used to validate the model with respect to the predictions of θ a i r _ i and φ a i r _ i is the G o F by Nawalany and Sokołowski [45], which considers a threshold within the interval + 80 % , + 100 % .
The last GoF index recommended in Table 5 is the M A P E that was used by Nguyen-Ky and Pentillä [60]. This index is not subject to cancellation errors, as it occurs for the M P E . Thus, the former could be preferred to the latter. M A P E can be used for the model validation with an hourly time step or for the energy consumption over the entire validation period, as carried out by Nguyen-Ky and Pentillä [60].

4.3. BES Models for a More Environmentally Sustainable and Resilient Livestock Sector

Having robust and reliable BES models is crucial for tackling some of the challenges that the livestock sector currently confronts. Specifically, BES models can contribute to moving toward a more environmentally sustainable and resilient livestock sector.
In the context of environmental sustainability, BES models can actively contribute to enhancing the integration of RESs in intensive livestock systems. For this integration, both experimental and numerical approaches are needed. Experimental setups could provide detailed information about the technical feasibility of such integration, as well as highlight practical problems. Numerical simulations performed via reliable BES models integrate well with experimental setups since they provide a multitude of advantages. First, BES models may be helpful in the preliminary stage of an experimental setup to have exploratory results that could help in better defining the integration between the building and the systems also using optimization methods. Second, BES models facilitate standardized assessments, enabling apples-to-apples comparisons of different solutions and scenarios that could not be possible with experimental setups. Third, BES models are ideal for long-term analyses that are functional for financial evaluations (e.g., cost-optimal, and global cost analyses) of the RES integration. Finally, BES models can play a key role in the evaluation of the impact of RES integration on the overall greenhouse gas emissions from livestock houses. At present, there is a notable gap in the literature regarding the quantification of the share of greenhouse gas emissions attributable to energy use within the overall emissions from livestock systems. Consequently, it remains unclear whether the adoption of RESs could play a pivotal role in mitigating the carbon footprint associated with the livestock sector or if it would have a minor impact.
In the context of resilience to climate change, BES models can have a crucial role in assessing the impacts of climate change, as well as evaluating the effectiveness of some mitigation and adaptation strategies and solutions. BES models, in fact, can be used to perform simulations in future climate scenarios considering the Shared Socioeconomic Pathways [103] and provide a numerical evaluation of their impacts. In this way, it will be possible to evaluate, for example, the impacts of heat waves in terms of heat stress, increased energy consumption, and decrease in productivity. An example of this analysis was performed in [104] for the specific context of the USA. However, more information is needed. It is of the uttermost importance, in fact, to understand where the actual design and management of livestock houses have room for improvement. For example, it is worth understanding if evaporative cooling systems will still be effective in the context of future heat waves and water scarcity or if alternative solutions, such as mechanical cooling, should be preferred. Also, different management strategies should be evaluated, as carried out by Zhao et al. [58], who compared the impact of different farming systems for laying hens (i.e., conventional, aviary, and enriched colony houses) and management parameters (e.g., stocking density, θ a i r _ i , and φ a i r _ i ) on both the house energy consumption and the running cost related to energy. BES models are crucial for this type of assessment because they can be used for optimizing livestock housing. This is possible by defining multi-objective optimization problems whose solution could bring, for example, to the optimum tradeoff between energy consumption, productivity, and costs. This type of energy analysis is highly current, considering that various countries are implementing modifications in livestock systems to guarantee better animal welfare. For example, New Zealand [105] and Canada [106] are shifting from egg production in conventional cage systems to enriched or cage-free systems. BES models can evaluate how this shift could affect energy consumption and contribute to evaluating the impact on the final product price.

5. Conclusions

In this work, a comprehensive analysis of the Building Energy Simulation (BES) models for livestock houses present in the literature is performed to contribute to paving the way for making their use a standard practice in research and industry. For this purpose, a systematic review of 42 scientific papers—selected out of 795 resulting from the initial database query—was performed for a 25-year time span (1998–2023). The results indicated a recent increasing trend in the use of BES models for various applications to livestock houses, such as energy assessments and heat stress evaluations. However, the results pointed out that a common and shared approach for this specific modeling activity is still not present in scientific literature. The analyzed BES models, in fact, present several differences in terms of development and validation, such as the adoption of different simulation methods and validation procedures.
The results of this review represent a solid background for future research, which considers the use or development of BES models for livestock houses. Researchers can have a complete framework of the different existing BES models that can be useful for the development and application of new ones. Moreover, the validation procedure of the new models can be facilitated by the recommendations provided in this work. At a more general level, this work represents a significant contribution to the current body of knowledge toward the development of commercial tools for the energy analysis and management of livestock houses. Future research endeavors, in fact, could prioritize overcoming the limitations identified in this review that currently hinder BES models from becoming standard practice primarily in the livestock industry. This is of crucial importance, considering that BES models could contribute to moving toward a more environmentally sustainable and resilient livestock sector.

Funding

Andrea Costantino was supported by a Margarita Salas Postdoctoral Fellowship from Universitat Politècnica de València, funded by Ministerio de Universidades and the European Union via the NextGeneration EU program.

Institutional Review Board Statement

Not applicable.

Data Availability Statement

Not applicable.

Conflicts of Interest

The author declares no conflict of interest.

Appendix A

The following query was introduced in the Scopus® database:
“TITLE-ABS-KEY((livestock OR animal OR poultry OR broiler OR hen OR duck OR swine OR pig* OR farrow* OR cattle OR dairy OR cow) PRE/1 (hous* OR building OR room OR barn OR facilit* OR farm*)) AND TITLE-ABS-KEY((energ* OR simulation OR therm* OR dynamic) PRE/3 (model* OR simulation OR assessment)) AND (LIMIT-TO (SRCTYPE, ”j”)) AND (LIMIT-TO (DOCTYPE, ”ar”)) AND (LIMIT-TO (PUBYEAR,2023) OR LIMIT-TO (PUBYEAR,2022) OR LIMIT-TO (PUBYEAR,2021) OR LIMIT-TO (PUBYEAR,2020) OR LIMIT-TO (PUBYEAR,2019) OR LIMIT-TO (PUBYEAR,2018) OR LIMIT-TO (PUBYEAR,2017) OR LIMIT-TO (PUBYEAR,2016) OR LIMIT-TO (PUBYEAR,2015) OR LIMIT-TO (PUBYEAR,2014) OR LIMIT-TO (PUBYEAR,2013) OR LIMIT-TO (PUBYEAR,2012) OR LIMIT-TO (PUBYEAR,2011) OR LIMIT-TO (PUBYEAR,2010) OR LIMIT-TO (PUBYEAR,2009) OR LIMIT-TO (PUBYEAR,2008) OR LIMIT-TO (PUBYEAR,2007) OR LIMIT-TO (PUBYEAR,2006) OR LIMIT-TO (PUBYEAR,2005) OR LIMIT-TO (PUBYEAR,2004) OR LIMIT-TO (PUBYEAR,2003) OR LIMIT-TO (PUBYEAR,2002) OR LIMIT-TO (PUBYEAR,2001) OR LIMIT-TO (PUBYEAR,2000) OR LIMIT-TO (PUBYEAR,1999) OR LIMIT-TO (PUBYEAR,1998)) AND (LIMIT-TO (LANGUAGE, ”English”))”

Appendix B

Table A1. Nomenclature (in alphabetical order) referring to the Goodness-of-Fit indexes (GoF) reported in Table 4.
Acronym/VariableDefinition
A N O V A ANalysis Of VAriance
C V Coefficient of Variation
C V R M S E Coefficient of Variation of the Root Mean Square Error
G O F Goodness Of Fit
I Q R Interquartile Range
L S D Fisher’s Least Significant Difference
M ¯ Arithmetic mean of the monitored values
M i i-th measured value
M A E Mean Absolute Error
M A P E Mean Absolute Percentage Error
M a x Maximum value
M a x A E Maximum Absolute Error
M a x R E Maximum Relative Error
M B E Mean Bias Error
M i n Minimum value
M P E Mean Percentage Error
n Dataset cardinality
N M B E Normalized Mean Bias Error
r Correlation coefficient
R 2 Coefficient of determination
R M S E Root Mean Square Error
S ¯ Arithmetic mean of the simulated values
S i i-th simulated value
S E Standard Error
x ¯ Arithmetic mean of values
σ Standard deviation
The algebraic formulations of the main GoF indexes presented in Table 4 are reported below. The GoF indexes are presented in alphabetical order, except for those whose formulation is a function of another index (e.g., C V R M S E and R M S E ) that, for clarity, were presented before. Please note that slight differences may be found between various formulations present in the literature.
The Root Mean Square Error ( R M S E ) reads [90]
R M S E = i = 1 n S i M i 2 n
The Coefficient of Variation of the R M S E ( C V R M S E ) reads [90]
C V R M S E = R M S E M ¯ · 100
The Goodness of Fit ( G O F ) reads [45]
G O F = 1 i = 1 n M i S i 2 i = 1 n S i M ¯ 2 · 100
The Mean Absolute Error ( M A E ) reads [102]
M A E = 100 n i = 1 n S i M i
The Mean Absolute Percentage Error ( M A P E ) reads [102]
M A P E = 100 n i = 1 n S i M i M i
The Maximum Absolute Error ( M a x A E ) reads (adapted from [102])
M a x A E = max n i = 1 S i M i
The Maximum Relative Error ( M a x R E ) reads
M a x R E = max n i = 1 S i M i M i
The Mean Bias Error ( M B E ) reads [90]
M B E = i = 1 n M i S i n · 100
The Normalized Mean Bias Error ( N M B E ) reads (adapted from [86])
N M B E = M B E M ¯
Please note that some works in the literature use Equation (A9) while referring to M B E . However, the formulation that is considered correct in the framework of this work is the one reported in Equation (A8). M B E , in fact, measures the average difference between measured and simulated data. N M B E normalizes the M B E over the mean of the measured values.
The Mean Percentage Error ( M P E ) reads [102]
M P E = 100 n i = 1 n S i M i M i
Various formulations can be used for calculating the coefficient of determination ( R 2 ). The one reported in [45] reads
R 2 = i = 1 n M i M ¯ · S i S ¯ i = 1 n M i M ¯ 2 · i = 1 n S i S ¯ 2 2 · 100
The correlation coefficient ( r ) can be obtained as follows:
r = R 2
Please note the sign of r depends on whether the data are positively correlated or negatively correlated.
The Standard Error ( S E ) reads
S E = σ n

References

  1. Mottet, A.; de Haan, C.; Falcucci, A.; Tempio, G.; Opio, C.; Gerber, P. Livestock: On Our Plates or Eating at Our Table? A New Analysis of the Feed/Food Debate. Glob. Food Sec. 2017, 14, 1–8. [Google Scholar] [CrossRef]
  2. Mpofu, I. Chapter 7—Ecosystem Services from Different Livestock Management Systems. In The Role of Ecosystem Services in Sustainable Food Systems; Rusinamhodzi, L., Ed.; Academic Press: Cambridge, MA, USA, 2020; pp. 135–140. ISBN 978-0-12-816436-5. [Google Scholar]
  3. ASHRAE. 2011 ASHRAE Handbook: HVAC Applications; ASHRAE: Atlanta, GA, USA, 2011; ISBN 9781936504077. [Google Scholar]
  4. Costantino, A.; Fabrizio, E.; Calvet, S. The Role of Climate Control in Monogastric Animal Farming: The Effects on Animal Welfare, Air Emissions, Productivity, Health, and Energy Use. Appl. Sci. 2021, 11, 9549. [Google Scholar] [CrossRef]
  5. Daramola, J.O.; Abioja, M.O.; Onagbesan, O.M. Heat Stress Impact on Livestock Production BT—Environmental Stress and Amelioration in Livestock Production. In Environmental Stress and Amelioration in Livestock Production; Sejian, V., Naqvi, S.M.K., Ezeji, T., Lakritz, J., Lal, R., Eds.; Springer: Berlin/Heidelberg, Germany, 2012; pp. 53–73. ISBN 978-3-642-29205-7. [Google Scholar]
  6. Grieve, D. Heat Stress in Commercial Layers and Breeders. Tech. Bull. Hy-Line Int. 2003, 19, 1–3. [Google Scholar]
  7. Moreno, I.; Ladero, L.; Cava, R. Effect of the Iberian Pig Rearing System on Blood Plasma Antioxidant Status and Oxidative Stress Biomarkers. Livest. Sci. 2020, 235, 104006. [Google Scholar] [CrossRef]
  8. Lu, Q.; Wen, J.; Zhang, H. Effect of Chronic Heat Exposure on Fat Deposition and Meat Quality in Two Genetic Types of Chicken. Poult. Sci. 2007, 86, 1059–1064. [Google Scholar] [CrossRef]
  9. Costantino, A.; Fabrizio, E.; Biglia, A.; Cornale, P.; Battaglini, L. Energy Use for Climate Control of Animal Houses: The State of the Art in Europe. Energy Procedia 2016, 101, 184–191. [Google Scholar] [CrossRef]
  10. van Horne, P.L.M. Economics of Broiler Production Systems in the Netherlands; Economic Aspects within the Greenwell Sustainability Assessment Model; Wageningen Economic Research: Wageningen, The Netherlands, 2020. [Google Scholar]
  11. Karaman, S.; Taşcıoğlu, Y.; Bulut, O.D. Profitability and Cost Analysis for Contract Broiler Production in Turkey. Animals 2023, 13, 2072. [Google Scholar] [CrossRef]
  12. Costantino, A.; Calvet, S.; Fabrizio, E. The Use of Renewable Energy Sources as a Driver to Reduce the Carbon Footprint of the Livestock Sector. In Technology for Environmentally Friendly Livestock Production; Bartzanas, T., Ed.; Springer International Publishing: Cham, Switzerland, 2023; pp. 217–250. ISBN 978-3-031-19730-7. [Google Scholar]
  13. Paris, B.; Vandorou, F.; Tyris, D.; Balafoutis, A.T.; Vaiopoulos, K.; Kyriakarakos, G.; Manolakos, D.; Papadakis, G. Energy Use in the EU Livestock Sector: A Review Recommending Energy Efficiency Measures and Renewable Energy Sources Adoption. Appl. Sci. 2022, 12, 2142. [Google Scholar] [CrossRef]
  14. IRENA; FAO. Renewable Energy for Agri-Food Systems—Towards the Sustainable Development Goals and the Paris Agreement; IRENA and FAO: Abu Dhabi, United Arab Emirates, 2021. [Google Scholar]
  15. FAO. Energy-Smart Food for People and Climate—Issue Paper; FAO: Rome, Italy, 2011. [Google Scholar]
  16. Jackson, P.; Guy, J.H.; Sturm, B.; Bull, S.; Edwards, S.A. An Innovative Concept Building Design Incorporating Passive Technology to Improve Resource Efficiency and Welfare of Finishing Pigs. Biosyst. Eng. 2018, 174, 190–203. [Google Scholar] [CrossRef]
  17. Costantino, A.; Calvet, S.; Fabrizio, E. Identification of Energy-Efficient Solutions for Broiler House Envelopes through a Primary Energy Approach. J. Clean. Prod. 2021, 312, 127639. [Google Scholar] [CrossRef]
  18. Alberti, L.; Antelmi, M.; Angelotti, A.; Formentin, G. Geothermal Heat Pumps for Sustainable Farm Climatization and Field Irrigation. Agric. Water Manag. 2018, 195, 187–299. [Google Scholar] [CrossRef]
  19. Tyris, D.; Gkountas, A.; Bakalis, P.; Panagakis, P.; Manolakos, D. A Dynamic Heat Pump Model for Indoor Climate Control of a Broiler House. Energies 2023, 16, 2770. [Google Scholar] [CrossRef]
  20. Kwak, Y.; Shin, H.; Kang, M.; Mun, S.-H.; Jo, S.-K.; Kim, S.-H.; Huh, J.-H. Energy Modeling of Pig Houses: A South Korean Feasibility Study. Energy Strat. Rev. 2021, 36, 100672. [Google Scholar] [CrossRef]
  21. Tan, H.; Yan, W.; Ren, Z.; Wang, Q.; Mohamed, M.A. Distributionally Robust Operation for Integrated Rural Energy Systems with Broiler Houses. Energy 2022, 254, 124398. [Google Scholar] [CrossRef]
  22. Chong, A.; Gu, Y.; Jia, H. Calibrating Building Energy Simulation Models: A Review of the Basics to Guide Future Work. Energy Build 2021, 253, 111533. [Google Scholar] [CrossRef]
  23. Costantino, A.; Fabrizio, E. Envisioning an Energy Performance Certificate for Livestock Houses: A General Methodological Development and a Specific Application to Growing-Finishing Pig Houses. J. Clean. Prod. 2023, 429, 139279. [Google Scholar] [CrossRef]
  24. Harish, V.S.K.V.; Kumar, A. A Review on Modeling and Simulation of Building Energy Systems. Renew. Sustain. Energy Rev. 2016, 56, 1272–1292. [Google Scholar] [CrossRef]
  25. Barone, G.; Buonomano, A.; Forzano, C.; Palombo, A. Building Energy Performance Analysis: An Experimental Validation of an In-House Dynamic Simulation Tool through a Real Test Room. Energies 2019, 12, 4107. [Google Scholar] [CrossRef]
  26. Coakley, D.; Raftery, P.; Keane, M. A Review of Methods to Match Building Energy Simulation Models to Measured Data. Renew. Sustain. Energy Rev. 2014, 37, 123–141. [Google Scholar] [CrossRef]
  27. Fabrizio, E.; Monetti, V. Methodologies and Advancements in the Calibration of Building Energy Models. Energies 2015, 8, 2548–2574. [Google Scholar] [CrossRef]
  28. Choi, K.; Park, S.; Joe, J.; Kim, S.-I.; Jo, J.-H.; Kim, E.-J.; Cho, Y.-H. Review of Infiltration and Airflow Models in Building Energy Simulations for Providing Guidelines to Building Energy Modelers. Renew. Sustain. Energy Rev. 2023, 181, 113327. [Google Scholar] [CrossRef]
  29. Hong, T.; Chen, Y.; Belafi, Z.; D’Oca, S. Occupant Behavior Models: A Critical Review of Implementation and Representation Approaches in Building Performance Simulation Programs. Build. Simul. 2018, 11, 1–14. [Google Scholar] [CrossRef]
  30. Shin, M.; Haberl, J.S. Thermal Zoning for Building HVAC Design and Energy Simulation: A Literature Review. Energy Build 2019, 203, 109429. [Google Scholar] [CrossRef]
  31. Costantino, A.; Comba, L.; Cornale, P.; Fabrizio, E. Energy Impact of Climate Control in Pig Farming: Dynamic Simulation and Experimental Validation. Appl. Energy 2022, 309, 118457. [Google Scholar] [CrossRef]
  32. Song, W.; Zhang, Z.; Chen, Z.; Wang, F.; Yang, B. Thermal Comfort and Energy Performance of Personal Comfort Systems (PCS): A Systematic Review and Meta-Analysis. Energy Build. 2022, 256, 111747. [Google Scholar] [CrossRef]
  33. Arakawa Martins, L.; Soebarto, V.; Williamson, T. A Systematic Review of Personal Thermal Comfort Models. Build Environ. 2022, 207, 108502. [Google Scholar] [CrossRef]
  34. Bournet, P.-E.; Rojano, F. Advances of Computational Fluid Dynamics (CFD) Applications in Agricultural Building Modelling: Research, Applications and Challenges. Comput. Electron. Agric. 2022, 201, 107277. [Google Scholar] [CrossRef]
  35. Rong, L.; Nielsen, P.V.; Bjerg, B.; Zhang, G. Summary of Best Guidelines and Validation of CFD Modeling in Livestock Buildings to Ensure Prediction Quality. Comput. Electron. Agric. 2016, 121, 180–190. [Google Scholar] [CrossRef]
  36. Singh, M.; Sharston, R. A Literature Review of Building Energy Simulation and Computational Fluid Dynamics Co-Simulation Strategies and Its Implications on the Accuracy of Energy Predictions. Build. Serv. Eng. Res. Technol. 2022, 43, 113–138. [Google Scholar] [CrossRef]
  37. Shan, X.; Luo, N.; Sun, K.; Hong, T.; Lee, Y.-K.; Lu, W.-Z. Coupling CFD and Building Energy Modelling to Optimize the Operation of a Large Open Office Space for Occupant Comfort. Sustain. Cities Soc. 2020, 60, 102257. [Google Scholar] [CrossRef]
  38. Corrado, V.; Fabrizio, E. Chapter 5—Steady-State and Dynamic Codes, Critical Review, Advantages and Disadvantages, Accuracy, and Reliability. In Handbook of Energy Efficiency in Buildings; Asdrubali, F., Desideri, U., Eds.; Butterworth-Heinemann: Oxford, UK, 2019; pp. 263–294. ISBN 978-0-12-812817-6. [Google Scholar]
  39. Chen, Y.; Guo, M.; Chen, Z.; Chen, Z.; Ji, Y. Physical Energy and Data-Driven Models in Building Energy Prediction: A Review. Energy Rep. 2022, 8, 2656–2671. [Google Scholar] [CrossRef]
  40. Cooper, K.; Parsons, D.J.; Demmers, T. A Thermal Balance Model for Livestock Buildings for Use in Climate Change Studies. J. Agric. Eng. Res. 1998, 69, 43–52. [Google Scholar] [CrossRef]
  41. Liberati, P.; Zappavigna, P. A Dynamic Computer Model for Optimization of the Internal Climate in Swine Housing Design. Trans. ASABE 2007, 50, 2179–2188. [Google Scholar] [CrossRef]
  42. Lee, S.-Y.; Lee, I.-B.; Kim, R.-W.; Yeo, U.-H.; Kim, J.-G.; Kwon, K.-S. Dynamic Energy Modelling for Analysis of the Thermal and Hygroscopic Environment in a Mechanically Ventilated Duck House. Biosyst. Eng. 2020, 200, 431–449. [Google Scholar] [CrossRef]
  43. Shin, H.; Kwak, Y.; Jo, S.-K.; Kim, S.-H.; Huh, J.-H. Calibration of Building Energy Simulation Model for a Mechanically Ventilated Livestock Facility. Biosyst. Eng. 2022, 217, 115–130. [Google Scholar] [CrossRef]
  44. Qi, F.; Li, H.; Zhao, X.; Huang, J.; Shi, Z. Investigation on Minimum Ventilation, Heating, and Energy Consumption of Pig Buildings in China during Winter. Agriculture 2023, 13, 319. [Google Scholar] [CrossRef]
  45. Nawalany, G.; Sokołowski, P. Interaction between a Cyclically Heated Building and the Ground, for Selected Locations in Europe. Energies 2022, 15, 7493. [Google Scholar] [CrossRef]
  46. Izar-Tenorio, J.; Jaramillo, P.; Griffin, W.M.; Small, M. Impacts of Projected Climate Change Scenarios on Heating and Cooling Demand for Industrial Broiler Chicken Farming in the Eastern U.S. J. Clean. Prod. 2020, 255, 120306. [Google Scholar] [CrossRef]
  47. Axaopoulos, P.; Panagakis, P.; Axaopoulos, I. Optimization of Exterior Wall and Roof Insulation Thickness of a Growing-Finishing Piggery Building. Trans. ASABE 2017, 60, 489–495. [Google Scholar] [CrossRef]
  48. Wang, K.; Xue, H. Effects of Roof and Wall Insulation on Thermal Performance of Piglet Building Using Dynamic Simulation and Life Cycle Cost Analysis. Trans. ASABE 2016, 59, 915–922. [Google Scholar] [CrossRef]
  49. Si, B.; Wang, C.; Cheng, S.; Ma, X.; Xu, W.; Wang, Z.; Li, B.; Wang, Y.; Shi, Z.; Jiang, W. Carbon and Water Footprint Analysis of Pig Farm Buildings in Northeast China Using Building-Information-Modeling Enabled Assessment. Sci. Total Environ. 2023, 888, 164088. [Google Scholar] [CrossRef]
  50. Mikovits, C.; Zollitsch, W.; Hörtenhuber, S.J.; Baumgartner, J.; Niebuhr, K.; Piringer, M.; Anders, I.; Andre, K.; Hennig-Pauka, I.; Schönhart, M.; et al. Impacts of Global Warming on Confined Livestock Systems for Growing-Fattening Pigs: Simulation of Heat Stress for 1981 to 2017 in Central Europe. Int. J. Biometeorol. 2019, 63, 221–230. [Google Scholar] [CrossRef]
  51. Schauberger, G.; Schönhart, M.; Zollitsch, W.; Hörtenhuber, S.J.; Kirner, L.; Mikovits, C.; Baumgartner, J.; Piringer, M.; Knauder, W.; Anders, I.; et al. Reduction of the Economic Risk by Adaptation Measures to Alleviate Heat Stress in Confined Buildings for Growing-Fattening Pigs Modelled by a Projection for Central Europe in 2030. Agronomy 2022, 12, 248. [Google Scholar] [CrossRef]
  52. Gonçalves, I.C.M.; Turco, S.H.N.; Lopes Neto, J.P.; do Nascimento, J.W.B.; de Lima, V.L.A.; Borges, V.P. Thermal Performance of Aviary Located in the Semiarid Region of Pernambuco Based on Computer Simulation. Rev. Bras. Eng. Agríc. E Ambient. 2022, 26, 533–540. [Google Scholar] [CrossRef]
  53. Shin, H.; Kwak, Y.; Jo, S.-K.; Kim, S.-H.; Huh, J.-H. Development of an Optimal Mechanical Ventilation System Control Strategy Based on Weather Forecasting Data for Outdoor Air Cooling in Livestock Housing. Energy 2023, 268, 126649. [Google Scholar] [CrossRef]
  54. Lambert, M.; Lemay, S.P.; Barber, E.M.; Crowe, T.G.; Chénard, L. Humidity Control for Swine Buildings in Cold Climate—Part I: Modelling of Three Control Strategies. Can. Biosyst. Eng./Le Genie Des Biosyst. Au Can. 2001, 43, 529–536. [Google Scholar]
  55. Manolakos, D.; Panagakis, P.; Bartzanas, T.; Bouzianas, K. Use of Heat Pumps in HVAC Systems for Precise Environment Control in Broiler Houses: System’s Modeling and Calculation of the Basic Design Parameters. Comput. Electron. Agric. 2019, 163, 104876. [Google Scholar] [CrossRef]
  56. Omar, M.N.; Samak, A.A.; Keshek, M.H.; Elsisi, S.F. Simulation and Validation Model for Using the Energy Produced from Broiler Litter Waste in Their House and Its Requirement of Energy. Renew. Energy 2020, 159, 920–928. [Google Scholar] [CrossRef]
  57. Wang, Y.; Li, B.; Liang, C.; Zheng, W. Dynamic Simulation of Thermal Load and Energy Efficiency in Poultry Buildings in the Cold Zone of China. Comput. Electron. Agric. 2020, 168, 105127. [Google Scholar] [CrossRef]
  58. Zhao, Y.; Xin, H.; Shepherd, T.A.; Hayes, M.D.; Stinn, J.P. Modelling Ventilation Rate, Balance Temperature and Supplemental Heat Need in Alternative vs. Conventional Laying-Hen Housing Systems. Biosyst. Eng. 2013, 115, 311–323. [Google Scholar] [CrossRef]
  59. Lee, S.-Y.; Lee, I.-B.; Yeo, U.-H.; Kim, J.-G.; Kim, R.-W.; Kwon, K.-S. Dynamic Energy Model of a Naturally Ventilated Duck House and Comparative Analysis of Energy Loads According to Ventilation Type. Biosyst. Eng. 2022, 219, 218–234. [Google Scholar] [CrossRef]
  60. Nguyen-Ky, S.; Penttilä, K. Indoor climate and energy model calibration with monitored data of a naturally ventilated dairy barn in a cold climate. Appl. Eng. Agric. 2021, 37, 851–859. [Google Scholar] [CrossRef]
  61. Menconi, M.E.; Chiappini, M.; Grohmann, D. Implementation of a Genetic Algorithm for Energy Design Optimization of Livestock Housing Using a Dynamic Thermal Simulator. J. Agric. Eng. 2013, 44, 191–196. [Google Scholar] [CrossRef]
  62. Turnpenny, J.R.; Parsons, D.J.; Armstrong, A.C.; Clark, J.A.; Cooper, K.; Matthews, A.M. Integrated Models of Livestock Systems for Climate Change Studies. 2. Intensive Systems. Glob. Chang. Biol. 2001, 7, 163–170. [Google Scholar] [CrossRef]
  63. Costantino, A.; Fabrizio, E.; Ghiggini, A.; Bariani, M. Climate Control in Broiler Houses: A Thermal Model for the Calculation of the Energy Use and Indoor Environmental Conditions. Energy Build. 2018, 169, 110–126. [Google Scholar] [CrossRef]
  64. Hamilton, J.; Negnevitsky, M.; Wang, X. Thermal Analysis of a Single-Storey Livestock Barn. Adv. Mech. Eng. 2016, 8, 1–9. [Google Scholar] [CrossRef]
  65. Silva, M.P.; Baêta, F.C.; Tinôco, I.F.F.; Zolnier, S.; Ribeiro, A. Evaluation of a Simplified Model for Estimating Energy Balance in Broilers Production Housing. Rev. Bras. Eng. Agric. E Ambient. 2007, 11, 532–536. [Google Scholar] [CrossRef]
  66. Van Wagenberg, A.V.; Vranken, E.; Berckmans, D. Simulation and Validation of the Evaporation of Water from Liquid Manure Using Ventilation Exhaust Air: Linking of Two Simulation Models. Biosyst. Eng. 2003, 84, 31–43. [Google Scholar] [CrossRef]
  67. Schauberger, G.; Piringer, M.; Petz, E. Steady-State Balance Model to Calculate the Indoor Climate of Livestock Buildings, Demonstrated for Finishing Pigs. Int. J. Biometeorol. 2000, 43, 154–162. [Google Scholar] [CrossRef]
  68. Panagakis, P.; Manolakos, D.; Axaopoulos, P. Optimal Financial Insulation Thickness of a Broiler House. Agric. Eng. Int. CIGR J. 2021, 23, 99–110. [Google Scholar]
  69. Costantino, A.; Fabrizio, E.; Villagrá, A.; Estellés, F.; Calvet, S. The Reduction of Gas Concentrations in Broiler Houses through Ventilation: Assessment of the Thermal and Electrical Energy Consumption. Biosyst. Eng. 2020, 199, 135–148. [Google Scholar] [CrossRef]
  70. Jackson, P.; Guy, J.; Edwards, S.A.; Sturm, B.; Bull, S. Application of Dynamic Thermal Engineering Principles to Improve the Efficiency of Resource Use in UK Pork Production Chains. Energy Build. 2017, 139, 53–62. [Google Scholar] [CrossRef]
  71. Park, J.H.; Peters, T.M.; Altmaier, R.; Sawvel, R.A.; Renée Anthony, T. Simulation of Air Quality and Cost to Ventilate Swine Farrowing Facilities in Winter. Comput. Electron. Agric. 2013, 98, 136–145. [Google Scholar] [CrossRef] [PubMed]
  72. Scherllin-Pirscher, B.; Mikovits, C.; Baumann-Stanzer, K.; Piringer, M.; Schauberger, G. Are Adaptation Measures Used to Alleviate Heat Stress Appropriate to Reduce Ammonia Emissions? Atmosphere 2022, 13, 1786. [Google Scholar] [CrossRef]
  73. Cho, J.-H.; Lee, I.-B.; Lee, S.-Y.; Park, S.-J.; Jeong, D.-Y.; Decano-Valentin, C.; Kim, J.-G.; Choi, Y.-B.; Jeong, H.-H.; Yeo, U.-H.; et al. Development of Heat Stress Forecasting System in Mechanically Ventilated Broiler House Using Dynamic Energy Simulation. Agriculture 2022, 12, 1666. [Google Scholar] [CrossRef]
  74. Haeussermann, A.; Vranken, E.; Aerts, J.-M.; Hartung, E.; Jungbluth, T.; Berckmans, D. Evaluation of Control Strategies for Fogging Systems in Pig Facilities. Trans. ASABE 2007, 50, 265–274. [Google Scholar] [CrossRef]
  75. Gates, R.S.; Chao, K.; Sigrimis, N. Identifying Design Parameters for Fuzzy Control of Staged Ventilation Control Systems. Comput. Electron. Agric. 2001, 31, 61–74. [Google Scholar] [CrossRef]
  76. European Commission. Farm to Fork Strategy—For a Fair, Healthy and Environmentally-Friendly Food System. 2020. Available online: https://food.ec.europa.eu/system/files/2020-05/f2f_action-plan_2020_strategy-info_en.pdf (accessed on 19 September 2023).
  77. EN ISO 13790; Energy Performance of Buildings–Calculation of Energy Use for Space Heating and Cooling. European Committee for Standardisation: Brussels, Belgium, 2008.
  78. U.S. Department of Energy Energy Plus. Available online: https://energyplus.net/ (accessed on 19 September 2023).
  79. Thermal Energy System Specialists TRNSYS—Transient System Simulation Tool. Available online: https://www.trnsys.com/ (accessed on 19 September 2023).
  80. Crawley, D.B.; Hand, J.W.; Kummert, M.; Griffith, B.T. Contrasting the Capabilities of Building Energy Performance Simulation Programs. Build. Environ. 2008, 43, 661–673. [Google Scholar] [CrossRef]
  81. University of Strathclyde: Energy Systems Research Unit—ESP-r (Environmental Systems Performance—Research). Available online: https://www.esru.strath.ac.uk/applications/esp-r/ (accessed on 19 September 2023).
  82. Fraunhofer IBP WUFI. Available online: https://wufi.de/en/software/wufi-plus/ (accessed on 19 September 2023).
  83. EQUA Simulation AB IDA Indoor Climate and Energy. Available online: https://www.equa.se/en/ida-ice (accessed on 20 September 2023).
  84. Yan, D.; Xia, J.; Tang, W.; Song, F.; Zhang, X.; Jiang, Y. DeST—An Integrated Building Simulation Toolkit Part I: Fundamentals. Build. Simul. 2008, 1, 95–110. [Google Scholar] [CrossRef]
  85. Baxevanou, C.; Fidaros, D.; Bartzanas, T.; Kittas, C. Energy Consumption and Energy Saving Measures in Poultry. Environ. Eng. 2017, 5, 29–36. [Google Scholar] [CrossRef]
  86. ASHRAE. Measurement of Energy and Demand Savings; ANSI/ASHRAE ASHRAE Guideline 14-2002; American Society of Heating, Refrigerating and Air-Conditioning Engineers, Inc.: Atlanta, GA, USA, 2002. [Google Scholar]
  87. ASHRAE. ASHRAE Handbook—Fundamentals (SI Edition); ASHRAE: Atlanta, GA, USA, 2017; ISBN 978-1-936504-46-6. [Google Scholar]
  88. Federal Energy Management Program. M&V Guidelines: Measurement and Verification for Performance-Based Contracts Version 4.0; U.S. Department of Energy: Washington, DC, USA, 2015.
  89. IPMVP Technical Committee. International Performance Measurement & Verification Protocol—Concepts and Options for Determining Energy and Water Savings—Volume I; IPMVP: Washington, DC, USA, 2002. [Google Scholar]
  90. Federal Energy Management Program. M&V Guidelines: Measurement and Verification for Federal Energy Projects Version 3.0; U.S. Department of Energy: Washington, DC, USA, 2008.
  91. IPMVP New Construction Subcommittee. International Performance Measurement & Verification Protocol: Concepts and Option for Determining Energy Savings in New Construction, Volume III; IPMVP: Washington, DC, USA, 2003. [Google Scholar]
  92. Efficiency Valuation Organization. International Performance Measurement and Verification Protocol (IPMVP)—Core Concepts; Efficiency Valuation Organization: Washington, DC, USA, 2016. [Google Scholar]
  93. Ecim-Djuric, O.; Topisirovic, G. Energy Efficiency Optimization of Combined Ventilation Systems in Livestock Buildings. Energy Build 2010, 42, 1165–1171. [Google Scholar] [CrossRef]
  94. Izhboldina, O.; Mylostyvyi, R.; Khramkova, O.; Pavlenko, O.; Kapshuk, N.; Chernenko, O.; Matsyura, A.; Hoffmann, G. Effectiveness of Additional Mechanical Ventilation in Naturally Ventilated Dairy Housing Barns during Heat Waves. Ukr. J. Ecol. 2020, 10, 56–62. [Google Scholar]
  95. Zhai, Z.J.; Chen, Q.Y. Performance of Coupled Building Energy and CFD Simulations. Energy Build 2005, 37, 333–344. [Google Scholar] [CrossRef]
  96. Barbason, M.; Reiter, S. Coupling Building Energy Simulation and Computational Fluid Dynamics: Application to a Two-Storey House in a Temperate Climate. Build. Environ. 2014, 75, 30–39. [Google Scholar] [CrossRef]
  97. Nawalany, G.; Sokołowski, P. Improved Energy Management in an Intermittently Heated Building Using a Large Broiler House in Central Europe as an Example. Energies 2020, 16, 1371. [Google Scholar] [CrossRef]
  98. Ruiz, G.R.; Bandera, C.F. Validation of Calibrated Energy Models: Common Errors. Energies 2017, 10, 1587. [Google Scholar] [CrossRef]
  99. Thacker, B.H.; Doebling, S.W.; Hemez, F.M.; Anderson, M.C.; Pepin, J.E.; Rodriguez, E.A. Concepts of Model Verification and Validation; Los Alamos National Laboratory: Los Alamos, NM, USA, 2004. [Google Scholar]
  100. ANSI/ASHRAE. ANSI/ASHRAE 140-2020—Method Of Test For Evaluating Building Performance Simulation Software; ANSI: Washington, DC, USA, 2020. [Google Scholar]
  101. Costantino, A.; Ballarini, I.; Fabrizio, E. Comparison between Simplified and Detailed Methods for the Calculation of Heating and Cooling Energy Needs of Livestock Housing: A Case Study. In Proceedings of the Building Simulation Applications, Bozen-Bolzano, Italy, 8–10 February 2017; pp. 193–200. [Google Scholar]
  102. Wen, X.; Jaxa-Rozen, M.; Trutnevyte, E. Accuracy Indicators for Evaluating Retrospective Performance of Energy System Models. Appl. Energy 2022, 325, 119906. [Google Scholar] [CrossRef]
  103. Riahi, K.; van Vuuren, D.P.; Kriegler, E.; Edmonds, J.; O’Neill, B.C.; Fujimori, S.; Bauer, N.; Calvin, K.; Dellink, R.; Fricko, O.; et al. The Shared Socioeconomic Pathways and Their Energy, Land Use, and Greenhouse Gas Emissions Implications: An Overview. Glob. Environ. Chang. 2017, 42, 153–168. [Google Scholar] [CrossRef]
  104. St-Pierre, N.R.; Cobanov, B.; Schnitkey, G. Economic Losses from Heat Stress by US Livestock Industries. J. Dairy Sci. 2003, 86, E52–E77. [Google Scholar] [CrossRef]
  105. Minister of Agriculture. Code of Welfare: Layer Hens; Minister of Agriculture: Wellington, New Zealand, 2018.
  106. National Farm Animal Care Council (NFACC). Code of Practice for the Care and Handling of Pullets and Laying Hens; National Farm Animal Care Council: Ottawa, CA, USA, 2017. [Google Scholar]
Figure 1. Schematization of the systematic selection of the scientific papers considered within this review.
Agriculture 13 02280 g001
Figure 2. The annual publication count of the 42 journal papers included in this review throughout the considered timeframe (1998–2023). The sub-bars indicate the publication count related to the identified applications of the Building Energy Simulation models identified within the framework of this review.
Agriculture 13 02280 g002
Table 1. Logic grid of keywords and alternative terms.
LivestockHous *Energ *Model *
AnimalBuildingSimulationSimulation
PoultryRoomTherm *Assessment
BroilerBarnDynamic
HenFacilit *
DuckFarm *
Swine
Pig *
Farrow *
Cattle
Dairy
Cow
The asterisk wildcard is used for the truncation to include significant variations of the same word in the search.
Table 3. Comparison of the main features of the analyzed Building Energy Simulation models. Model type indicates if a custom model was implemented, or a ready-to-use tool was adopted for its implementation (the name of the tool is indicated in brackets). The type of analysis is distinguished between steady-state (SS) or dynamic (D) analysis.
ReferenceModel TypeType of
Analysis
Simulation
Time Step
Indoor   Air   Relative   Humidity   ( φ a i r _ i ) EstimationEstimated Energy
Parameter 1
Model
Validation
Si et al. [49]CustomSSn.a. 2 E H E f a n
Tyris et al. [19]CustomDn.a. E H E C   3
Qi et al. [44]CustomSS1 h ϕ H E H
Shin et al. [53]Tool (E+)D1 h E f a n
Scherllin-Pirscher et al. [72]Same of [67]SS1 h-
Cho et al. [73]Tool (E+)D5 min-
Nawalany and Sokołowski [45]Tool (WUFI)D1 h ϕ H
Tan et al. [21]CustomD1 h Q H E f a n
Lee et al. [59]Tool (TRNSYS)D5 min ϕ H ϕ C
Shin et al. [43]Tool (E+)D1 h E f a n
Costantino et al. [31]CustomD1 h E H E f a n
Schauberger et al. [51]Same of [67]SS1 h-
Gonçalves et al. [52]Tool (E+)D1 h-
Costantino et al. [17]Same of [63]D1 h E H E f a n in [63]
Kwak et al. [20]Tool (E+)D1 h E H E f a n
Nguyen-Ky and Pentillä [60]Tool (IDA ICE)D1 h E H
Panagakis et al. [68]Tool (TRNSYS)D1 h ϕ H ϕ C
Lee et al. [42]Tool (TRNSYS)D5 min ϕ H ϕ C
Costantino et al. [69]Same of [63]D1 h E H E f a n in [63]
Omar et al. [56]CustomSS1 h Q H
Izar-Tenorio et al. [46]Adaptation of [64]SS1 h ϕ H ϕ C
Wang et al. [57]Tool (DeST)D1 h ϕ H ϕ C
Manolakos et al. [55]CustomSS1 h ϕ H ϕ C E H E C
Mikovits et al. [50]Same of [67]SS1 h-
Jackson et al. [16]Same of [70]D1 h-in [70]
Costantino et al. [63]CustomD1 h E H E f a n
Jackson et al. [70]Tool (E+)D1 h-
Axaopoulos et al. [47]Tool (TRNSYS)D1 h-
Hamilton et al. [64]CustomSS1 h ϕ H
Wang and Xue [48]Tool (E+)D1 h E H
Zhao et al. [58]CustomSS1 h Q H
Menconi et al. [61]Tool (E+)D1 h Q H Q C
Park et al. [71]CustomDn.a. E H
Liberati and Zappavigna [41]CustomD1 h-
Silva et al. [65]CustomSS2 h4-
Haeussermann et al. [74]CustomD3 s E H E f a n
Wagenberg et al. [66]CustomD3 s E H E f a n
Lambert et al. [54]CustomSS1 h E H E f a n
Turnpenny et al. [62]Adaptation of [40]SS1 h E f a n
Gates et al. [75]CustomD30 s-
Schauberger et al. [67]CustomSS30 min-
Cooper et al. [40]CustomSS1 h-
1 The investigated energy variables are the thermal load ( ϕ ), energy need ( Q ), and energy consumption ( E ) referred to Heating (subscript: H) and Cooling (subscript: C). The term E f a n indicates the electrical energy consumption of fans. 2 No data is available from the manuscript. 3 The energy consumption for dehumidification is also estimated. 4 The estimation concerns the indoor air-specific humidity.
Table 4. Comparison between the validated Building Energy Simulation models. The considered validation parameters are the indoor air temperature ( θ a i r _ i ) and relative humidity ( φ a i r _ i ), the energy consumption for heating ( E H ) and fan operation ( E f a n ). In the validation parameter columns, the symbol “✓” means the validation was performed for that parameter, “☓” means the validation was omitted, “-” means the validation was not possible since the model does not estimate that parameter, and “n.a.” means that data are not available from the manuscript.
Validation Parameters (Sample Size)
Reference θ a i r _ i φ a i r _ i E H E f a n Validation PeriodGoF Indexes 1Thresholds
Qi et al. [44]✓ (n.a.)✓ (n.a.)-14 days M A E , M a x A E , M a x R E , M P E
Shin et al. [53]✓ (504)--✓ (504)21 days C V R M S E , N M B E [86]
Cho et al. [73]✓ (2016)✓ (2016)--7 days M A P E , N M B E , R 2 , R S M E [87,88,89]
Nawalany and Sokołowski [45]✓ (8760)---365 days G O F , R 2 Custom
Lee et al. [59]✓ (2016)✓ (2016)--7 days M A P E , R 2 , R S M E
Shin et al. [43]✓ (504)--✓ (21)21 days C V R M S E , N M B E , R 2 [86]
Costantino et al. [31]✓ (744)✓ (744)✓ (744)37 days C V R M S E , N M B E , R M S E [86,90,91]
Gonçalves et al. [52]✓ (48)✓ (48)--2 days C V , r , R 2
Nguyen-Ky and Pentillä [60]✓ (4416)✓ (2928)3 (2)-184/122/197 days 2 C V R M S E , M A P E , N M B E [86,88,92] Custom
Lee et al. [42]✓ (2016)✓ (2016)--7 days M A P E , R 2 , R M S E
Omar et al. [56]✓ (144)---6 days R 2
Wang et al. [57]✓ (168)✓ (168)--7 days A N O V A , L S D , R 2
Manolakos et al. [55]4 (1)365 days M P E
Costantino et al. [63]✓ (1200)✓ (1200)✓ (1)✓ (1)50 days C V R M S E , M P E , N M B E , R M S E [86]
Jackson et al. [70]✓ (240)---10 days
Hamilton et al. [64]✓ (840)✓ (840)--35 days R M S E
Zhao et al. [58]-✓ (1)-152 days M P E Custom
Liberati and Zappavigna [41]✓ (48)✓ (48)--48 h R 2
Silva et al. [65]✓ (34)5 (34)--68 h S E Custom
Haeussermann et al. [74]✓ (17,280)✓ (17,280)180 days I Q R , M a x , M i n , x ¯ , σ Custom
Cooper et al. [40]✓ (168)--7 days M A E , σ 6
1 The Goodness-of-Fit (GoF) indexes are detailed in Appendix B. 2 Respectively, for θ a i r _ i , φ a i r _ i , and E H . 3 Validation performed considering E H in the total energy consumption of the livestock house. 4 Validation performed via the comparison with energy consumption estimated via a previously performed energy audit [85]. 5 Validation performed on the indoor air specific humidity. 6 The standard deviation ( σ ) is calculated amongst the errors.
Table 5. Recommended Goodness-of-Fit (GoF) indexes with their respective threshold intervals specified for the time step of the validation dataset.
GoF IndexThreshold IntervalTime Step of the
Validation Dataset
Source
N M B E 1 10 % , + 10 %   Hour[86,88]
5 % , + 5 %   Month[86,88]
20 % , + 20 %   Month[89]
C V R M S E 0 % , + 30 %   Hour[86,88]
0 % , + 20 %   Hour[89]
0 % , + 15 %   Month[86,90]
0 % , + 5 %   Month[91]
R 2 + 75 % , + 100 %   Hour[87,88]
G o F + 80 % , + 100 % Hour[45]
M A P E 2 0 % , + 10 % Hour/Entire period[60]
1 Not recommended to be used alone due to cancellation errors. 2 Mainly recommended for evaluating the estimation of the energy consumption over the entire validation period.
Disclaimer/Publisher’s Note: The statements, opinions and data contained in all publications are solely those of the individual author(s) and contributor(s) and not of MDPI and/or the editor(s). MDPI and/or the editor(s) disclaim responsibility for any injury to people or property resulting from any ideas, methods, instructions or products referred to in the content.

