Article

Linear and Nonlinear Mixed Models to Determine the Growth Curves of Weaned Piglets and the Effect of Sex on Growth

by
Roberto Besteiro
1,*,
Tamara Arango
2,
Manuel R. Rodríguez
3 and
María D. Fernández
3
1
Animal Production Department, Centro de Investigacións Agrarias de Mabegondo, Xunta de Galicia, 15318 A Coruña, Spain
2
Independent Researcher, 27002 Lugo, Spain
3
Department of Agroforestry Engineering, Higher Polytechnic Engineering School, Campus Terra, University of Santiago de Compostela, 27002 Lugo, Spain
*
Author to whom correspondence should be addressed.
Agriculture 2024, 14(1), 79; https://doi.org/10.3390/agriculture14010079
Submission received: 10 November 2023 / Revised: 26 December 2023 / Accepted: 27 December 2023 / Published: 30 December 2023
(This article belongs to the Special Issue Optimization of Livestock Housing Management)

Abstract

:
This study characterizes the growth of weaned Large White × Landrace hybrid piglets from 6 to 20 kg live body weight (BW) under real farm conditions. Batches of 50 castrated male pigs and 50 gilts were weighed repeatedly over two 6-week breeding cycles. The data was fitted to various linear (quadratic and exponential) and nonlinear (Gompertz, Richards, logistic, Von-Bertalanffy) mixed models to find the best-performing model. During the postweaning phase, animal growth was modelled, and the effect of sex on growth was determined by incorporating the variable, sex, into the mixed models and using t-tests for paired samples. The average BW at weaning was 6.86 kg, and the average BW by the end of the cycle was 19.46 kg, with an average daily gain (ADG) of 0.324 kg/day. Over the study period, the variable, sex, did not show a significant effect (p < 0.05) on piglet growth. The nonlinear mixed models performed better than the linear mixed models, with the Gompertz (RMSE = 0.296) and Von-Bertalanffy (RMSE = 0.288) curves as the best-performing models. When fitted to the Gompertz curve, the data showed a maximum ADG of 0.508 kg/day on day 27 postweaning. Accordingly, nonlinear mixed models can provide useful information to farmers about the evolution of weaned piglet growth and can be used for the early detection of growth anomalies.

1. Introduction

In natural conditions, piglet weaning occurs gradually around weeks 12 to 17 of age [1,2,3,4]. On the other hand, in current breeding systems, techniques like early weaning are usually employed in order to improve the reproductive efficiency of sows, optimize the usage rate of maternity facilities and report better business profit [5,6]. In the European Union, the minimum weaning age of pigs is 28 days. However, litters can be weaned at 21 days of age if they are moved to specialized, thoroughly cleaned facilities [7]. Early weaning negatively affects piglet development because of the weaning stress caused by changes in food and environment [8,9,10,11], which contributes to a reduction in feed intake and growth performance and an increase in infection susceptibility [12] during the postweaning phase. Therefore, to optimize the handling of the piglet weaning period and to obtain good performances in this and future phases, three main aspects should be taken into account: environment, feeding and health. In the European Union, three-quarters of the pig meat production takes place in ten countries. The production in these countries shows better organization between specialized breeders and fatteners [13]. Furthermore, breeders in these countries usually wean piglets on day 21 and house weaned piglets during an intermediate phase or postweaning phase that occurs before the growing phase and goes from 5–6 kg live BW to 20 kg BW.
Many authors have studied the influence of sex on piglet growth; Ref. [14] found that males grew faster and developed a heavier and fatter carcass; Ref. [15] observed that females showed less growth potential than males during the growing phase. The authors of [16] studied the influence of sex on growth before birth and found that male conceptuses grew faster than female conceptuses before the attachment to the uterine lining. Other authors such as [17] found that sex had no significant effect on evisceration weight, dressing percentage and carcass length in adult pigs. However, there is scarce information available on the influence of sex on piglet growth during the postweaning phase (6–20 kg BW), which is common in countries like Spain.
Nowadays, technologies connected to so-called smart farming are contributing to optimizing livestock housing management, mainly in fields like animal welfare or energy-efficient livestock housing. In this sense, an appropriate mathematical description of animal growth can be used to predict production performance, daily gain, precocity or adult BW, and to improve breeding decision-making in relation to topics like resource utilization or indoor environmental control. Because growth patterns have been subjected to many mathematical analyses, there is a wide variety of functions available for the prediction of animal growth rates across various life stages. The S-shape, or sigmoid shape, is a widely used nonlinear trajectory that allows for the definition of a point of inflexion at which the early growth rate is maximised, and from which growth slows down until there is no growth at all. In addition, sigmoid functions can model growth based on the estimation of parameters that can be readily interpreted and allow for the analysis of features that can differentiate among animal growth patterns [18]. Generalized logistic functions with a variable point of inflexion, such as the Richards [19] or Janoschek [20] functions, are flexible, but the models based on these functions often show convergence issues. Functions with a fixed point of inflexion, such as the logistic function, the Von Bertalanffy function or the Gompertz function, can be more easily applied to BW modelling. Many authors have pointed to a sigmoid-shaped relationship between BW and components such as protein or fat over time, which fits the properties of the Gompertz function at any point in the life cycle of the animal [21]. In contrast, linear models are more flexible and computationally simpler than nonlinear models and provide a relatively good fit of data to growth curves.
Usually, growth studies are based on longitudinal data, i.e., on measurements repeated on the same individual at different time points. These measurements are correlated with one another, which violates the assumption of independence of errors, a key assumption in many of the techniques used traditionally to model animal growth. A solution to this shortcoming is using mixed effects models that take into consideration the variance–covariance structure of the BW data [22]. For example, nonlinear mixed growth models can model nonlinear curves considering the changes within and between animals and allow for the assessment of the features of every individual in their growth pattern [18]. However, the performance of these mixed models to characterize the growth of piglets during the postweaning phase, with high growth rates in relation to weight, is still unknown.
This research aims to characterize the growth rates of piglets throughout the production cycle, from 6 to 20 Kg live BW, and to determine the effect of sex on piglet growth. To this end, the production records and the biological parameters derived from the growth curves are used. Finally, weaned piglet growth is modelled using linear and nonlinear mixed models and the best-fitting curves are chosen.

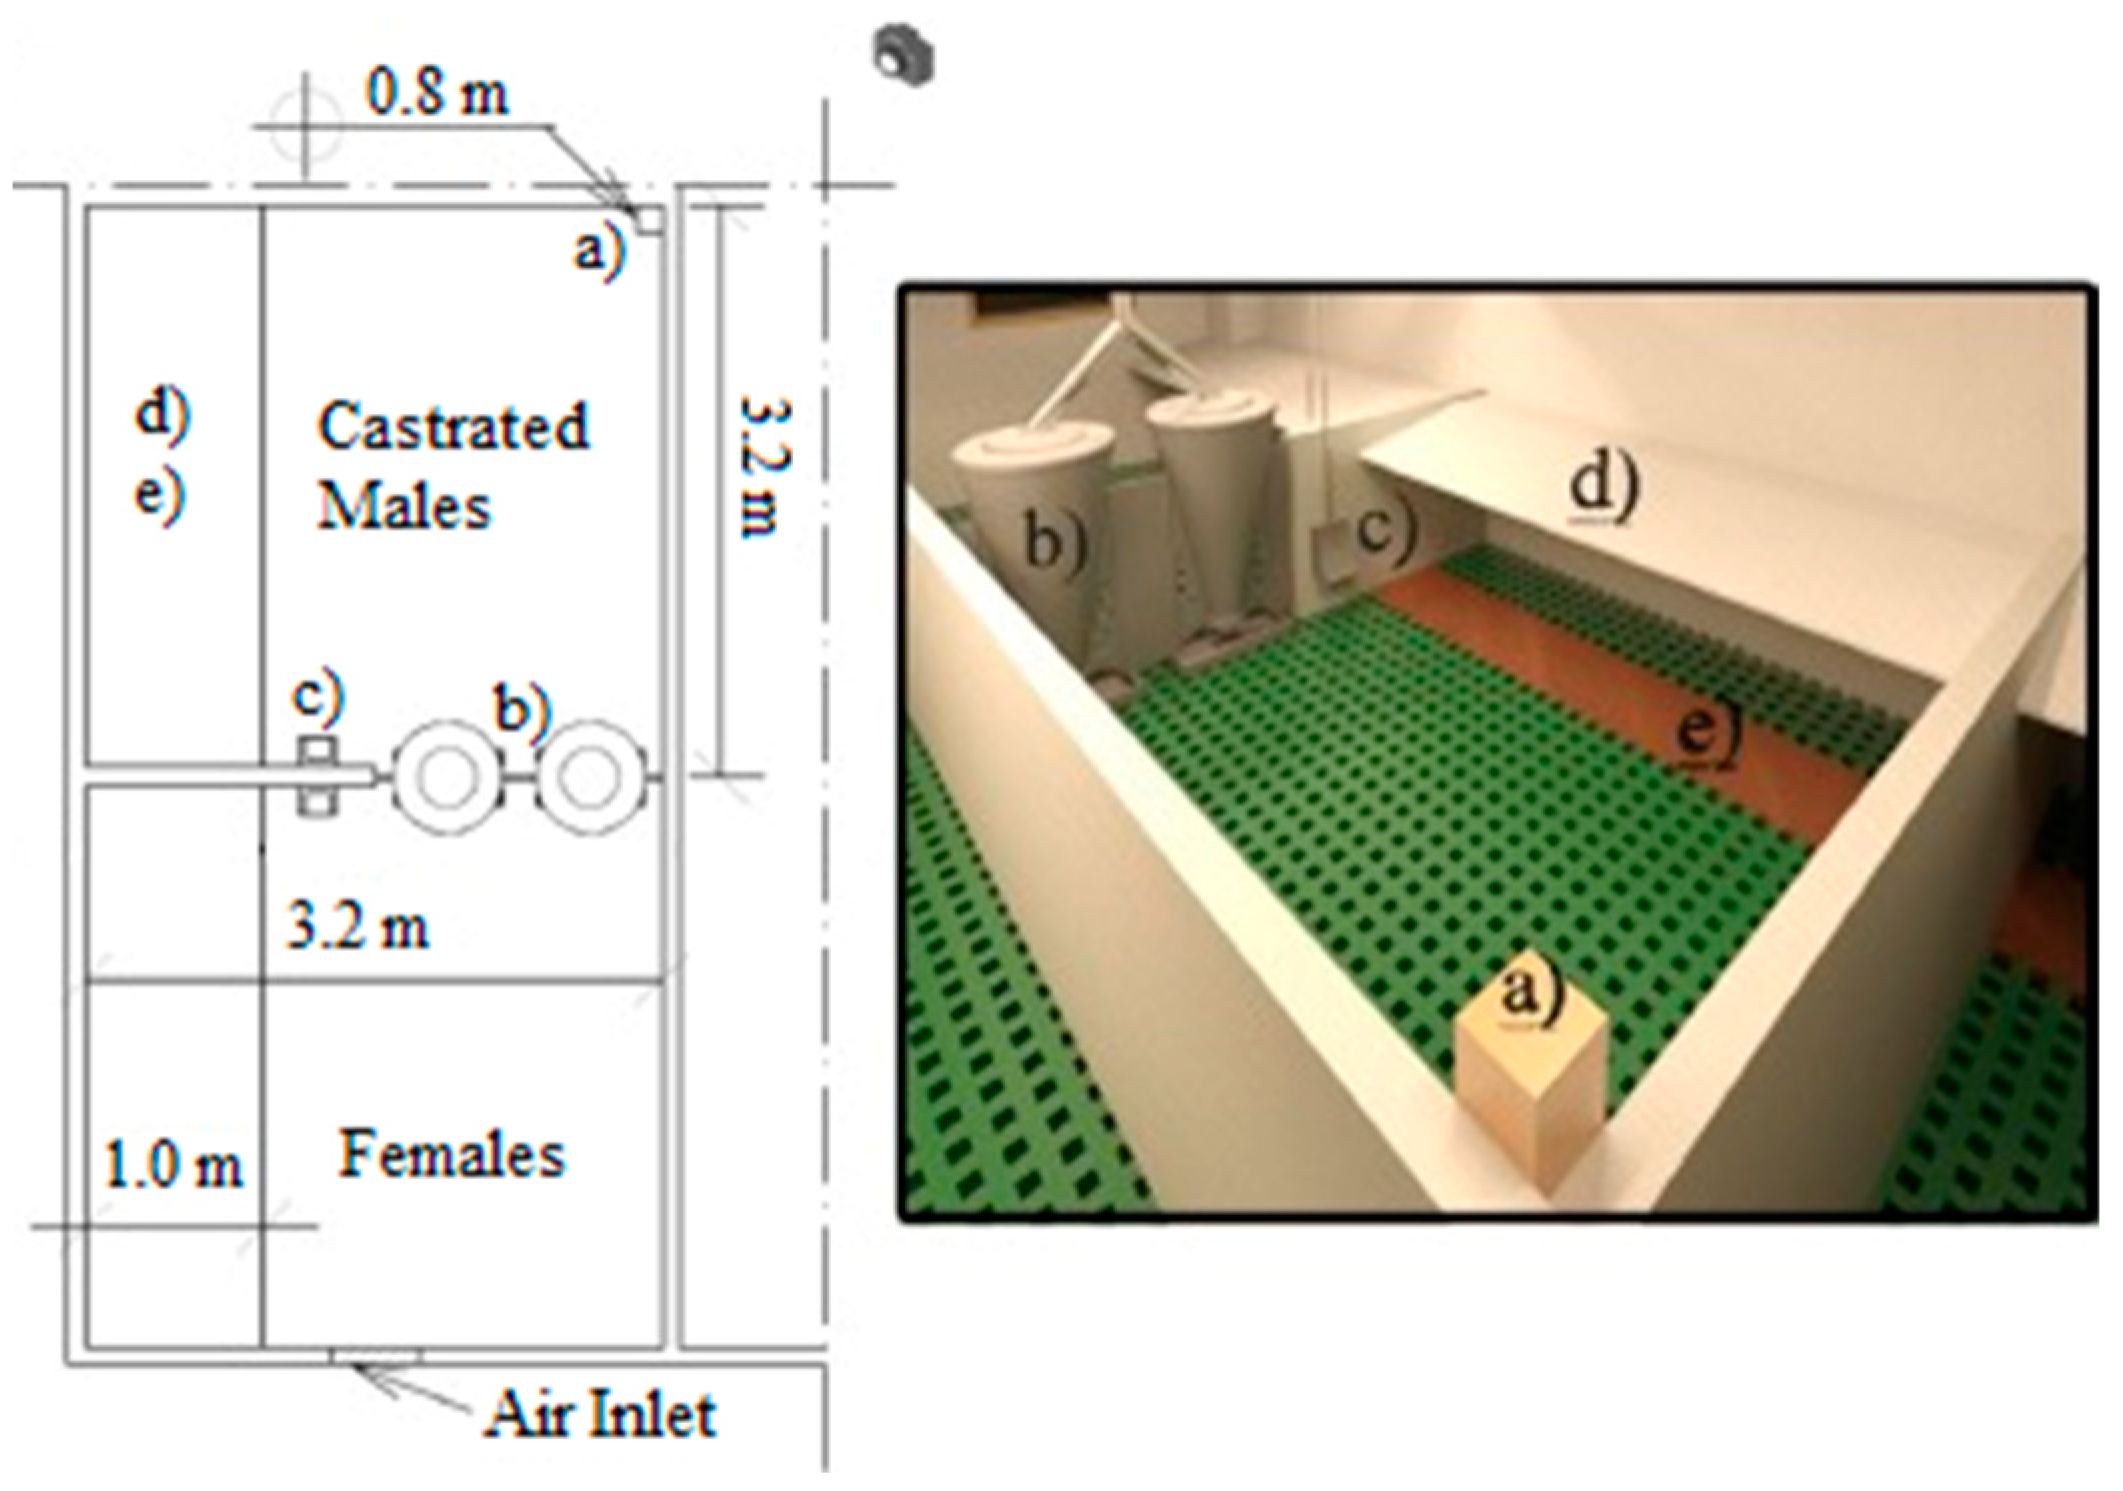
2. Materials and Methods

On a commercial pig farm located in Northwest Spain, two batches of weaned piglets, one of 50 castrated males (CM) and one of 50 females (FM), were housed in two identical adjacent pens during two postweaning breeding cycles. The piglets, which were Large White × Landrace hybrids, were weaned at 21 days of age and grouped according to sex. All the piglets were weighed at 1-week intervals during two breeding cycles (C1 and C2) of 40 and 38 days, respectively, according to the company’s commercial strategy. Cycle 1 (C1) extended from June 9 to July 19, whereas cycle 2 (C2) extended from February 27 to April 6 of the following year.
The pens, which were described in detail by [23], were 3.2 × 3.2 m2 in size and were enclosed with PVC divider panels (Figure 1). The piglets were fed ad-libitum in a double wet hopper composed of two 0.6 m-long feed spaces. The pigs were fed a lacto-initiator diet during the first five days after weaning, a pre-starter diet from day 6 to 20 postweaning and a starter diet from day 21 to the end of the cycle (Table 1), following a gradual transition in diet change. Water was supplied at a nipple drinker placed close to the feeder.
All the piglets in both batches (CM and FM) were weighed weekly from the start to the end of the cycle. Specifically, the piglets were weighed on days 21, 26, 33, 40, 47, 54 and 61 of age in C1, and the piglets were weighed on days 21, 29, 36, 43, 50, 57 and 59 of age in C2. The weighing procedure consisted of introducing small batches of 5 to 10 piglets, depending on their size, into a digital weighing scale for pigs with <+/−0.020% accuracy, model BARRE DI PESATURA MI2000, and recording the weight of each batch. In addition, the following environmental parameters were measured in the animal zone: temperature (TA), relative humidity (HA) and airspeed (AVA). TA and HA were measured using a temperature/HR smart sensor (ONSET S-THB-M002) with a measurement range of −40 °C to 75 °C and accuracies of ±0.2 °C for temperature and ±2.5% for humidity. To measure AVA, a Delta Ohm HD103T.0 hotwire probe with a measurement range of 0–5 m/s and ±0.06 m/s accuracy was used. The 10 min averages of the measured values at 1 s intervals were stored in a HOBO data logger (HOBO-22).
The collected data corresponds to the average weight of the batches of piglets weighed simultaneously on the weighing platform, i.e., the individual weight data are not available. The size of the weighing batches ranged from 10 piglets at week 1 of the cycle to 5 piglets at the last week of the cycle. Accordingly, it would not be reasonable to analyse individual average BWs for n = 50 because BW variability would be underestimated. For this reason, we assumed n was equal to the number of weight measurements for each batch (FM or CM), and the average BW of the batch was assumed to be a single sample, thus reducing the potential problems related to data pseudo replication.
During the breeding cycle, some animals were removed because of health, animal welfare or production-related issues. Specifically, five animals were removed from the CM batch at week 3 of C1 and one at week 4 of C1. Similarly, three animals were removed from the CM batch at week 3 of C2. As per the FM batch, only one animal had to be removed at week 3 of C1. The rest of the piglets reached the end of the cycle in good health and welfare status, and both batches were visually homogeneous. The end of the breeding cycle was established according to commercial requirements, so the piglets ended the stages at 61 and 59 days of age in C1 and C2, respectively.

Statistical Analysis

Given the longitudinal data structure, with repeated measurements on the CM and FM batches throughout each cycle, mixed models provide a good alternative for modelling our data without incurring errors caused by pseudoreplication [24]. To model piglet growth, linear (quadratic and exponential) and nonlinear (Gompertz, logistic, Richards and Von-Bertalanffy) models were used. The group “sex:cycle” (e.g., CM:C2) was introduced as a random effect in all the models. Similarly, the variable “day postweaning” was introduced as a predictor variable in all the models. The method proposed by [18] was used to fit the nonlinear models. The mathematical expressions for the models used in this research follow:
  • Linear models:
  • Quadratic model:
Y i j = β 0 + β 1 t j + β 2 t j 2 + α i + ε i j α i N μ α i , σ α i 2 , ε i j N 0 , σ 2
b.
Exponential model:
Y i j = β 0 β 1 t j + α i + ε i j α i N μ α i , σ α i 2 , ε i j N 0 , σ 2
where Yij is the j-th weight measurement of individual i, β0, β1 and β2 are the fixed effects, tj is the day postweaning on which the j-th measurement was made, αi is the random effect of individual I, and Ɛij is the residual for i in measurement j.
2.
Nonlinear models
  • Gompertz model [25]:
Y i j = L i + A i e e K i t j T i + ε i t , ε i t N 0 , σ 2
b.
Logistic model [26]:
Y i t = L i + A i 1 + e K i t j T i + ε i j , ε i j N 0 , σ 2
c.
Richards model [19]:
Y i t = L i + A i 1 + s i e K i t j T i 1 s i + ε i j , ε i j N 0 , σ 2
d.
Von-Bertalanffy model [27]:
Y i t = L i + A i 1 e K i t j T i 3 + ε i j , ε i j N 0 , σ 2
with each parameter in the nonlinear models varying between individuals as follows:
L i = γ L + r L , i , r L , i N 0 , τ L 2 A i = γ A + r A , i , r A , i N 0 , τ A 2 K i = γ K + r K , i , r K , i N 0 , τ K 2 T i = γ T + r T , i , r T , i N 0 , τ T 2 s i = γ s + r s , i , r s , i N 0 , τ s 2
and where Li is the lower horizontal asymptote for individual i, Ai is the upper horizontal asymptote for individual i, Ki is the rate of approach to the upper asymptote at the point of inflexion for individual i, Ti is the point of inflexion at which Ki reaches its maximum for individual I and si is the curve symmetry parameter for individual i. γL, γA, γK, γT and γs are the average values of parameters L, A, K, T and s, respectively, for the sample.
The correlation between varying parameters was constrained to zero. The performance of the models was assessed using Akaike’s information criterion (AIC), the Bayesian information criterion (BIC), the root mean square error (RMSE), the correlation coefficient and the R2. Based on the results, the most appropriate models were chosen.
Based on the Gompertz curve, the maximum ADG at the point of inflexion (ADGmax = A × K/e) and the evolution of the ADG over time can be predicted using the following expression [28]:
A D G t = A K e K t T e K t T
The effect of sex on piglet growth was tested using three different methods: (1) by incorporating the variable, sex, into the quadratic and the Gompertz models; (2) by incorporating sex as a predictor variable into a quadratic model that used average daily weight gain (ADG) as the dependent variable; and (3) by applying a paired Student’s t-test to weekly weight records.
The statistical analysis of data was performed using the R statistical software and Rstudio environment [29,30]. The “lme4” R package was used for fitting the linear mixed models [31], whereas the “saemix” R package was used for the nonlinear mixed models [32].

3. Results

The average BW per piglet was similar for both batches and cycles (Table 2). The average BW at weaning was 6.86 kg for both sexes, with an average of 6.63 kg for FM and 7.08 kg for CM. By the end of the breeding period, the animals started the fattening phase with an average BW of 19.46 kg for both sexes, with 19.67 kg for the FM and 19.26 kg for the CM. As shown in Figure 2, the average and maximum weights tended to be higher in C2 than in C1. The observed trend was influenced by the effect of grouping weight measurements by week and of conducting weight measurements on different days postweaning in C1 and C2. Similarly, our results revealed a slight trend for heavier average weights in males than in females in both cycles, especially in C1.
Based on the Student’s t-test for paired samples, which was performed every week, significant differences (p < 0.05) were found only between the weight of males and females at weeks 0 and 1 of C2, with CM showing a heavier weight (Table 3). From week 3 of C2 onwards, differences in weight were not significant. Because of the lack of correspondence in the age of piglets each week between both cycles, a comparison of the average weights obtained by sex for each cycle was not deemed appropriate.

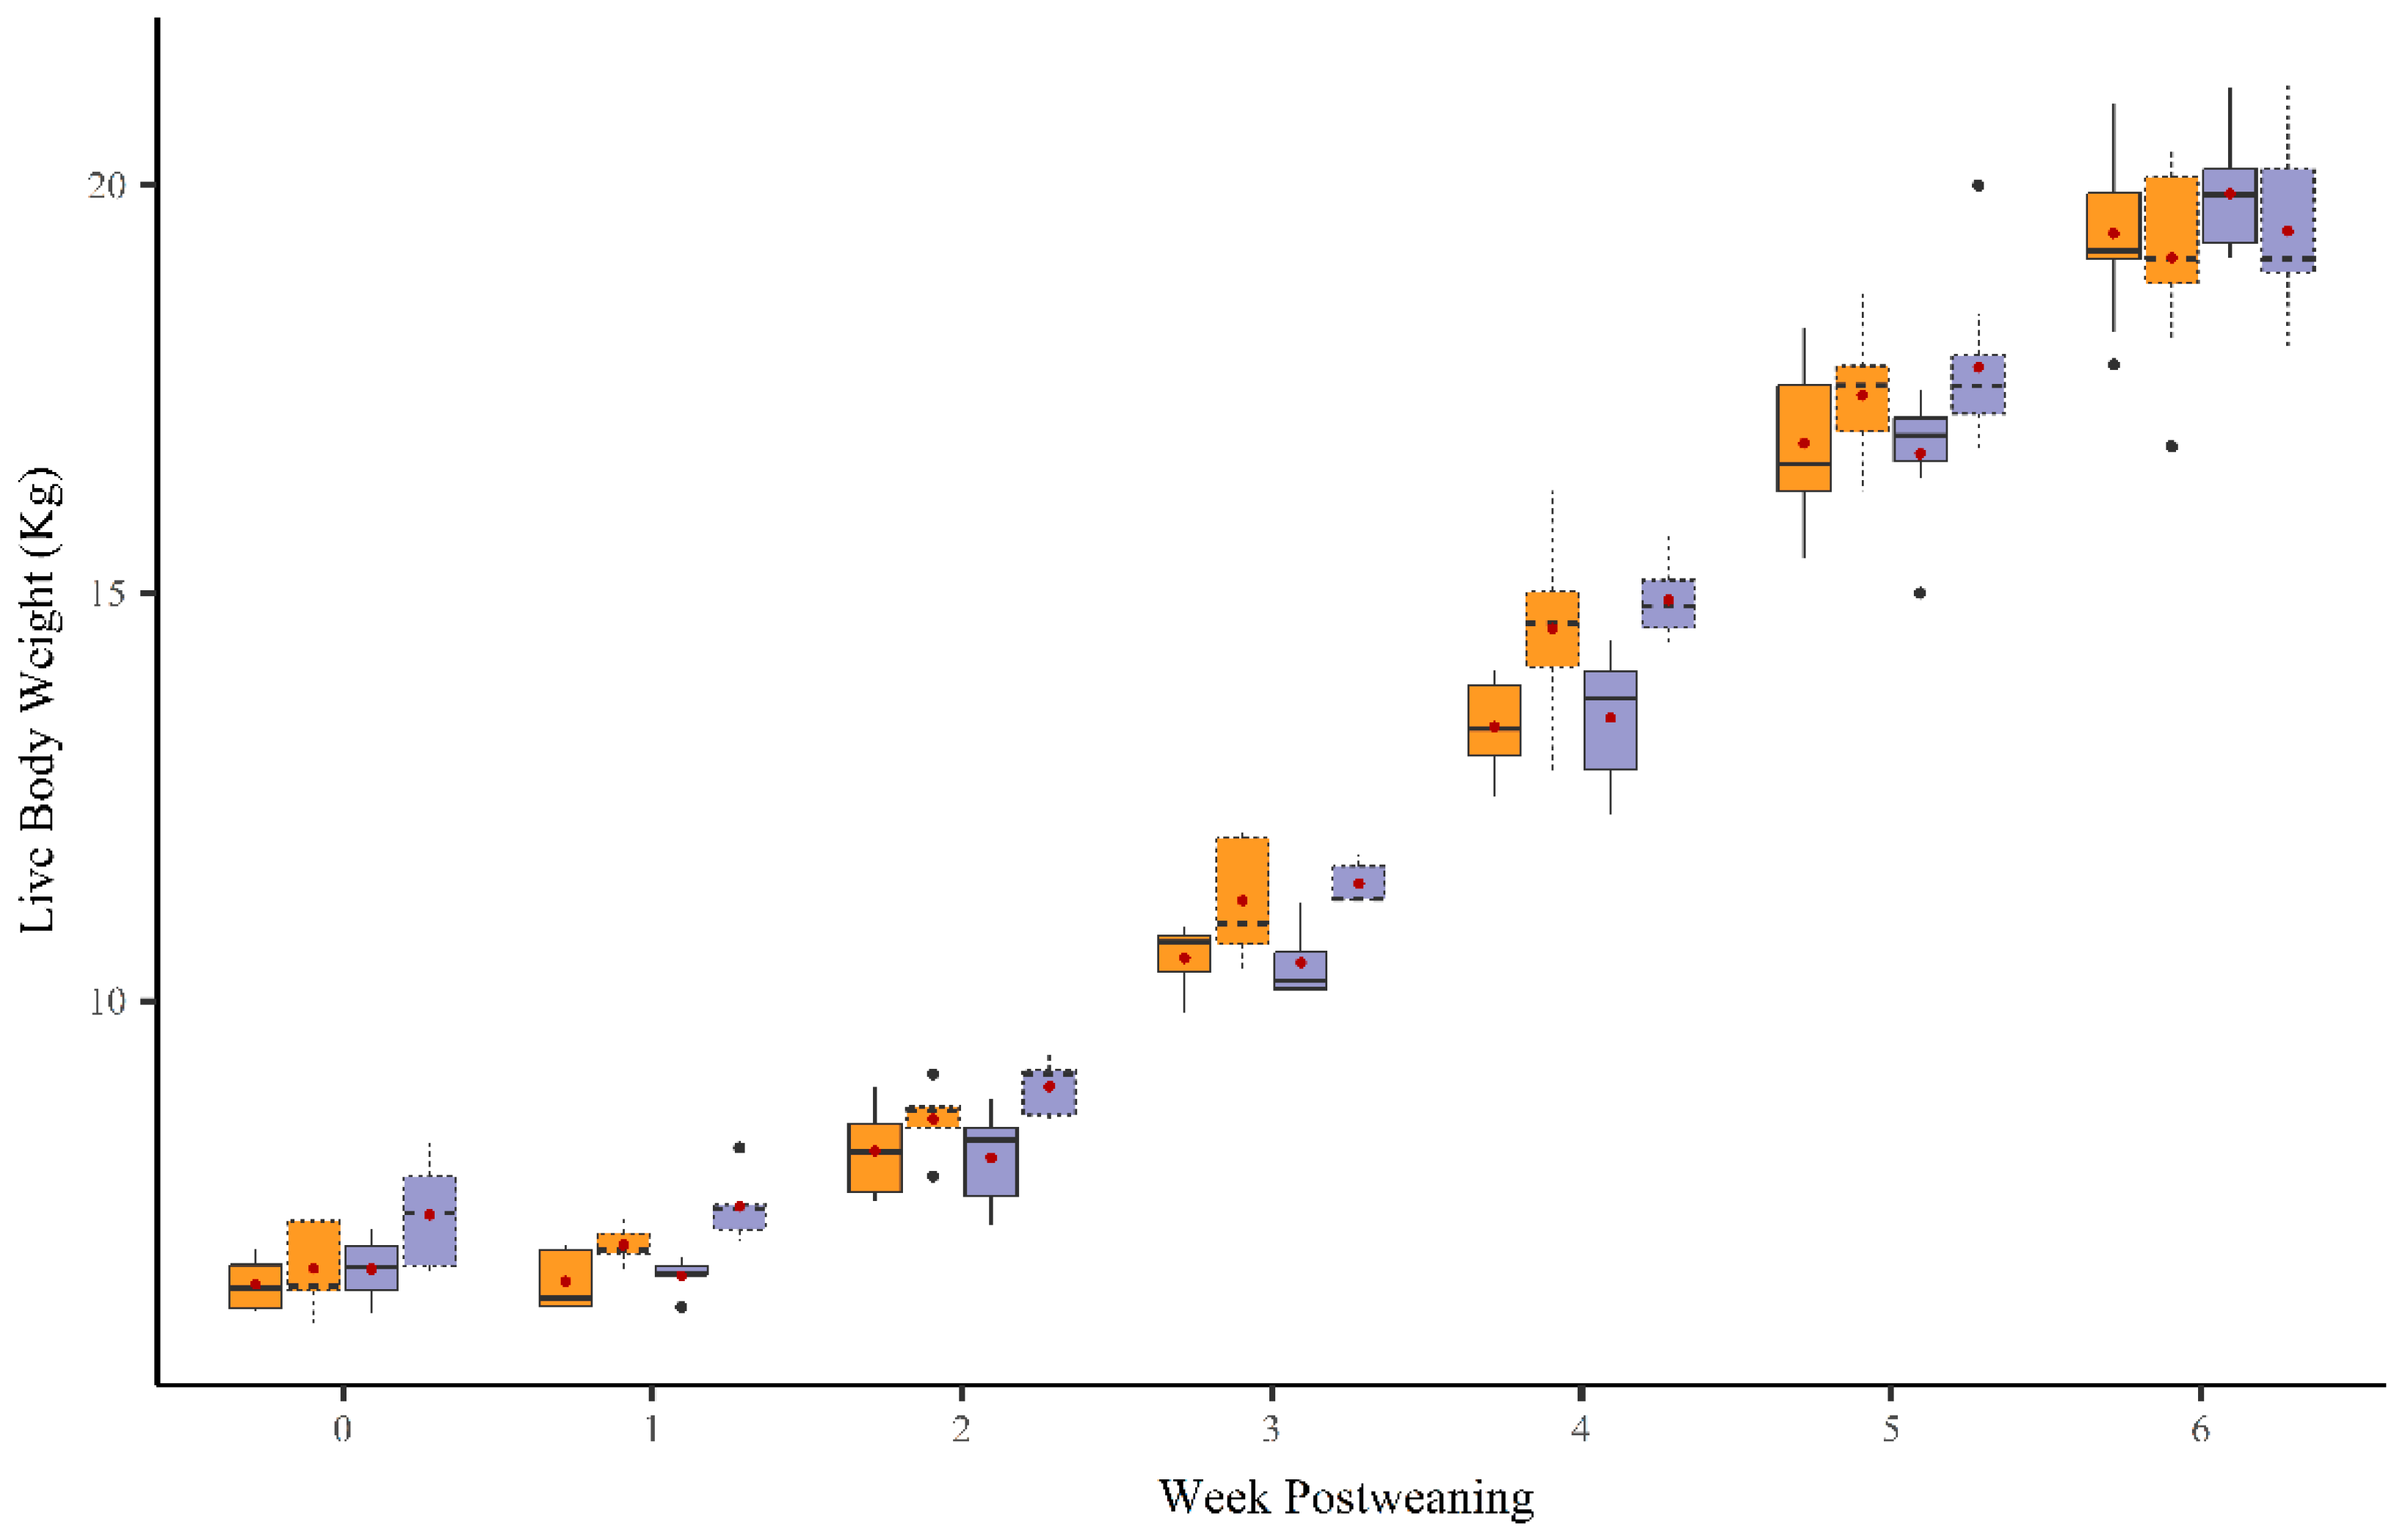
3.1. Mixed Modelling of Growth Performance

In order to model the weaned piglet growth, the weekly average weight data were fitted to linear and nonlinear mixed models (Figure 3). For the linear models, the age of the animals (days postweaning) was the only independent variable selected. Tests were performed for the incorporation of the variable, sex, as a fixed-effect factor in the quadratic linear mixed model and the Gomperzt nonlinear mixed model. In both cases, the improvement in model performance after incorporating this variable and its interactions was not significant (p > 0.05). Based on these results and the results of the Student’s t-tests, it is our conclusion that there are no differences between the growth of males and females. Accordingly, piglet growth was further modelled using a single dataset including both sexes. Table 4 shows the goodness of fit of the models, with the nonlinear models performing better.
Furthermore, the nonlinear growth models used are designed so that their parameters have a biological interpretation (Table 5). The value of the lower asymptote represented by parameter L is interpreted as weight at weaning and is expressed in kg. The upper asymptotic value of growth, determined by the sum of parameters L + A, is also expressed in kg and is interpreted as the maximum weight of the animal, or adult weight. Parameter K (day−1) indicates the daily weight gain in relation to total weight, while the value of parameter T (day) represents the point of inflexion of the curve, except for the Von-Bertalanffy model, in which it is interpreted as age at the lower asymptote.
The analysis of average daily gain showed a total average of 0.324 kg/day, with average values of 0.330 kg/day in C1 and 0.317 kg/day in C2 for CM. For FM, the average gain was 0.322 kg/day in C1 and 0.326 kg/day in C2. The average growth by sex considering both cycles was 0.323 kg/day for CM and 0.324 kg/day for FM. The growth rate was not homogenous during the fattening period and followed the evolution shown in Figure 4.
During week 1 postweaning, piglets do not gain weight, and they even may lose some weight during the first 5 days, as is the case for the CM in C1. From that moment on, ADG starts increasing progressively, with an evolution that is similar to a logarithmic progression. After 30 days postweaning, ADG follows an erratic pattern with a progressive decrease in growth rate in C1 and a sharp decrease in C2 after 36 days postweaning, which is rapidly recovered two days after that, reaching a maximum of 0.844 kg/day in the case of FM (Figure 4).
The growth rate was modelled using a linear mixed model with the variable, cycle:sex, as the random effects variable, and the square of the days postweaning as the fixed effects variable. With this model structure, a singular fit is obtained, which indicates that the model is “overfitted” and that the structure of the random effects is too complex to be supported by the data. Because this is a longitudinal study, with repeated measurements of the individuals, keeping this structure as simple as possible was required on a theoretical level. In addition, incorporating the variable, sex, as a fixed effect in the previous model was not significant. Figure 4 represents the derivative of weight as a function of time for the Gompertz curve fitted to the study dataset.

3.2. Environment Quality

For the environmental parameters recorded, the measurements of HA and TA stayed broadly within the established recommendations (Table 6). AVA increased progressively in C1, with a daily average of 0.13 m/s and maximum peaks of 0.37 m/s at week 5. At week 6, AVA increased to an average of 0.18 m/s on day 39 of the cycle, with a maximum of 0.46 m/s. Despite the operation of the ventilation system, which renewed the air inside the building, the TA reached maximum values of up to 34.3 °C during the last week of C1. In C2, the peak AV was 0.53 m/s on day 32 of the cycle, with a daily average of 0.22 m/s during that week. During C2, it was possible to maintain the maximum TA under 30 °C.
A coincidence in time is observed between the peaks of AVA and TA and the decrease in piglet growth rate. In C1, the rate of growth rate slows down during the penultimate week and decreases during the last week, coinciding with the peaks of AV for C1. Similarly, in C2, the high peaks of AV coincide in time with a strong decline in growth rates during week 5 postweaning.

4. Discussion

At the start of the cycle, the weight of the weaned piglets at 21 days of age (6.86 kg) is within the values reported in the recent literature for pigs of different breeds. For example, Ref. [10] reported a weight of 6.87 kg in Duroc × Landrace × Large White piglets weaned at 21 days of age. The author of [33] reported weights of 6.1 kg in Berkshire piglets weaned at 21 days of age, and Ref. [34] registered 5.75 kg on day 18, which could be extrapolated to day 21 through linear regression, obtaining 6.49 kg. In CM and FM Large White piglets weaned at 21 days, Ref. [35] recorded a weight of 6.8 kg. Logically, weight at weaning is influenced by weaning age, but also by litter size and weight at birth [36]. In fact, weight at birth, weight at 24 h from birth and the amount of colostrum consumed explain up to 42% of the individual variation in BW for piglets weaned at 21 days of age [37].
As per weight at the end of the cycle, on day 34 after weaning, Ref. [10] reported a weight of 15.78 kg in piglets weaned at day 21 of age or 16.90 kg in piglets weaned at 28 days. They also recorded 19.46 kg on day 40 postweaning for piglets weaned at 21 days of age, a similar weight to that found in this work. Furthermore, Ref. [8] estimated, depending on the weight at weaning, weights from 17.00 and 22.00 kg at 42 days postweaning in piglets that were separated from their mothers at 19 and 21 days of age, respectively. Ref. [34] tested the influence of age at weaning on the performance of piglets and found weights ranging from 25.8 to 28.2 kg on day 42 postweaning in animals weaned at 21 days of age. The value described in this work is close to the target weight set by [38] for the postweaning phase, which was estimated at 21.55 kg at 63 days of age.

4.1. Effect of Sex on Growth

Both the t-tests for related samples and the incorporation of the factor, sex, on the mixed and fixed effects models revealed no significant differences between sexes in the growth of weaned piglets from 6 to 20 kg BW, which is in agreement with the results reported by [39], who found that sex had no relevant effects on growth after weaning for Large White × Landrace pigs, except for some interactions between sex and weaning age or weight at weaning. For example, light gilts showed a higher growth rate than light boars during the first week after weaning, but such a difference was not maintained in the case of heavy boars and gilts. However, Ref. [22] did find faster growths in males than in females using linear mixed models and fixed models in piglets between birth and 8 weeks old. Likewise, Ref. [33] analysed the growth of pigs of the breed, Berkshire, between weaning (at an average of 22 days of age) and 73 days of age and reported greater weights and ADG in males and castrated males than in females. These differences were retained throughout the whole production cycle, up to 152 days of age, except for the lactation phase.
As described by [15] in crossbred Iberian × Duroc piglets, while the effect of the weight at birth is observed during the whole production cycle, the effect of sex on growth increases with age. Similarly, Ref. [40] found significant differences in the effect of weight at birth on weight at days 7, 14, 21 and 28 for piglets, but sex was not found to have a significant effect on ADG during 4 weeks of lactation.
During the fattening phase, Ref. [41] did not find significant differences between sexes in pigs from 39 to 88 days of age (between 7 and 26 kg BW) but found significantly higher ADG and final weight in boars than in females during the finishing phase, between 89 and 123 days of age. The authors of [42] used mixed models to obtain significant differences in the parameters of growth between barrows, boars and gilts between 61 and 102 days of age. The boars reached a higher mature live weight (parameter A) but with slower growth (parameter K) than the gilts or barrows, but the barrows reached a higher mature live weight than the gilts. Even so, Ref. [17] did not find differences in ADG between barrows, boars, and gilts during the phases of growing (from 20 to 48 kg) and finishing (from 49 to 96 kg).
It appears that the effect of sex on growth has a clear interaction with age, but the age or weight at which this point of inflexion occurs is yet to be determined. The effects of the interactions between sex and weight at birth/weaning or feeding management are also important in determining growth rates in the postweaning phase.

4.2. Use of Mixed Models to Model Piglet Growth in the Postweaning Phase

During the last few years, mixed models have been widely used to model the growth of domestic animals [43,44,45]. Although there is little difference between the fit of fixed effects models and mixed models, the predictive capacity of mixed models for new observations is better [22,42]. It was also proven that a mixed model with the Gompertz growth curve is more suitable than fixed effect models to explain weight gain in pigs [46], which is in agreement with the results reported in this study. Furthermore, mixed models consider not only the average of the population but also the individual deviations from that average. For this reason, mixed models with the Gompertz growth curve consider more variance as compared to fixed effects models.
The growth curves tested in this study were already broadly used to describe the growth of several livestock species, both with mixed and fixed effects models [22,47]. The nonlinear mixed growth models by Von-Bertalanffy, Richards and Gompertz were the models better fitted to the data. The performance of all these models was very similar and improved the performance of linear mixed models during the postweaning phase. It is possible to find studies in the literature that show that some nonlinear growth curves perform better than others for some specific datasets. For example, ref. [42] found that the mixed model with the Gompertz function was the best for describing and predicting future values of BW for pigs from 88 days of age to slaughter. In contrast, ref. [22] compared the Gompertz, logistic and Von-Bertalanffy functions using mixed models and obtained a better fit of BW data both for male and female pigs between 8 days and 8 weeks of age, or more with the logistic curve. Ref. [48] obtained a better fitting curve using the Lopez function in pigs of 14 to 100 days of age as compared to the mixed Gompertz, logistic and Bridges models.
The analysis of the adjusted parameters shown in Table 5 reveals that every curve was fitted to values between 6.48 and 6.86 kg at the lower asymptote, which represents weight at weaning. Moreover, the maximum rate of growth determined at the point of inflexion of the Gompertz and Richards curves was reached on day 27 after weaning, with an ADG of 0.508 kg/day at that point, according to the Gompertz curve. Conversely, the value of parameter s (symmetry) of the Richards growth model controls the asymmetry of the slope of the curve before and after the inflexion point [49]. The value estimated in our study suggests that more than half of the total piglet growth occurs after the point of inflexion (on day 27.35). This confirms that the Gompertz model performs better than the logistic model. Even though the four nonlinear models tested were very similar in terms of performance, ideally the performance of these curves should be analysed on a test dataset that has not been used for the training of the models. The literature review conducted did not point to the availability of nonlinear models that are specific to the productive phase between 6 and 20 kg BW.
It should be taken into account that one of the main fitting parameters in nonlinear growth curves is asymptotic weight, i.e., what is interpreted as the BW of the animal at an adult age. In this case, the registered BWs reach only up to 60 days of age, which is far from the asymptotic weight. Therefore, the models estimate that the upper asymptote of weight (parameters A + L) is found between 21.20 kg in the logistic curve and 30.17 kg in the Von-Bertalanffy model. This incorrect assumption can alter the goodness of fit of the models during the last days of the cycle. When approaching the upper asymptote, the growth rate (ADG) of nonlinear models starts declining continuously. This is the case for the Gompertz curve (Figure 3), which finally reaches a flat growth. This evolution does not describe the real evolution of growth, because the animals will continue to grow beyond the theoretical asymptotic weight, although a decrease in ADG is to be expected during the last days of the cycle, due to the conditions described in the next section.

4.3. Characterization of Growth Rates

The average ADG for piglets between 21 and 61 days old in the two recorded cycles (0.324 kg/day) is within the range reported by [50] for piglets between 28 and 63 days old, which oscillated between 0.231 and 0.488 kg/day. Similarly, Ref. [51] obtained an ADG of 0.401 kg/day in piglets between 29 and 70 days of age. The growth rate is determined by a large number of factors, among which are weaning age [12,51], BW at weaning [52], genetics, facilities [53,54] or management [50].
During the first week postweaning, a flat growth rate was reached. The growth rate was even negative in the case of the CM batch during C1. The decline in growth rate is more pronounced for data collected on day 5 postweaning than for data collected on day 8 postweaning, which is usual, especially for early weaning at 21 days of age [10]. Weaning causes many changes, mainly in diet and environment, which leads to major stress for the piglets. Stress brings about a decrease in feed consumption and ADG and an increased incidence of diarrhoea [52].
After the first week postweaning, ADG gradually accelerated until week 4 in the cycle. From week two onwards, there was not a clear trend with regard to the evolution of growth. The influence of the environment and the facilities on the animals is the most plausible explanation for such an evolution. Although HA and TA were always maintained within the thermoneutral zone for animals at this age [55], a high AVA was recorded, which exceeded the 0.15 m/s of maximum airspeed recommended for this age [56]. These air currents could have affected the growth of the animals. In general terms, Ref. [57] described losses in ADG with airspeeds of 0.11–0.40 m/s, especially in younger animals [58]. Therefore, both an excess of and a deficiency in the air exchange rate could have a great impact on the growth performance of the animals.
Moreover, despite the compliance with the requirement of 0.20 m2/piglet up to 20 kg included in [7], the free space per animal available and the limited linear meters of trough per animal constrained the growth of piglets [54] during the last weeks of the productive period. The piglets experienced an increase in density in the building from 33.5 kg/m2 at the start of the cycle to an average of 90.0 kg/m2 at the end of the cycle. Ref. [59] described a decrease in ADG of around 36 g/day for piglets aged 15 to 71 days and housed at a density of 0.21 m2/animal, as compared to piglets housed at a density of 0.63 m2/animal. The equation used to determine the space available was the allometric equation, A = C × BW0.667, where A is the space available, and C is the coefficient of the space available. Using this equation, an average value of 0.0287 was obtained at the end of the cycles. This value is below the threshold of 0.0335 established by [60] for piglets from 6 to 20 kg, under which a decrease in growth rates occurs. In the facilities used in this study, the space available around the trough was 2.4 cm/pig, whereas Ref. [61] obtained higher ADG with 4.3 cm/pig, as compared to 3.2, 2.6 and 2.1 cm/pig for piglets weaned at 21 days of age.

5. Conclusions

In conclusion, nonlinear mixed models allow for the consideration of the structure of the longitudinal data used in growth studies and perform better than linear models during the postweaning phase of piglets. The Gompertz and Von-Bertalanffy curves showed the best fits and provided a greater amount of biological information for their parameters. In relation to growth characterization, no significant differences between sexes were found for the growth of piglets from 6 to 20 kg BW. Also, the growth rate was affected by the weaning effect, which led even to negative growth during the first week and the last weeks of the cycle because of the influence of air currents and the limitations in the space available (both in the room and around the trough). More production cycles should be analysed to clarify the evolution of growth during the last weeks of the breeding period.

Author Contributions

Conceptualization, M.R.R. and M.D.F.; methodology, M.R.R., M.D.F. and R.B.; software, R.B. and T.A.; validation, M.D.F. and M.R.R.; formal analysis, R.B. and T.A.; investigation, R.B. and M.D.F.; resources, M.R.R., M.D.F. and R.B.; data curation, R.B.; writing—original draft preparation, R.B. and T.A.; writing—review and editing, M.R.R. and M.D.F.; supervision, M.R.R.; project administration, M.D.F.; funding acquisition, M.D.F. All authors have read and agreed to the published version of the manuscript.

Funding

The authors are grateful to the regional government of Xunta de Galicia for funding this research through the “Programme of Consolidation and Structuring of Competitive Research Units” (ED431B 2021/08).

Institutional Review Board Statement

Not applicable.

Data Availability Statement

The data that support the findings of this study are available on request from the corresponding author.

Conflicts of Interest

The authors declare no conflicts of interest.

References

  1. Boe, K. The process of weaning in pigs: When the sow decides. Appl. Anim. Behav. Sci. 1991, 30, 47–59. [Google Scholar] [CrossRef]
  2. Jensen, P. Observations on the maternal behaviour of free-ranging domestic pigs. Appl. Anim. Behav. Sci. 1986, 16, 131–142. [Google Scholar] [CrossRef]
  3. Newberry, R.C.; Wood-Gush, D.G.M.; Hall, J.W. Playful behaviour of piglets. Behav. Process. 1988, 17, 205–216. [Google Scholar] [CrossRef] [PubMed]
  4. Stolba, A.; Wood-Gush, D.G.M. The behaviour of pigs in a semi-natural environment. Anim. Sci. 1989, 48, 419–425. [Google Scholar] [CrossRef]
  5. Campbell, J.M.; Crenshaw, J.D.; Polo, J. The biological stress of early weaned piglets. J. Anim. Sci. Biotechnol. 2013, 4, 19. [Google Scholar] [CrossRef] [PubMed]
  6. Knox, R.V.; Rodriguez Zas, S.L.; Sloter, N.L.; McNamara, K.A.; Gall, T.J.; Levis, D.G.; Safranski, T.J.; Singleton, W.L. An Analysis of Survey Data by Size of the Breeding Herd for the Reproductive Management Practices of North American Sow Farms. J. Anim. Sci. 2013, 91, 433–445. [Google Scholar] [CrossRef] [PubMed]
  7. European Council Directive 2008/120/EC of 18 December 2008, Laying down Minimum Standards for the Protection of Pigs. Available online: http://data.europa.eu/eli/dir/2008/120/oj (accessed on 26 December 2023).
  8. Faccin, J.E.G.; Laskoski, F.; Cemin, H.S.; Mellagi, A.P.G.; Bernardi, M.L.; Dvm, R.R.U.; Bortolozzo, F.P.; Tokach, M.D. Evaluating the impact of weaning weight and growth rate during the first week post weaning on overall nursery performance. J. Swine Health Prod. 2020, 28, 70–78. [Google Scholar] [CrossRef] [PubMed]
  9. Moeser, A.J.; Pohl, C.S.; Rajput, M. Weaning stress and gastrointestinal barrier development: Implications for lifelong gut health in pigs. Anim. Nutr. 2017, 3, 313–321. [Google Scholar] [CrossRef]
  10. Ming, D.; Wang, W.; Huang, C.; Wang, Z.; Shi, C.; Ding, J.; Liu, H.; Wang, F. Effects of Weaning Age at 21 and 28 Days on Growth Performance, Intestinal Morphology and Redox Status in Piglets. Animals 2021, 11, 2169. [Google Scholar] [CrossRef]
  11. Leliveld, L.M.C.; Riemensperger, A.V.; Gardiner, G.E.; O’Doherty, J.V.; Lynch, P.B.; Lawlor, P.G. Effect of Weaning Age and Postweaning Feeding Programme on the Growth Performance of Pigs to 10 Weeks of Age. Livest. Sci. 2013, 157, 225–233. [Google Scholar] [CrossRef]
  12. Moeser, A.J.; Ryan, K.A.; Nighot, P.K.; Blikslager, A.T. Gastrointestinal Dysfunction Induced by Early Weaning Is Attenuated by Delayed Weaning and Mast Cell Blockade in Pigs. Am. J. Physiol.-Gastrointest. Liver Physiol. 2007, 293, G413–G421. [Google Scholar] [CrossRef] [PubMed]
  13. Marquer, P. Pig farming in the EU, a changing sector. In Eurostat. Statistics in Focus; Agriculture and Fisheries; European Commision: Brussels, Belgium, 2010; pp. 1–11. [Google Scholar]
  14. Elbert, K.; Matthews, N.; Wassmuth, R.; Tetens, J. Effects of Sire Line, Birth Weight and Sex on Growth Performance and Carcass Traits of Crossbred Pigs under Standardized Environmental Conditions. Arch. Anim. Breed. 2020, 63, 367–376. [Google Scholar] [CrossRef] [PubMed]
  15. Vázquez-Gómez, M.; García-Contreras, C.; Astiz, S.; Torres-Rovira, L.; Fernández-Moya, E.; Olivares, Á.; Daza, A.; Óvilo, C.; González-Bulnes, A.; Isabel, B. Piglet Birthweight and Sex Affect Growth Performance and Fatty Acid Composition in Fatty Pigs. Anim. Prod. Sci. 2020, 60, 573. [Google Scholar] [CrossRef]
  16. Cassar, G.; King, W.A.; King, J.C. Influence of sex on early growth of pig conceptuses. Reproduction 1994, 101, 317–320. [Google Scholar] [CrossRef] [PubMed]
  17. Sheikh, G.G.; Baghel, R.P.S.; Nayak, S.; Ganie, A.A. Effect of sex on growth performance, nutrient utilization and carcass characteristics in croos bred pigs. Indian J. Anim. Res. 2017, 51, 175–178. [Google Scholar]
  18. Boedeker, P. Nonlinear mixed-effects growth models: A tutorial using “saemix” in R. Methodology 2021, 17, 250–270. [Google Scholar] [CrossRef]
  19. Richards, F.J. A flexible growth function for empirical use. J. Exp. Bot. 1959, 10, 290–301. [Google Scholar] [CrossRef]
  20. Janoschek, A. Das Reaktionskinetische Grundgesetz Und Seine Beziehungen Zum Wachstums-Und Ertragsgesetz. Stat. Vierteljahresschr. 1957, 10, 25–37. [Google Scholar]
  21. Whittemore, C.T.; Tullis, J.B.; Emmans, G.C. Protein growth in Pigs. Anim. Prod. 1988, 46, 437–445. [Google Scholar] [CrossRef]
  22. Das, P.; Paul, A.K.; Paul, R.K. Evaluation of Alternative Nonlinear Mixed Effects Models for Estimating Pig Growth Parameters. Indian J. Anim. Sci. 2017, 87, 219–226. [Google Scholar] [CrossRef]
  23. Besteiro, R.; Arango, T.; Rodríguez, M.R.; Fernández, M.D.; Velo, R. Estimation of Patterns in Weaned Piglets’ Activity Using Spectral Analysis. Biosyst. Eng. 2018, 173, 85–92. [Google Scholar] [CrossRef]
  24. Arnqvist, G. Mixed models offer no freedom from degrees of freedom. Trends Ecol. Evol. 2020, 35, 329–335. [Google Scholar] [CrossRef] [PubMed]
  25. Winsor, C.P. The Gompertz curve as a growth curve. Proc. Natl. Acad. Sci. USA 1932, 18, 1–8. [Google Scholar] [CrossRef] [PubMed]
  26. Robertson, T.B. The Chemical Basis of Growth and Senescence; Monograpgs on Experimental Biology; J.B. Lippincott Company: London, UK, 1923. [Google Scholar]
  27. von Bertalanffy, L. Quantitative laws in metabolism and growth. Q. Rev. Biol. 1957, 32, 217–231. [Google Scholar] [CrossRef] [PubMed]
  28. Fialho, F.B. Interpretação da curva de crescimento de Gompertz. Comun. Técnico 1999, 237, 1–4. [Google Scholar]
  29. R Core Team. R: A Language and Environment for Statistical Computing; R Foundation for Statistical Computing: Vienna, Austria, 2021. [Google Scholar]
  30. R Studio Team. RStudio: Integrated Development for R; RStudio, PBC: Boston, MA, USA, 2021. [Google Scholar]
  31. Bates, D.; Maechler, M.; Bolker, B.; Walker, S. Fitting linear mixed-effects models using lme4. J. Stat. Softw. 2015, 67, 1–48. [Google Scholar] [CrossRef]
  32. Comets, E.; Lavenu, A.; Lavielle, M. Parameter Estimation in Nonlinear Mixed Effect Models Using Saemix, an R Implementation of the SAEM algorithm. J. Stat. Softw. 2017, 80, 1–41. [Google Scholar] [CrossRef]
  33. Do, C.H. Estimation of Weaning Age Effects on Growth Performance in Berkshire pigs. Asian-Australas. J. Anim. Sci. 2011, 25, 151–162. [Google Scholar] [CrossRef]
  34. Main, R.G.; Dritz, S.S.; Tokach, M.D.; Goodband, R.D.; Nelssen, J.L. Increasing Weaning Age Improves Pig Performance in a Multisite Production System1. J. Anim. Sci. 2004, 82, 1499–1507. [Google Scholar] [CrossRef]
  35. Colson, V.; Orgeur, P.; Foury, A.; Mormède, P. Consequences of weaning piglets at 21 and 28 days on growth, behaviour and hormonal responses. Appl. Anim. Behav. Sci. 2006, 98, 70–88. [Google Scholar] [CrossRef]
  36. Milligan, B.N.; Fraser, D.; Kramer, D.L. Within-Litter Birth Weight Variation in the Domestic Pig and Its Relation to Pre-Weaning Survival, Weight Gain, and Variation in Weaning Weights. Livest. Prod. Sci. 2002, 76, 181–191. [Google Scholar] [CrossRef]
  37. Wiegert, J.G.; Garrison, C.; Knauer, M.T. Characterization of Birth Weight and Colostrum Intake on Piglet Survival and Piglet Quality. J. Anim. Sci. 2017, 85, 32. [Google Scholar] [CrossRef]
  38. Craig, B.A.; Schinckel, A.P. Nonlinear mixed effects model for swine growth. Prof. Anim. Sci. 2001, 17, 256–260. [Google Scholar] [CrossRef]
  39. Dunshea, F.R.; Kerton, D.K.; Cranwell, P.D.; Campbell, R.G.; Mullan, B.P.; King, R.H.; Power, G.N.; Pluske, J.R. Lifetime and Post-Weaning Determinants of Performance Indices of Pigs. Aust. J. Agric. Res. 2003, 54, 363. [Google Scholar] [CrossRef]
  40. Škorjanc, D.; Brus, M.; Čandek Potokar, M. Effect of birth weight and sex on pre-weaning growth rate of piglets. Arch. Anim. Breed. 2007, 50, 476–486. [Google Scholar] [CrossRef]
  41. Collins, C.L.; Pluske, J.R.; Morrison, R.S.; McDonald, T.N.; Smits, R.J.; Henman, D.J.; Stensland, I.; Dunshea, F.R. Post-Weaning and Whole-of-Life Performance of Pigs Is Determined by Live Weight at Weaning and the Complexity of the Diet Fed after Weaning. Anim. Nutr. 2017, 3, 372–379. [Google Scholar] [CrossRef] [PubMed]
  42. Coyne, J.M.; Berry, D.P.; Mäntysaari, E.A.; Juga, J.; McHugh, N. Comparison of Fixed Effects and Mixed Model Growth Functions in Modelling and Predicting Live Weight in Pigs. Livest. Sci. 2015, 177, 8–14. [Google Scholar] [CrossRef]
  43. Araujo Neto, F.R.; Oliveira, D.P.; Aspilcueta-Borquis, R.R.; Vieira, D.A.; Guimarães, K.C.; Oliveira, H.N.; Tonhati, H. Selection of Nonlinear Mixed Models for Growth Curves of Dairy Buffaloes (Bubalus bubalis). J. Agric. Sci. 2020, 158, 218–224. [Google Scholar] [CrossRef]
  44. Júnior, R.N.C.C.; de Araújo, C.V.; da Silva, W.C.; de Araújo, S.I.; Lôbo, R.B.; Nakabashi, L.R.M.; de Castro, L.M.; Menezes, F.L.; Maciel e Silva, A.G.; Silva, L.K.X.; et al. Mixed Models in Nonlinear Regression for Description of the Growth of Nelore Cattle. Animals 2022, 13, 101. [Google Scholar] [CrossRef]
  45. Santos, H.B.; Vieira, D.A.; Souza, L.P.; Santos, A.L.; Santos, F.R.; Araujo Neto, F.R. Application of Non-Linear Mixed Models for Modelling the Quail Growth Curve for Meat and Laying. J. Agric. Sci. 2018, 156, 1216–1221. [Google Scholar] [CrossRef]
  46. de Barboza, R.C.O.; de Silva, F.L.; Hongyu, K. Cluster Analysis of the Estimates from Growth Curves. Biodiversity 2018, 17, 39–47. [Google Scholar]
  47. Lambe, N.R.; Navajas, E.A.; Simm, G.; Bünger, L. A Genetic Investigation of Various Growth Models to Describe Growth of Lambs of Two Contrasting Breeds. J. Anim. Sci. 2006, 84, 2642–2654. [Google Scholar] [CrossRef] [PubMed]
  48. Strathe, A.B.; Danfær, A.; Sørensen, H.; Kebreab, E. A Multilevel Nonlinear Mixed-Effects Approach to Model Growth in Pigs. J. Anim. Sci. 2010, 88, 638–649. [Google Scholar] [CrossRef] [PubMed]
  49. Brisbin, I.L.; Collins, C.T.; White, G.C.; McCallum, D.A. A New Paradigm for the Analysis and Interpretation of Growth Data: The Shape of Things to Come. Auk 1987, 104, 552–554. [Google Scholar] [CrossRef]
  50. Nielsen, C.L.; Krogh, M.A.; Sørensen, J.T.; Kongsted, H. A Field Trial on the Effect of Cross-Fostering and Weaning Age on Daily Gain and Disease Resilience in Weaned Pigs. Prev. Vet. Med. 2022, 208, 105762. [Google Scholar] [CrossRef] [PubMed]
  51. Dang, D.X.; Li, C.J.; Li, S.H.; Fan, X.Y.; Xu, W.; Cui, Y.; Li, D. Ultra-Early Weaning Alters Growth Performance, Hematology Parameters, and Fecal Microbiota in Piglets with Same Genetic Background. Front. Microbiol. 2022, 13, 990905. [Google Scholar] [CrossRef] [PubMed]
  52. Winters, J.F.M.; Foldager, L.; Pedersen, L.J. Postweaning Growth and Feeding Behaviour in Pigs: Effect of Heavier Hybrid and Weaning Intact Litters in Farrowing Pens for Loose-Housed Sows. Animal 2023, 17, 100688. [Google Scholar] [CrossRef] [PubMed]
  53. Archer, C.; Garcia, A.; Henderson, M.; McGlone, J.J. Olfactory Enrichment Using a Maternal Pheromone Improved Post-Weaning Pig Performance and Behavior. Front. Vet. Sci. 2022, 9, 965370. [Google Scholar] [CrossRef]
  54. DeDecker, J.M.; Ellis, M.; Wolter, B.F.; Corrigan, B.P.; Curtis, S.E.; Hollis, G.R. Effect of Stocking Rate on Pig Performance in a Wean-to-Finish Production System. Can. J. Anim. Sci. 2005, 85, 1–5. [Google Scholar] [CrossRef]
  55. Le Dividich, J.; Herpin, P. Effects of Climatic Conditions on the Performance, Metabolism and Health Status of Weaned Piglets: A review. Livest. Prod. Sci. 1994, 38, 79–90. [Google Scholar] [CrossRef]
  56. Forcada, F.; Babot, D.; Vidal, A.; Buxadé, C. Ganado Porcino. Diseño de Alojamientos e Instalaciones, 1st ed.; Servet: Zaragoza, Spain, 2009. [Google Scholar]
  57. Riskowski, G.L. The Effect of Air Velocity and Temperature on Growth Performance and Stress Indicators of Weanling Pigs. Ph.D. Thesis, Iowa State University, Ames, IA, USA, 1986. [Google Scholar]
  58. Sällvik, K.; Walberg, K. The Effects of Air Velocity and Temperature on the Behaviour and Growth of Pigs. J. Agric. Eng. Res. 1984, 30, 305–312. [Google Scholar] [CrossRef]
  59. Wolter, B.F.; Ellis, M.; Corrigan, B.P.; DeDecker, J.M.; Curtis, S.E.; Parr, E.N.; Webel, D.M. Impact of Early Postweaning Growth Rate as Affected by Diet Complexity and Space Allocation on Subsequent Growth Performance of Pigsin a Wean-to-Finish Production System. J. Anim. Sci. 2003, 81, 353–359. [Google Scholar] [CrossRef] [PubMed]
  60. Gonyou, H.W.; Brumm, M.C.; Bush, E.; Deen, J.; Edwards, S.A.; Fangman, T.; McGlone, J.J.; Meunier-Salaun, M.; Morrison, R.B.; Spoolder, H.; et al. Application of Broken-Line Analysis to Assess Floor Space Requirements of Nursery and Grower-Finisher Pigs Expressed on an Allometric Basis. J. Anim. Sci. 2006, 84, 229–235. [Google Scholar] [CrossRef] [PubMed]
  61. Laskoski, F.; Faccin, J.; Vier, C.; Goncalves, M.; Orlando, U.; Kummer, R.; Mellagi, A.; Bernardi, M.; Wentz, I.; Bortolozzo, F. Effects of Pigs per Feeder Hole and Group Size on Feed Intake Onset, Growth Performance, and Ear and Tail Lesions in Nursery Pigs with Consistent Space Allowance. J. Swine Health Prod. 2019, 27, 12–18. [Google Scholar] [CrossRef]
Figure 1. General plan view of the room and detail of the pen where the animals were raised. (a) Temperature, humidity and air velocity sensors, (b) feeder, (c) drinker, (d) cover, (e) heating plate.
Agriculture 14 00079 g001
Figure 2. Boxplot of piglet weight for castrated male () and female () pigs during breeding cycles 1 ( ) and 2 ( ). Mean (), median (), outlier ().
Agriculture 14 00079 g002
Figure 3. Growth curve for piglets in the postweaning phase. Nonlinear mixed model, Von-Bertalanffy (──) and quadratic mixed model (- - - -). Castrated male () and female () average weight in cycle 1 () and 2 ().
Agriculture 14 00079 g003
Figure 4. Average daily gain of castrated male () and female () during cycles 1 () and 2 (). Gompertz mixed model (──) and quadratic mixed model (- - - -).
Agriculture 14 00079 g004
Table 1. Composition of the postweaning diet provided by the feed supplier.
Lacto-InitiatorPre-StarterStarter
Crude protein19.90%20.11%18.41%
Crude fat content6.30%7.11%5.87%
Crude ash5.56%5.35%5.18%
Crude fibre2.54%2.58%3.02%
Lysine1.55%1.48%1.33%
Methionine0.59%0.63%0.49%
Calcium0.57%0.80%0.70%
Phosphorus0.56%0.54%0.50%
Sodium0.34%0.25%0.20%
Main ingredientsCorn heat-treated, Whey powder, Wheat, Rice heat-treated, Extruded full-fat soybean.GM Corn, Wheat, Extruded GM soybean meal, Barley, Whey powder.GM Corn, Wheat, Extruded soybean meal heat-treated, Barley, Butter.
Table 2. Summary of weights reached by castrated male (CM) and female (FM) pigs in breeding cycles 1 (C1) and 2 (C2).
Postweaning Week 0Postweaning Week 6
Mean (SD)MinMaxMean (SD)MinMax
CM–C16.71 (0.454)6.177.2119.90 (0.737)17.8021.00
FM–C16.53 (0.362)6.206.9519.41 (1.058)17.8021.20
CM–C27.38 (0.691)6.658.2519.44 (1.030)18.0021.30
FM–C26.72 (0.557)6.057.3019.11 (1.162)16.8020.40
Table 3. Results of paired Student’s t-test for weekly postweaning piglet weight data by sex. CIlow: lower bound of the confidence interval; CIupp: upper bound of the confidence interval; df: degrees of freedom.
CycleWeek Postweaningp-ValueCIlowCIuppt Valuedf
100.517−1.000.63−0.7333
110.598−0.400.26−0.5714
120.850−1.021.180.2024
130.868−0.790.900.1774
140.826−1.351.13−0.2315
150.744−0.781.040.3426
160.294−1.490.51−1.1228
200.005−0.99−0.33−5.5104
210.044−0.92−0.02−2.9064
220.100−0.920.12−2.1304
230.644−1.360.95−0.4994
240.524−1.670.97−0.6845
250.517−1.530.85−0.6827
260.625−1.801.15−0.5098
Table 4. Goodness of fit of linear (quadratic, exponential) and nonlinear (Gompertz, Richards, logistic, Von-Bertalanffy) mixed models. RMSE: root mean square error.
QuadraticExponentialGompertzRichardsLogisticVon-Bertalanffy
RMSE0.4020.5470.2960.3000.3460.288
r0.9960.9940.9980.9980.9970.998
R20.9960.9870.9960.9960.9950.996
AIC 27.36226.05532.02225.757
BIC 22.45221.75928.33920.847
Table 5. Adjusted parameters of nonlinear mixed models of piglet growth between 6 and 20 kg live BW. (SE): standard error. L: lower horizontal asymptote. A: upper horizontal asymptote. K: rate of approach to the upper asymptote at the point of inflexion. T: point of inflexion. S: curve symmetry parameter.
GompertzRichardsLogisticVon-Bertalanffy
L6.86 (0.141)6.48 (0.372)6.48 (0.212)6.83 (0.165)
A19.74 (1.706)17.18 (2.418)14.72 (0.781)23.34 (2.792)
K0.07 (0.007)0.10 (0.040)0.14 (0.012)0.05 (0.006)
T27.66 (1.319)27.35 (1.032)26.83 (0.687)2.56 (1.629)
s 0.47 (0.634)
Table 6. Summary of 10 min environmental parameters during two breeding cycles. TA: temperature in the animal zone. HA: humidity in the animal zone. AVA: airspeed in the animal zone. C1: cycle 1. C2: cycle 2. SD: standard deviation.
Mean (SD)MinMaxWeek of Maximum *
TA C1 (°C)27.7 (1.73)22.034.36th week
TA C2 (°C)25.1 (1.19)20.029.25th week
HA C1 (%)59.9 (6.05)36.488.43rd week
HA C2 (%)64.7 (6.52)38.893.83rd week
AVA C1 (m/s)0.09 (0.052)0.050.466th week
AVA C2 (m/s)0.09 (0.060)0.050.535th week
* Week postweaning at which the maximum is obtained.
Disclaimer/Publisher’s Note: The statements, opinions and data contained in all publications are solely those of the individual author(s) and contributor(s) and not of MDPI and/or the editor(s). MDPI and/or the editor(s) disclaim responsibility for any injury to people or property resulting from any ideas, methods, instructions or products referred to in the content.

