Article

A Simulation and Experiment on the Optimization Design of an Air Outlet Structure for an Air-Assisted Sprayer

1
College of Mechanical and Electronic Engineering, Shandong Agricultural University, Tai’an 271018, China
2
Provincial Key Laboratory of Horticultural Machinery and Equipment, Shandong Agricultural University, Tai’an 271018, China
3
Yantai Academy of Agricultural Sciences, Yantai 265500, China
*
Author to whom correspondence should be addressed.
Agriculture 2023, 13(12), 2277; https://doi.org/10.3390/agriculture13122277
Submission received: 27 October 2023 / Revised: 8 December 2023 / Accepted: 13 December 2023 / Published: 15 December 2023
(This article belongs to the Special Issue Advanced Technology for the Development of Agricultural Sprays)

Abstract

:
In response to the issues of low-velocity zones and non-uniform jet velocity distribution in the airflow field of traditional air-assisted orchard sprayers, an arc-shaped air outlet suitable for axial-flow air-assisted systems is designed. This article employs the method of CFD numerical simulation and experimental verification to compare and analyze the internal flow field of the air-assisted system and validates the reliability of the numerical simulation results through calculation error and chi-square test. The wind speed of the cross-section is measured at different distances from the outlet, and the distribution characteristics of the outflow field wind speed before and after the structural optimization of the air-assisted system are compared. The horizontal distribution of fog droplets is collected using a fog collection chamber. The experimental results show that the design of the arc-shaped outlet increases the average wind speed of the annular outlet from 14.95 m/s to 18.20 m/s and reduces the proportion of low-speed area from 20.83% to 0.71%. When the rounded corner radius of the air outlet is 50 mm, optimal parameters are attained. The maximum error between the simulated and experimental values is 9.52%. At a significance level of 0.05, the χ2 value is 0.252, indicating that the simulated values follow the distribution of the actual measurement values. On the cross-sections located at distances of 0.5, 0.75, 1, 1.25, and 1.5 m from the air outlet, the wind speed distribution with no arc-shaped air outlets exhibits a “low left and high right” type, tending to shift towards the right as a whole. Fog droplets also display a drift tendency towards the right side. The wind speed distribution with arc-shaped air outlets shows a symmetric “high in the middle and low on the sides” type. Fog droplets concentrate in the central position. The optimized air-assisted system can reduce the air field’s low-flow area, increase the airflow distribution uniformity, improve the average wind speed at the outlet, and decrease fog droplet drift. This provides a reference for the structural design of air-assisted systems in current orchard sprayers of the same type.

1. Introduction

The air-assisted orchard sprayer is a significant addition to mechanized plant protection machinery and plays an important role in the mechanization of agriculture. Generally, orchards require spraying pesticides many times a year, accounting for about 30% of the total workload of tree management [1,2,3,4]. Compared to traditional hydraulic spraying, air-assisted systems can transport liquid droplets to the crown layer of fruit trees [5], enhancing the coverage and penetrability of droplets and improving the efficiency of machine operations, thus being called the first revolution of orchard plant protection [6,7,8,9]. Therefore, the structural optimization of air-assisted systems is of significant importance.
The abbreviation for Computational Fluid Dynamics (namely CFD) refers to the use of laboratory equipment by multiple foreign scholars to measure and confirm the effectiveness and reliability of CFD software analysis results, which comprehensively consider various factors [10,11,12,13]. Regarding the delivery capacity and flow guidance of orchard sprayer air-assisted systems, most domestic and foreign scholars use CFD simulation and experimental verification methods to analyze the airflow fields and characteristics inside and outside the sprayer [14,15,16]. Li et al. designed a spray system that combines an axial flow fan with an annular nozzle [17]. The optimal parameter combination was obtained through simulation and experiment, with a fan velocity of 6 m/s, a nozzle model of 02, and a nozzle inclination angle of 60°. Ru et al. designed an axial-flow wind delivery system suitable for traditional orchard sprayers [18] and, utilizing the Fluent analysis software, determined that an installation angle of 10°, six guide vanes with a length of 20 cm, a conical multi-outlet device with a taper of 2.25, and an A-type outlet configuration produce the optimal wind velocity at the outlet. Song et al. utilized the CFD moving reference frame method to optimize the nozzle structure of a wind-spraying-type sprayer with the initial condition of the fan speed and summarized that the factors affecting the outlet wind speed of the nozzle were [19], in order, the outlet diameter, the length of the cylindrical nozzle, and the length of the conical nozzle. Salcedo et al. developed an automatic air conditioning system [20] and, through testing and research, found that blade spacing and outlet width are two important factors that affect the airflow generated by wireless remote axial-flow fan spray systems. The combination of these two factors determines the overall effectiveness of the spray machine. The pitch of the blades determines the angle of the fan blades, which can affect the speed and pressure of the air being produced. The width of the outlet determines the size of the area where the air is guided, which can affect the coverage and distribution of the spray. By adjusting the blade spacing and outlet width, operators can finely tune the airflow to achieve the desired spray coverage and quality, while minimizing drift and waste. Fan et al. designed a multi-jet collaborative V-shaped anti-drift spray device that can generate multiple jets and collaborate at specific angles and flow rates to form stable jets [21], avoiding the impact of wind on the outlet. The external flow field of the outlet was obtained through CFD simulation and its anti-drift effect was verified. Hong et al. developed an integrated CFD model to predict the velocity distribution of the airflow inside and around tree crowns affected by the wind, providing an advantage for analyzing the impacts of various factors on sprayer performance [22].
In summary, the structural optimization of air-assisted systems includes various aspects such as the shape of the air duct, the length and quantity of the fan blades, installation angle, fan speed, and the width of the outlet. However, previous studies have overlooked the issues of low-speed zones and uneven jet direction wind velocity distribution in the airflow field generated by axial spray machines in air-assisted systems. This issue will directly result in the occurrence of drift in the airflow generated by the air-assisted system, subsequently leading to drift in the pesticide droplets, resulting in the wastage of pesticides and environmental pollution. To address this issue, this study adopts a methodology involving Computational Fluid Dynamics (CFD) simulations and on-site experiments. It focuses on the traditional air-assisted axial flow sprayer design by incorporating a curved structure at the junction of the air duct and the ring-shaped air outlet and to determine the optimal radius parameter size for the arc-shaped air outlet. The research results can provide a reference for the structural design of the same type of air-assisted system in orchard sprayers.

2. Materials and Methods

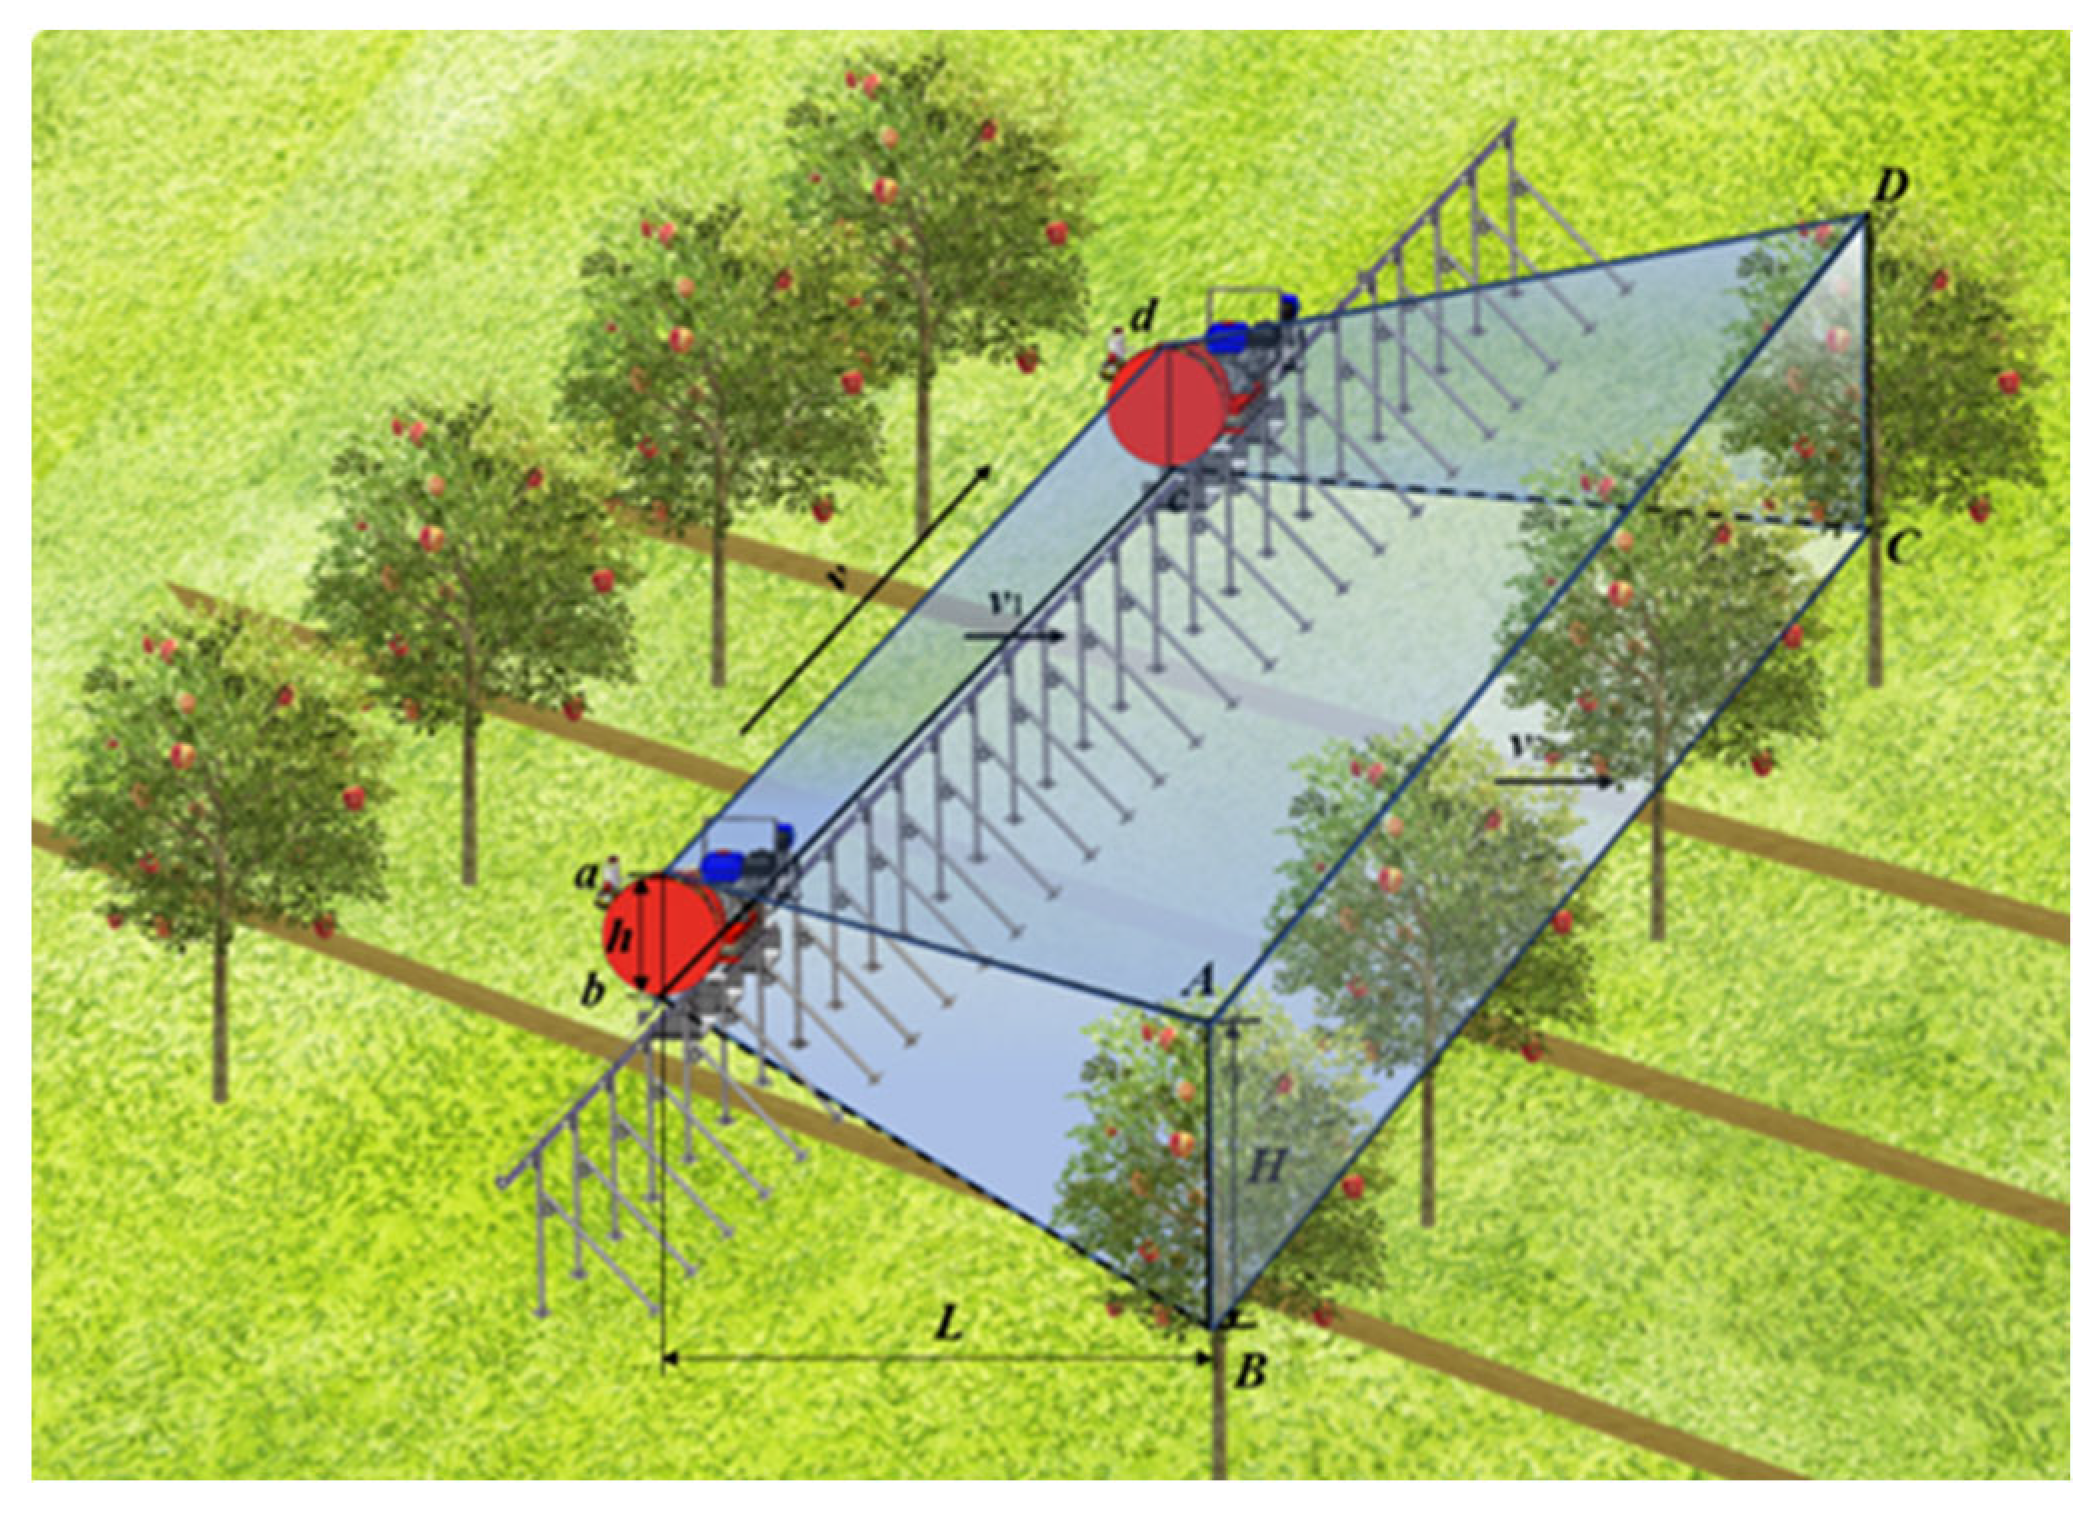
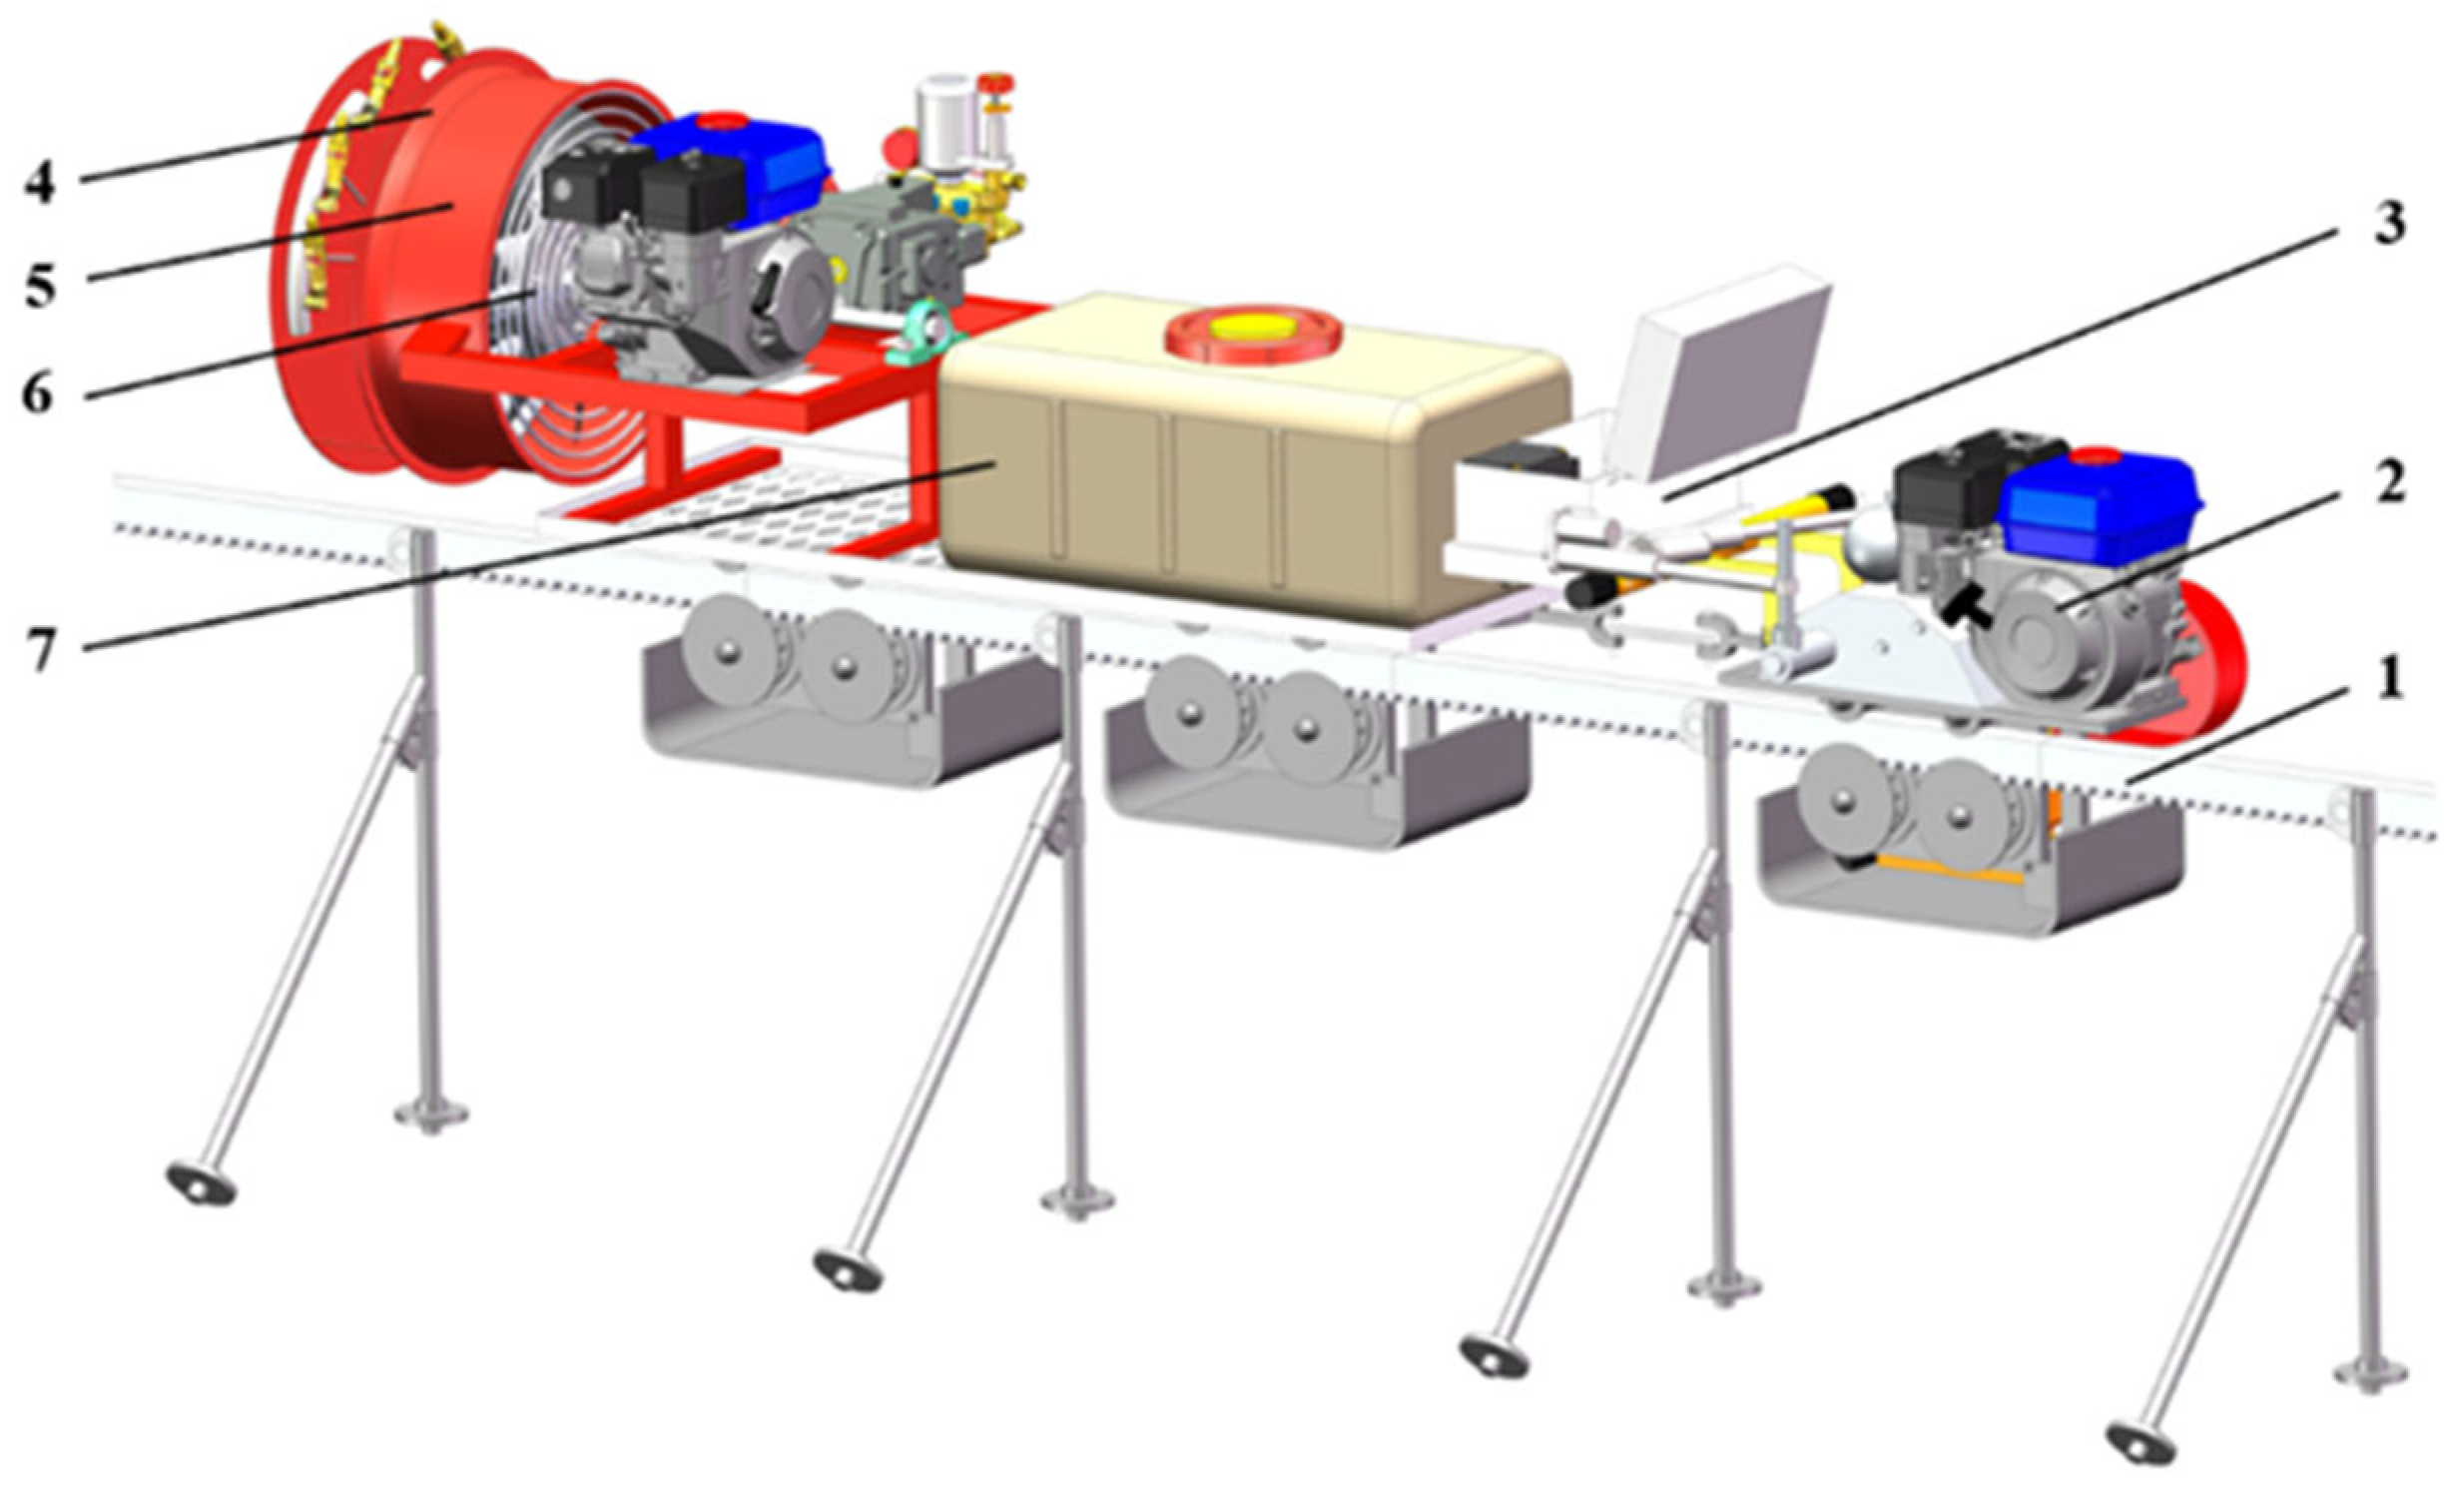
2.1. Machine Structure and Air-Assisted Principle

In hilly and mountainous regions, natural spindle-shaped apple trees currently have heights ranging from 2 to 3.5 m, canopy diameters from 1.7 to 2 m, row spacings from 3 to 4 m, and inter-plant spacings from 2 to 2.5 m. The spraying machinery utilizes a traditional air-assisted axial-flow sprayer (3WQY-800C, Corunp Mechanical Company in Weifang, China). On this basis, an arc-shaped air outlet with a rounded radius of 50 mm is designed for the connection between the air duct and the annular air outlet. Figure 1 illustrates the overall structure of a single-track remote-controlled self-propelled sprayer. The spraying apparatus is positioned at the rear end of the unit, with its air-assisted system primarily composed of an air duct, an axial flow fan, and an arc-shaped air outlet. The optimization of the arc-shaped outlet can increase the average wind speed of the spray device outlet and improve the uniformity of the wind speed. The main technical parameters of the air-assisted system are shown in Table 1.

2.2. Determination of Parameters for Axial-Flow Fans

2.2.1. Calculation of Fan Air Volume

During the operation of a single-track self-propelled sprayer in a hilly orchard area, the spraying mechanism, driven by the traction mechanism, adopts an air-assisted axial-flow sprayer for operation. The axial-flow sprayer is characterized by its lightweight and efficient airflow delivery, making it suitable for pesticide applications in different terrains [23]. For hill and mountain orchards with varying plant densities, the overall density of branches and leaves is high, requiring axial-flow fans to provide high wind speeds for delivering mist droplets to the interior of fruit trees. Air volume is one of the important parameters for air-assisted sprayers, and the air volume of the air-assisted sprayer not only needs to meet the principle of displacement, but also needs to adhere to the principle of final velocity [24]. According to the principle of displacement, the airflow blown out by the sprayer fan should be able to displace and completely replace all the air from the fan outlet to the fruit trees.
Figure 2 shows the airflow replacement diagram of the sprayer. V represents the traveling speed of the single-track self-propelled sprayer, V1 represents the initial air velocity at the outlet of the sprayer, and V2 represents the velocity of the spray wind reaching the canopy layer of the fruit tree. According to the principle of airflow replacement in the sprayer, the required airflow of the sprayer is calculated as follows.
Figure 2. Air displacement diagram of monorail self-propelled sprayer.
Agriculture 13 02277 g002
Q / 2 > v K H + h L / 2
where:
Q is the fan delivery (m3),
V is the sprayer speed (0.68–0.78 m/s),
K is the coefficients determined by the attenuation of airflow and losses along the way (1.3–1.6),
H is the height of the canopy of fruit trees (2.0 m),
h is the height of the sprayer air outlet (0.64 m),
L is the distance from sprinkler to the tree trunk (1.5 m).
By substituting various parameters into the equation, Q was found to be within the range from 3.5 to 4.9 m3/s. In order to meet the minimum required airflow rate of Q ≥ 4.9 m3/s, the final value for Q was chosen to be 5 m3/s.

2.2.2. Calculation of Wind Speed at the Outlet of the Fan

According to the principle of final velocity, the calculation formula for the final velocity V2 is as follows:
V 2 = h V 1 K / H
This formula yields:
V 1 = V 2 H / h K
where:
V2 is the final velocity at which the air reaches the canopy (m/s),
V1 is the airflow velocity at the fan discharge outlet (m/s),
K is the coefficient of frictional losses along the flow path of air volume, typically ranging from 1.3 to 1.8.
Based on the literature review [25], the standard speed for reaching the tree canopy of fruit trees is 9–10 m/s. This paper focuses on spindle-shaped apple trees as the plant protection object, with a coefficient of K = 1.7. Thus, the optimal initial steady wind speed for the air outlet of the fan is determined to be 16.54–18.38 m/s.

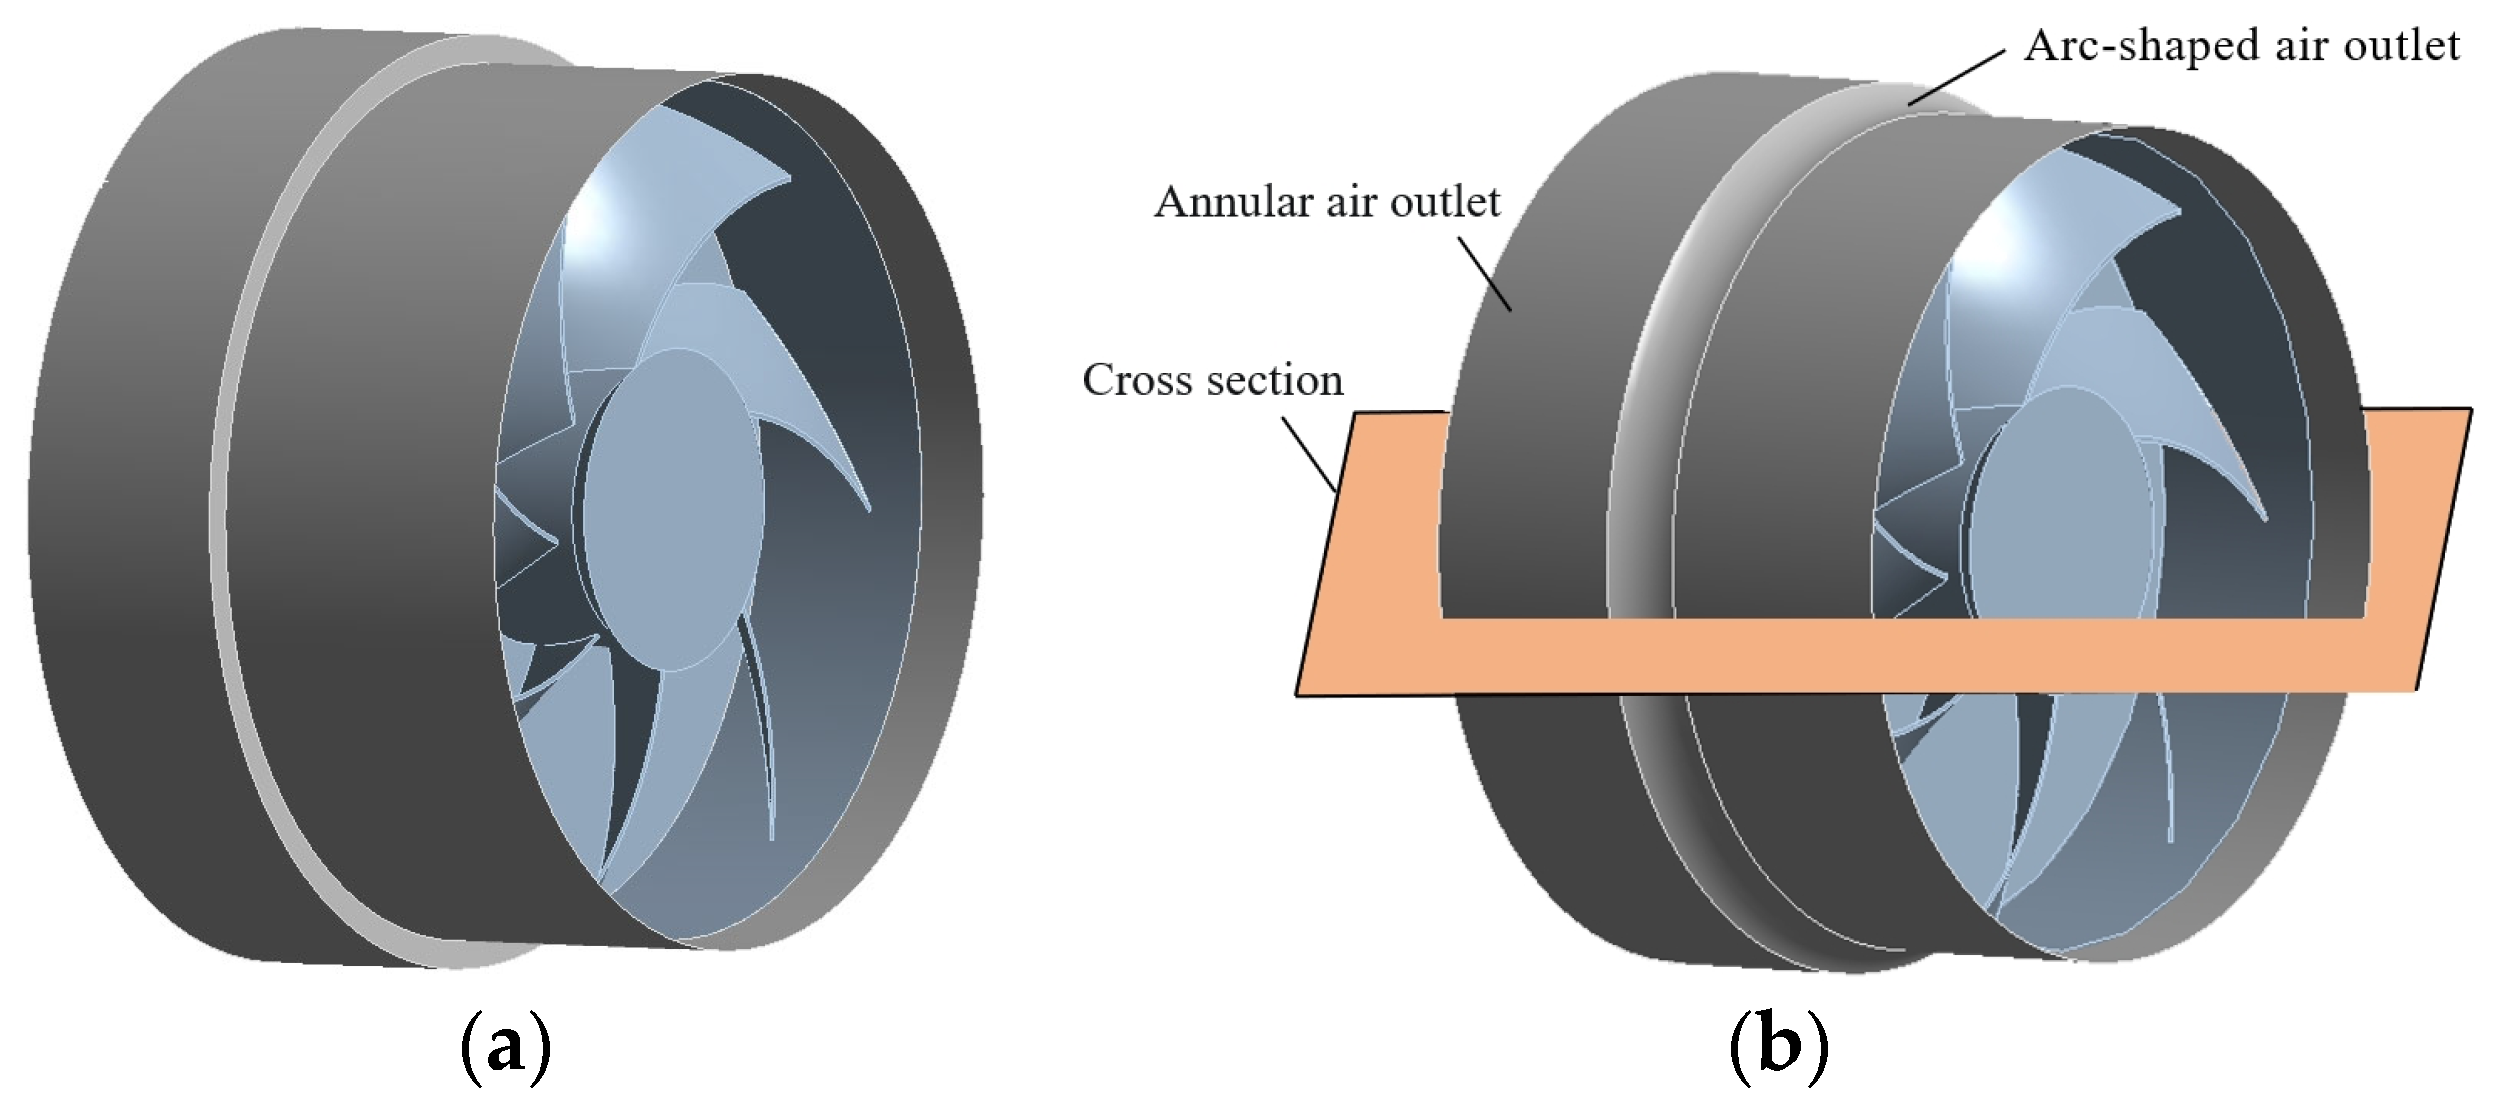
2.3. Structure Design of Arc-Shaped Air Outlet

The arc-shaped air outlet is an arc-shaped structure designed at the connection between the air duct and the annular air outlet. To study the influence of the arc-shaped air outlet on the wind speed of the air-assisted system, a CFD simulation was carried out for the air-assisted system.
The air-assisted spray machine was designed and modeled in SolidWorks based on its structural design and parameters. A dynamic reference frame model was employed, and the spray machine was divided into segmented grids using Gambit to achieve a numerical simulation of the movable components in the computational domain. The initial simulation speed was set at 2000 r/min for the movable fan. A standard k-ε turbulent model was selected as the calculation model due to the large calculation domain, which provides the best simulation accuracy [26]. The inlet and outlet boundary conditions were pressure inlets, with a relative atmospheric pressure of 0. The wall surface conditions were set to Fluent’s default wall surface function, while the interior exchange surface was set to “interior”. The three-dimensional simplified model before and after the optimization of the air-assisted system of the sprayer is shown in Figure 3.

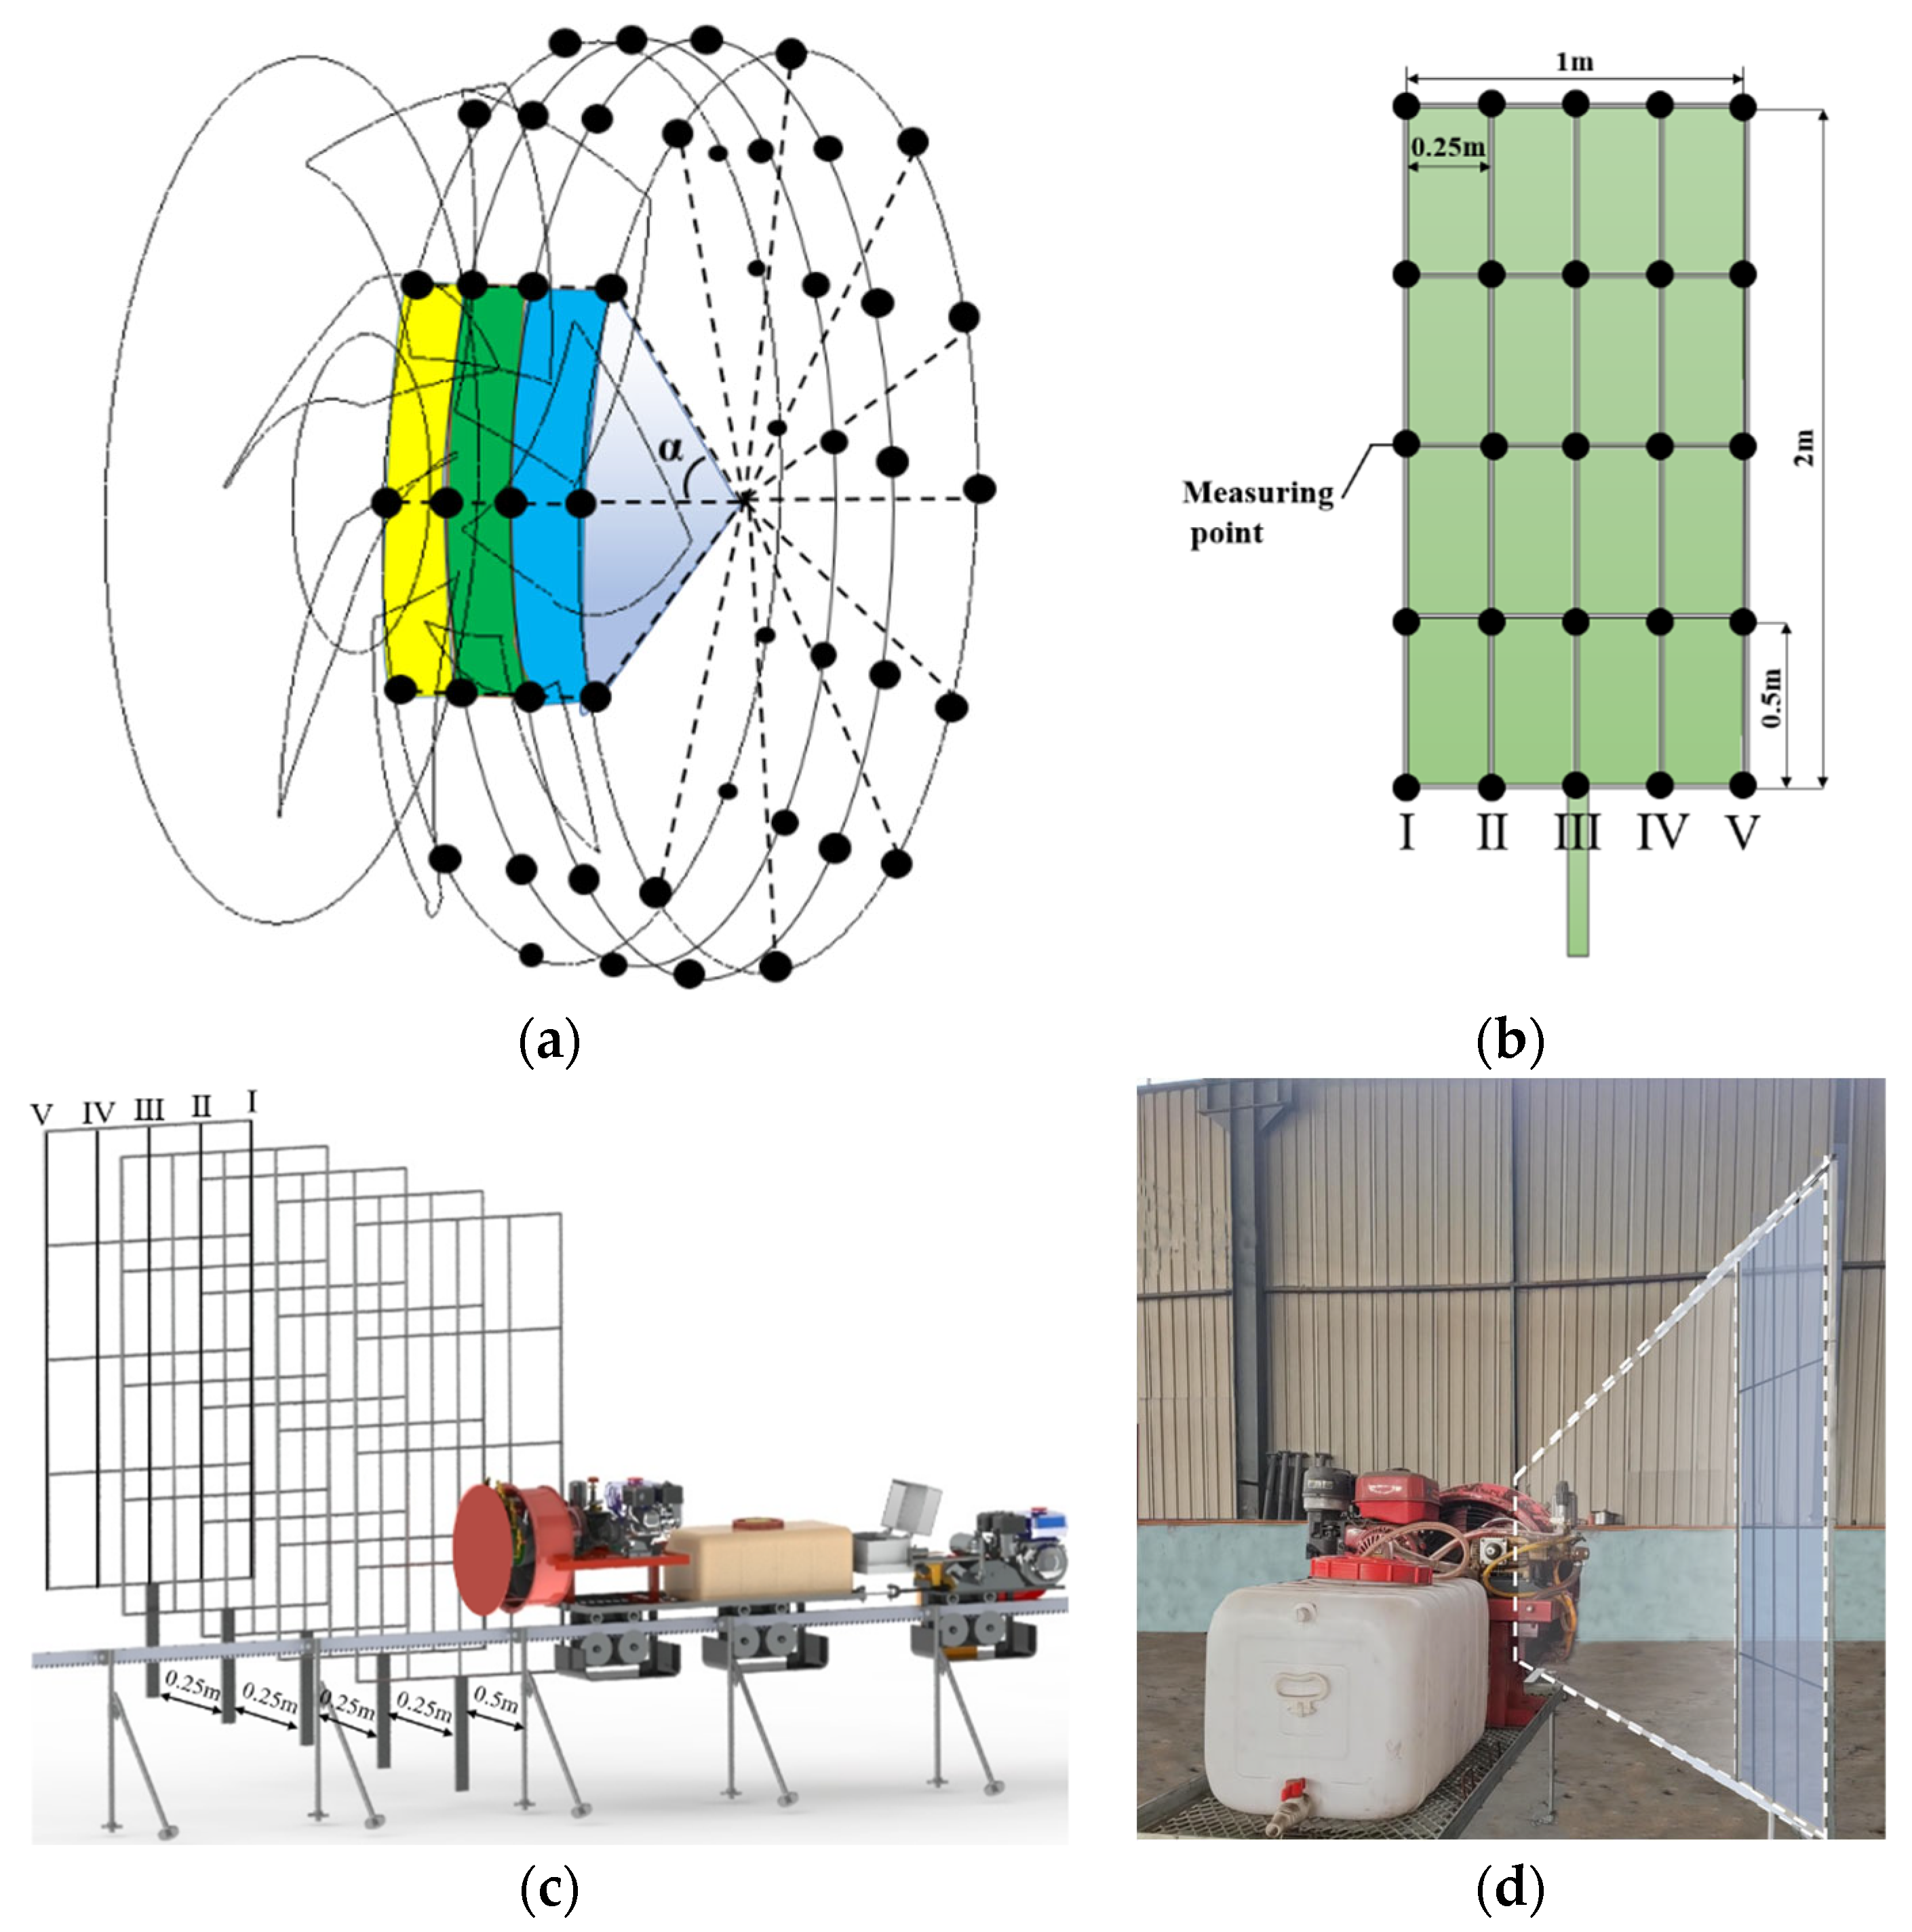
2.4. Field Experimental Method

2.4.1. Measurement of the Outflow at the Air Outlet and the External Airflow Field

According to “GB/T 24683-2009 Plant Protection Machinery—Test Method for shrub and tree Crops Air-fed sprayer” [27], and combined with the reasonable planting density of the spindle-shaped apple trees in Shandong Agricultural University’s experimental field, performance tests were carried out on the air-assisted system of the track sprayer with wind power optimization. According to the above simulation results, the arc-shaped air outlet with different parameters was designed and processed. Wind speed measurements were carried out at the annular air outlet port of the air-assisted system and in the external airflow field using the DLY-1602C integrated anemometer (Tai’an Dali West Group Company, Tai’an, China). The annular air outlet was divided into four circular planes with equal distances, and 12 points with the same central Angle α = 30° were taken as the measuring points on each circular plane. A measuring frame was formed by selecting a horizontal section of 1 m and a vertical section of 2 m on one side with the track as the axis. Five frames were set with distances from the track of 0.5, 0.75, 1, 1.25, and 1.5 m, respectively. In total, 25 measuring points were taken at horizontal intervals of 0.25 m and vertical intervals of 0.5 m on each frame as measuring points. The DLY-1602C integrated anemometer was positioned directly facing the air outlet of the sprayer’s air-assisted system, maintaining parallel alignment between the anemometer and the measurement frame. The anemometer’s anemometry probe remained stationary at each measurement point for 5 s, and the measurement was repeated 3 times to obtain the average value as the measurement result to ensure the accuracy of the data. The arrangement of wind speed measurements is shown in Figure 4.

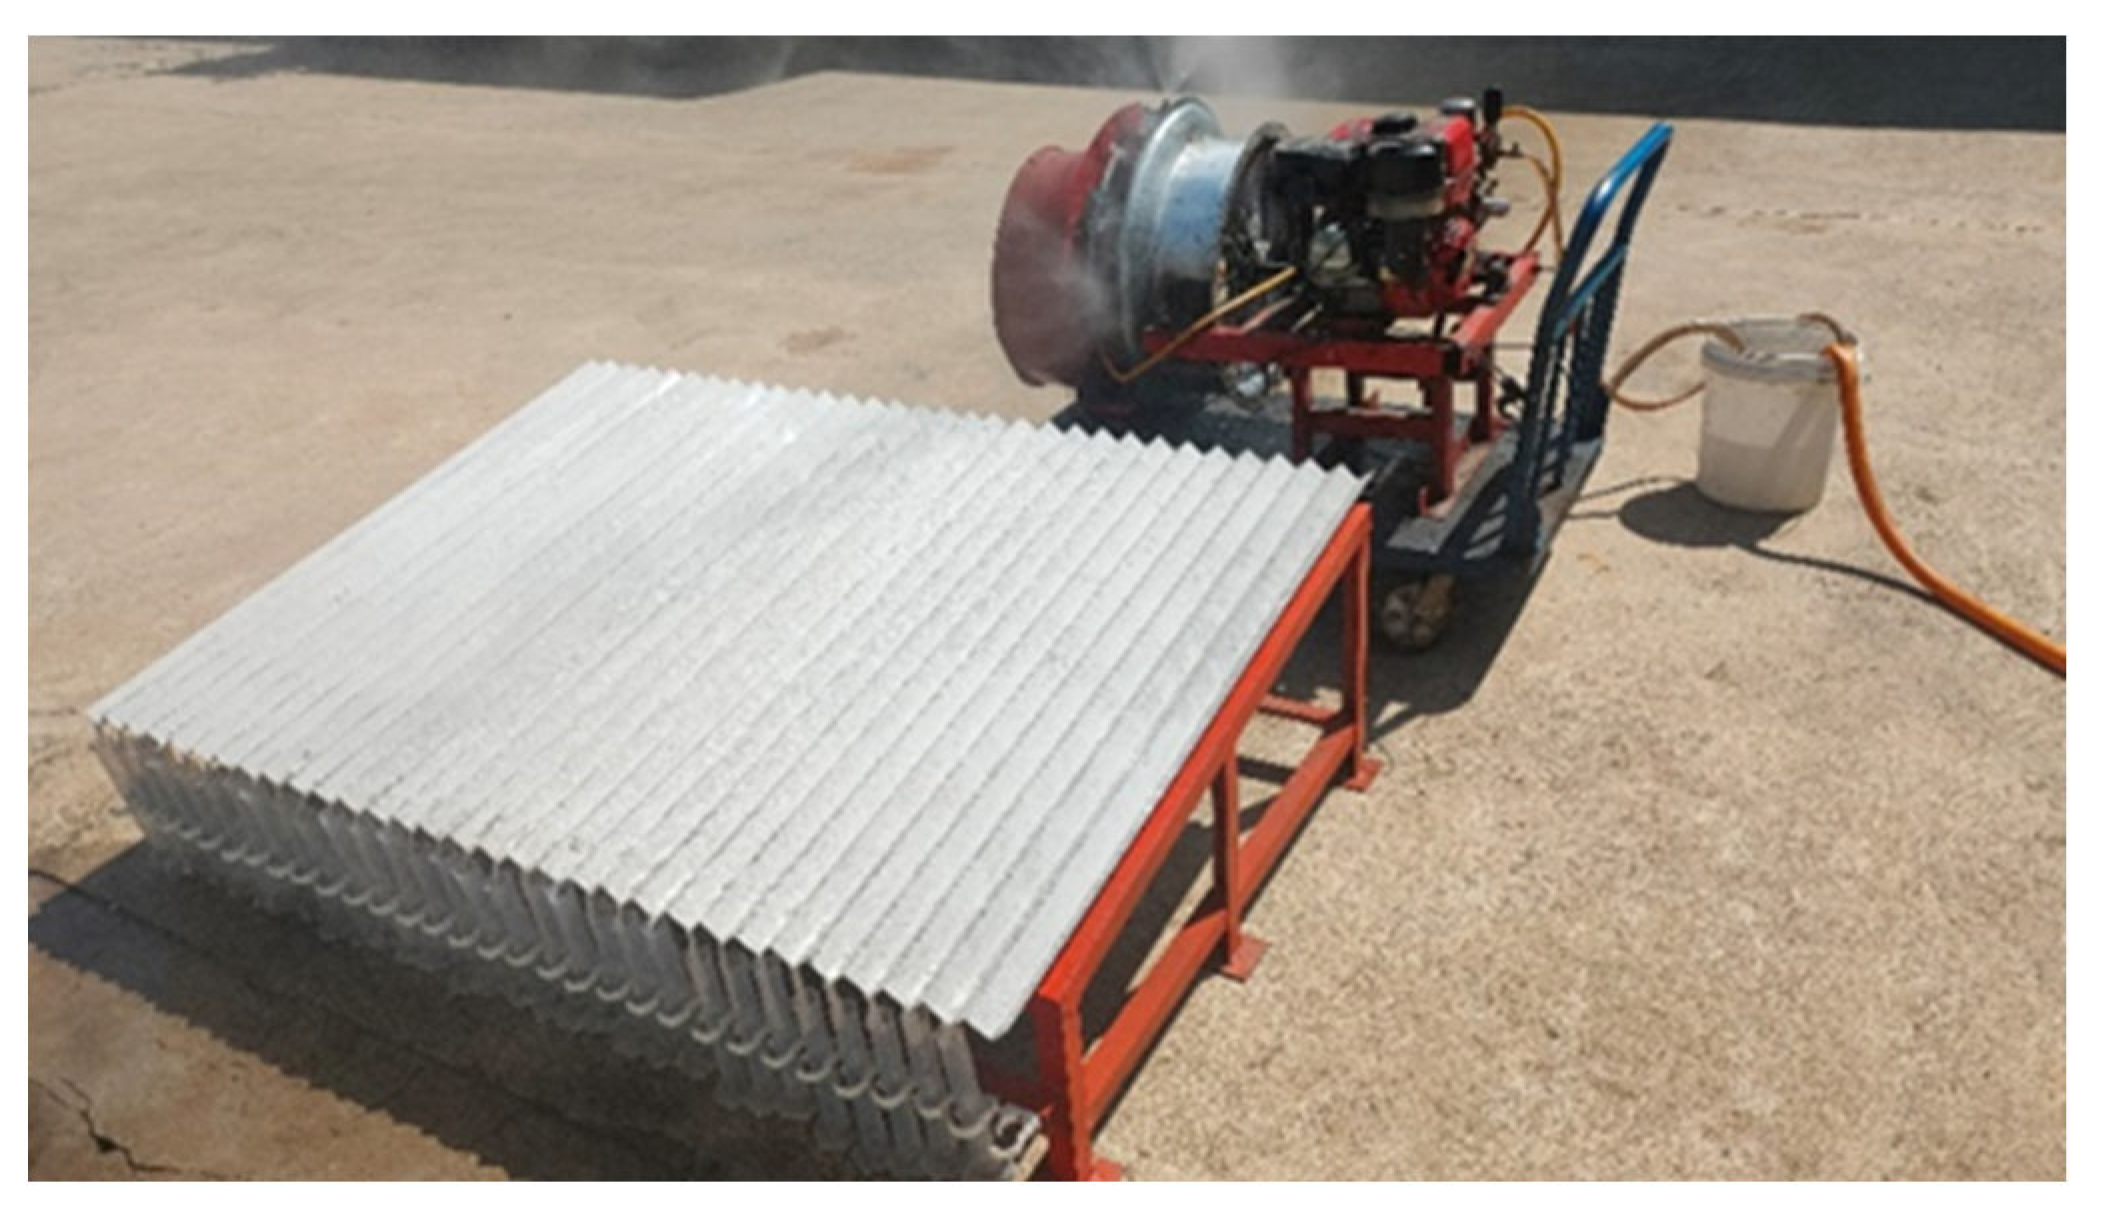
2.4.2. Experiment of Fog Droplet Collection in the Fog Collection Chamber

According to the standard “GB/T20183.2-2006 for Plant Protection Machinery—Spraying Equipment” [28], a fog collection chamber was utilized to gather droplets. The evaluation of the droplet drift prevention performance after the structural optimization was based on the measurements of droplet drift rate and mass center distance. The ambient temperature during the experiment ranged from 20 to 22 degrees Celsius, with a natural wind speed between 0.5 and 1 m/s. The fog collection chamber was set at an overall inclination angle of 10° and featured a total of 30 V-shaped slots. Each V-shaped slot was aligned with a graduated cylinder to collect the deposition of droplets from individual slots. The position of the collection chamber was adjusted to align the nozzle precisely at the center of the collection chamber. The stopwatch regulated a spray duration of 10 s with a spraying distance of 30 cm, using water as a substitute for the spray medium. Each experimental set was repeated three times to obtain an average value. Data were collected and recorded at the conclusion of each trial, and the experimental setup is illustrated in Figure 5.
The calculation formula is as follows:
γ = V t i = 1 n V i V t × 100 %
D = i = 1 n V i d i i = 1 n V i
where:
γ is the droplet drift rate (%),
D is the mass center distance of droplets (mm),
N is the number of V-shaped slots (units),
Vt is the actual total spray volume (mL),
Vi is the deposited volume of droplets in the i-th V-shaped slot (mL),
di is the distance from the center of the i-th V-shaped slot to the centerline of the collection chamber (mm).

3. Results and Discussion

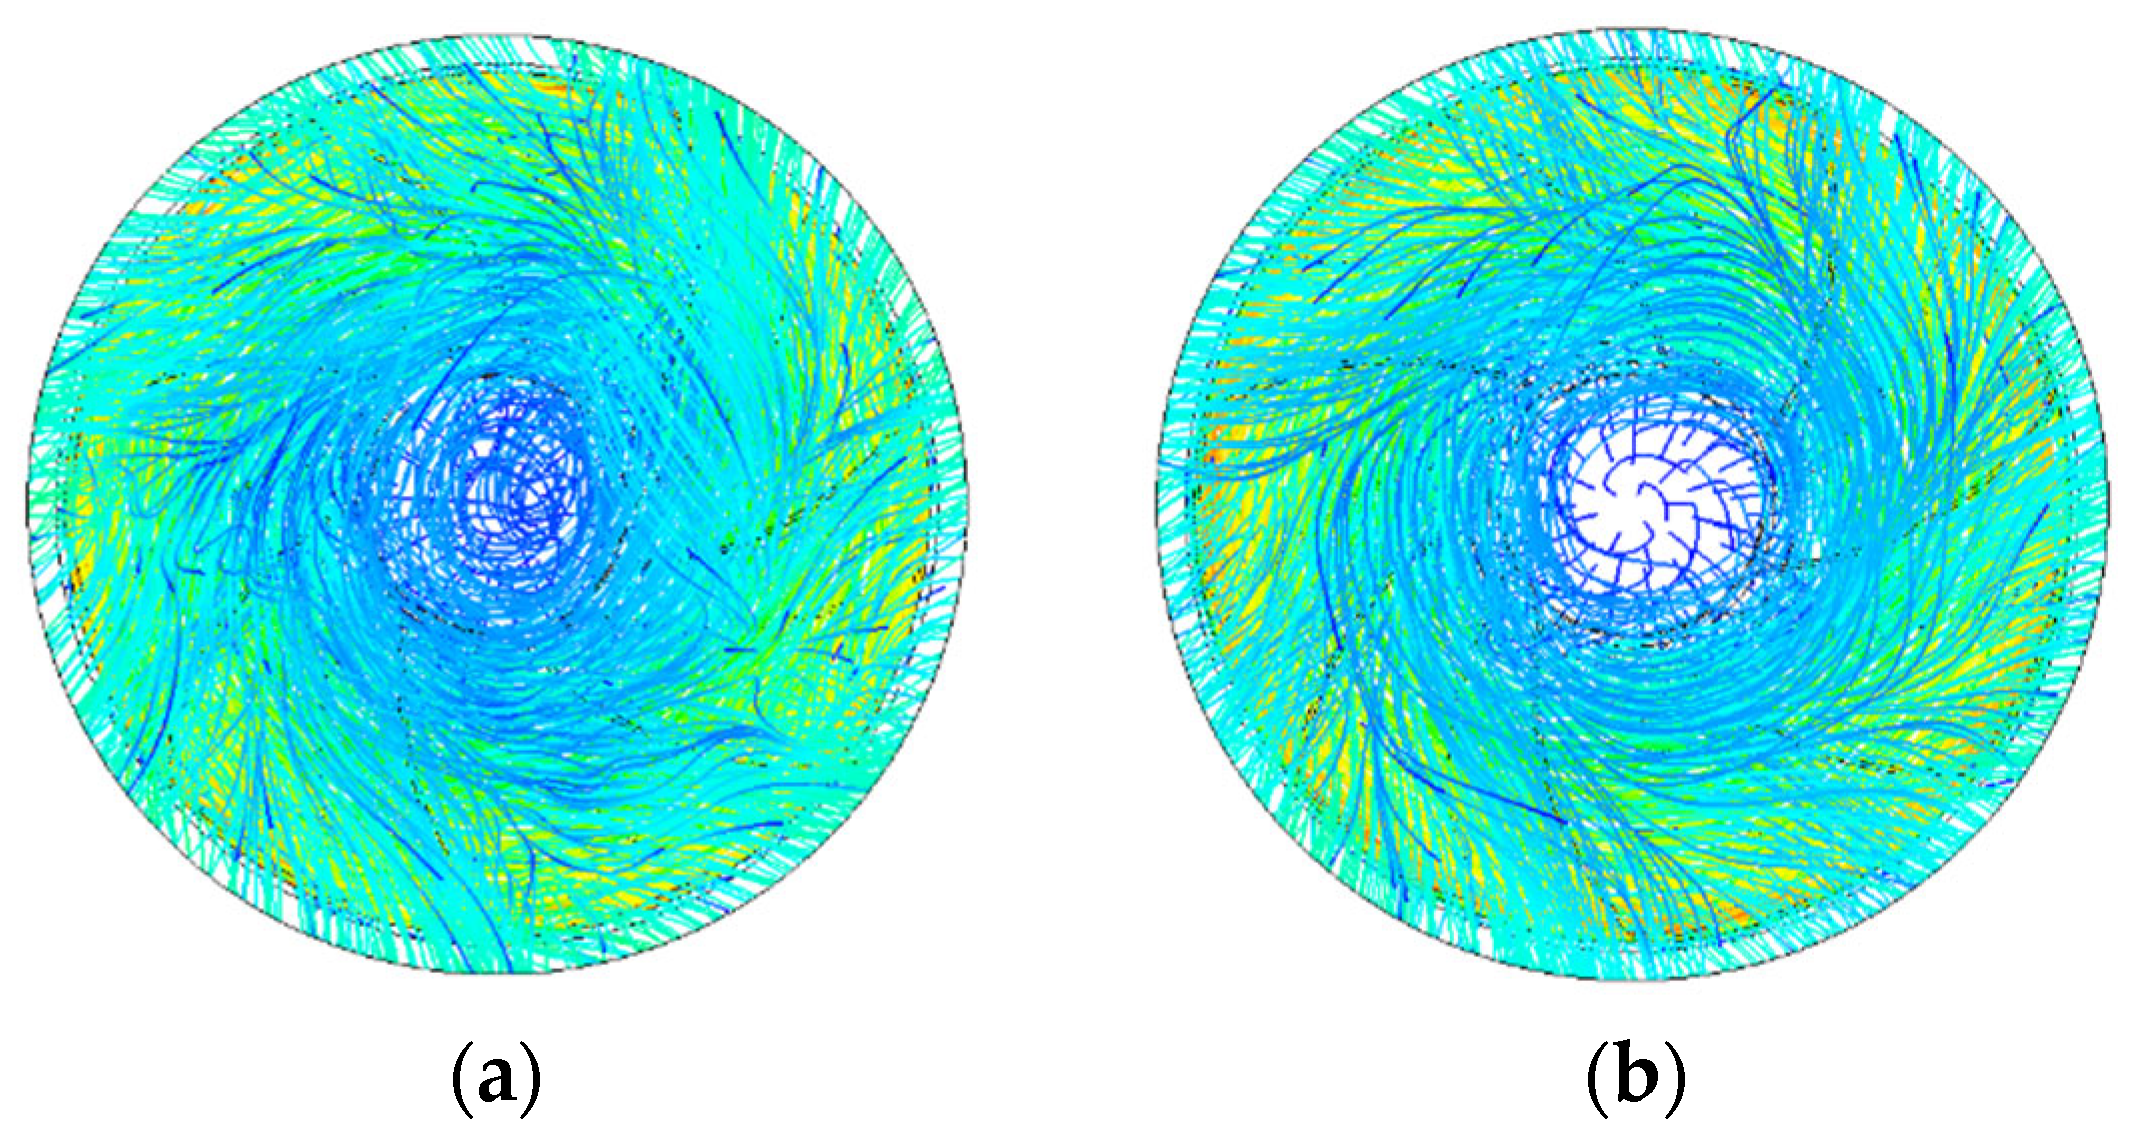
3.1. Analysis of Results before and after Optimization

Upon the convergence of the CFD calculations, the streamlined diagrams of the air-assisted system were obtained, as shown in Figure 6. In air-assisted systems that lack an arc-shaped air outlet, the presence of numerous and densely packed low-speed streamlines, coupled with the axial flow resistance posed by circular baffles, results in the concentration of said low-speed streamlines in the central regions of the ducts and the formation of turbulent flow patterns. The optimization design of the arc-shaped air outlet significantly reduced the number of low-speed streamlines at the center position of the air duct in the air delivery system and diffused towards the annular air outlet. The comparison before and after demonstrates that the arc-shaped air outlet design reduced the generation of gas turbulent state and played a certain role in diverting the airflow produced by the fan. After the structural optimization, the airflow streamline became more streamlined.

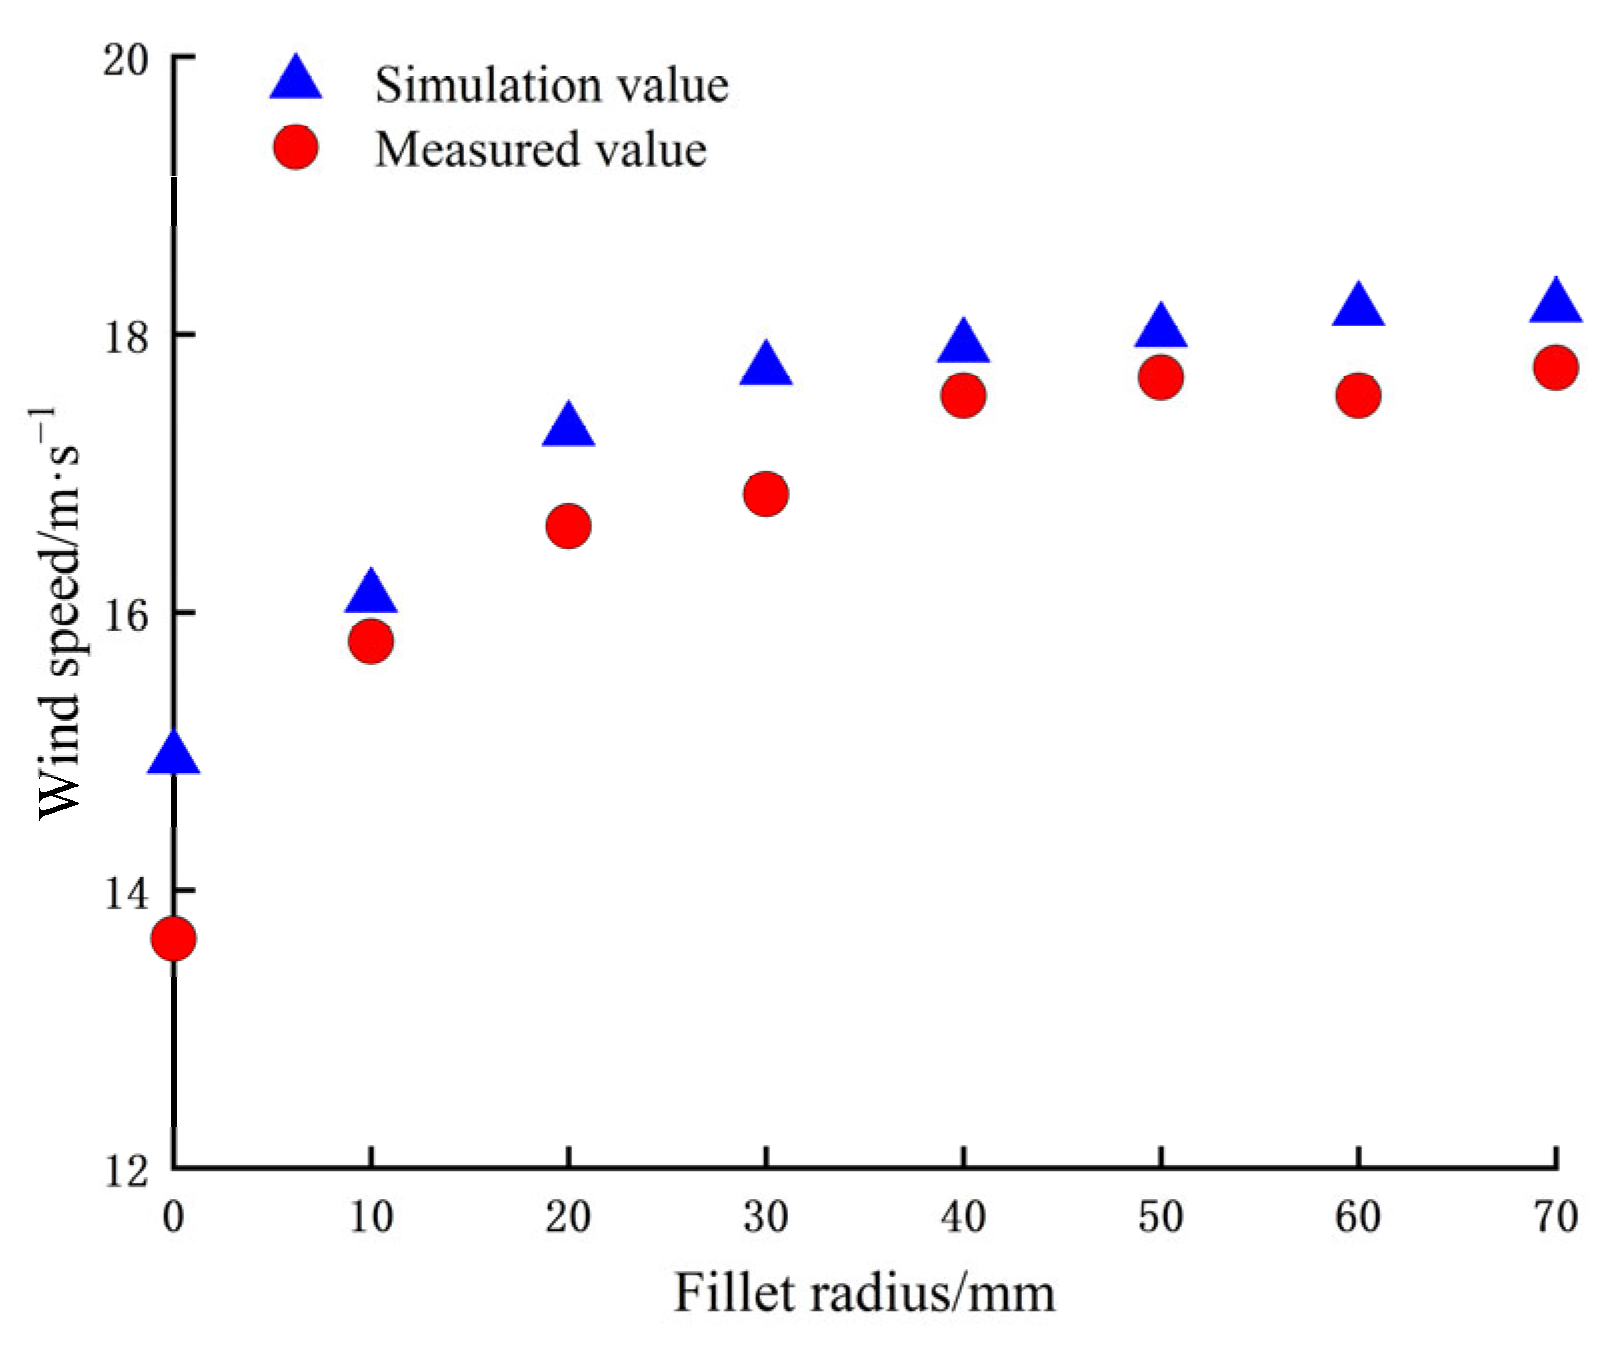
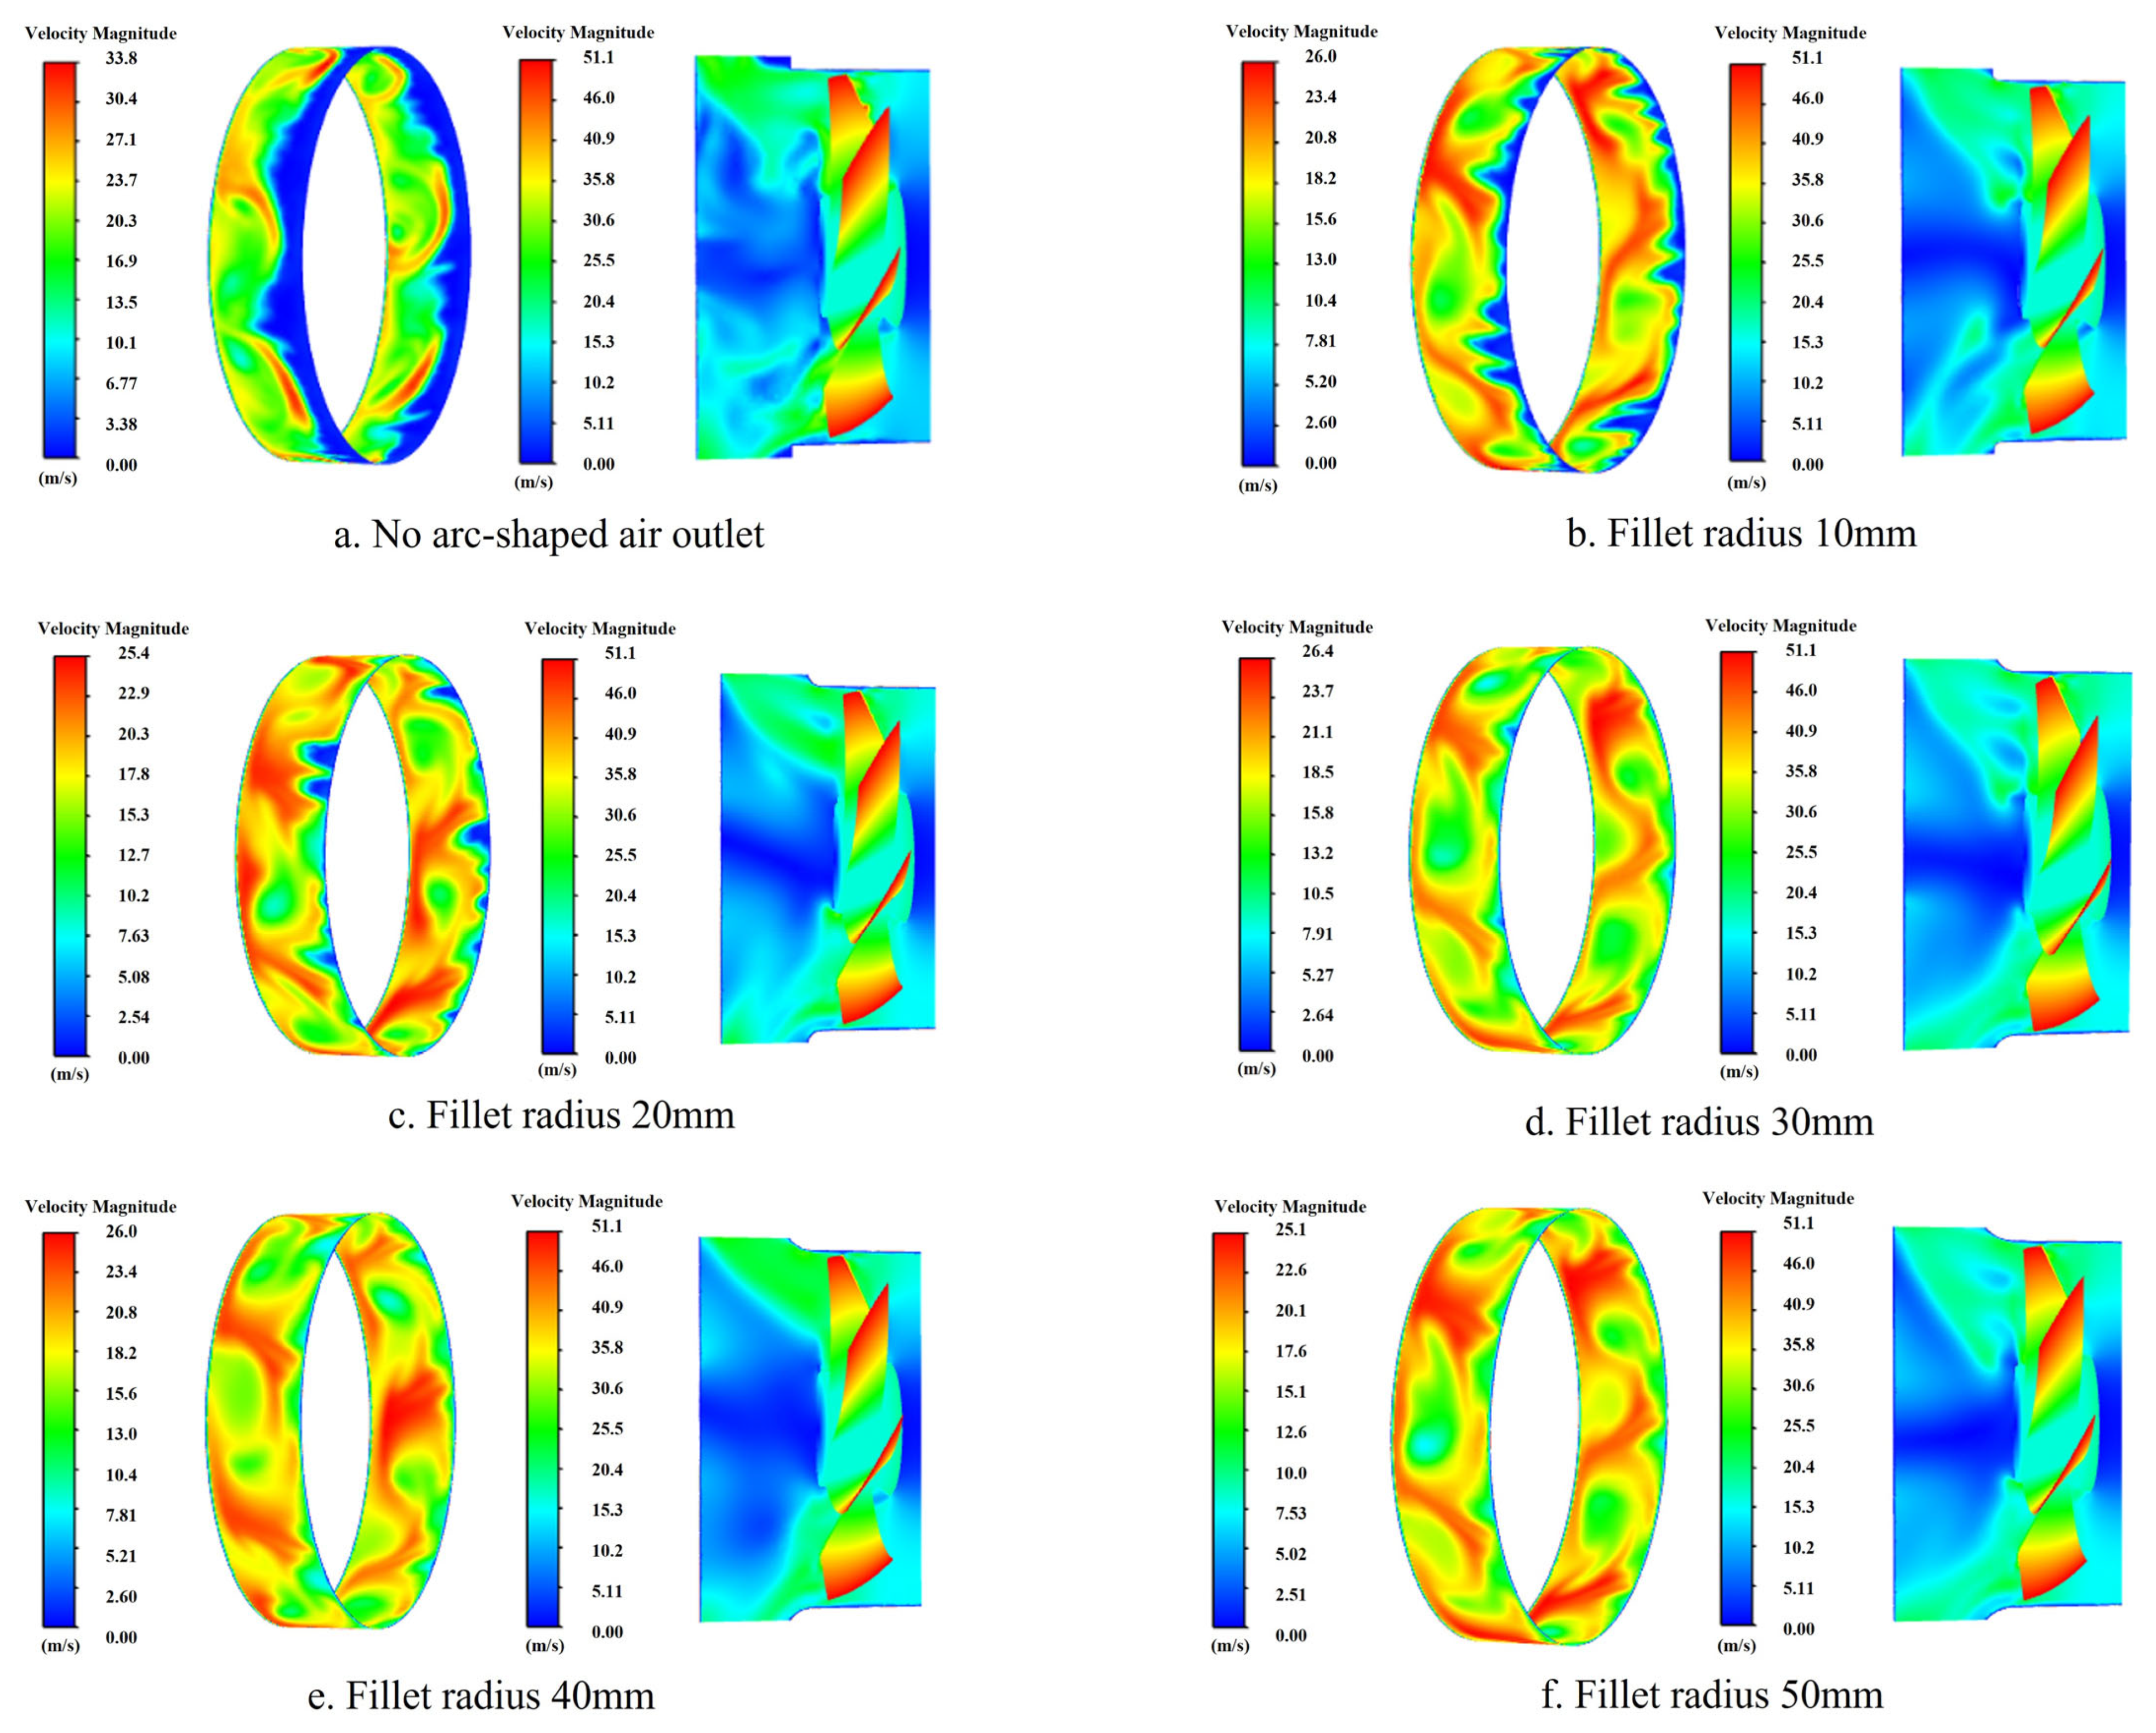
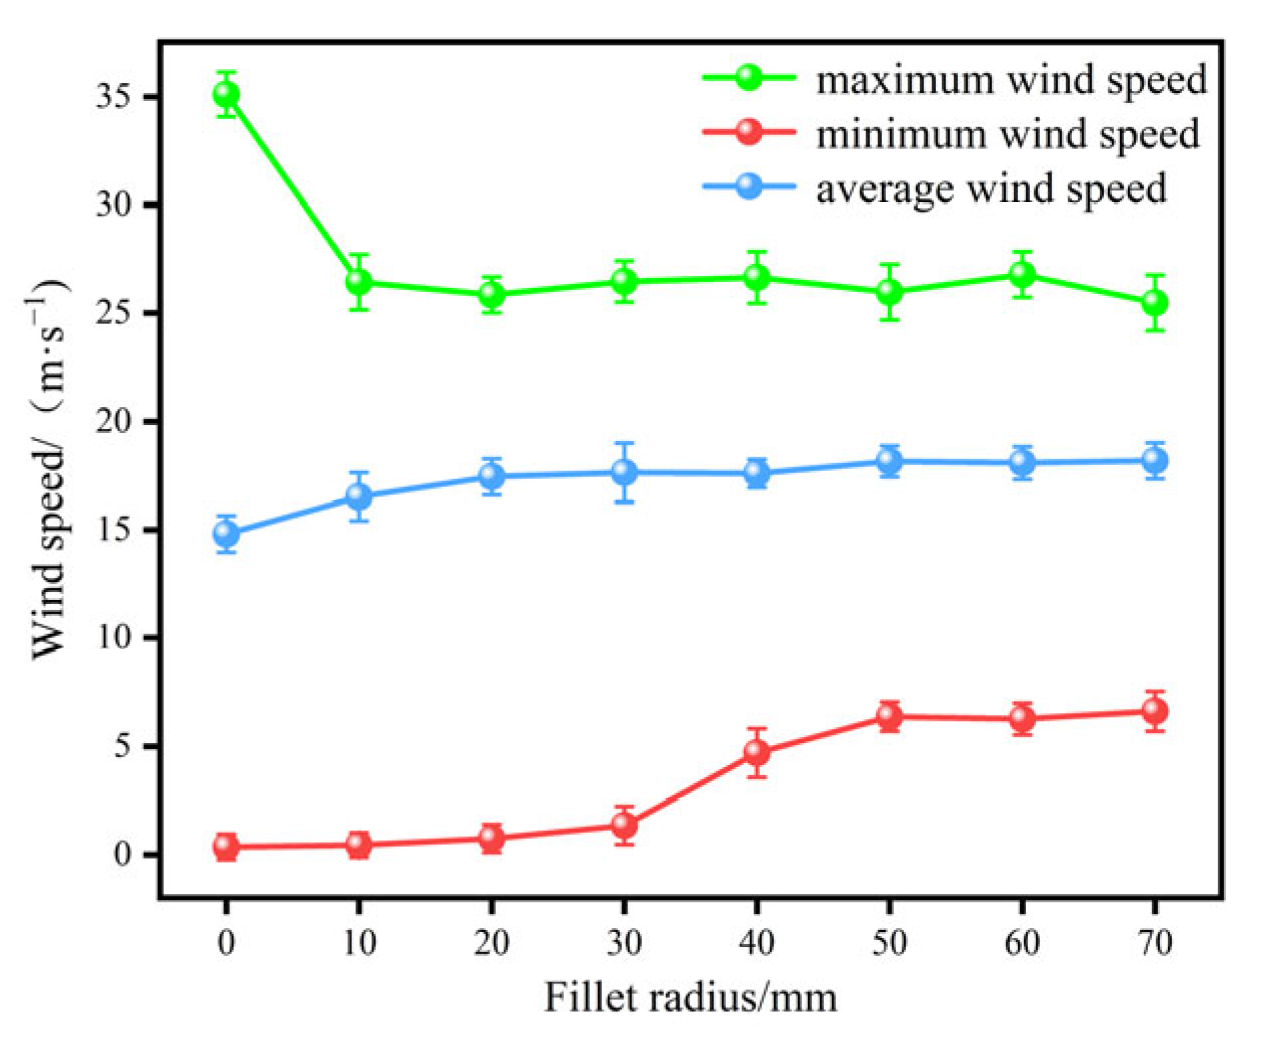
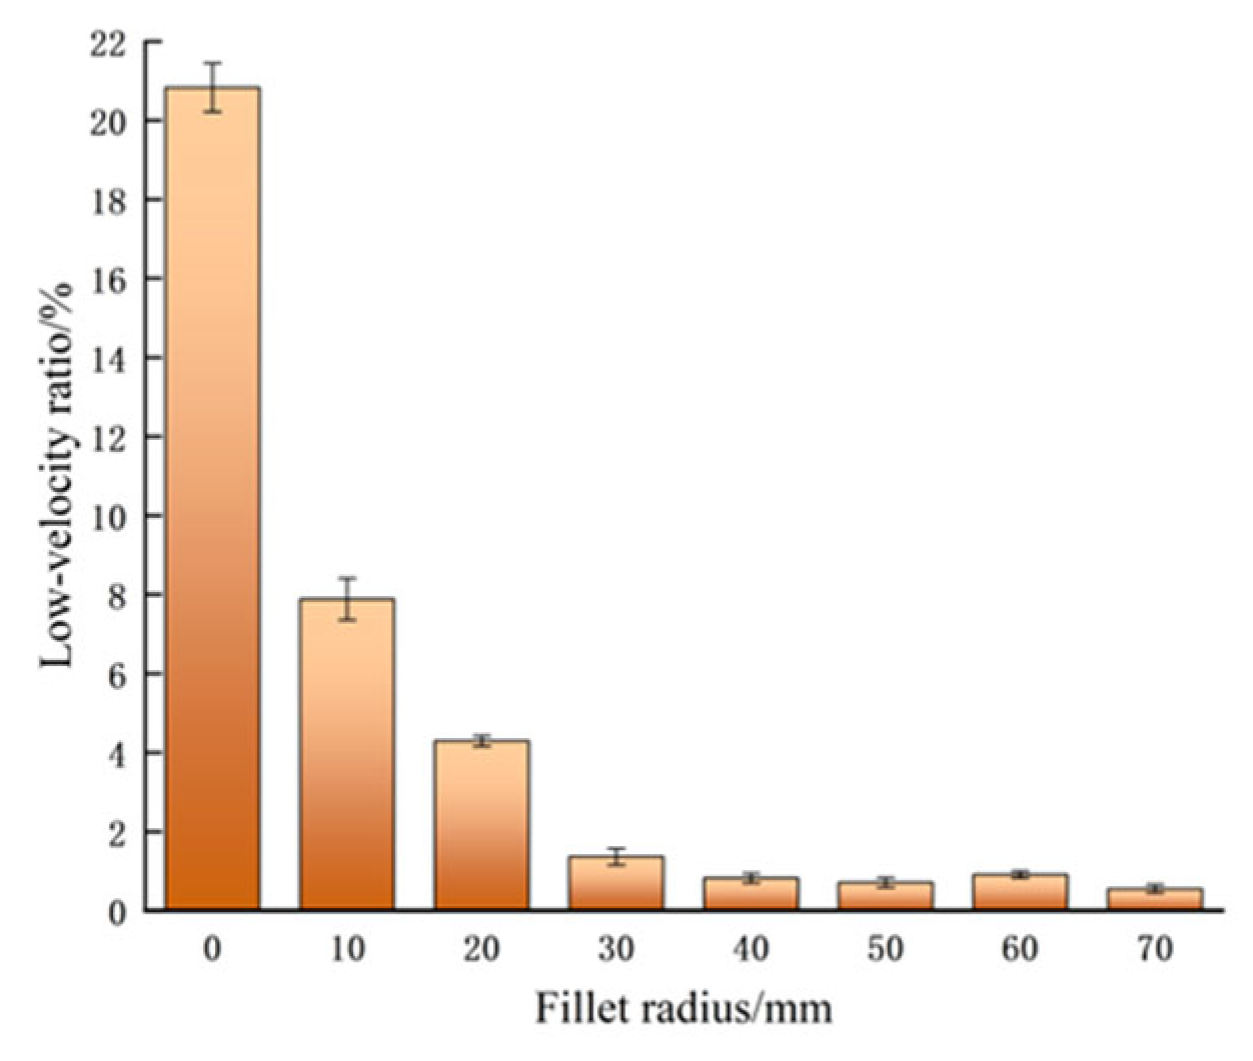
3.2. Analysis of the Parameters of the Arc-Shaped Air Outlet’s Rounded Corner Radius

To investigate the optimal circular radius of the arc-shaped air outlet, simulations were conducted for the different circular radii of the arc-shaped outlet design. Circular radii of 10, 20, 30, 40, 50, 60, and 70 mm were utilized, and Figure 7 shows the simulated velocity cloud diagrams of the horizontal cross-section of the air-assisted system and the annular air outlet.
The comparison between Figure 7a,b shows that the cross-section of the no arc-shaped air outlet has an obvious zero-speed area at the corner of the connection between the air duct and the air outlet, and the wind speed cloud image of the annular air outlet is more obvious. The low-speed area covers the entire edge area of the air outlet. After the design of the structure of the arc-shaped air outlet with a rounded radius of 10 mm, the zero-speed area at the corner of the transverse section decreases. The low-speed area of the annular outlet is also significantly reduced, and the uniformity of the wind speed distribution is greatly improved compared to that before the structure optimization. With an increase in the fillet radius, the flow field inside the duct becomes more uniform and stable, and the low-speed area gradually decreases to basically disappear.
The fluent post-processor was used to calculate the maximum wind speed, minimum wind speed, and average wind speed at the annular air outlet, and the variation curve was drawn. The blue region corresponding to the annular air outlet was extracted from the image using OpenCV in the HSV color space, and its area was calculated relative to the total area to obtain the percentage of the low-velocity zone, as shown in Figure 8 and Figure 9.
From the point-line graph of wind speed variations, it can be observed that, as the corner radius increases, the maximum wind speed stabilizes at around 26 m/s after a significant decrease, while the minimum wind speed slowly increases and stabilizes at around 6 m/s when the corner radius is 50 mm; the average wind speed at the exit shows an increasing trend, rising from 14.95 to 18.20 m/s. The bar graph of the low-speed zone shows that the proportion of the low-speed zone gradually decreases from 20.83% to 0.71%, and the low-speed zone area stabilizes at the corner radius of 50 mm. Through the above data analysis, when the fillet radius reaches 50 mm, all aspects of the data display reach their best.
In the design of the arc-shaped air outlet, the turning angle of fluid can be reduced by increasing the fillet radius at the junction of the air duct and annular air outlet, making the flow more smooth at the corner, thereby reducing energy loss and turbulence generation, increasing the average wind speed of the air outlet, and improving the uniformity of the wind speed distribution at the air outlet.

3.3. Field Experimental Results and Analysis

3.3.1. Test Verification of Air Outlet

Under the condition of fan speed at 2000 r/min, the air-assisted system with different parameters of arc-shaped air outlet designs was used to record the wind speed at all points of the annular air outlet. The average value was calculated as the average wind speed at the air outlet, which was then compared with the simulated average wind speed, as shown in Table 2. A chi-square test was performed on the simulated values and observed values to verify the reliability of the simulation model. The error of the simulated average wind speed at the outlet relative to the measured value is as follows:
δ 1 = V S V m V m × 100 %
where:
Vs is the simulated wind speed (m/s),
Vm is the measured wind speed (m/s).
Table 2. Wind speed simulation and measured data at the outlet.
Fillet Radius/mmSimulation Result/(m·s−1)Measured Results
/(m·s−1)
Error/%
014.9513.659.52
1016.1115.792.03
2017.3116.624.15
3017.7516.855.34
4017.9117.561.99
5018.0217.691.87
6018.1717.563.47
7018.217.762.48
According to Figure 10, the average simulated values of the wind speed at the outlet have an error compared to the measured values of no more than 9.52%. This indicates that the simulation model has a high level of reliability, within the allowable range of errors for engineering calculations. A chi-square test was used to verify the correctness of the simulation model.
Figure 10. Comparison between simulated values and measured values.
Agriculture 13 02277 g010
χ 2 = i = 1 n V s i V m i 2 V m i
where:
Vsi is the simulation of wind speed under different fillet radii (m/s),
Vmi is the measured wind speed under different fillet radii (m/s),
N is the measurement number, n = 8.
It can be calculated that the χ2 value is 0.252. By referring to the χ2 test table, a result of χ 2 0.05 7 = 15.51 is obtained. As the χ2 value of 0.252 is less than the critical value of 15.51 at a significance level of 0.05, it indicates that the simulated values of the average wind speed under different parameter settings of the outlet locations conform to the distribution of the sample signals. This suggests that the simulation model is trustworthy and can reproduce well the airflow velocity and distribution characteristics of the air-assisted system during actual operation.

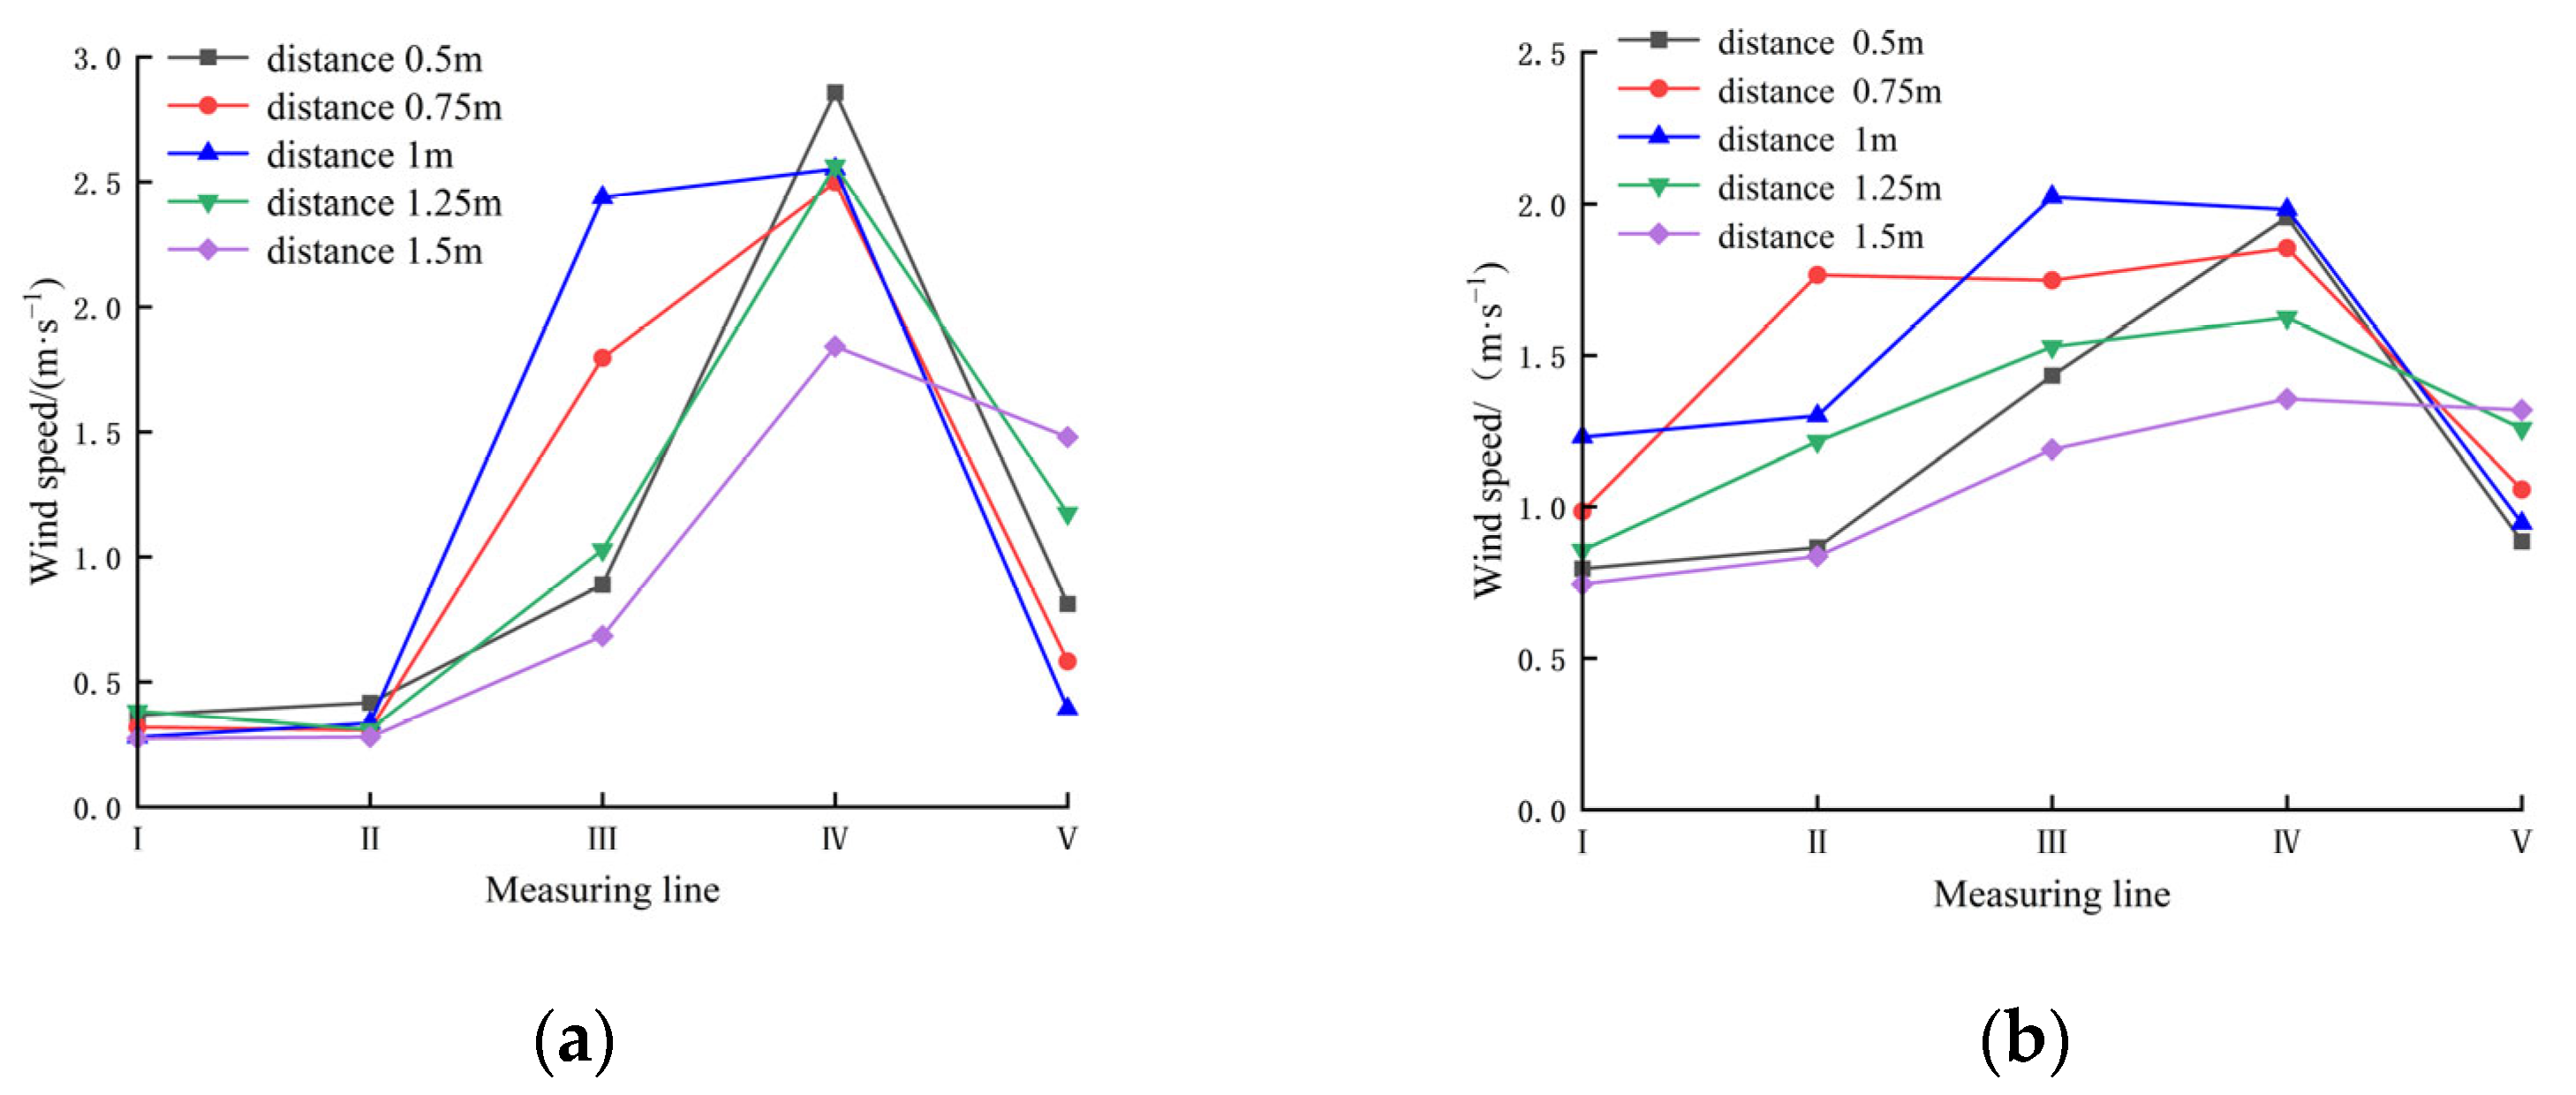
3.3.2. Analysis of the Characteristics of External Space Wind Flow Field

In the analysis of the external airflow field, reliability, and credibility based on simulation models, the optimized air-assisted system with an arc-shaped air outlet with radius of 50 mm and the air-assisted system without an arc-shaped air outlet were selected for the field measurement. The operation of the fan of the air-assisted system was adjusted to maintain a low rotational speed and improve the stability of the data. Data were recorded for each point on five measuring racks in an external airflow field, and the average wind speeds on the longitudinal lines of the five racks, designated as I, II, III, IV, and V, were calculated at five measuring points. These averages were used to determine the average wind speed at different distances from the track on the longitudinal lines. The experimental results before and after the optimization are shown in Figure 10 below.
As shown in Figure 11, for an air-assisted system without an arc-shaped air outlet, the distribution pattern of the airflow field in the spatial distance from the track is basically consistent, with the average wind speed presenting a “left low, right high” shape and the airflow field as a whole shifting towards the right. As a result of the impact of the right-angle turning structure at the inlet and outlet of the duct, the velocity is lowest at the I and II longitudinal lines, with similar wind speeds. As the longitudinal lines reach III and IV, the velocity gradually increases to its maximum, and at the V longitudinal line, the position reaches the boundary of airflow diffusion and the wind speed decreases. After optimization, the jet generated by the air-assisted system exhibits a symmetrical distribution in the space, where the middle is higher and the sides are lower, which is conducive to the neutral atmosphere. The maximum wind speed in the spatial airflow field decreases compared to before optimization, and the wind speed increases at the I and II vertical lines, resulting in an overall increase in the average wind speed in the space. The comparison before and after shows that the optimization of the structure of the arc-shaped air outlet reduces the low-speed area in the space air flow field and alleviates the phenomenon of airflow deviation to the right. Analysis indicates that this is caused by the improvement in wind speed at the annular air outlet, resulting in an increase in the average wind speed and wind speed uniformity, thus increasing the average wind speed in the spatial airflow field and enhancing the uniform distribution of wind speed.

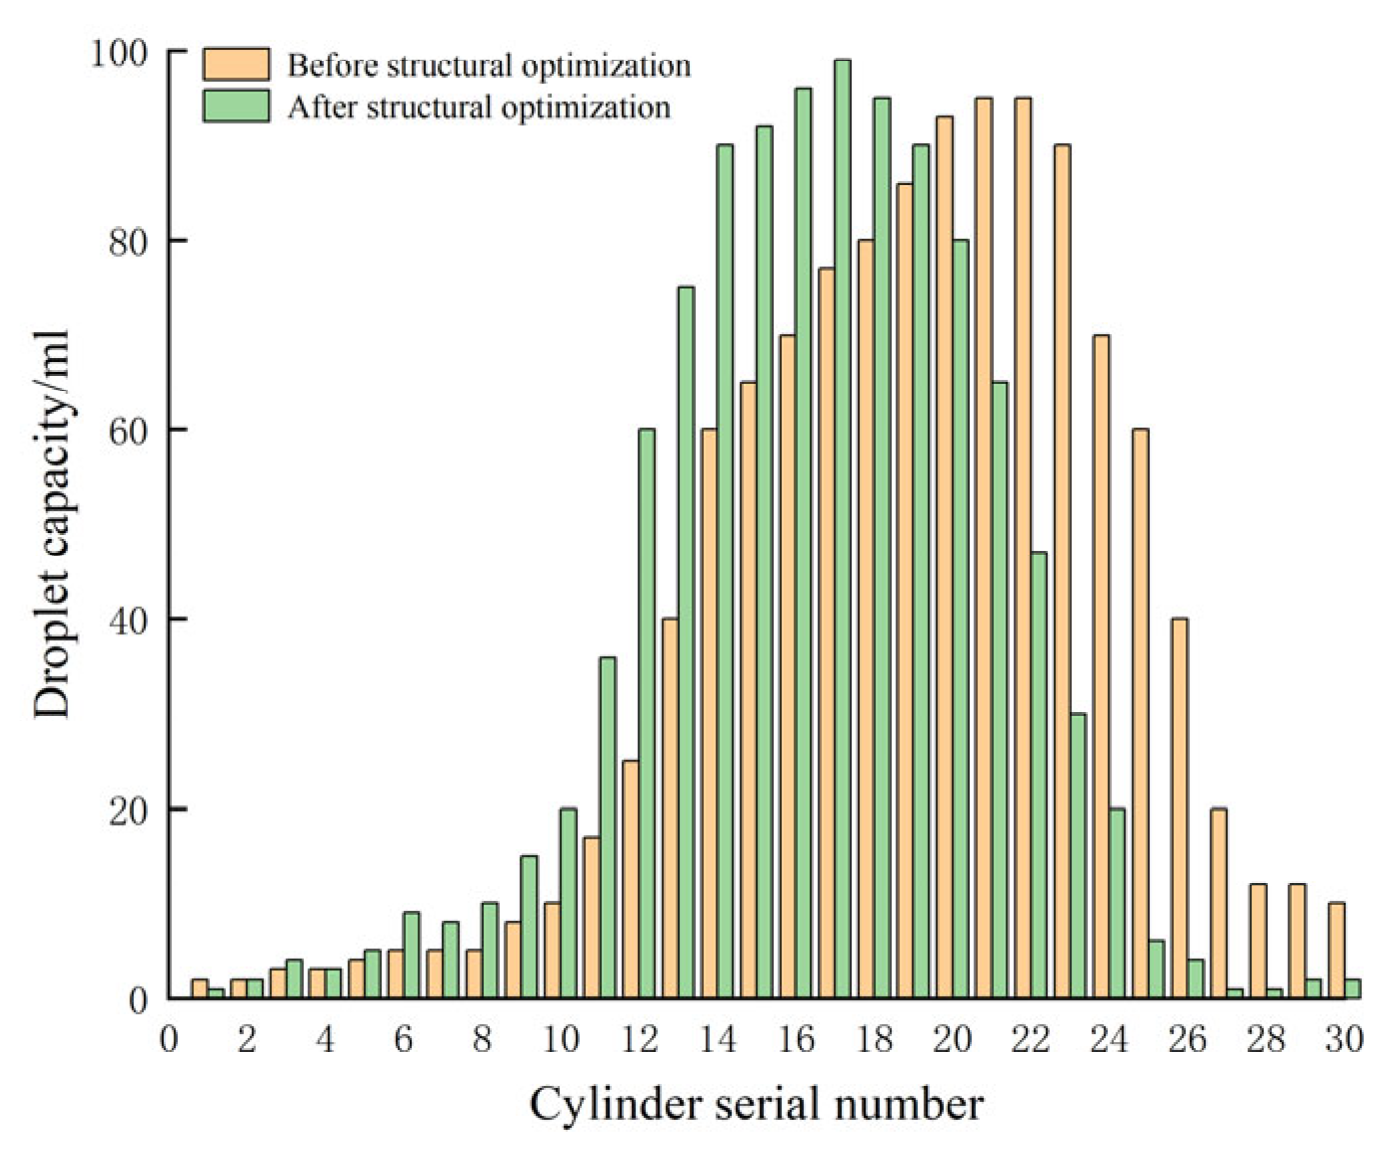
3.3.3. Analysis of Fog Droplet Collection in the Fog Collection Chamber

The data were imported into Origin software to integrate and illustrate the droplet distribution before and after the structural optimization, as shown in Figure 12. From the figure, it can be observed that, prior to structural optimization, the peak distribution of droplets was primarily concentrated around the 22nd graduated cylinder. The droplet quantity on the right side of the collection chamber was higher than that on the left side. The optimization of the arc-shaped air outlet resulted in a leftward shift of the droplet peak, concentrating around the 16th graduated cylinder. Moreover, the quantity of droplets on the right side noticeably decreased compared to pre-optimization. Upon data integration, the droplet drift rate and mass center distance after structural optimization were calculated as 16.5% and 246 mm, respectively. These values decreased by 31.5% and 16.3%, respectively, compared to pre-optimization. These data, in conjunction with pertinent experimental studies, provide substantial and effective experimental results [29,30]. The results indicate that the structural optimization of the arc-shaped air outlet reduced the phenomenon of droplet drift towards one side, effectively confining the range of droplet deposition and reducing the droplet drift rate.

4. Conclusions

(1) An arc-shaped air outlet was designed for an air-assisted system suitable for a traditional orchard sprayer, and it was determined that the arc-shaped air outlet is a key factor affecting the uniformity and magnitude of the internal and external air velocities in the air-assisted system.
(2) Using a CFD simulation, the air-assisted system of an arc-shaped air outlet with different radii of curvature was analyzed, and the optimal radius of curvature was determined to be 50 mm. The average velocity at the outlet increased from 14.95 m/s to 18.20 m/s and the proportion of low-velocity area decreased from 20.83% to 0.71%. The error between the simulation and experimental values was less than 9.52%, and the χ2 value was 0.252 < 15.51 at the significance level of 0.05, which verified the reliability of the numerical simulation results.
(3) The experimental results of the spatial airflow field and the fog collection chamber indicate that the structural optimization of the arc-shaped air outlet enhanced the average wind speed of the outflow field in the air-assisted system, the wind speed distribution changed from a “left low right high “pattern to a “middle high, two sides low” pattern, and the fog droplet distribution was concentrated in the central region. This phenomenon suggests that a uniform improvement in annular air outlet wind speed leads to the uniform distribution of wind speed in the outflow field and a reduction in fog droplet drift.

Author Contributions

Conceptualization, S.J.; methodology, Y.S.; software, S.J. and Y.Z.; validation, L.R., Y.S. and B.L.; formal analysis, X.H.; investigation, S.J.; resources, Y.S. and B.L.; data curation, S.J. and Y.Z.; writing—original draft preparation, S.J.; writing—review and editing, S.J.; visualization, A.G.; supervision, A.G.; project administration, Y.S. and B.L.; funding acquisition, Y.S. and B.L. All authors have read and agreed to the published version of the manuscript.

Funding

This research was funded by the Innovation Team Fund for Fruit Industry of Modern Agricultural Technology System in Shandong Province (SDAIT-06-12, SDAIT-06-11).

Institutional Review Board Statement

Not applicable.

Data Availability Statement

Data are contained within the article.

Acknowledgments

We would like to express my gratitude to everyone who has provided support and advice throughout the research process. We would like to acknowledge the financial support from the Innovation Team Fund for Fruit Industry of Modern Agricultural Technology System in Shandong Province (SDAIT-06-12, SDAIT-06-11).

Conflicts of Interest

The authors declare no conflict of interest.

References

  1. An, Q.; Li, D.; Wu, Y.; Pan, C. Deposition and distribution of myclobutanil and tebuconazole in a semidwarf apple orchard by hand-held gun and air-assisted sprayer application. Pest Manag. Sci. 2020, 76, 4123–4130. [Google Scholar] [CrossRef] [PubMed]
  2. Zheng, Y.J.; Chen, B.T.; Lu, H.T.; Kang, F.; Jiang, S.J. Research progress of orchard plant protection mechanization technology and equipment in China. Trans. Chin. Soc. Agric. Eng. 2020, 36, 110–124. [Google Scholar]
  3. Zhai, C.; Zhao, C.; Wang, X.; Li, W.; Li, W.; Zhu, R. Nozzle test system for droplet deposition characteristics of orchard air-assisted sprayer and its application. Int. J. Agric. Biol. Eng. 2014, 7, 122–129. [Google Scholar]
  4. Qiu, W.; Zhao, S.; Ding, W.; Sun, C.; Lu, J.; Li, Y.; Gu, J. Effects of fan speed on spray deposition and drift for targeting air-assisted sprayer in pear orchard. Int. J. Agric. Bioeng. 2016, 9, 10. [Google Scholar]
  5. Bahlol, H.Y.; Chandel, A.K.; Hoheisel, G.A.; Khot, L.R. The smart spray analytical system: Developing understanding of output air-assist and spray patterns from orchard sprayers. Crop Prot. 2020, 127, 104977. [Google Scholar] [CrossRef]
  6. Salcedo, R.; Pons, P.; Llop, J.; Zaragoza, T.; Campos, J.; Ortega, P.; Gallart, M.; Gil, E. Dynamic evaluation of airflow stream generated by a reverse system of an axial fan sprayer using 3D-ultrasonic anemometers. Effect of canopy structure. Comput. Electron. Agric. 2019, 163, 104851. [Google Scholar] [CrossRef]
  7. Qiu, W.; Sun, H.; Sun, Y.H.; Liao, Y.Y.; Zhou, L.F.; Wen, Z.J. Design and test of circulating air-assisted sprayer for dwarfed orchard. Trans. Chin. Soc. Agric. Eng. 2021, 37, 18–25. [Google Scholar]
  8. He, X.K. Research and development of efficient plant protection equipment and precision spraying technology in China: A review. Acta Phytophylacica Sin. 2022, 49, 389–397. [Google Scholar]
  9. Li, J.; He, M.; Cui, H.; Lin, P.; Chen, Y.; Ling, G.; Huang, G.; Fu, H. Characterizing Droplet Retention in Fruit Tree Canopies for Air-Assisted Spraying. Agriculture 2022, 12, 1093. [Google Scholar] [CrossRef]
  10. Duga, A.; Ruysen, K.; Dekeyser, D.; Nuyttens, D.; Baylemans, D.; Nicolai, B.; Verboven, P. CFD Based Analysis of the Effect of Wind on Orchard Spraying. Chem. Eng. Trans. (CET J.) 2015, 44, 289–294. [Google Scholar]
  11. García-Ramos, F.J.; Malón, H.; Aguirre, A.J.; Boné, A.; Puyuelo, J.; Vidal, M. Validation of a CFD Model by Using 3D Sonic Anemometers to Analyse the Air Velocity Generated by an Air-Assisted Sprayer Equipped with Two Axial Fans. Sensors 2015, 15, 2399–2418. [Google Scholar] [CrossRef]
  12. Lee, I.B.; Bitog, J.P.P.; Hong, S.W.; Seo, I.H.; Kwon, K.S.; Bartzanas, T.; Kacira, M. The past, present and future of CFD for agro-environmental applications. Comput. Electron. Agric. 2013, 93, 168–183. [Google Scholar] [CrossRef]
  13. Hong, S.W.; Zhao, L.; Zhu, H. CFD simulation of pesticide spray from air-assisted sprayers in an apple orchard: Tree deposition and off-target losses. Atmos. Environ. 2018, 175, 109–119. [Google Scholar] [CrossRef]
  14. Hu, Y.; Chen, Y.; Wei, W.; Hu, Z.; Li, P. Optimization design of spray cooling fan based on CFD simulation and field experiment for horticultural crops. Agriculture 2021, 11, 566. [Google Scholar] [CrossRef]
  15. Cheng, H.H.; Chung, W.G. An optimal design for axial-flow fan blade: Theoretical and experimental studies. J. Mech. Sci. Technol. 2012, 26, 427–436. [Google Scholar]
  16. Qu, F.; Sheng, X.Y.; Li, X.; Zhang, J.X.; Li, W.; Liu, J.Y. Improved Design of 3WZF-400A Orchard Air-assisted Sprayer. Trans. Chin. Soc. Agric. Mach. 2017, 48, 15–21. [Google Scholar]
  17. Li, J.P.; Bing, Y.L.; Huo, P.; Wang, P.F.; Xue, C.L.; Yang, X. Design and Experimental Optimization of Spray Device for Air-fed Annular Nozzle of Sprayer. Trans. Chin. Soc. Agric. Mach. 2021, 52, 79–88. [Google Scholar]
  18. Ru, Y.; Chen, X.Y.; Liu, B.; Wang, S.J.; Lin, M. Optimized Design and Performance Test of Axial Flow Orchard Sprayer Air Delivery System. Trans. Chin. Soc. Agric. Mach. 2022, 53, 147–157. [Google Scholar]
  19. Song, S.; Xia, H.; Liu, H.; Hong, T.; Sun, D.; Lu, Y. Numerical Simulation and Experiment of Structural Optimization for Air-blast Sprayer. Trans. Chin. Soc. Agric. Mach. 2013, 44, 73–78+55. [Google Scholar]
  20. Salcedo, R.; Fonte, A.; Grella, M.; Garcerá, C.; Chueca, P. Blade pitch and air-outlet width effects on the airflow generated by an airblast sprayer with wireless remote-controlled axial fan. Comput. Electron. Agric. 2021, 190, 106428. [Google Scholar] [CrossRef]
  21. Fan, G.; Wang, S.; Bai, P.; Wang, D.; Shi, W.; Niu, C. Research on Droplets Deposition Characteristics of Anti-Drift Spray Device with Multi-Airflow Synergy Based on CFD Simulation. Appl. Sci. 2022, 12, 7082. [Google Scholar] [CrossRef]
  22. Hong, S.W.; Zhao, L.; Zhu, H. CFD simulation of airflow inside tree canopies discharged from air-assisted sprayers. Comput. Electron. Agric. 2018, 149, 121–132. [Google Scholar] [CrossRef]
  23. Ou, Y.M.; Liu, Q. Selection and Calculation of Axial Flow Fan on the Air-blast Sprayer. J. Chin. Agric. Mech. 2004, 2, 24–25. [Google Scholar]
  24. Zhang, X.H.; Jiang, Z.Y.; Fan, G.Q.; Cao, L.L. Self-propelled Crawler Directional Air-blowing Orchard Sprayer. Trans. Chin. Soc. Agric. Mach. 2014, 45, 117–122, 247. [Google Scholar]
  25. Dai, F.F. Selection and calculation of the blowing rate of air-assisted sprayers. Plant Prot. 2008, 34, 124–127. [Google Scholar]
  26. Zhai, C.Y.; Zhang, Y.N.; Dou, H.J.; Wang, X.; Chen, L.P. CFD Modeling and Experiment of Airflow at the Air Outlet of Orchard Air-Assisted Sprayer. Smart Agric. 2021, 3, 70–81. [Google Scholar]
  27. GB/T 24683-2009; Standard Test Method for Air-Assisted Sprayers for Trees and Bushes in Plant Protection Machinery. Standardization Administration of China: Beijing, China, 2009.
  28. GB/T20183.2-2006; Agricultural Machinery for Plant Protection—Spraying Equipment. Standardization Administration of China: Beijing, China, 2006.
  29. Li, J.P.; Li, S.B.; Yu, S.M. Deposition Characteristics of Umbrella Wind Field Type Anti-drift Spray Device. Trans. Chin. Soc. Agric. Mach. 2023, 54, 80–91. [Google Scholar]
  30. Hu, J.; Liu, C.X.; Chu, X. Droplet Deposition Characteristics of Conical Wind Field Anti-drift Device. Trans. Chin. Soc. Agric. Mach. 2020, 51, 142–149, 174. [Google Scholar]
Figure 1. Single-track remote-controlled self-propelled sprayer. 1—track, 2—track tractor, 3—control box, 4—arc-shaped air outlet, 5—air duct, 6—fan, and 7—spray tank.
Agriculture 13 02277 g001
Figure 3. Simplified model of an air duct for an air-assisted system. (a) Before structural optimization. (b) After structural optimization.
Agriculture 13 02277 g003
Figure 4. Measurement distribution diagram of air outlet and external airflow field. (a) Schematic diagram of measuring points of the annular air outlet. (b) Punctuation diagram of measuring frame. (c) Measurement frame position distribution. (d) Field measurement frame distribution.
Agriculture 13 02277 g004
Figure 5. Fog collection chamber site layout diagram.
Agriculture 13 02277 g005
Figure 6. The streamlined diagram of the air duct in the air-assisted system. (a) Before structural optimization. (b) After structural optimization.
Agriculture 13 02277 g006
Figure 7. Velocity cloud diagrams at the annular air outlet and cross-section with different fillet radius.
Agriculture 13 02277 g007aAgriculture 13 02277 g007b
Figure 8. Line chart depicting the variation in wind speed at the annular air outlet.
Agriculture 13 02277 g008
Figure 9. Proportion of low-speed area at the annular air outlet.
Agriculture 13 02277 g009
Figure 11. The velocity variation curves of the external airflow field before and after optimization. (a) Before structural optimization. (b) After structural optimization.
Agriculture 13 02277 g011
Figure 12. Structure optimization before and after fog droplet distribution chart.
Agriculture 13 02277 g012
Table 1. Main technical parameters of air-assisted system.
ParametersNumerical
Air duct diameter (mm)520
Length of air duct (mm)180
Number of fan blades (unit)6
Installation angle of fan blades (°)10
Diameter of air baffle (mm)700
Air outlet width (mm)122
Disclaimer/Publisher’s Note: The statements, opinions and data contained in all publications are solely those of the individual author(s) and contributor(s) and not of MDPI and/or the editor(s). MDPI and/or the editor(s) disclaim responsibility for any injury to people or property resulting from any ideas, methods, instructions or products referred to in the content.

