Article

New Insight into Organomineral Interactions in Soils. The Impact of Clay-Size Peat-Derived Organic Species on the Structure and the Strength of Soil Silt Aggregates

1
Institute of Agrophysics, Polish Academy of Sciences, Doświadczalna 4 Str., 20-290 Lublin, Poland
2
Department of Chemical Engineering, Brunel University London, London UB8 3PH, UK
*
Author to whom correspondence should be addressed.
Agriculture 2023, 13(12), 2241; https://doi.org/10.3390/agriculture13122241
Submission received: 17 October 2023 / Revised: 1 December 2023 / Accepted: 2 December 2023 / Published: 5 December 2023
(This article belongs to the Section Agricultural Soils)

Abstract

:
Knowledge of the effects of different organic species on soil structure and strength is gained mostly from experiments on natural soils amended with organic substances of various particle sizes, pH, ionic composition, and inorganic impurities. It greatly diversifies the experimental results and shadows individual effects of organic amendments. Therefore, to look for a clearer view, we examined the impact of HCl-washed clay-size organic species: peat, humic acids, residue after humic acid extraction, and two biochars, all derived from the same peat and having similar particles, on the structure and strength of artificial soil silt aggregates using mercury intrusion porosimetry, bulk density measurements, SEM, and uniaxial compression. Bulk density increased due to humic acid addition and decreased for the other amendments. The total pore volumes behaved oppositely. All organic substances except humic acid decreased the pore surface fractal dimension, indicating a smoothening of the pore surface. Humic acid appeared to occupy mostly the spaces between the silt grains skeleton, while the other species were also located upon silt grains. The latter effect was most evident for 600 °C heated biochar. Humic acid, peat, and the residue after humic acid extraction improved mechanical stability, whereas both biochars weakened the aggregates, which means that bulk density plays a smaller role in the mechanical stability of granular materials, as it is usually considered. A new equation relating maximum stress and the amount of the organic additives was proposed.

Graphical Abstract

1. Introduction

Soil structure is directly connected with soil compaction, aeration, water retention and permeability, microbial activity, and many others [1,2,3,4,5]. Therefore, maintaining proper soil structure is a crucial environmental and agricultural problem. Improper soil structure contributes to the deterioration of water movement and air down the soil profile and temporary waterlogging. Poor soil structure also results in weakened soil stability and exposure to water erosion caused by intensive rainfall and surface run-off. All of the above phenomena may disturb root growth, microbial activity, cycling, and availability of nutrients and consequently lead to inhibition of plant development and growth.
The soil feature directly linked to structural properties is mechanical stability. The strength of soil appears to be managed by bulk density and porosity [6,7], as well as the size [8] and the shape of the grains [9]. Soil structure and strength are also governed by soil components, wherein organic substance is considered to have the highest influence [10,11]. The effect of organic substances on soil structure is largely related to the type of organic amendment, its decomposition stage, rate and frequency of application, and time [12,13,14].
Among many organic substances used as soil structure conditioners, great attention has been given to natural materials. Probably the most significant is peat, which has been intensively used in agriculture for over a hundred years [15]. Its high value as a regulator of soil structure and water-holding capacity is still of interest to many researchers [16,17,18,19]. Recent trends to protect humid environments motivated researchers to replace peat with other biomass derivatives, among which biochar emerged as highly promising [20]. Biochar, as a material with well-developed porosity and surface area as well as high organic carbon content and stability, is currently often used as a pollutant sorbent, carbon sequester, component for fertilizers, or additive for effective improvement of physicochemical and physical properties of soil [21,22]. The impact of biochar on structure formation processes differs due to factor varieties affecting its properties, mainly during production [14,23]. Some studies revealed that biochar application promotes soil aggregation and the stabilization of aggregates [24,25,26]. Moreover, biochar was found to improve the physical properties of soil, especially in terms of reducing swelling, shrinkage, and the surface density of cracks [27]. On the other hand, some reports did not find evidence that biochar application influenced soil porosity, soil aggregation, or aggregate stability [28]. Given the above controversies, further research should be conducted to find the mechanisms underlying the influence of biochar on soil aggregation and stability.
A high potential for the improvement of soil structure and macro-porosity has also been pointed out for strongly humified substances, including humic acids (HA), fulvic acids, and humins [12,29,30]. Imbufe et al. [12] demonstrated that potassium humate improved the aggregate stability of acidic and sodic soils against adverse effects of cyclic seasonal wetting and drying conditions. In turn, Sodhi et al. [31] pointed out that humified and hydrophobic components are of main importance in terms of the long-term stability of soil aggregates. The application of HA has also shown a favorable influence on the texture and structure of degraded soils [30,32]. However, some authors observed a lack of positive responses following HA application to soils [33,34]. A large variety of substrates, with different stages of organic matter transformation, result in extracted HA of varied molecular size, humification degree, the content of polar groups, and aliphatic and aromatic structures [35,36]. Therefore, it is important to test the performance of a single source of HA without extrapolating the results to another source [37]. Moreover, despite the fact that the amount of residue lasting after humic acid extraction is rather high, the literature concerning the addition of such organic material to soils and its effect on soil properties is scant.
As can be concluded from the cited literature, organic substrates have been added to soil mainly in their natural forms, milled granulates composed from rather coarse particles of different granulometric composition and particle shapes, and as suspensions or solutions (humic acids). Such differences make difficult comparisons of the structural effects of various substrates reported by different authors. Also, various chemical compositions of the substrates (ionic composition, ash content, mineral impurities, etc.) may lead to imprecise interpretations of the structure-forming process mechanisms. Moreover, soil type variety, bioclimatic conditions, and management lead to infinite combinations of results that limit their comparison. The above problems and controversies highlight the need for comprehensive research on the specific role of different organic additives in structure formation processes [13]. It seems that to look for the influence of organic substrates on soil structure and strength, materials of similar particle sizes and ionic composition should be studied and compared under the same experimental conditions.
The general concept of the paper was to study the structural and strength properties of soil aggregates amended with different proportions of organic materials, eliminating as many intrinsic and environmental factors affecting the formation of aggregates as possible. Therefore, instead of soil (soils), a silt fraction was used as a matrix for the aggregates’ preparation. This eliminated problems of different soil particle size distributions and the presence of native humus. Since humic acid macromolecules and aggregations have the smallest particle sizes among the natural organic species planned to be studied [38,39], it has been aimed to prepare similar size particles from the other materials. In detail, the effect of clay-size, purified organic substrates on the structure and strength of silt aggregates was studied, hoping to understand the relationship between the physicochemical parameters of the organic substances and the stabilization processes of soil particles.

2. Materials and Methods
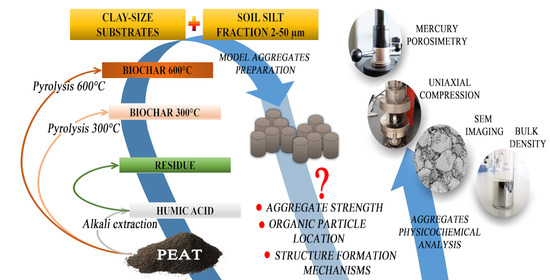
2.1. Substrates

  • SILT: Silt fraction with a particle size range of 2–50 µm coming from the upper 0–10 cm layer of Haplic Luvisol containing 66% sand (2–0.02 mm), 28% silt (0.02–0.002 mm), and 6% clay (<0.002 mm), described in detail by Lipiec et al. [40], was used as skeletal material. Clay particles were discarded from the soil by sedimentation (4:100 solid: liquid w/w ratio), and sand particles by wet sieving. Then, the material was treated with hydrogen peroxide to remove native organic matter (if any), intensively washed with NaCl, and then with water. The silt was composed mainly from feldspars and quartz.
  • PEAT: An acidic peat bought in a garden shop (pH ≈ 4), fragmented by a 3-min treatment with an ordinary kitchen blender and depleted from sand by sedimentation, was intensively washed with 0.1 mol·L−1 hydrochloric acid to remove inorganic substances and next with distilled water by centrifuging to pH around 4, air dried, and finely milled in a ball mill.
  • HA: Humic acids extracted from the PEAT using 0.5 mol·L−1 sodium hydroxide, precipitated with HCl at pH = 1 and washed with distilled water by centrifuging to pH around 4.
  • RES: The residue remaining after HA extraction was washed with 0.1 mol·L−1 HCl and next with distilled water by centrifuging to pH around 4. Material was lyophilized and finely ground in a ball mill.
  • BC300: Biochar produced by heating the PEAT at 300 °C under limited air access, washed with 0.1 mol·L−1 HCl and next with distilled water by centrifuging to a pH of around 4, air dried and finely milled in a ball mill.
  • BC600: Biochar produced by heating the PEAT at 600 °C under limited air access, washed with 0.1 mol·L−1 HCl and next with distilled water by centrifuging to a pH of around 4, air dried and finely milled in a ball mill.
The choice of the two pyrolysis temperatures biochars was based on the well-recognized chemical changes occurring in plant-derived biomass. The literature shows that the pyrolysis temperature of ~300 °C results in the decomposition of hemicellulose and cellulose, while the temperature of ~600 °C also covers the decomposition of lignin [41,42]. Moreover, most carboxyl and phenolic groups are degraded, and the product is enriched with mineral parts and more thermally resistant aromatic structures under higher pyrolysis temperatures [43,44]. It was assumed that significant chemical and structural differences in biochars produced at 300 and 600 °C should significantly affect the structure and strength of soil silt aggregates.
The selection of one native organic material (peat) and peat-derived products obtained on the way of various processes resulted from the intention to reduce factors that may hinder the understanding of the structure-forming mechanisms. Thus, it was assumed that changes in the chemical properties of organic additives should result only from the processing of the initial material (peat) and not from different biomass. In other words, the aim was to analyse the structural impact of one family of materials that differed in the quality and quantity of parent organic constituents. PEAT was an example of an additive with a high content of poorly humified organic matter reach of hemicellulose, cellulose, and lignin. Two biochars (BC300 and BC600) represented thermally processed biomass with different degrees of carbonization and decarboxylation. HA was a relatively stable, high-molecular fraction of well-humidified organic matter, rich in aliphatic chains, condensed aromatic rings, and oxygen-containing functional groups. RES was an example of an additive containing remains of poorly humified organic matter and strongly bound humins.

2.2. Characteristics of the Substrates

  • Substrates (solid phase) densities, SPD [kg·m−3], were estimated by helium pycnometry using an automatic device Ultrapycnometer 1000 (Quantachrome Instruments, Boynton Beach, FL, USA) in five replicates.
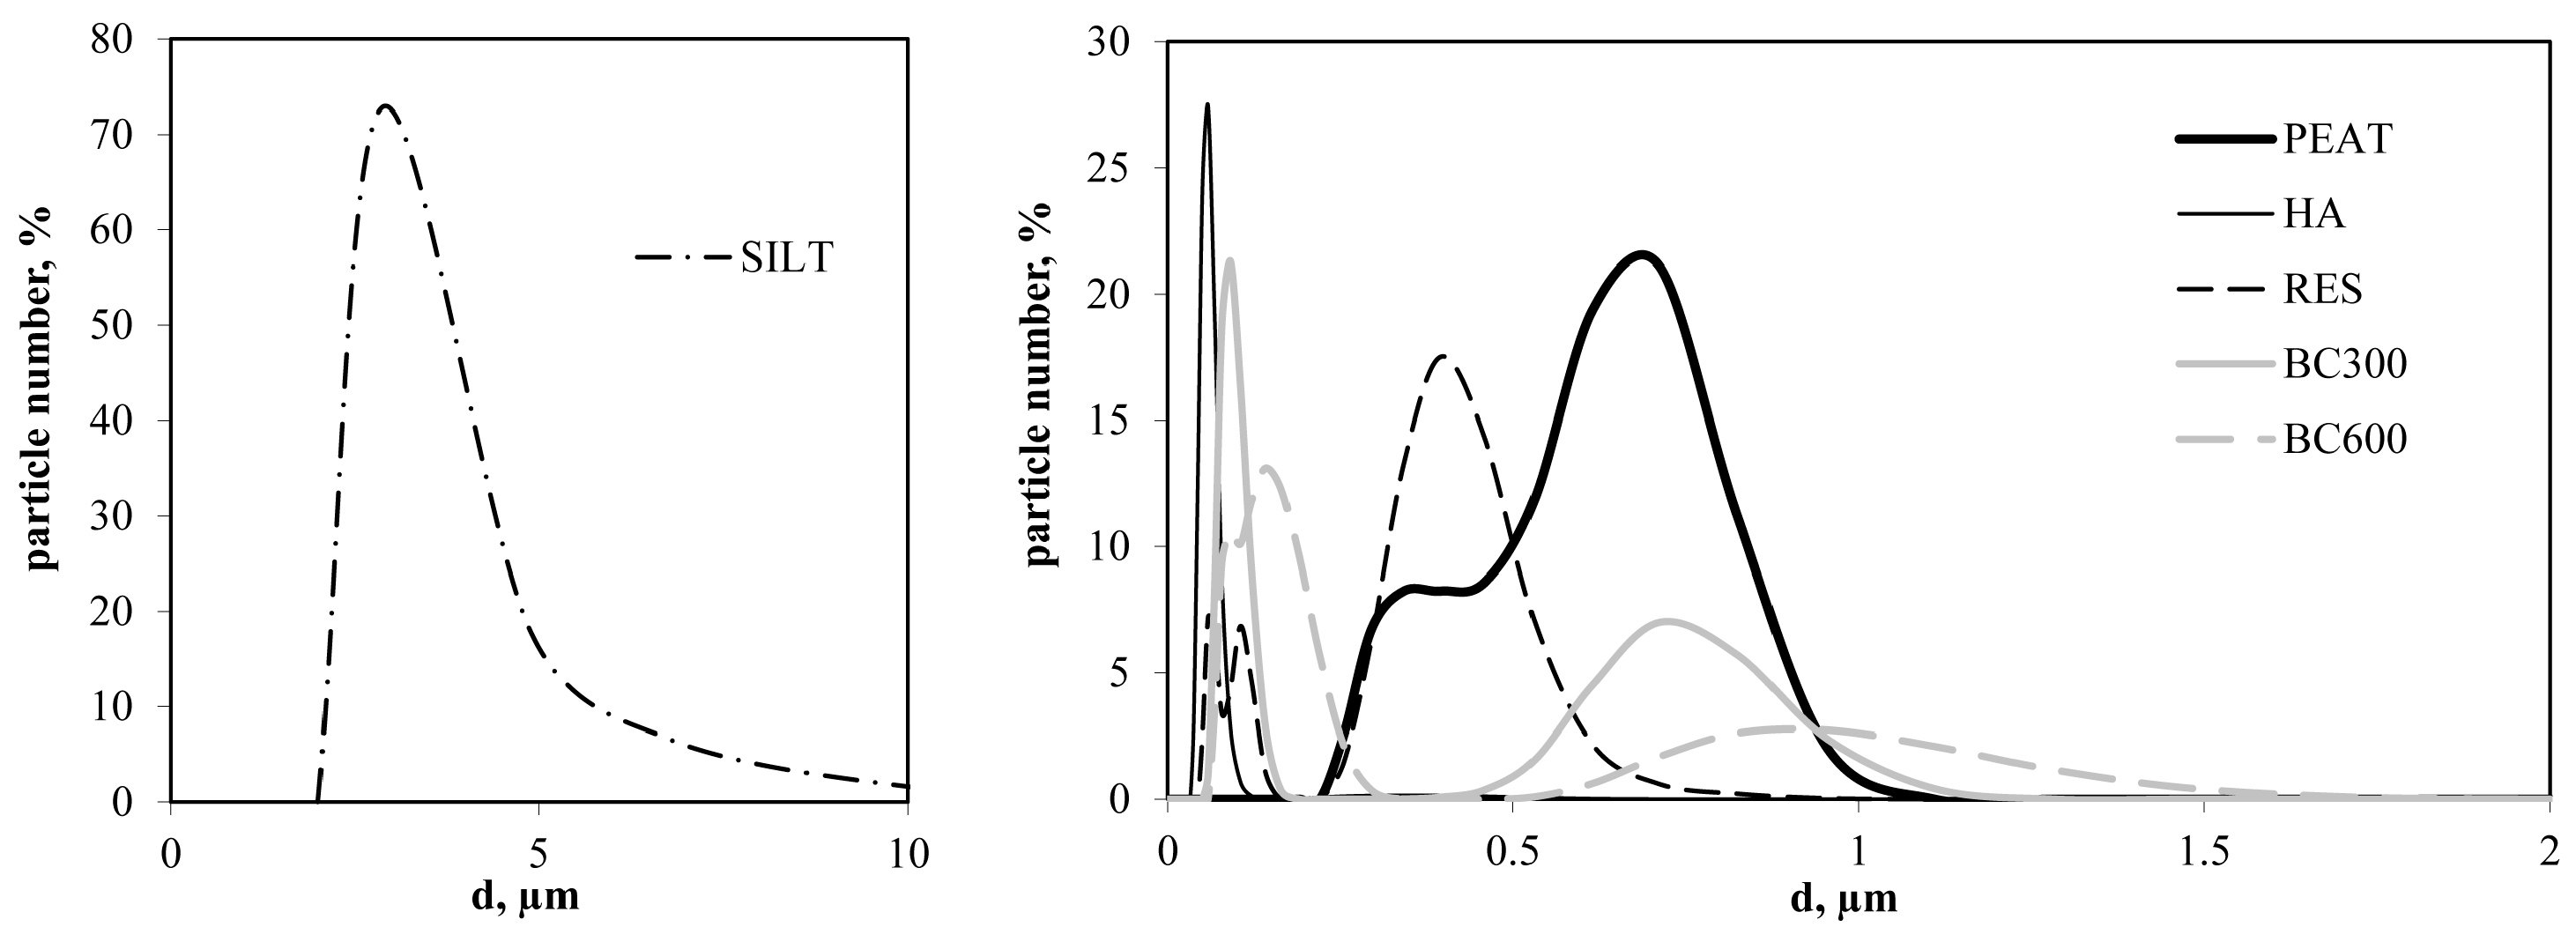
  • Organic amendments were ground intensively to uniformize their particle sizes and remove impurities, which allowed the joining of the aggregate properties with the measured surface and physicochemical parameters. Particle size distribution, PSD, of the organic substrates was determined at 25 °C for suspensions of 100 mg·dm−3 materials in 1 L of 0.01 mol·L−1 sodium hexametaphosphate/0.015 mol·L−1 sodium bicarbonate solution using a ZetaSizer Nano ZS instrument (Malvern Ltd., Leamington, UK) device in six replicates. The distribution of the silt was not measured with the ZetaSizer due to large particles sedimented in the electric field. Therefore, this characteristic was determined using a laser diffraction method using Malvern Mastersizer 2000, as described by Ryzak and Bieganowski [45]. The PSD functions were expressed as the number of particles of a given radius in the total number of particles. The average particle diameter, d [m], was then calculated from PSD functions.
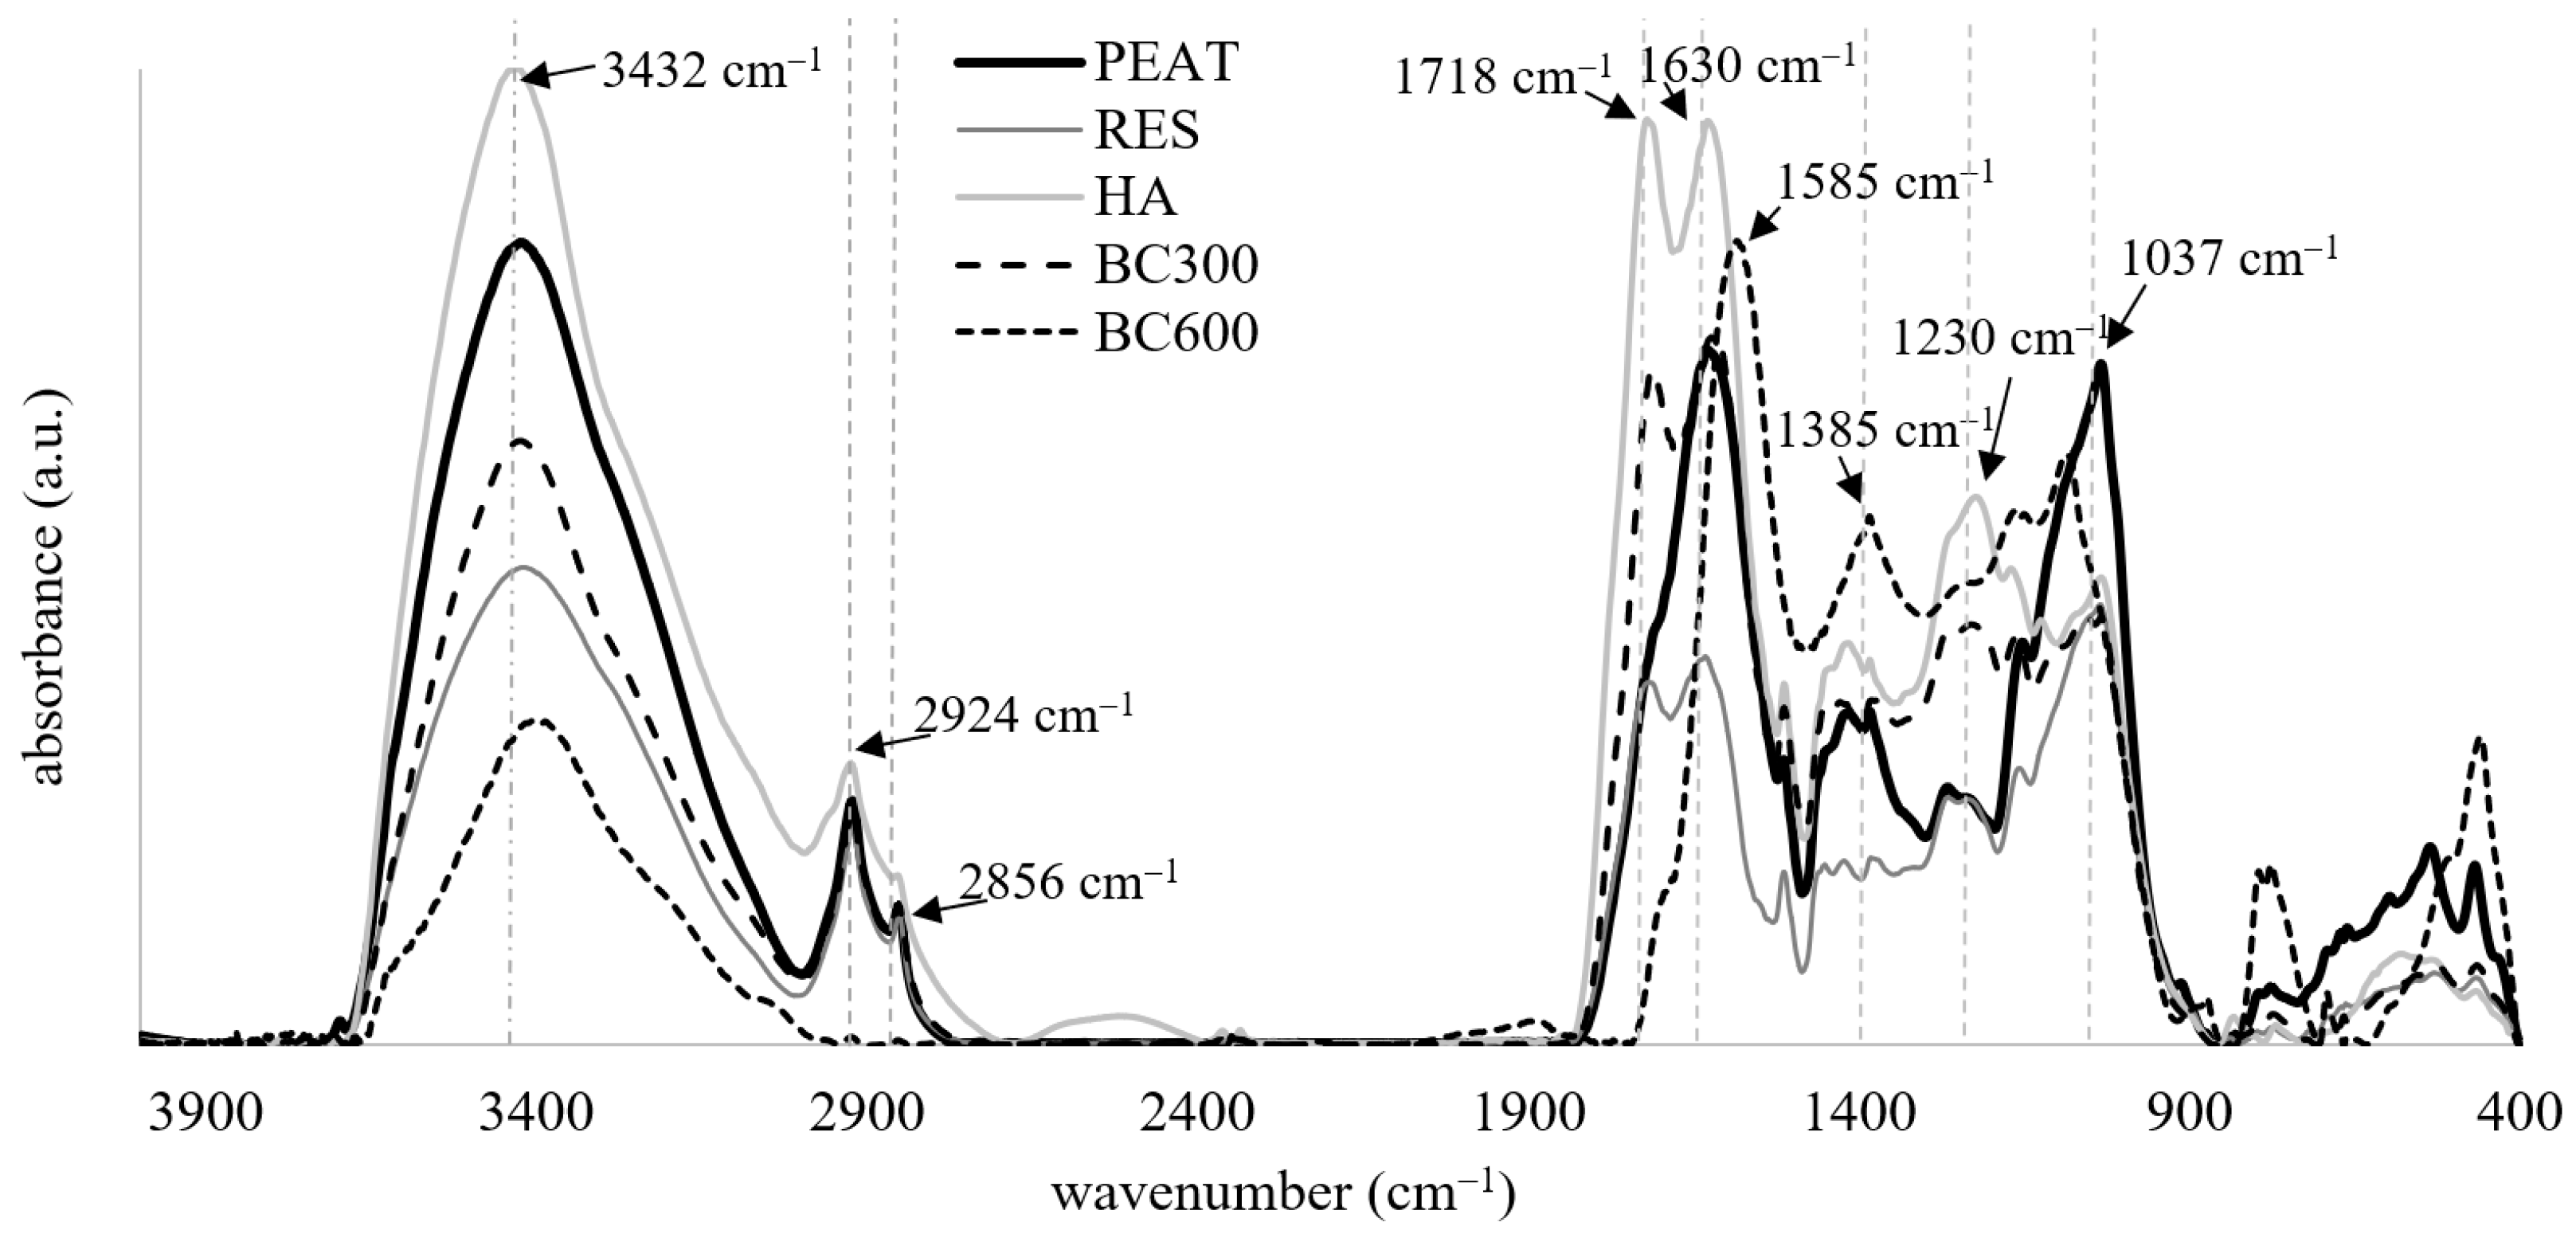
  • FTIR characteristics were recorded for dried organic substrates (105 °C) using a Tensor 27 spectrometer (Bruker Corporation, Billerica, MA, USA) in 400–4000 cm−1 range. Briefly, 1 mg of each powdered sample was homogenised with 200 mg of spectral purity bromide potassium and pelletized. The spectra were obtained as an average of three measurements with 256 scans at 2 cm−1 resolution each. The transmittance signals were converted to absorbance, and the characteristics were prepared using concave rubber band correction of the baseline, vector normalization, and smoothing function.
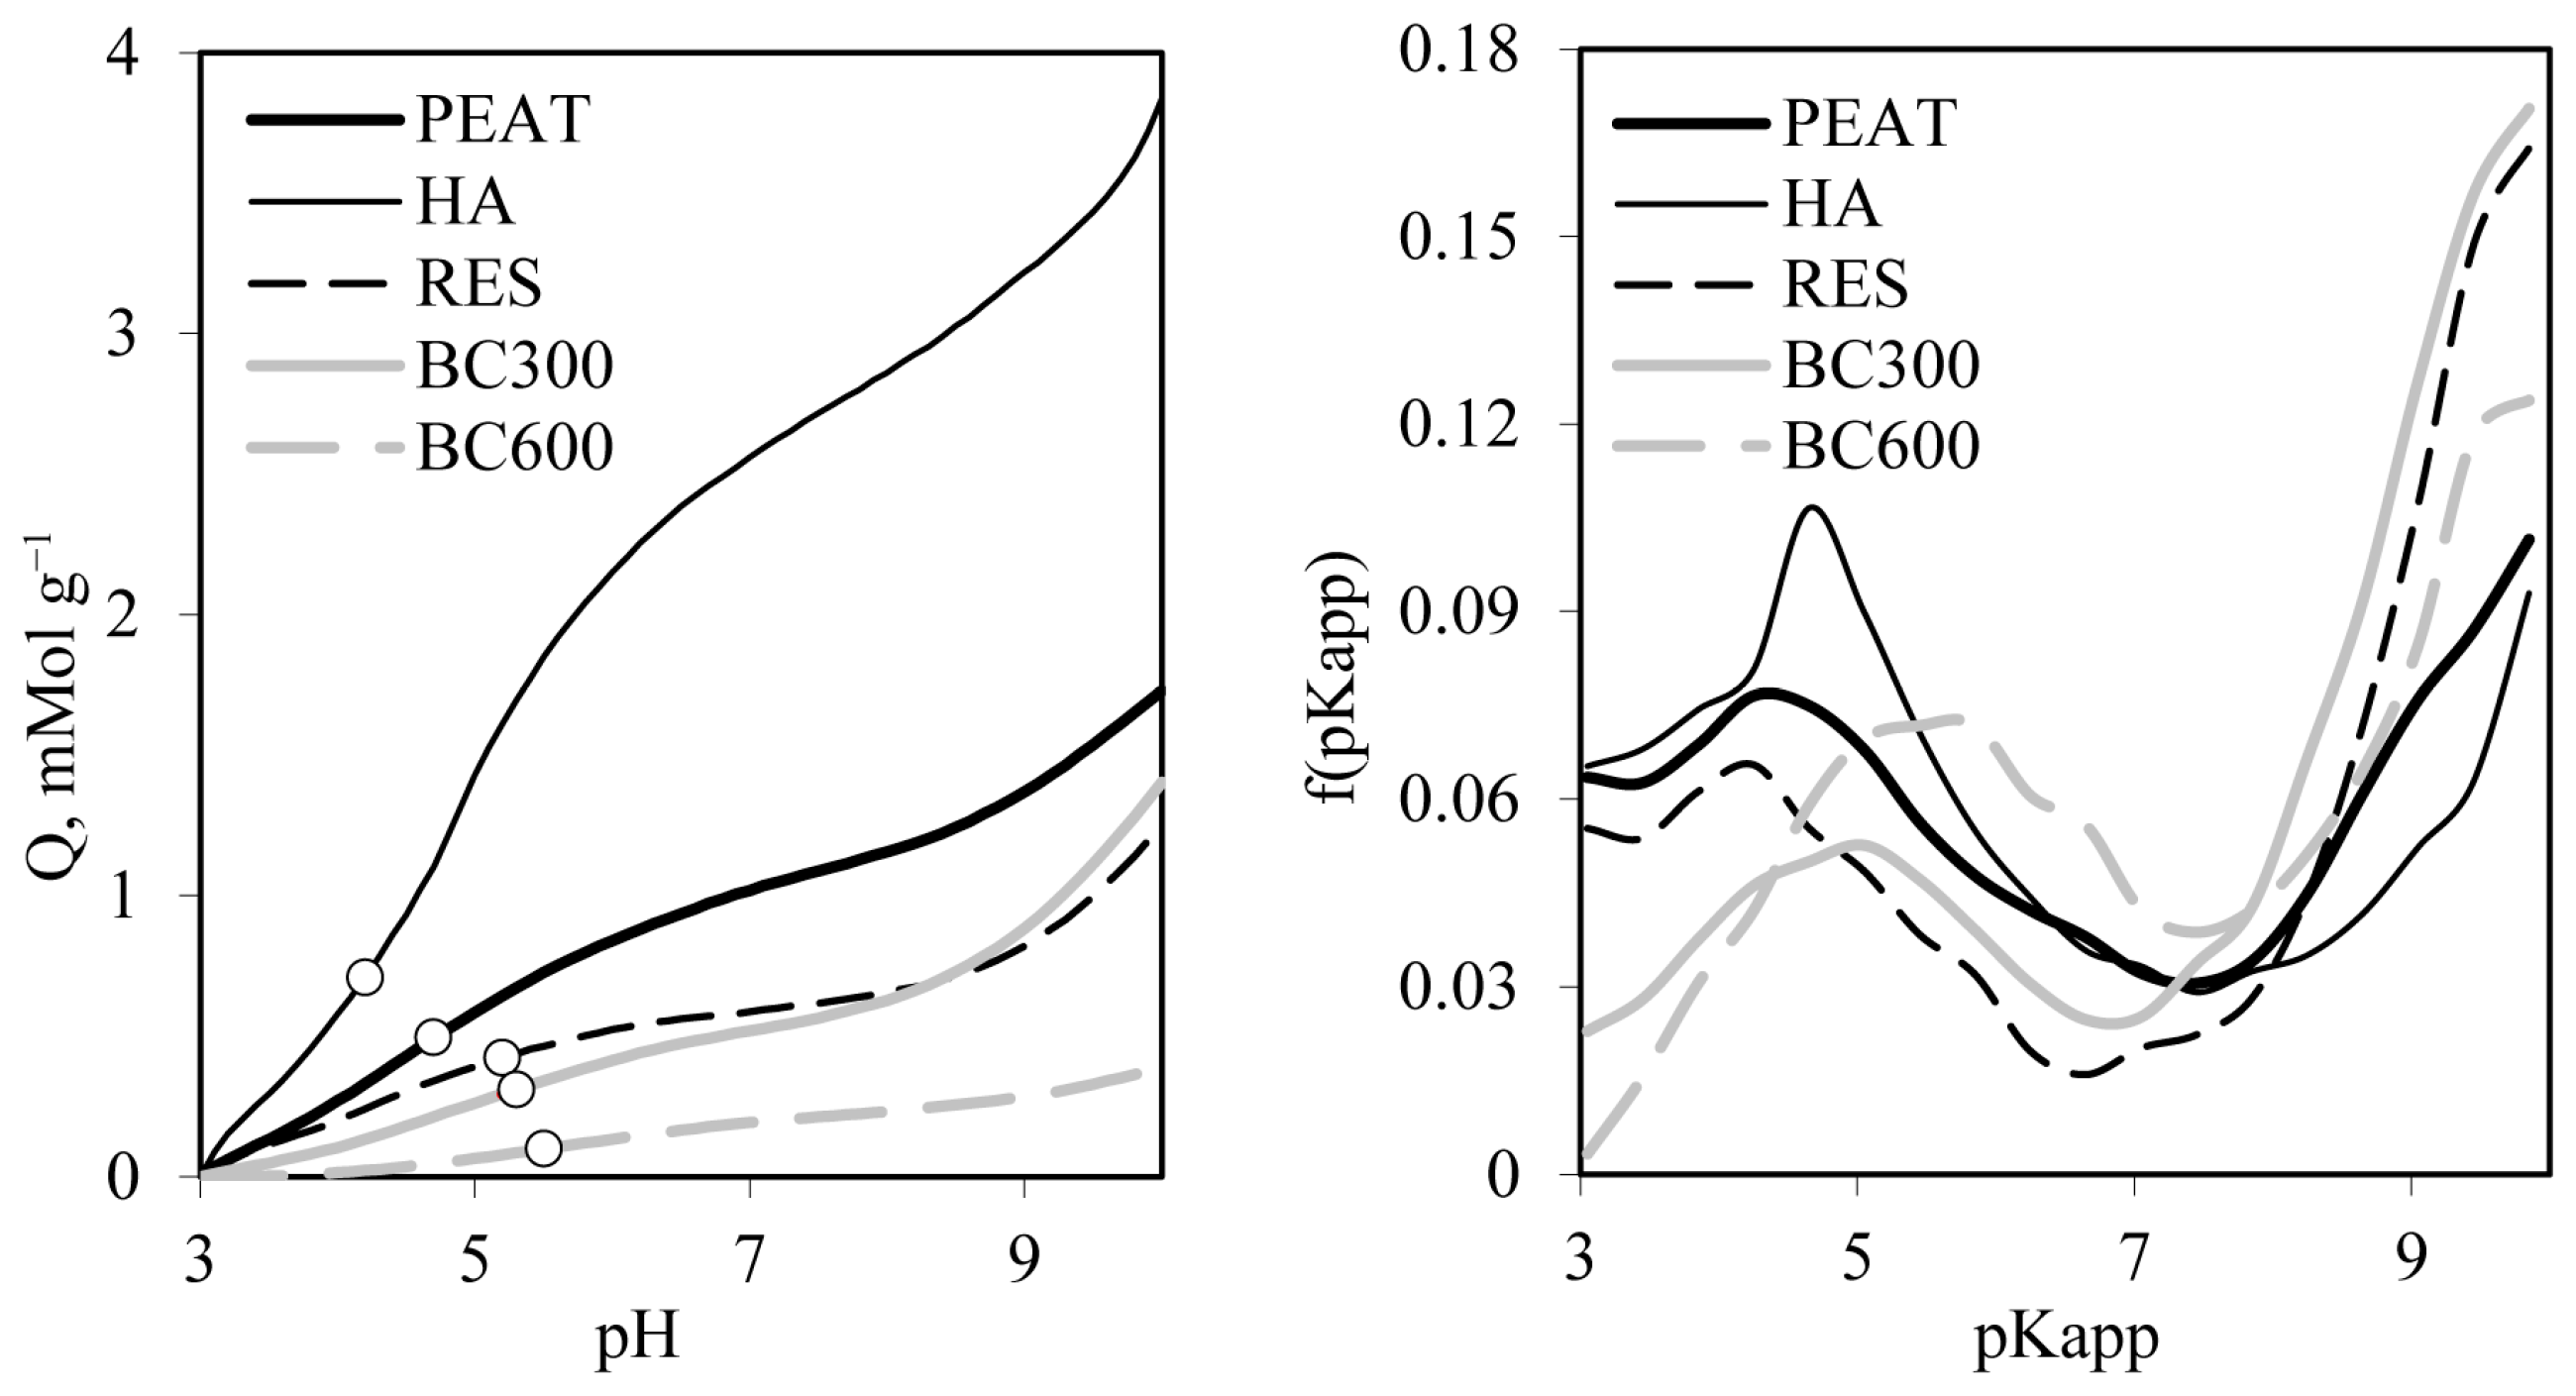
  • Dependencies of variable surface charge—Q [mol·g−1] on pH, distribution functions of apparent surface dissociation constants, and their average values were determined from titration curves measured using Titrino 702SM autotitration unit (Metrohm A.G., Herisau, Switzerland). A suspension of a particular material was equilibrated overnight with 1 mol·L−1 NaCl solution and then adjusted to pH =3.0 and titrated by 60 s increments of 1 μL 0.100 mol·L−1 NaOH/1 mol·L−1 NaCl solution to pH = 10 under N2 flux. The measurements were performed in triplicate. From the averaged titration curve of the sample suspended in liquid, the titration curve of its equilibrium solution (1 mol·L−1 NaCl) was subtracted to obtain the titration curve of the solid phase. The data of the latter curve were expressed as the variable surface charge pH dependence. Under the assumption that surface acids dissociate stepwise, the actual pH is −log of the apparent surface dissociation constant, pKapp. The first derivative of the Q(pKapp) curve on pKapp gives the distribution function of apparent surface dissociation constants, f(pKapp), and the average value of pKapp in the whole experimental window, pKapp,av, was calculated as ∫f(pKapp)dpKapp. More details on the method and calculations are presented in Jozefaciuk et al. [46].

2.3. Aggregates

Carefully homogenized distilled-water-saturated pastes were prepared from the substrates and the mixtures of the silt and the organic materials. The amount of water needed to prepare the model aggregates was determined before the experiment based on the maximum water capacity of particular components. The content of organic materials in the mixtures, established in preliminary experiments, was 0.5, 1, 2, and 4% for HA and 2, 4, 8, and 16% (w/w, dry mass) for the other substrates. The percentage of HA markedly differed because the aggregate preparation containing 8% or more of HA was extremely difficult. Pastes were homogenized by hand-mixing with a glass piston for around 20 min. The above pastes were pushed by hand into 10 mm diameter boreholes made in 20 mm thick Plexiglas plates and air dried. When dried, the excess of the material lasting on the plates was gently removed with a fine sandpaper, which allowed us to level the surfaces and make them parallel. Cylindrical aggregates prepared in such a way were removed from the boreholes. All aggregates were conditioned in a laboratory atmosphere (a relative humidity of around 60% and a temperature of around 20 °C) to reach constant mass. Selected aggregates were used for mechanical stability measurements, while halves of the other were used for mercury intrusion porosimetry tests. Because of difficulties in their formation, the aggregates of the pure HA were not prepared. A similar method of preparing aggregates was also presented in the work [47].

2.4. Characteristics of the Aggregates

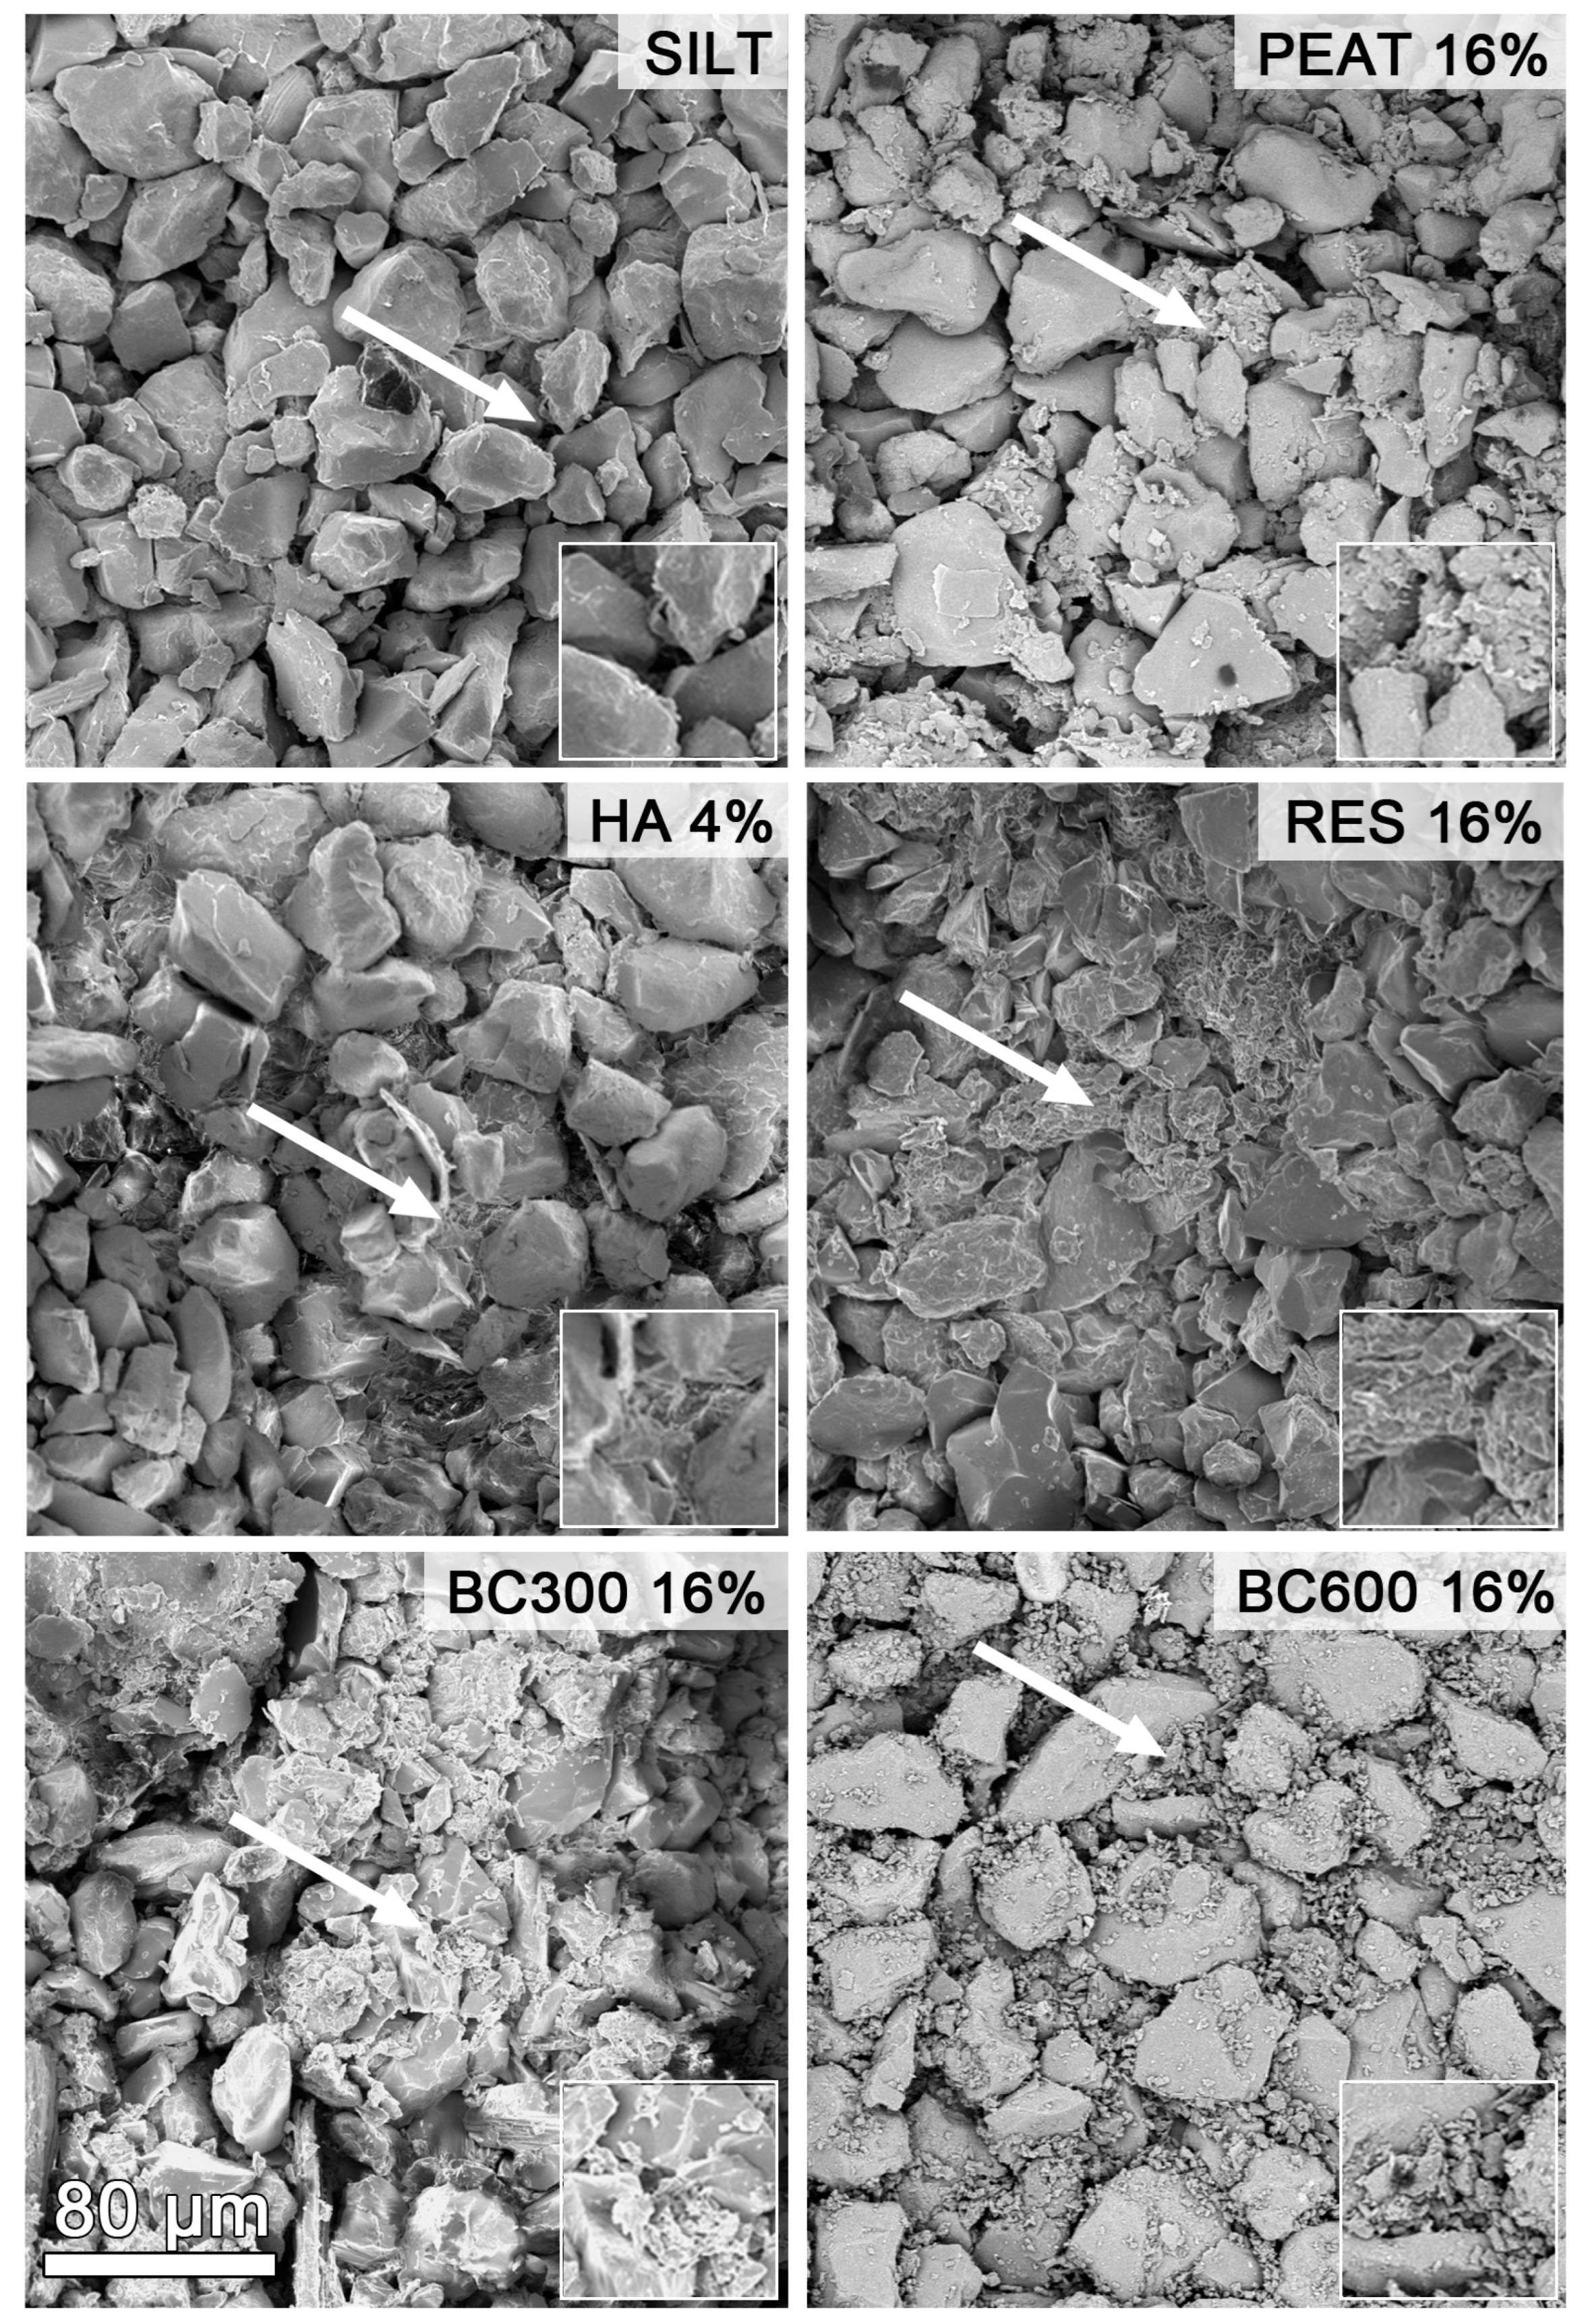
  • Magnified images (1000×) of the surfaces of the aggregates broken by hand were taken using the Phenom ProX desktop SEM provided by Thermo Fisher Scientific (Waltham, MA, USA). Samples were placed on aluminium stubs by double-sided carbon tape and sputtered with a 5 nm gold layer (sputter coater, CCU-010 LV, Safematic GmbH, Zizers, Switzerland). The imaging was conducted in BSE mode at an accelerating voltage of 10 kV. Representative images were selected.
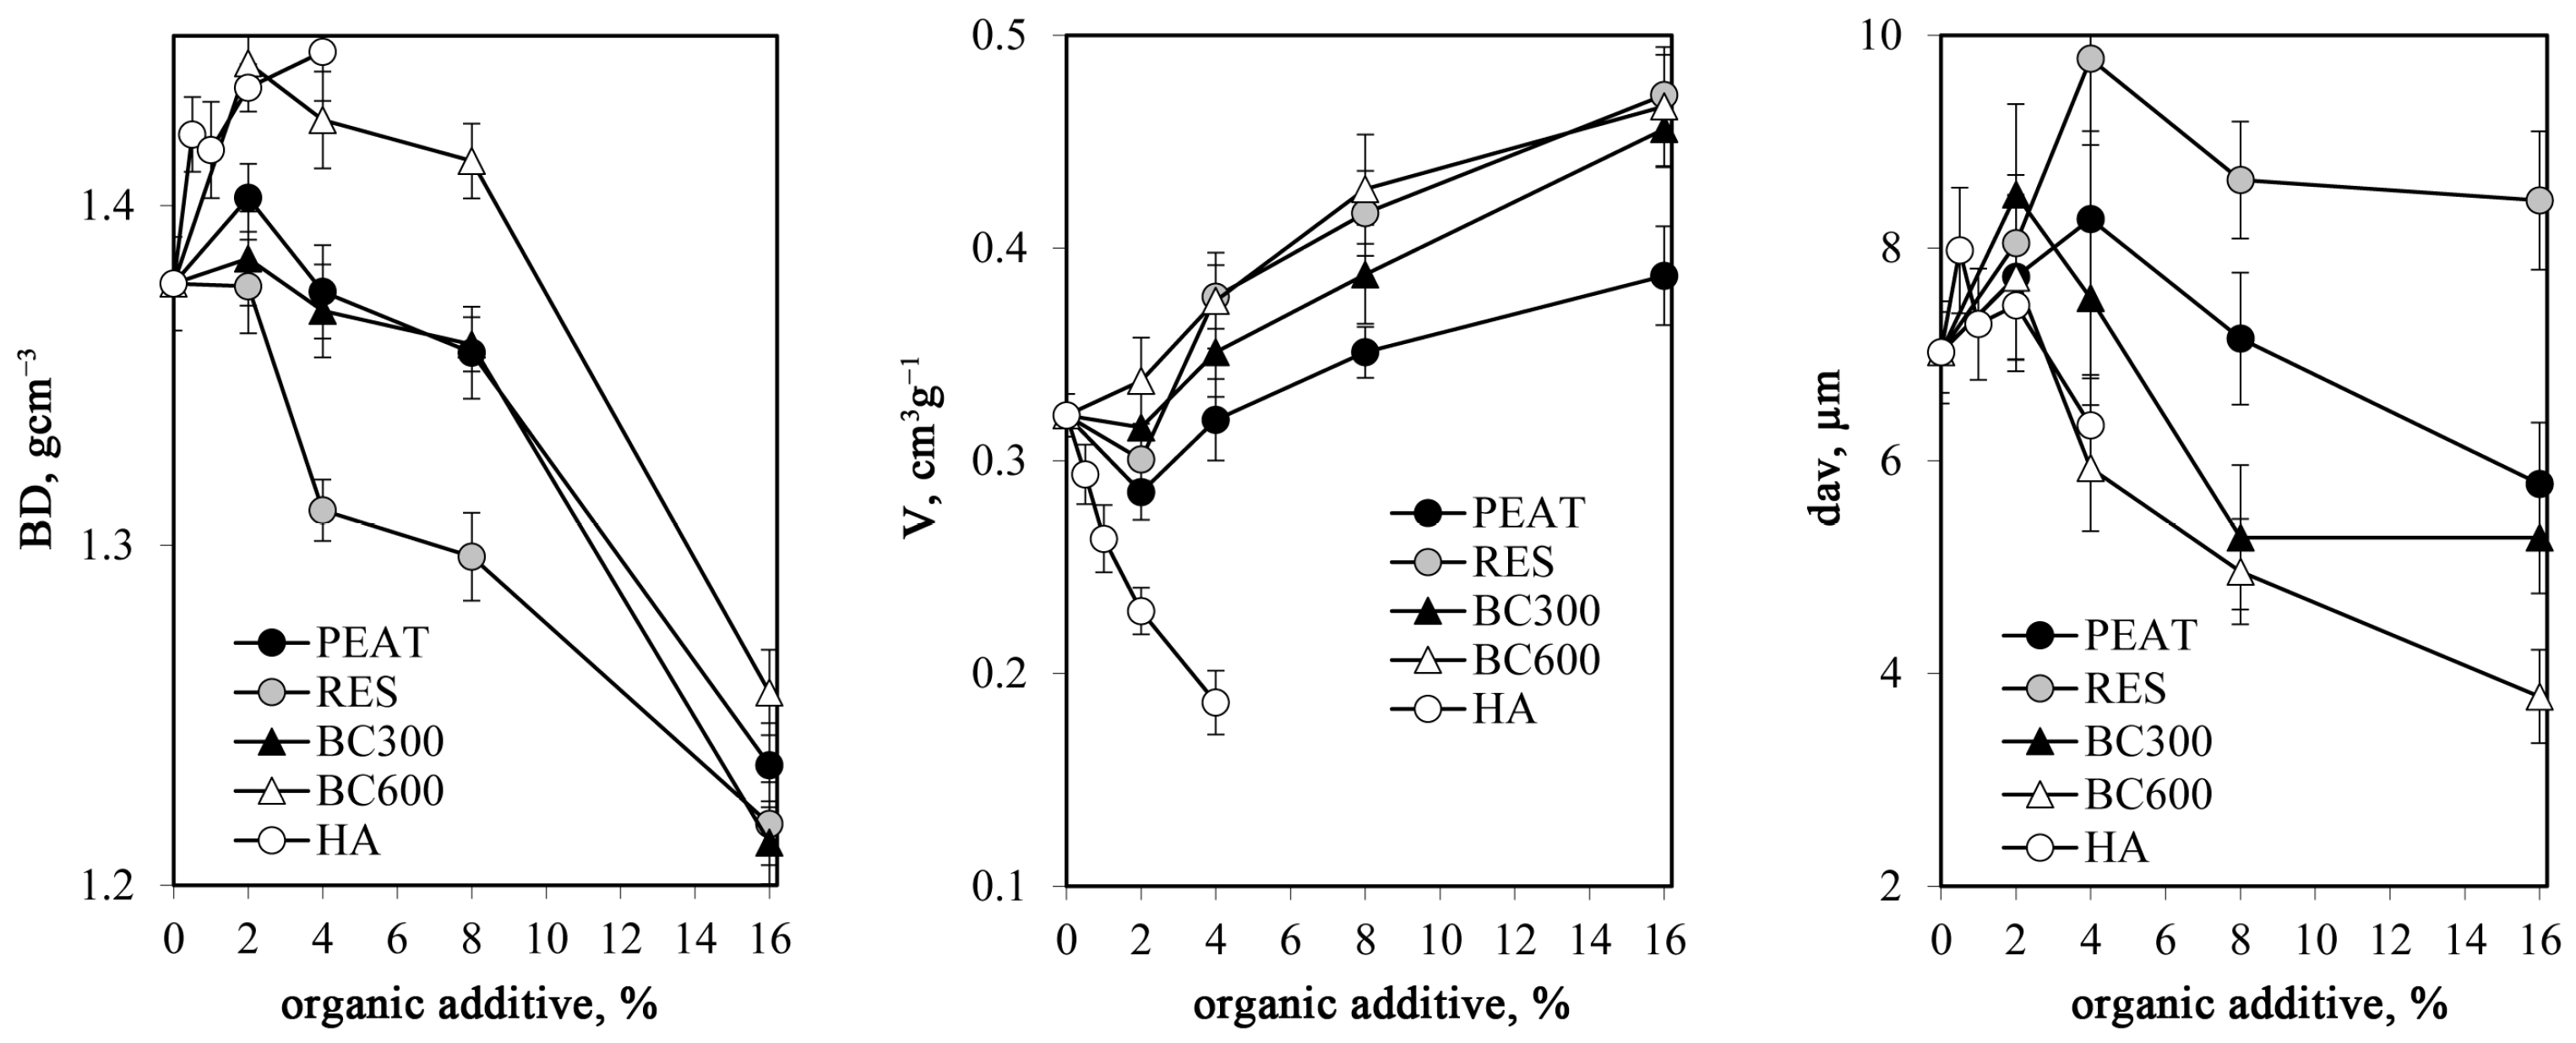
  • The bulk density, BD [g·cm−3], was estimated for air-dry specimens. The aggregate mass (minus its water content) was divided by the aggregate volume measured by its compulsive immersion in mercury. The water content in the aggregates was measured by weighing them after overnight heating at 105 °C. The measurements were replicated five times.
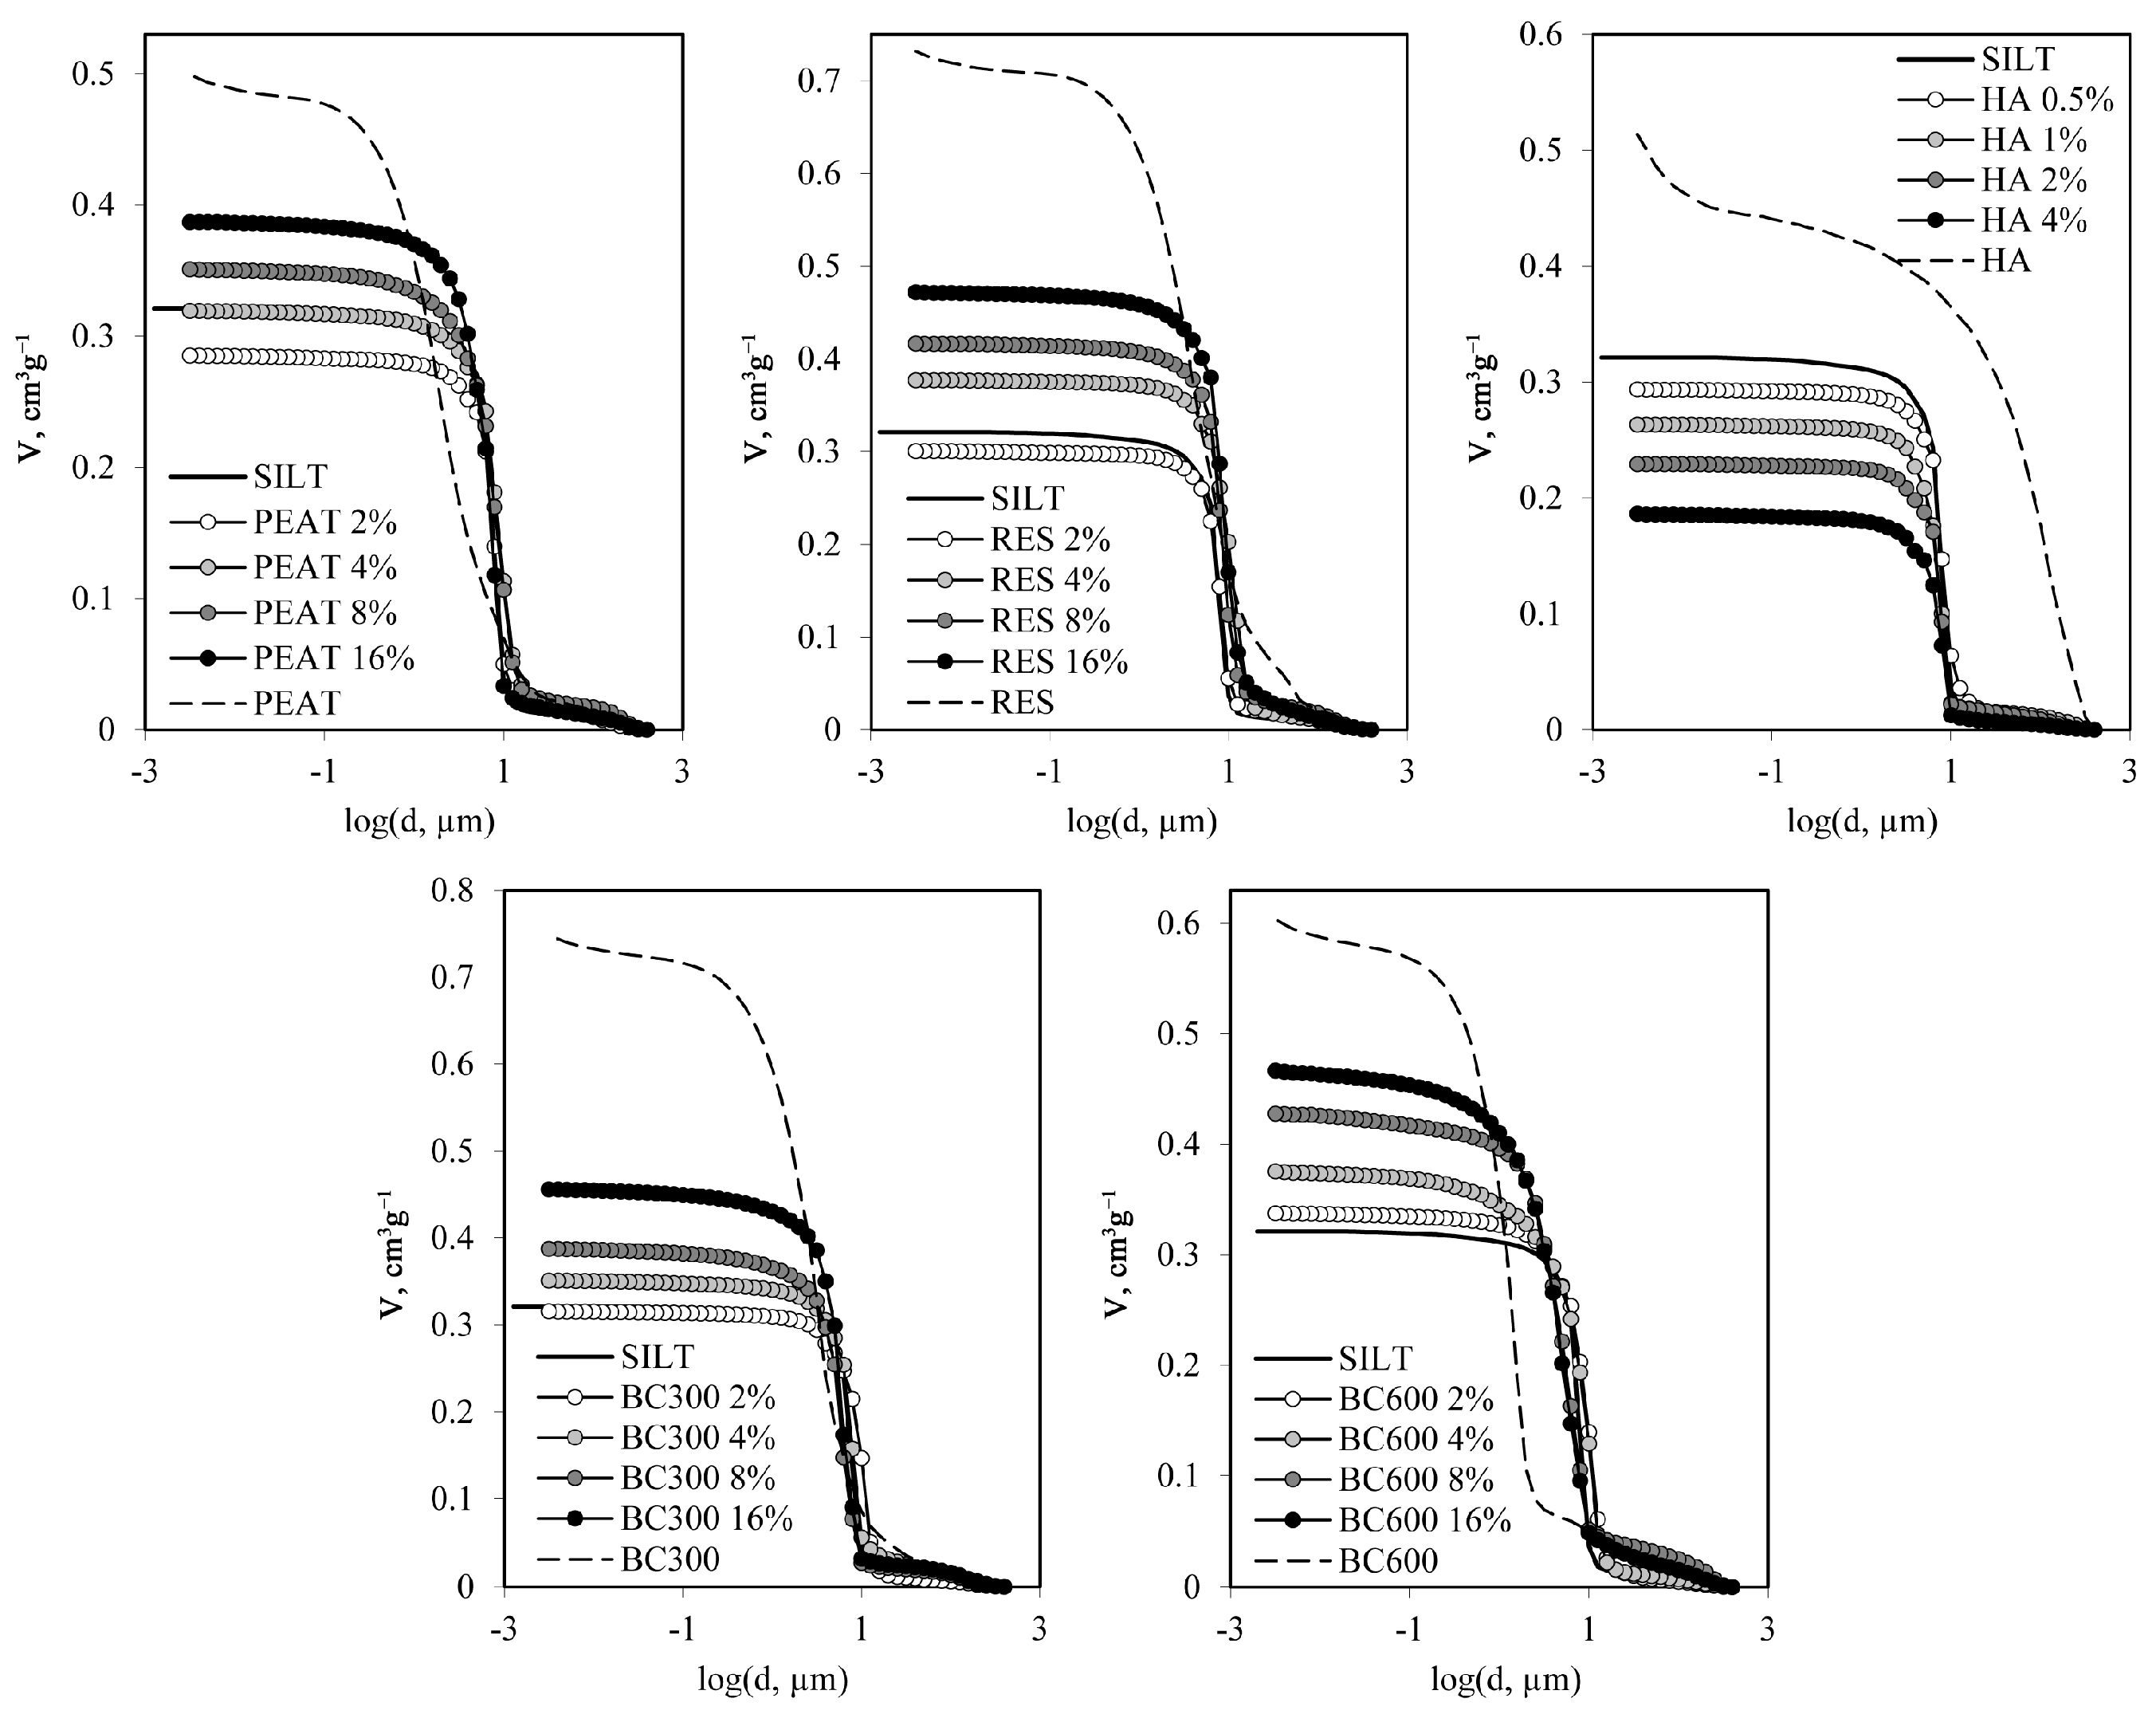
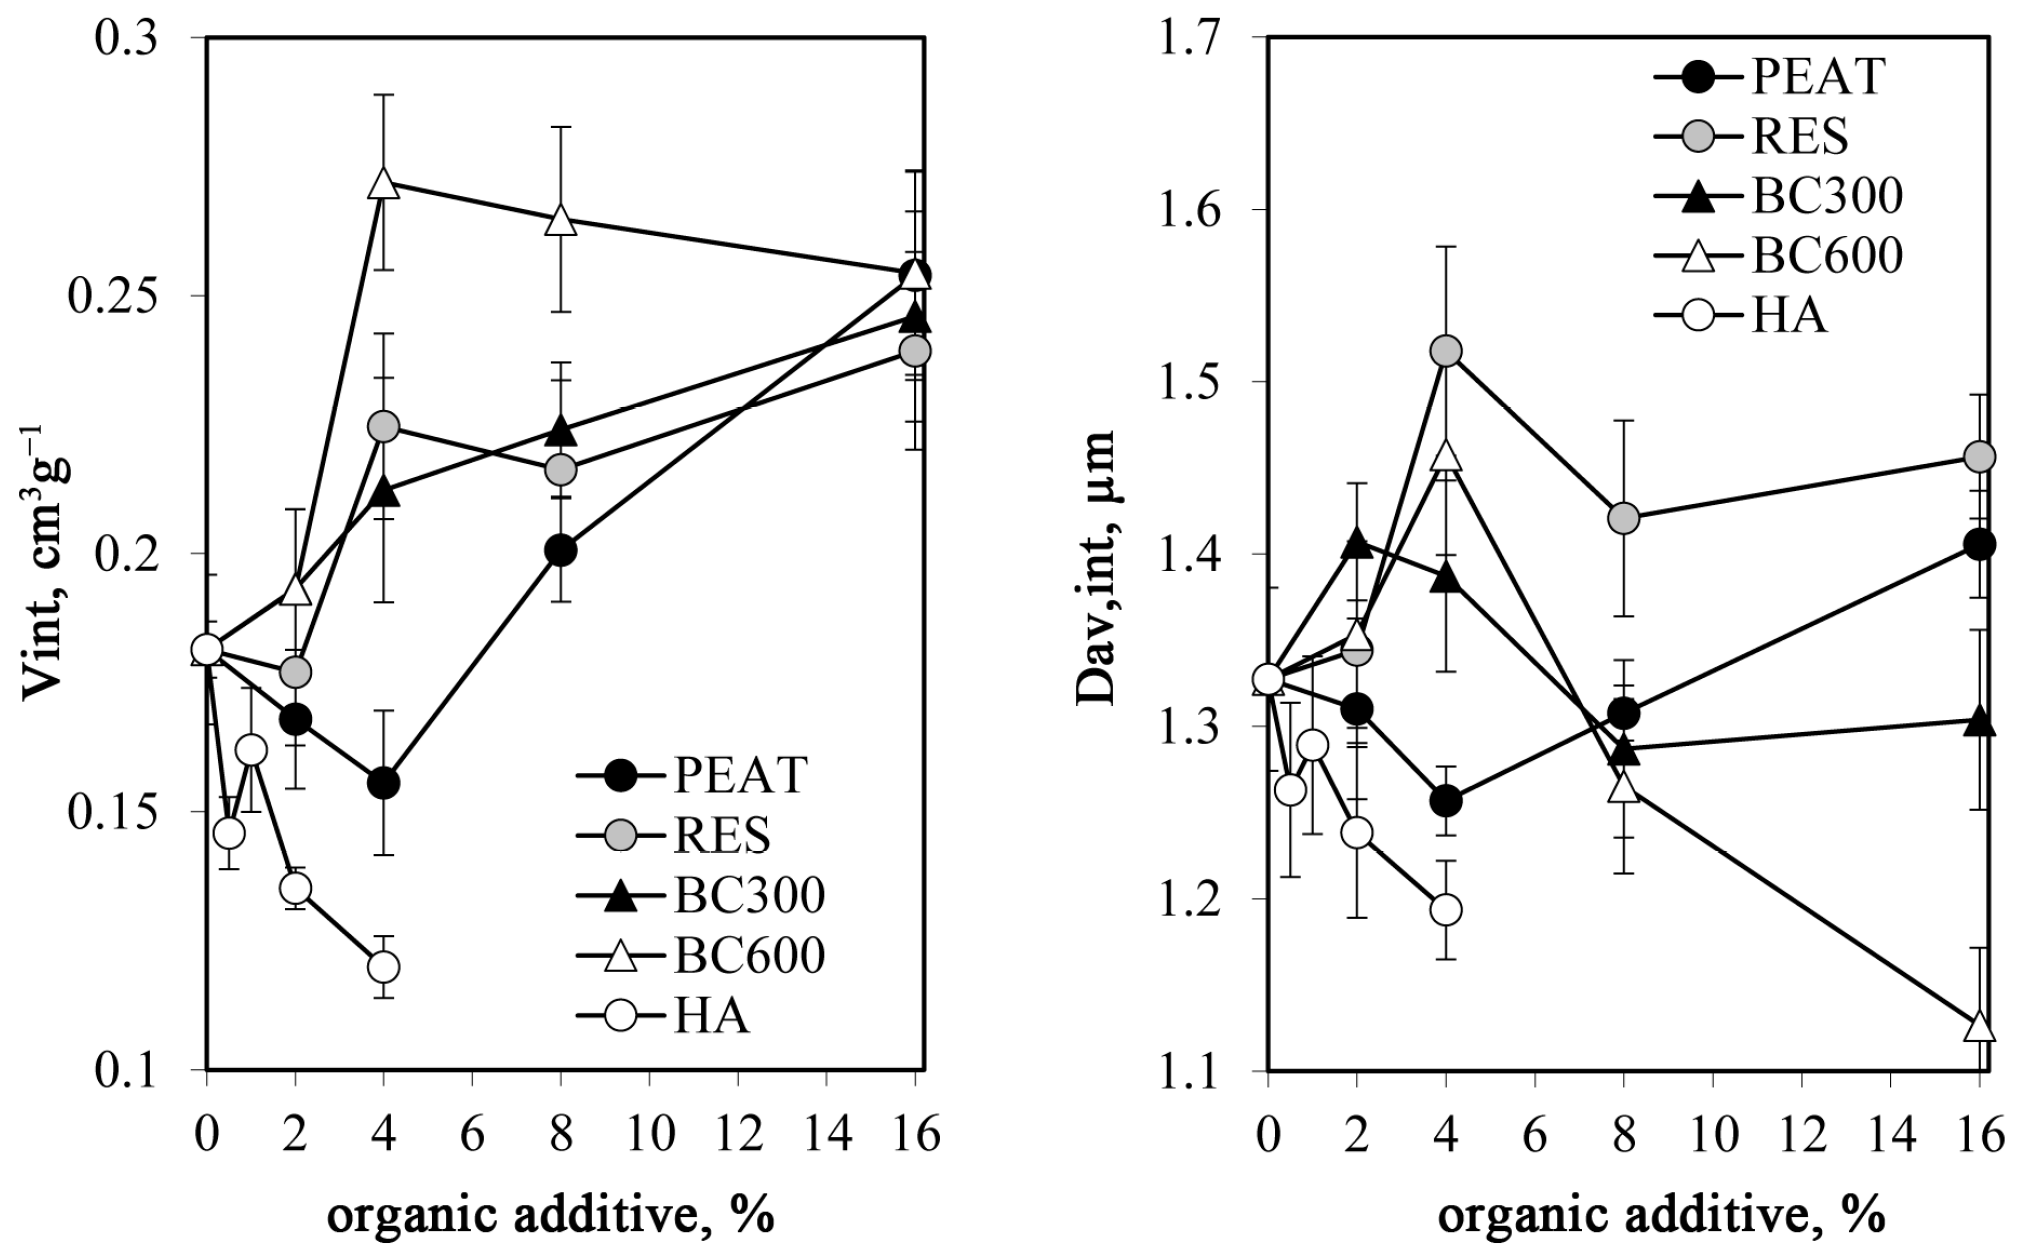
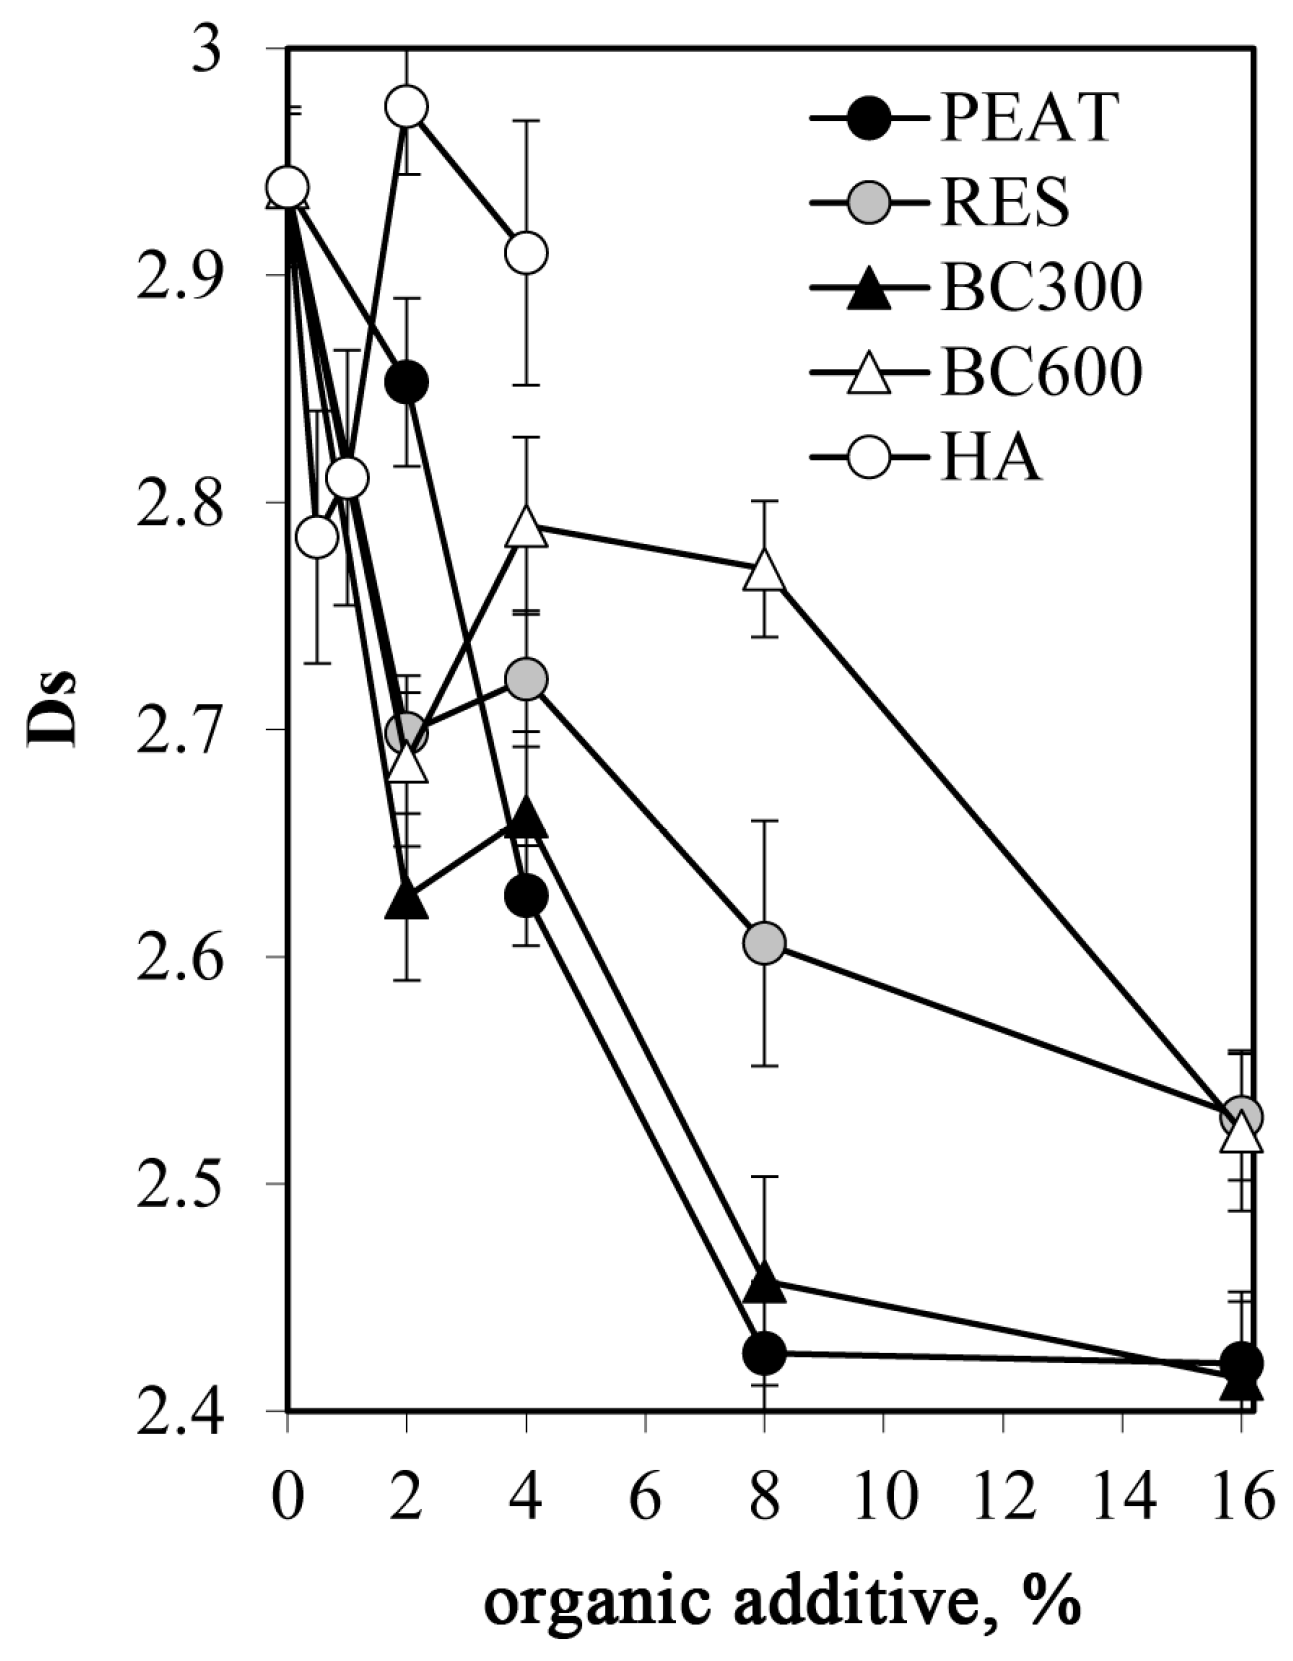
  • Mercury intrusion porosimetry (MIP) measurements for the studied aggregates were performed using the Autopore IV 9500 porosimeter (Micromeritics, Norcross, GA, USA) for three replicates of each material. The total pore volumes Vt [m3·g−1], pore size distribution functions, and average pore diameter, dav [m], were calculated from the mercury intrusion curves that show the dependence between the pore volume (intruded mercury) and the pore diameter d [m].. The pressures at which mercury started to enter the pores inside the aggregates (penetration thresholds), PT [m], were approximated by the pore diameter at which the second derivative of the pore volume on logd equals zero [48]. The intrinsic pore volume within an aggregate, Via, was taken as the volume of mercury intruded into the pores at higher pressures than those corresponding to PT, and the average intrinsic pore diameter in that range, dint,av [m], was calculated. The pore surface fractal dimension, Ds, was calculated from the slope of the linear part (if any) of the dependence of log(dV/dd) against logd. All details of the method and the calculations are presented by Jozefaciuk [49]. MIP tests were also performed for the dried HA paste in order to have some insight into the structure of pure HA.
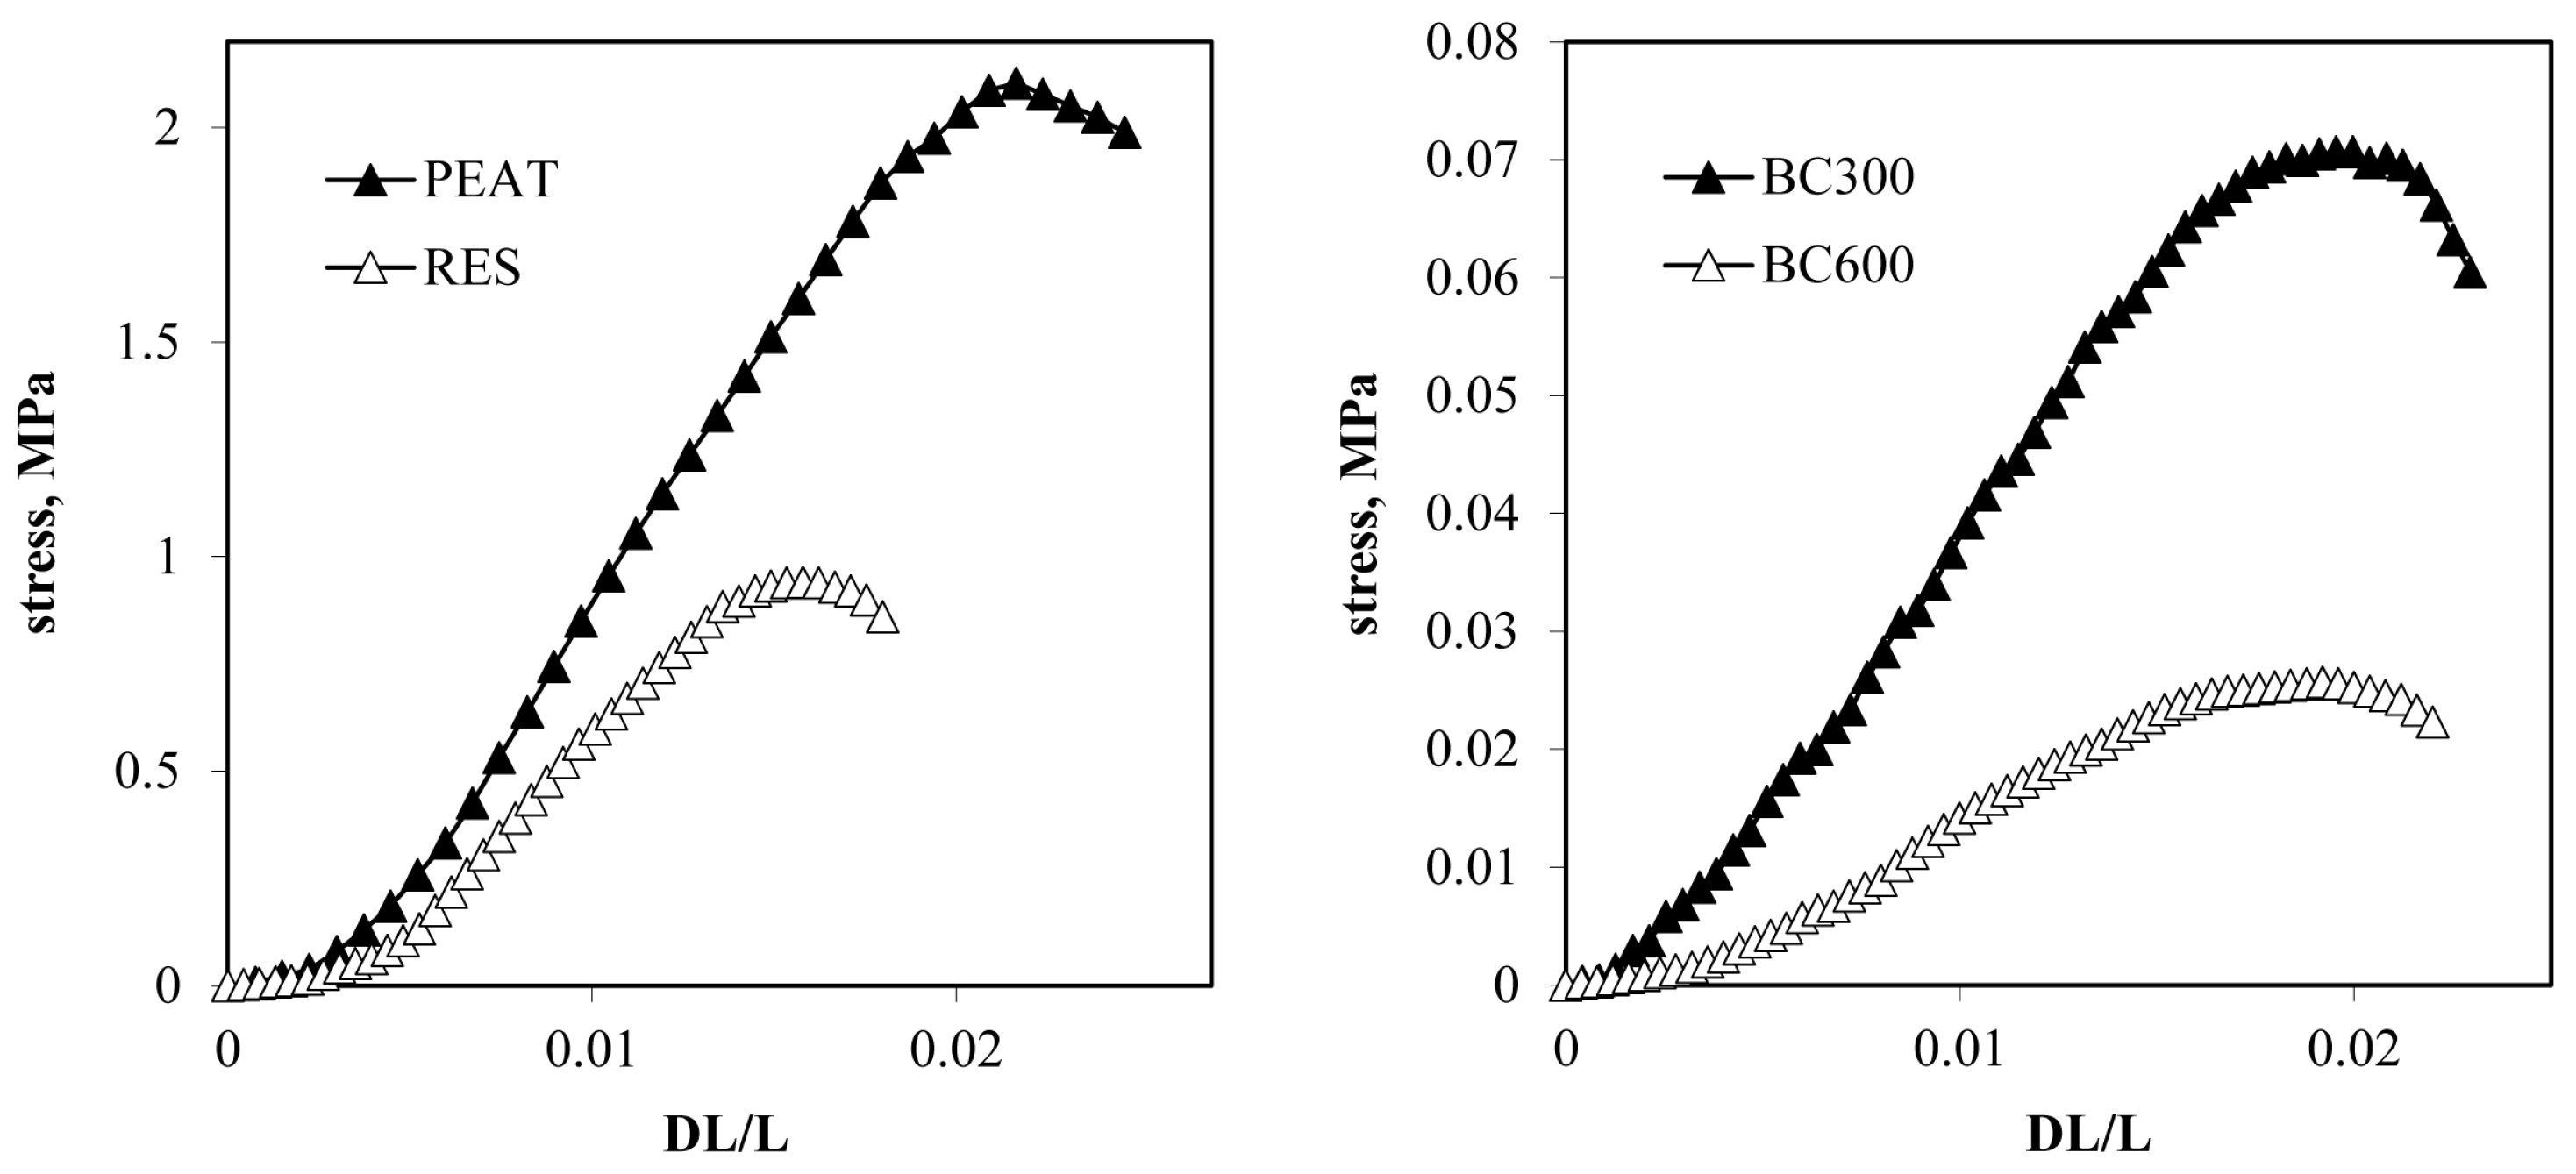
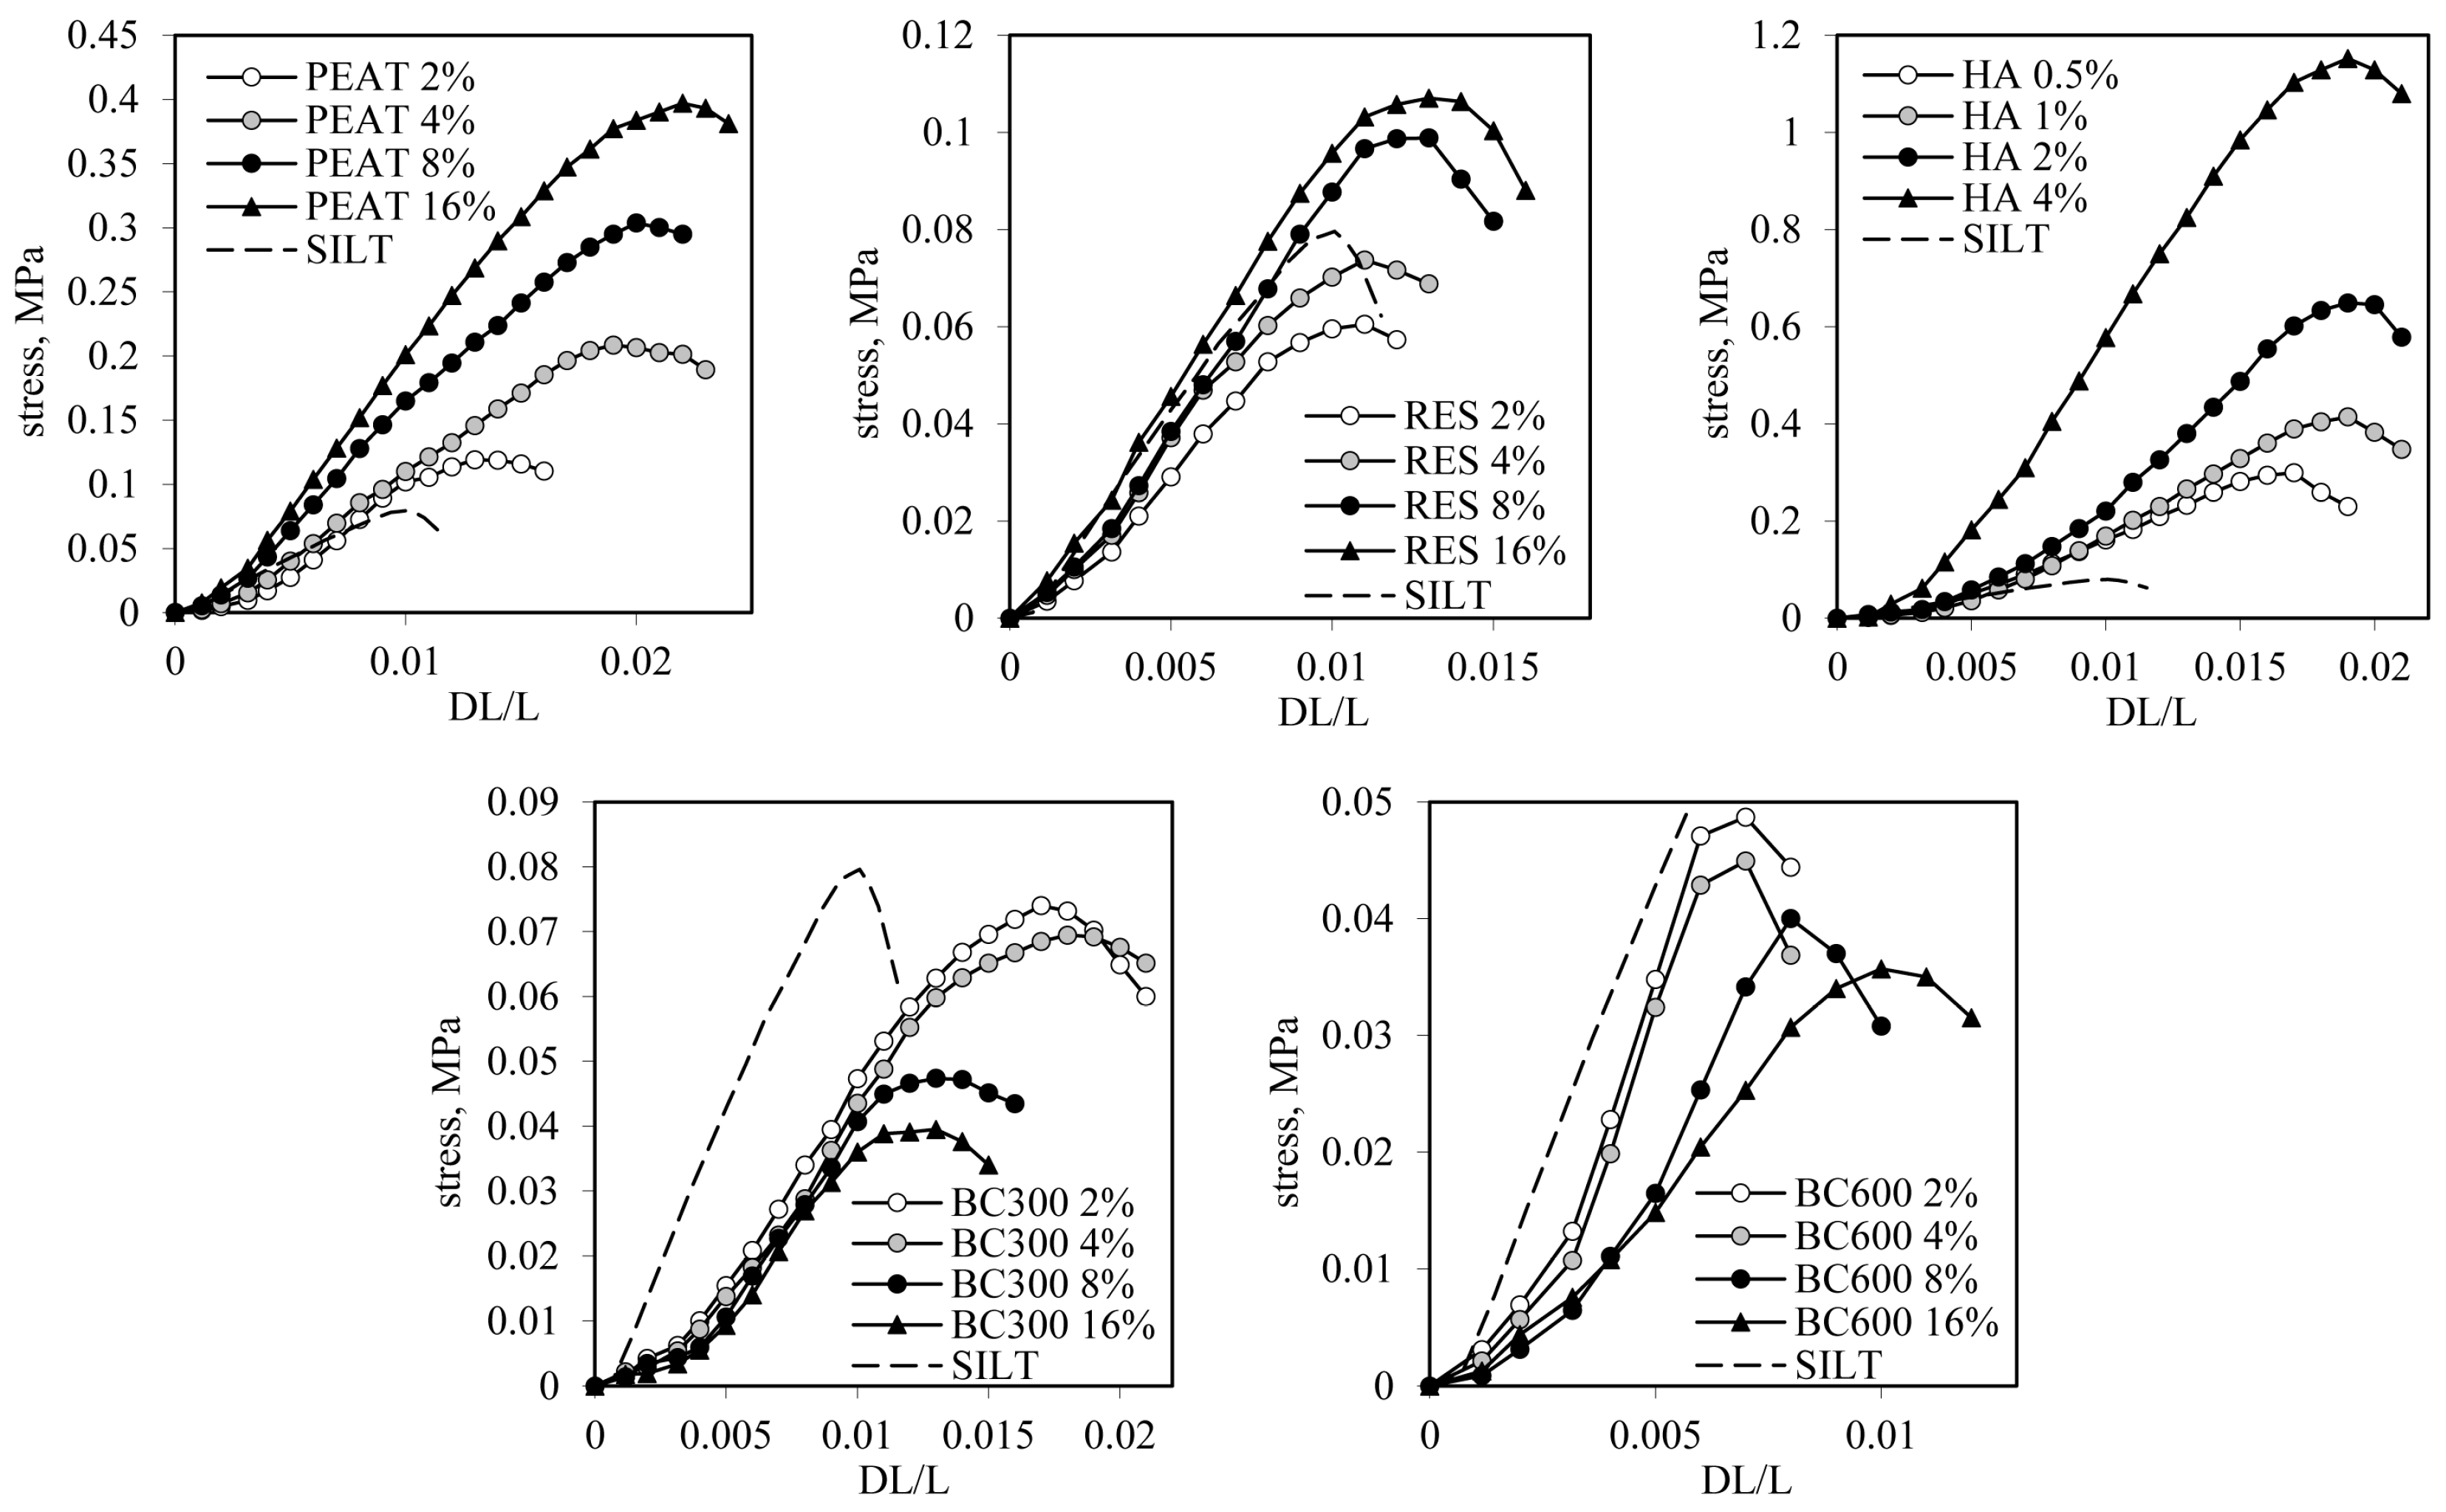
  • Uniaxial compression measurements were performed using Lloyd LRX (Lloyd Instruments Ltd., Bognor Regis, UK). The aggregate was placed vertically on the machine basement and forced by a piston. The force estimated with the accuracy of ±0.05 N against displacement of the piston passed with 10−5 m·s−1 was examined for ten replicates for aggregates of a given organic-mineral composition. The averaged breakage curve was calculated from at least six curves, most similar among ten replicates. Different curves, measured most probably for aggregates having structural artifacts, were discarded. From the average breakage curves, the dependencies of the compression stress, σ [MPa], (load divided by the aggregate cross-section area) versus strain, and ∆L/L (relative aggregate deformation, equal to piston displacement divided by the aggregate height) were calculated.

3. Results and Discussion

The presentation of the results follows the general concept of the paper presented above. At first, the surface and physicochemical properties of the substrates are examined and discussed. Next, some characteristics of the structure and strength of the aggregates formed from the silt and different amounts of organic species are presented. Finally, a picture attempted to interconnect the observed aggregates behavior and material properties is drawn.

3.1. Properties of Substrates

Particle size distributions of the studied materials: silt extracted from a loessial soil being a skeletal material for aggregates preparation (SILT) and organic additives: commercial acidic peat (PEAT), humic acid extracted from the peat (HA), residue after HA extraction from the peat (RES), and biochars obtained from the peat after 300 °C and 600 °C heating (BC300 and BC600, respectively) are shown in Figure 1.
Unimodal particle size distribution occurs only for SILT and HA, whereas for other substrates, two or three peaks can be distinguished. Average particle diameters calculated from the distribution functions along with solid phase (particle) densities of the studied substrates are shown in Table 1.
The solid phase density is the highest for pure silt and much lower for organic materials. HA is characterized by the smallest particle diameter. Humic acid nanoparticles of several tens of nanometers can be found in alkaline solutions, while for concentrated solutions, the particle size distributions usually contain larger particles, up to 1 µm [38]. In our experiments, the particle sizes are located within the above range. Peat has around two times larger particles than RES and both biochars. HA and RES are characterized by the lowest solid phase density. Higher particle densities have PEAT and BC300, while the highest particle density was measured for BC600. Lower SPD for BC300 than for BC600 is due to the preservation of isolated, unconnected pores inaccessible to helium molecules in BC300, such as those that are plugged by tar. It was found that tars coat pores in biochars produced at lower temperatures [50,51]. The high-temperature pyrolysis process leads to tar evaporation [52], which may open of the unconnected intraparticle pores, allowing helium to enter. As a result, the BC600 particles had a higher solid phase density measured by helium pycnometry. A similar effect might have also occurred if SPD of the tar was significantly lower than that of the char. The particle density of various soil organic materials is most often reported to be around 1.4 g cm–3 [53,54]. Significantly higher values found in this paper most likely result from fine granulation of the materials: intensive grinding may influence the destruction of very fine or closed pores, which are not available for the measuring medium during particle density measurement of intact materials.
FTIR spectra of the studied organic materials are shown in Figure 2. The FTIR characteristics differ in the location and intensity of the main absorption bands. The HA and peat show the highest signal at ~3432 cm−1 assigned to the O-H stretching of carboxylic acids, phenols, alcohols, and water [55]. Significant reduction of this band for RES suggests the loss of organic components due to alkaline extraction while indicating degradation of oxygen-containing structures under pyrolysis conditions for BC600. Higher pyrolysis temperature used for the production of BC600 also resulted in the disappearance of bands at ~2924, 2856, 1718, and 1230 cm−1, which can be attributed to asymmetric and symmetric stretching vibrations of aliphatic C-H and C=O in carboxyls, esters, lactones, aldehydes, and ketones [56]. The highest intensities at 1718 and 1230 cm−1 were revealed for HA, indicating the largest population of carboxylic groups. Interestingly, clear signals of the above bands are also observed for BC300, suggesting relatively low degradation of COOH structures under the peat processing at low temperatures. High absorbance of the band at 1585 and 1385 cm−1 for BC600 shows an increasing share of aromatic structures, which are more temperature resistant [43]. The band at ~1037 cm−1, mostly attributed to cellulose, hemicellulose, and lignin [57], was the strongest for peat, slightly lower for RES, and considerably reduced for BC300 and BC600.
Variable charge vs. pH curves of the studied organic materials derived from potentiometric titration, along with distribution functions of apparent surface dissociation constants, are shown in Figure 3. Assuming that the variable charge of the studied organic substances at pH = 3 is close to zero, the variable charge vs. pH curves approximate the total (actual) charge vs. pH dependencies. Despite the roughly identical initial pH of the organic substrates, the silt–organic mixtures had different pH values due to the higher pH of the silt (6.4) and different buffering properties of the organic substances. Because the charge developed at the actual aggregate pH seems to be the most important for interactions in the studied aggregates, the surface charge at mid values of pH measured for each silt–organic mixture was compared. The above values (also marked in the titration curves), with average apparent surface dissociation constants, are shown in Table 2.
The HA extracted from the peat has the highest charge. The charge of the residue after the HA extraction is around 20% smaller than that of the peat, which can be associated with the washout of highly charged HA compounds, also confirmed in our studies by the FTIR spectra (Figure 2). Biochar obtained from 300 °C heated peat has a variable charge lower than the residue remaining after HA extraction. The biochar obtained from 600 °C heated peat has the smallest charge. A reduction in surface charge and cation exchange capacity with biochar preparation temperature increase is a common observation, which can be explained by a decrease in acidic surface groups [44]. Quite low Q values for BC300 may result from partial degradation of peat biomass during pyrolysis, which at 300 °C is mostly related to the degradation of hemicellulose and partly to cellulose [41]. Under this temperature, some parts of humic substances, especially fulvic acids and other volatile compounds, can also be degraded resulting in surface charge reduction [43]. The lowest Q value observed for BC600 could be a consequence of further thermal degradation of organic compounds, including lignin, whose structures are rich in aromatic units and are more thermally resistant than cellulose and hemicellulose [42]. Apparent surface dissociation constants distribution functions revealing frequencies of occurrence of surface functional groups of different acidities show that the relative amount of strongly acidic groups (pKapp between 3 to 4) is much lower in biochars than in the other materials. Reduction of the structures of high acidity in BC300 and BC600 is mostly linked to intensive decarboxylation [58]. The peak of medium acidic groups (pKapp around 5) is the highest in HA and is shifted towards higher values for both biochars. The effect is more pronounced for BC600, which may be due to the further removal of fatty acids from the biomass under thermal treatment [59]. Both pyrolysis and HA removal from the peat resulted in the enrichment of biochars and RES in the groups of very weak acidity (pKapp between 9 and 10), e.g., phenolic groups from lignin or aliphatic hydroxyl groups [59]. Overall acidity of surface functional groups is the highest for HA, followed by PEAT and RES, respectively, which is reflected in the consequent increase in the average value of the surface dissociation constant. The highest values of pKapp,av have biochars that indicate a marked weakening of overall surface acidity after the heating of the peat.

3.2. Structure of the Aggregates

Representative SEM images of the surfaces of broken aggregates containing maximum doses of organic substances and that of the pure silt are presented in Figure 4. Different positions of the organic substances relative to the silt grains may be observed. PEAT particles occur as large agglomerates separately or close to silt grains. Agglomerated humic acid appears to be located mainly between the silt grains, connecting them to each other. Larger agglomerates of RES and BC300 can be distinguished; however, smaller ones appear to coat silt grain surfaces. Non-agglomerated individual particles of BC600 are located mainly on silt grain surfaces. A similar effect was also observed by Kelly et al. [60], who noticed that biochar remained unassociated with soil particles.
Mercury intrusion curves showing the dependencies of pore volumes on pore diameters for the studied aggregates are shown in Figure 5. For pure humic acid, the results for the dried HA paste and not for the aggregate are presented.
The MIP curves for all studied aggregates have similar S-shapes. For all aggregates, a rapid increase in pore volume starts at around 10 µm pore diameter; however, for pure BC600, it starts around 0.4 µm. For pure silt and silt/organic aggregates, the pore volume increases very slowly for pores smaller than around 1 µm, whereas for aggregates composed of pure organic substrates, the pore volume increases again for pores smaller than 0.1 µm. Two main parameters of the total aggregate porosity may be derived from the whole range of mercury intrusion: the total volume of pores and their average diameter. The above parameters along the bulk density of the aggregates formed from the silt and pure organic substances are presented in Table 3.
It is important to note that the total pore volume, Vt, and the average pore diameter, dav, presented in the above Table for HA, cannot be compared with the same parameters measured for the aggregates of the other materials. The dried HA paste was composed of grains of around 0.2–1 mm (by eye) of a flaky to spongy structure, which were markedly smaller than 8 mm aggregates of the other substrates. According to Jozefaciuk [49], the MIP results, particularly at low pressures (large pore diameters), depend very strongly on the dimensions of the studied objects. Even the same materials crushed and sieved to various sizes had quite different MIP curves.
Changes in bulk densities, total pore volume, and average pore diameter in the whole MIP experimental window for silt–organic aggregates are shown in Figure 6. For aggregates enriched with HA, the bulk density increases with the HA content. The effect may be related to the location of small HA particles within larger spaces between the particles within the silt skeleton. Our findings are in line with Liu et al. [52], who found that finer organic particles can fill the pores between the coarse mineral fraction, resulting in more effective packing and higher bulk density. A similar phenomenon may explain why the bulk density of the silt–organic aggregates exceeds that of the pure silt for the small loads of the other organic substrates. An increase in BD was also observed in soils of smaller organic matter levels by Munkholm [61] and in biochar-treated field soil by Ajayi and Horn [62] or Mukherjee and Lal [63]. For aggregates containing PEAT, RES, and biochars, the bulk density goes through an initial rise before it decreases with an increase in organic substrate loads. The particle density of all organic substrates is significantly lower than that of the silt; therefore, the observed reduction in the bulk density of silt–organic aggregates at higher loads of organic substances may be a direct consequence of organic substance addition. It is also possible that after filling the silt skeletal pores, the excess of organic particles sits between the silt grains, pushing them apart and loosening the pore structure. Soil organic matter acts as a crucial bonding material in soil structure formation by establishing complexes with primary mineral particles and secondary structural units. In this way, interaggregate pores are formed, resulting in a general reduction in bulk density. Reduction in soil bulk density by organic materials has been reported by other authors, confirming the dominance of this effect at a wide range of organic material types and concentrations [52,64,65,66,67,68,69]. Furthermore, a decrease in soil bulk density is frequently observed due to biochar amendment [25,70,71]
The inverse behaviour to that of the bulk density is observed for total pore volume, which seems rather obvious: higher porosity induces smaller bulk density. The average pore diameter increases at the smallest loads of all organic materials. This may be explained by either the location of a part of organic species between silt particles, moving them away from each other, or by the creation of relatively large pores on the aggregate external surface. For HA-containing aggregates, a reduction in pore volume accompanies a decrease in pore sizes also at higher HA rates. Surprisingly, for the other aggregates at higher organic substrate loads, the pores become narrower with an increase in pore volume. Our results are somewhat different from those presented by Skic et al. [72] and Dlapa et al. [73], who reported that a higher carbon content promotes the formation of elongated pores of a higher pore diameter. In the authors opinion, the dependencies between pore parameters could be better understood based on the intrinsic porosity parameters measured below penetration thresholds. Intrinsic pore volumes and average diameters of the studied substrates are presented in Table 4.
The intrinsic pore volume and diameter of the HA are markedly smaller than other substrates, which can be due both to the smallest size of HA particles (the bed constituted of the smallest particles ought to have the smallest pores) and to the strongest attraction between HA particles during drying (pore shrinking). Changes in intrinsic pore volumes and sizes for silt–organic aggregates are presented in Figure 7. The intrinsic pore volumes follow the same trends as the total pore volumes for all materials. Similar trends also hold for intrinsic pore diameter and average pore diameter.
Pores formed within the studied organic materials appear to have a fractal character. The roughness and geometrical irregularities of the pore surface have a crucial influence on the value of the fractal dimensions, which, for porous solids, may vary between 2 and 3. The value of 2 describes a regular (flat) pore surface, whereas the value of 3 corresponds to the highest pore-surface complexity. As was indicated by Bartoli et al. [48], the mercury porosimetry data are difficult to interpret in terms of fractal geometry due to the pore connectivity effects. It has been recommended that only the data for a very narrow pressure range, exceeding the percolation threshold, should be used for computing a fractal dimension of pores located inside the aggregate. This practice has been exercised in our calculations. Pore surface fractal dimensions for pure organic aggregates (including dry HA paste) are higher than 3, which suggests the extreme complexity of fine pore surfaces. In the case of biochars, the large number of microporous structures can be a result of pyrolysis and the gradual release of volatile substances with increasing temperature [74]. Such high values can also indicate a specific wavy buildup of fine pores [75] of a very high level of roughness [76].
The behaviour of pore surface fractal dimensions of the studied silt–organic aggregates is shown in Figure 8. The most complicated, rough surface belongs to pores of HA-containing aggregates, for which the fractal dimension varies between 2.78 and 2.97. For low HA amendments, the fractal dimension initially decreases and then increases at higher HA loads. For the other organic substrates, the Ds value appears to decrease with the increase of the substrate dose. Similar findings were found by Sokolowska et al. [77], who noticed a substantial decrease in the peat–muck soil fractal dimension with the organic carbon content but increased with the amount of humic acids characterized by complex chemical composition and irregular structures. A decrease in fractal dimension and smoothening of pore surfaces can be due to the filling of the finest pores or the blockage of their entrances by small-sized organic particles [78].

3.3. Strength of Aggregates

Stress–strain curves derived from uniaxial compression tests for aggregates of 100% organic substrates (excluding HA) are presented in Figure 9. The ductile breakage mode (i.e., significant plastic deformation before failure and distributed cracks [79]) was observed for organic substrates. The highest strength was measured for the PEAT aggregate. Peat soils are geotechnically problematic due to high compressibility and low shear strength. In many cases, the shear strength of different peats from a few to a maximum of twenty kPa has been reported [17,80,81], which is much lower than over 2000 kPa observed in our experiments. Such significant difference is most probably linked to various material structures: natural peat has a fibrous, spongy structure [82], while the peat used in the present studies was dried and milled into small particles, enabling stronger aggregate formation.
The residue after humic acid extraction has around two times smaller strength than the PEAT. The BC300 aggregate demonstrates a tenfold lower strength than RES. The aggregates of BC600 have the lowest strength, around three times lower than BC300. Unfortunately, the strength of the HA aggregates cannot be compared with the values above because pure HA aggregates were not prepared in this study, as detailed previously. However, considering the extremely high effect of HA on silt aggregation, presented below (see Figure 10), one can suspect that the pure HA aggregates should have significantly higher strength than that of the PEAT. The stress–strain curves resulting from uniaxial stress tests for the studied silt–organic aggregates are shown in Figure 10.
Generally, it is acceptable that particle size is the primary factor responsible for the aggregate’s strength. Aggregates composed of smaller particles have higher compressive strength [83,84,85] due to capillary effects at the grain-to-grain contacts [86]. In our studies, the descending order of particle size was SILT, PEAT, RES + both biochars (all of the latter three substrates have almost the same particle size), and HA. Nevertheless, the order of increasing aggregate strength does not reflect the particle sizes. The strength of SILT aggregates, composed of particles 15 times larger than both biochars, is similar to BC300 and higher than BC600. Despite being composed of particles of similar sizes, the strength of RES, BC300, and BC600 aggregates is quite different. The strength of the RES aggregate is over two times smaller than that of the PEAT aggregate, which is built from larger particles than the RES. The controversies above can be partially explained by different organo–mineral interactions stabilizing aggregate structure. Some authors indicate that the binding effect of organic matter on an aggregate’s stability is closely linked to its intrinsic chemical composition expressed in terms of cellulose, hemicellulose, and lignin contents [87], while high content of aromatic carbons hamper aggregation [13]. Our results have shown that the strength of the aggregates increases along with an increase in the surface charge of the organic substances and their surface acidity (see Figure 3 and the respective comments). It may be hypothesized that the acidic surface groups of hydrophilic character bind the neighboring particles together, possibly through the residual layer of the adsorbed water or by polyvalent cation bridging. What is more, an increase in surface hydrophobicity decreases the aggregate strength [88], which was explained by a state of water on hydrophobic surfaces. Chen and Sun [89] stated that water in hydrophobic sands would not form a meniscus, but it forms water droplets on the particle’s surface instead. Indeed, among the investigated aggregates composed of pure substrates, the smallest strength is associated with the biochar synthesized at 600 °C, which has the lowest charge and the highest share of aromatic groups and thus should be the most hydrophobic.
In general, significant plastic deformation before failure was observed for aggregates. Pure silt aggregate was the exception, breaking in a semi-brittle mode (little plastic deformation before failure). Figure 11 summarizes the dependency of the maximum strength of the silt–organic aggregates on organic substances percentage.
The maximum strength was observed for aggregates that contained humic acids. The high stabilizing effect of HA on aggregates can be related to the small size of HA particles, which can produce more interparticle contact points. Furthermore, the small HA particles can easily penetrate the silt structure and coat the silt grains [90], gluing them together. The silt–HA complexes formation through Al and Fe bridges may enhance the strength of such coatings [91]. Indeed, for the same silt used in the present paper but cleaned from Al and Fe oxides, the rupture force of the aggregate increased with humic acid content up to 1% and decreased afterwards [92]. For Al/Fe containing silt, the strength of the aggregates increases in the whole range of HA added. The maximal strength of peat-containing aggregates is lower than that of the HA-enriched aggregates and higher than for aggregates containing the residue after HA extraction. The maximal strength increases with the rate of the above materials. Increasing the dose of both biochars diminishes the strength of the silt aggregate. Similar findings were reported by Sokołowska et al. [93], who found that biochar diminished the tensile strength of model soil aggregates regardless of the starting materials used in the pyrolysis process. The reduced tensile strength of the biochar-containing aggregates underscores the fact that biochar weakens the interparticle bonding and reduces the density and overall cohesiveness, as also suggested in the literature [94,95,96,97]. Biochar produced at 300 °C consolidates the silt aggregates to a greater extent when compared to BC600. The effect can be due to the release of small particle-sized, humic-like substances of gluing character. As it was reported by Joseph et al. [98], biochars produced at low temperatures added to moist soils could release a considerable quantity of soluble organics into the soil solution. Similar to pure substrates, the consolidation effect of organic substrates on silt aggregates cannot be explained by their particle sizes.
The dependence of maximal stress on the concentration of the substrates can be approximated by a Langmuir-type equation, similar to that introduced by Horabik and Jozefaciuk [99] for kaolin-silt aggregates, which has been proven to be applicable for other minerals [47]. For the silt–organic aggregates studied in the present paper, this equation has been written in the updated form:
Smax = Smax,SILT ± Akc/(1 + kc),
where Smax,SILT is the maximal stress of the pure silt aggregate, c is the weight/weight ratio of the organic substrate to the silt, and A and k are constants. The ± sign before the second term in the RHS of this Equation means that the + sign is placed when Smax increases with c (PEAT, RES and HA), and the - sign holds in the opposite case (BC300 and BC600). The A constant may be treated as the strength of the aggregate for which c tends to infinity (i.e., the silt content approaches zero), and the k constant relates to the rate of Smax changes with c increase.
The parameters of Equation (1) for the studied aggregates calculated from the experimental dependencies of Smax vs. c using Excel’s Solver tool (Microsoft Office Professional Plus 2019) are presented in Table 5. This Table also contains values of maximal stress measured for aggregates prepared from pure substrates, read from Figure 9.
We expected that the parameter A will be similar to the maximal stress of the aggregate prepared from the pure substrate; however, for PEAT and RES, the A values are markedly lower. Conversely, for both biochars, the A values are higher than the Smax of the pure biochar aggregates. It may be hypothesized that the difference in A and Smax can reflect the strength of interactions between silt and organic particles: if A < Smax, organic particles are more weakly bound to the silt than to each other, and if A > Smax, organic particles bound with the silt are stronger. We believe that this hypothesis is worth checking. We plan to do this in the near future.

3.4. General Remarks and Implications

The overall trends in changes of maximal strength and structural parameters of silt–organic aggregates with increasing concentration of the amendments are summarized in Table 6. Mechanical stability is improved by peat, humic acid, and the residue after humic extraction from the peat, whereas both biochars weaken the aggregates. The above substances are applied to loosen the soil structure and decrease its mechanical resistance. As it may be concluded from our experiments, in the case of the peat, the commonly observed loosening of the field soil is mostly caused by the large size of particles of the added peat because clay-size peat particles strongly increase the aggregates’ strength. However, the strong compaction of aggregate structure and extreme hardening of the aggregates caused by the addition of humic acid observed in our studies is in contrary to the field observations. Because humic acid is applied in similar forms in both cases (field and laboratory), the field effects seem to be due to the inhomogeneous application of humic acid and the formation of strong aggregates at the points where humic acid is deposited. This shifts the aggregate size distribution towards larger values that enlarge soil pore volumes and decrease mechanical resistance. On the other side, the loosening of soil structure and decreasing strength are valid for both large and clay-size biochar particles. The differences between the impact of the biochars and the other substrates on the aggregate strength may indicate the importance of surface properties of these materials, such as surface charge and hydrophobicity.
The particle size of individual organic additives did not reflect the mechanical strength of aggregates. Despite the fact that, as expected, humic acid of the smallest particles strengthens the aggregates to the greatest extent, peat of the largest particles is the second in line. Such high effect of peat on aggregate strengthening may be caused by the release of humic acids into the solution during aggregate preparation. Other substrates have very similar particle sizes, but their effects on aggregation are quite different. It may be caused by differences in the mutual position of organic particles with respect to silt grains. Two main positions may be distinguished: when organic particles group within large pores inside the silt bed and when organic particles are located between the silt particles, pushing them apart from each other. Prevalence of inside-pore grouping should lead to a pore volume and pore radius decrease, an increase in bulk density and in the consequence, and an increase in aggregate strength. The dominance of the between-silt-grain location should lead to an increase in porosity and decrease in bulk density; however, the aggregate strength may either decrease or increase. An increase in the strength should occur when organic particles are strongly bound to inorganic grains (PEAT and RES); whereas if these interactions are weak, a decrease in the strength may occur (biochars). Because the ratio of organic particles in both positions should vary with their amount, the changes in different parameters accompanying small additions of a given organic component can differ from those at higher loads that are observed in our studies. For example, an increase in the average pore radius at small loads of all organic materials and its decrease with higher loads may indicate the prevalence of the between-silt-grains location at small organic loads. However, the ratio of organic particles located in both positions should also depend on the nature of the organic substrates, including their physicochemical and surface properties, which may strongly vary among various substrates; therefore, the impact of different organic species on soil structure and strength is difficult to predict.
Very similar trends in changes of structural parameters at higher organic loads are observed for PEAT, RES, and both biochars, which differ only in the behaviour of intrinsic pore diameter. The intrinsic porosity in biochars-containing aggregates is mostly associated with fine pores inside biochar particles rather than the formation of new pores between silt and the organic material. Humic-acid-amended aggregates behave in quite different ways than aggregates containing other organic substrates. Only humic acid addition led to an increase in the aggregate bulk density and a decrease in the total volume of pores, which apparently indicates the strong prevalence of the inside-pore grouping of HA particles.
Our hypothesis that the organic particles should compact soil structure and increase soil strength seems overly simplistic because it assumes that filling large skeletal pores is a dominant process after clay-size organic species addition. As it was observed, the location of organic particles between the skeletal grains also plays a significant role. Probably in both aforementioned cases, interactions between organic and inorganic soil components are the most important factors affecting the strength. Various physical and chemical mechanisms of these interactions for different organic substances make it difficult to predict the results of soil structure formation processes under various organic additives. This topic requires more detailed studies.

4. Conclusions

The most important conclusions from the studies described above can be summarised as follows:
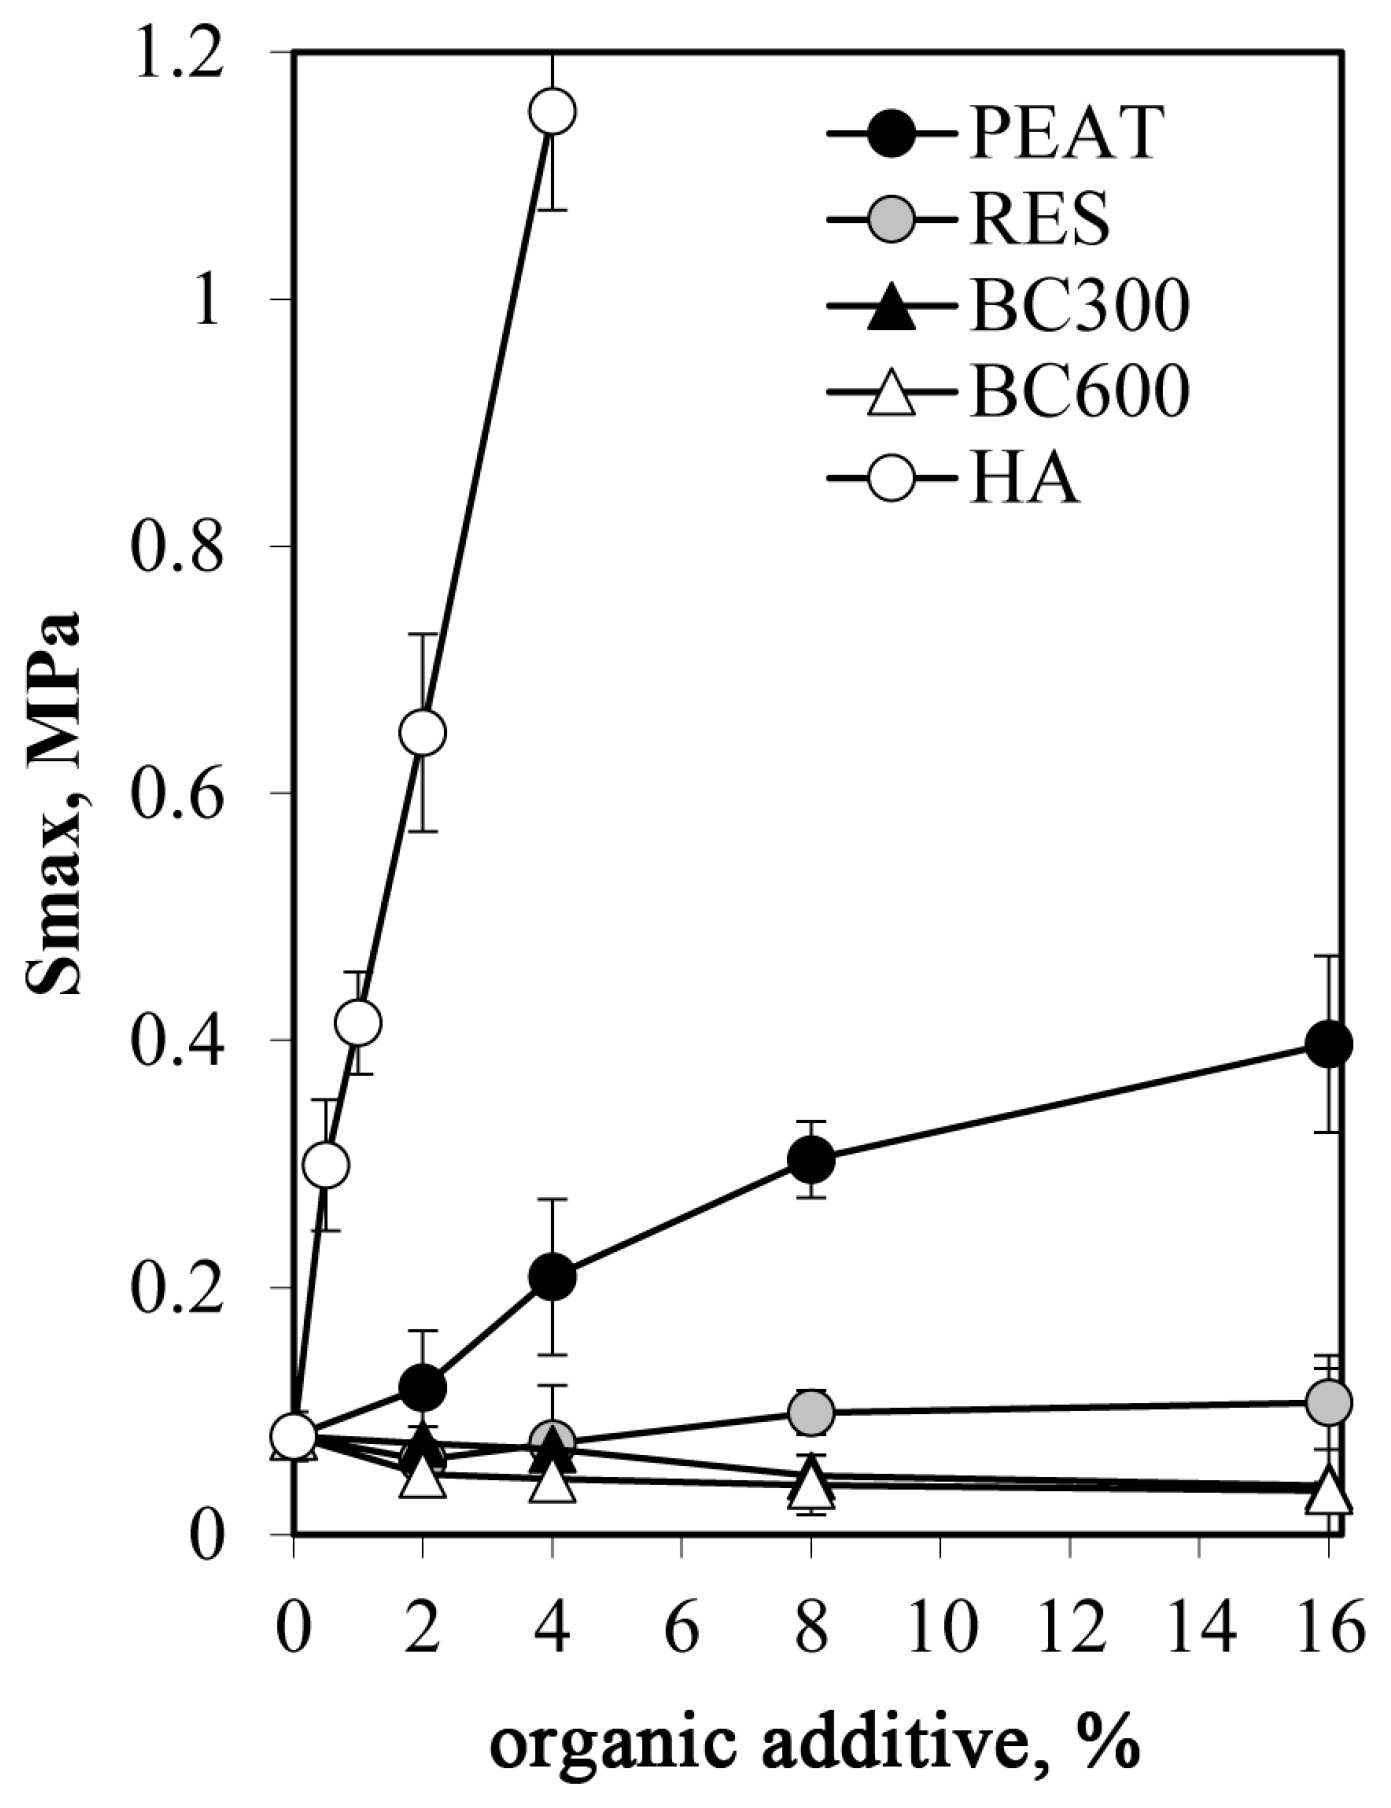
  • Humic acid exerted an extremely high effect on the mechanical strength of silt aggregates. At similar concentrations, it increased the aggregate strength a few times more than the peat and over ten times more than the residue after HA extraction from the peat (RES).
  • Despite similar particle sizes to PEAT and RES, biochars obtained from the peat after 300 and 600°C heating weakened the aggregates.
  • Bulk density of the silt aggregates increased due to HA addition and decreased due to other amendments, whereas the total volume of pores behaved in the opposite direction.
  • HA smoothed the surfaces of the pore system, which was indicated by a decrease in pore surface fractal dimension.
  • The Langmuir-like curve was proposed to relate mechanical strength to the aggregate composition (a given organic additive content). A satisfactory model fit to the experimental data was reached.

Author Contributions

Conceptualization, K.S., A.A., P.B., A.G. and G.J.; Data curation, K.S., P.B. and G.J.; Formal analysis, K.S., A.A., P.B., A.G., S.M.S., S.I. and G.J.; Funding acquisition, G.J.; Investigation, K.S., A.A., P.B., A.G. and G.J.; Methodology, K.S., A.A., P.B., A.G., S.M.S., S.I. and G.J.; Project administration, G.J.; Resources, K.S., A.A., P.B., A.G. and G.J.; Software, K.S. and G.J.; Supervision, G.J.; Validation, K.S., A.A., P.B. and A.G.; Visualization, K.S., A.A., P.B., A.G. and G.J.; Writing—original draft, K.S., P.B. and G.J.; Writing—review & editing, K.S., P.B., S.M.S., S.I. and G.J. All authors have read and agreed to the published version of the manuscript.

Funding

This research was funded in part by the National Science Centre, Poland within an Opus 15 Project 2018/29/B/ST10/01592 Effect of minerals and different forms of organic carbon on structure, porosity and mechanical and water stability of soil aggregates—model studies. The full APC waiver for this paper was granted and approved by the editorial office of “Agriculture” MDPI Journal.

Institutional Review Board Statement

Not applicable.

Data Availability Statement

The data presented in this study are available on request from the corresponding author. The data are not publicly available due to requiring specific software to view the data files. Most of the data are presented within this publication in the figures.

Acknowledgments

The authors thank Jolanta Ciesla from Institute of Agrophysics, Lublin, for ZetaSizer measurements and interpretation. The authors would also like to acknowledge the contribution of the scholars Mikhail Gorbounov and Jess Taylor in helping with the conduction of some of the analytical experiments in this work. The authors much appreciate the help of Ewa Paszek in English corrections.

Conflicts of Interest

The authors declare no conflict of interest. The funders had no role in the design of the study; in the collection, analyses, or interpretation of data; in the writing of the manuscript; or in the decision to publish the results.

References

  1. Costa, O.Y.A.; Raaijmakers, J.M.; Kuramae, E.E. Microbial Extracellular Polymeric Substances: Ecological Function and Impact on Soil Aggregation. Front. Microbiol. 2018, 9, 1636. [Google Scholar] [CrossRef] [PubMed]
  2. Szatanik-Kloc, A.; Horn, R.; Lipiec, J.; Siczek, A.; Boguta, P. Initial growth and root surface properties of dicotyledonous plants in structurally intact field soil and compacted headland soil. Soil Tillage Res. 2019, 195, 104387. [Google Scholar] [CrossRef]
  3. Yu, Q.; Wang, M.; Tian, Y.; Shi, X.; Li, X.; Xu, L.; Xie, X.; Shi, Y.; Zhu, Y. Effects of porous clay ceramic rates on aeration porosity characteristics in a structurally degraded soil under greenhouse vegetable production. Pedosphere 2021, 31, 606–614. [Google Scholar] [CrossRef]
  4. Grave, R.A.; da Silveira Nicoloso, R.; Cassol, P.C.; Aita, C.; Corrêa, J.C.; Dalla Costa, M.; Fritz, D.D. Short-term carbon dioxide emission under contrasting soil disturbance levels and organic amendments. Soil Tillage Res. 2015, 146, 184–192. [Google Scholar] [CrossRef]
  5. Yazdanpanah, N.; Mahmoodabadi, M.; Cerda, A. The impact of organic amendments on soil hydrology, structure and microbial respiration in semiarid lands. Geoderma 2016, 266, 58–65. [Google Scholar] [CrossRef]
  6. Munkholm, L.J.; Heck, R.J.; Deen, B.; Zidar, T. Relationship between soil aggregate strength, shape and porosity for soils under different long-term management. Geoderma 2016, 268, 52–59. [Google Scholar] [CrossRef]
  7. Yusof, N.Q.A.M.; Zabidi, H. Correlation of mineralogical and textural characteristics with engineering properties of granitic rock from Hulu Langat, Selangor. Procedia Chem. 2016, 19, 975–980. [Google Scholar] [CrossRef]
  8. Wei, S.; Tan, W.; Zhao, W.; Yu, Y.; Liu, F.; Koopal, L.K. Microstructure, interaction mechanisms, and stability of binary systems containing goethite and kaolinite. Soil Sci. Soc. Am. J. 2012, 76, 389–398. [Google Scholar] [CrossRef]
  9. Ghadr, S.; Assadi-Langroudi, A. Effect of grain size and shape on undrained behaviour of sands. Int. J. Geosynth. Ground Eng. 2019, 5, 18. [Google Scholar] [CrossRef]
  10. Li, D.; Wentong, Z.; Yunwu, X.; Jiaye, Z.; Quanzhong, H.; Xu, X.; Ping, R.; Guanhua, H. Impact of short-term organic amendments incorporation on soil structure and hydrology in semiarid agricultural lands. Int. Soil Water Conserv. Res. 2022, 10, 457–469. [Google Scholar] [CrossRef]
  11. Arthur, E.; Schjønning, P.; Moldrup, P.; de Jonge, L.W. Soil resistance and resilience to mechanical stresses for three differently managed sandy loam soils. Geoderma 2012, 173, 50–60. [Google Scholar] [CrossRef]
  12. Imbufe, A.U.; Patti, A.F.; Burrow, D.; Surapaneni, A.; Jackson, W.R.; Milner, A.D. Effects of potassium humate on aggregate stability of two soils from Victoria, Australia. Geoderma 2005, 125, 321–330. [Google Scholar] [CrossRef]
  13. Sarker, T.C.; Incerti, G.; Spaccini, R.; Piccolo, A.; Mazzoleni, S.; Bonanomi, G. Linking organic matter chemistry with soil aggregate stability: Insight from 13C NMR spectroscopy. Soil Biol. Biochem. 2018, 117, 175–184. [Google Scholar] [CrossRef]
  14. Han, M.; Wang, M.; Zhai, G.; Li, Y.; Yu, S.; Wang, E. Difference of soil aggregates composition, stability, and organic carbon content between eroded and depositional areas after adding exogenous organic materials. Sustainability 2022, 14, 2143. [Google Scholar] [CrossRef]
  15. Kitir, N.; Yildirim, E.; Şahin, Ü.; Turan, M.; Ekinci, M.; Ors, S.; Ünlü, H. Peat use in horticulture. In Peat; Topcuoglu, B., Turan, M., Eds.; IntechOpen: London, UK, 2018; pp. 75–90. [Google Scholar] [CrossRef]
  16. Cao, S. Research and application of peat in agriculture. IOP Conf. Ser. Earth Environ. Sci. 2019, 384, 012174. [Google Scholar] [CrossRef]
  17. Kazemian, S.; Huat, B.B.K.; Prasad, A.; Barghchi, M. A state of art review of peat: Geotechnical engineering perspective. Int. J. Phys. Sci. 2011, 6, 1974–1981. [Google Scholar] [CrossRef]
  18. Wang, L.; Sun, X.; Li, S.; Zhang, T.; Zhang, W.; Zhai, P. Application of organic amendments to a coastal saline soil in north China: Effects on soil physical and chemical properties and tree growth. PLoS ONE 2014, 9, e89185. [Google Scholar] [CrossRef]
  19. Kowalczyk-Jusko, A.; Onuch, J.; Koscik, B.; Skowron, P.; Cholody, M.; Kosidlo, A.; Rawski, J. Environmental and practical aspects of the use of peat for agriculture and energy aims. J. Ecol. Eng. 2016, 17, 138–142. [Google Scholar] [CrossRef]
  20. Chrysargyris, A.; Prasad, M.; Kavanagh, A.; Tzortzakis, N. Biochar type and ratio as a peat additive/partial peat replacement in growing media for cabbage seedling production. Agronomy 2019, 9, 693. [Google Scholar] [CrossRef]
  21. Rex, P.; Mohammed Ismail, K.R.; Meenakshisundaram, N.; Barmavatu, P.; Sai Bharadwaj, A.V.S.L. Agricultural biomass waste to biochar: A review on biochar applications using machine learning approach and circular economy. Chem. Eng. 2023, 7, 50. [Google Scholar] [CrossRef]
  22. Xiao, Y.; Igalavithana, A.D.; Oh, S.-E.; Nam, H.; Zhang, M.; Wang, C.-H.; Kwon, E.E.; Tsang, D.C.W.; Ok, Y.S. Characterization of bioenergy biochar and its utilization for metal/metalloid immobilization in contaminated soil. Sci. Total Environ. 2018, 640–641, 704–713. [Google Scholar] [CrossRef]
  23. Juriga, M.; Simansky, V. Effect of biochar on soil structure—Review. Acta Fytotech. Zootech. 2018, 21, 11–19. [Google Scholar] [CrossRef]
  24. Sun, F.; Lu, S. Biochars improve aggregate stability, water retention, and pore-space properties of clayey soil. J. Plant. Nutr. Soil Sci. 2014, 177, 26–33. [Google Scholar] [CrossRef]
  25. Adekiya, A.O.; Agbede, T.M.; Olayanju, A.; Ejue, W.S.; Adekanye, T.A.; Adenusi, T.T.; Ayeni, J.F. Effect of biochar on soil properties, soil loss, and cocoyam yield on a tropical sandy loam alfisol. Sci. World J. 2020, 2020, 9391630. [Google Scholar] [CrossRef] [PubMed]
  26. Liu, Z.; Chen, X.; Jing, Y.; Li, Q.; Zhang, J.; Huang, Q. Effects of biochar amendment on rapeseed and sweet potato yields and water stable aggregate in upland red soil. Catena 2014, 123, 45–51. [Google Scholar] [CrossRef]
  27. Zong, Y.; Chen, D.; Lu, S. Impact of biochars on swell-shrinkage behavior, mechanical strength, and surface cracking of clayey soil. J. Plant. Nutr. Soil Sci. 2014, 177, 920–926. [Google Scholar] [CrossRef]
  28. Hardie, M.; Clothier, B.; Bound, S.; Oliver, G.; Close, D. Does biochar influence soil physical properties and soil water availability? Plant Soil 2014, 376, 347–361. [Google Scholar] [CrossRef]
  29. Simansky, V.; Horak, J.; Igaz, D.; Jonczak, J.; Markiewicz, M.; Felber, R.; Rizhiya, E.Y.; Lukac, M. How dose of biochar and biochar with nitrogen can improve the parameters of soil organic matter and soil structure? Biologia 2016, 71, 989–995. [Google Scholar] [CrossRef]
  30. Yang, F.; Tang, C.; Antonietti, M. Natural and artificial humic substances to manage minerals, ions, water, and soil microorganisms. Chem. Soc. Rev. 2021, 50, 6221–6239. [Google Scholar] [CrossRef]
  31. Sodhi, G.P.S.; Beri, V.; Benbi, D.K. Soil aggregation and distribution of carbon and nitrogen in different fractions under long-term application of compost in rice-wheat system. Soil Tillage Res. 2009, 103, 412–418. [Google Scholar] [CrossRef]
  32. Zhou, L.; Monreal, C.M.; Xu, S.; McLaughlin, N.B.; Zhang, H.; Hao, G.; Liu, J. Effect of bentonite-humic acid application on the improvement of soil structure and maize yield in a sandy soil of a semi-arid region. Geoderma 2019, 338, 269–280. [Google Scholar] [CrossRef]
  33. Boechat, C.L.; Pistóia, V.C.; Ludtke, A.C.; Gianello, C.; Camargo, F.A.O. Solubility of heavy metals/metalloid on multi-metal contaminate soil samples from a gold ore processing area: Effects of humic substances. Rev. Bras. Cienc. Solo 2016, 40, 0150383. [Google Scholar] [CrossRef]
  34. Mukherjee, A.; Lal, R.; Zimmerman, A.R. Impacts of 1.5-year field aging on biochar, humic acid, and water treatment residual amended soil. Soil Sci. 2014, 179, 333–339. [Google Scholar] [CrossRef]
  35. Tobiasova, E.; Barancikova, G.; Gomoryova, E.; Debska, B.; Banach-Szott, M. Humus substances and soil aggregates in the soils with different texture. Soil Water Res. 2018, 13, 44–50. [Google Scholar] [CrossRef]
  36. Boguta, P.; Sokolowska, Z. Statistical relationship between selected physicochemical properties of peaty-muck soils and their fraction of humic acids. Int. Agrophys. 2014, 28, 269–278. [Google Scholar] [CrossRef]
  37. Ampong, K.; Thilakaranthna, M.S.; Yuya, G.L. Understanding the role of humic acids on crop performance and soil health. Frontiers 2022, 4, 1–14. [Google Scholar] [CrossRef]
  38. Klucakova, M. Size and charge evaluation of standard humic and fulvic acids as crucial factors to determine their environmental behavior and impact. Front. Chem. 2018, 6, 235. [Google Scholar] [CrossRef]
  39. Angelico, R.; Colombo, C.; Di Iorio, E.; Brtnický, M.; Fojt, J.; Conte, P. Humic substances: From supramolecular aggregation to fractal conformation—Is there time for a new paradigm? Appl. Sci. 2023, 13, 2236. [Google Scholar] [CrossRef]
  40. Lipiec, J.; Turski, M.; Hajnos, M.; Swieboda, R. Pore structure, stability and water repellency of earthworm casts and natural aggregates in loess soil. Geoderma 2015, 243, 124–129. [Google Scholar] [CrossRef]
  41. Jouhara, H.; Ahmad, D.; Boogaert, I.; Katsou, E.; Simons, S.; Spencer, N. Pyrolysis of domestic based feedstock at temperatures up to 300 °C. Therm. Sci. Eng. Prog. 2018, 5, 117–143. [Google Scholar] [CrossRef]
  42. Ahmad, M.; Lee, S.S.; Dou, X.; Mohan, D.; Sung, J.K.; Yang, J.E.; Sik Ok, Y. Effects of pyrolysis temperature on soybean stover- and peanut shell-derived biochar properties and TCE adsorption in water. Bioresour. Technol. 2012, 118, 536–544. [Google Scholar] [CrossRef] [PubMed]
  43. Boguta, P.; Sokołowska, Z.; Skic, K. Use of thermal analysis coupled with differential scanning calorimetry, quadrupole mass spectrometry and infrared spectroscopy (TG-DSC-QMS-FTIR) to monitor chemical properties and thermal stability of fulvic and humic acids. PLoS ONE 2017, 12, e0189653. [Google Scholar] [CrossRef] [PubMed]
  44. Moradi-Choghamarani, F.; Moosavi, A.A.; Baghernejad, M. Determining organo-chemical composition of sugarcane bagasse-derived biochar as a function of pyrolysis temperature using proximate and Fourier transform infrared analyses. J. Therm. Anal. Calorim. 2019, 138, 331–342. [Google Scholar] [CrossRef]
  45. Ryzak, M.; Bieganowski, A. Methodological aspects of determining soil particle-size distribution using the laser diffraction method. J. Plant. Nutr. Soil Sci. 2011, 174, 624–633. [Google Scholar] [CrossRef]
  46. Jozefaciuk, G.; Szatanik-Kloc, A.; Lukowska, M.; Szerement, J. Pitfalls and uncertainties of using potentiometric titration for estimation of plant roots surface charge and acid-base properties. Am. J. Plant Sci. 2014, 5, 1862–1876. [Google Scholar] [CrossRef]
  47. Jozefaciuk, G.; Skic, K.; Adamczuk, A.; Boguta, P.; Lamorski, K. Structure and strength of artificial soils containing monomineral clay fractions. Materials 2021, 14, 4688. [Google Scholar] [CrossRef]
  48. Bartoli, F.; Bird, N.R.A.; Gomendy, V.; Vivier, H.; Niquet, S. The relation between silty soil structures and their mercury porosimetry curve counterparts: Fractals and percolation. Eur. J. Soil Sci. 1999, 50, 9–22. [Google Scholar] [CrossRef]
  49. Jozefaciuk, G. Effect of the size of aggregates on pore characteristics of minerals measured by mercury intrusion and water-vapor desorption techniques. Clays Clay Miner. 2009, 57, 586–601. [Google Scholar] [CrossRef]
  50. Das, O.; Sarmah, A.K. The love–hate relationship of pyrolysis biochar and water: A perspective. Sci. Total Environ. 2015, 512, 682–685. [Google Scholar] [CrossRef]
  51. Omran, E.S.; Shorafa, M.; Zolfaghari, A.A.; Toolarood, A.A.S. The effect of biochar on severity of soil water repellency of crude oil-contaminated soil. Environ. Sci. Pollut. Res. 2020, 27, 6022–6032. [Google Scholar] [CrossRef]
  52. Liu, Z.; Dugan, B.; Masiello, C.A.; Barnes, R.T.; Gallagher, M.E.; Gonnermann, H. Impacts of biochar concentration and particle size on hydraulic conductivity and DOC leaching of biochar–sand mixtures. J. Hydrol. 2016, 533, 461–472. [Google Scholar] [CrossRef]
  53. Whittington, P.; Koiter, A.; Watts, D.; Brewer, A.; Golubev, V. Bulk density, particle density, and porosity of two species of Sphagnum: Variability in measurement techniques and spatial distribution. Soil Sci. Soc. Am. J. 2021, 85, 2220–2233. [Google Scholar] [CrossRef]
  54. Bartley, P.C., III; Amoozegar, A.; Fonteno, W.C.; Jackson, B.E. Particle densities of horticultural substrates. Hortic. Sci. 2022, 57, 379–383. [Google Scholar] [CrossRef]
  55. Jindo, K.; Mizumoto, H.; Sawada, Y.; Sanchez-Monedero, M.A.; Sonoki, T. Physical and chemical characterization of biochars derived from different agricultural residues. Biogeosciences 2014, 11, 6613–6621. [Google Scholar] [CrossRef]
  56. Boguta, P.; Sokołowska, Z.; Skic, K.; Tomczyk, A. Chemically engineered biochar—Effect of concentration and type of modifier on sorption and structural properties of biochar from wood waste. Fuel 2019, 256, 115893. [Google Scholar] [CrossRef]
  57. Cantrell, K.B.; Hunt, P.G.; Uchimiya, M.; Novak, J.M.; Ro, K.S. Impact of pyrolysis temperature and manure source on physicochemical characteristics of Biochar. Bioresour. Technol. 2012, 107, 419–428. [Google Scholar] [CrossRef] [PubMed]
  58. Chen, D.; Cen, K.; Zhuang, X.; Gan, Z.; Zhou, J.; Zhang, Y.; Zhang, H. Insight into biomass pyrolysis mechanism based on cellulose, hemicellulose, and lignin: Evolution of volatiles and kinetics, elucidation of reaction pathways, and characterization of gas, biochar and bio-oil. Combust. Flame 2022, 242, 112142. [Google Scholar] [CrossRef]
  59. Shoulaifar, T.K.; DeMartini, N.; Ivaska, A.; Fardim, P.; Hupa, M. Measuring the concentration of carboxylic acid groups in torrefied spruce wood. Bioresour. Technol. 2012, 123, 338–343. [Google Scholar] [CrossRef]
  60. Kelly, C.N.; Benjamin, J.; Calderon, F.C.; Mikha, M.M.; Rutherford, D.W.; Rostad, C.E. The incorporation of biochar carbon into stable soil aggregates: The role of clay mineralogy and other soil characteristics. Pedosphere 2017, 27, 694–704. [Google Scholar] [CrossRef]
  61. Munkholm, L.J. Soil friability: A review of the concept, assessment and effects of soil properties and management. Geoderma 2011, 167, 236–246. [Google Scholar] [CrossRef]
  62. Ajayi, A.E.; Horn, R. Modification of chemical and hydrophysical properties of two texturally differentiated soils due to varying magnitudes of added biochar. Soil Tillage Res. 2016, 164, 34–44. [Google Scholar] [CrossRef]
  63. Mukherjee, A.; Lal, R. Biochar impacts on soil physical properties and greenhouse gas emissions. Agronomy 2013, 3, 313–339. [Google Scholar] [CrossRef]
  64. Zhang, X.; Wang, K.; Sun, C.; Yang, K.; Zheng, J. Differences in soil physical properties caused by applying three organic amendments to loamy clay soil under field conditions. J. Soils Sediments 2022, 22, 43–55. [Google Scholar] [CrossRef]
  65. Tsadilas, C.D.; Mitsios, I.K.; Golia, E. Influence of biosolids application on some soil physical properties. Commun. Soil Sci. Plant Anal. 2005, 36, 709–716. [Google Scholar] [CrossRef]
  66. Benites, V.M.; Machado, L.O.A.; Fidalgo, C.C.; Coelho, M.R.; Madari, B.E. Pedotransfer functions for estimating soil bulk density from existing soil survey reports in Brazil. Geoderma 2007, 139, 90–97. [Google Scholar] [CrossRef]
  67. Celik, I.; Gunal, H.; Budak, M.; Akpinar, C. Effects of long-term organic and mineral fertilizers on bulk density and penetration resistance in semi-arid Mediterranean soil conditions. Geoderma 2010, 160, 236–243. [Google Scholar] [CrossRef]
  68. Brahim, N.; Bernoux, M.; Gallali, T. Pedotransfer functions to estimate soil bulk density for Northern Africa: Tunisia case. J. Arid Environ. 2012, 81, 77–83. [Google Scholar] [CrossRef]
  69. Bai, Y.; Tao, T.; Gu, C.; Wang, L.; Feng, K.; Shan, Y. Mudflat soil amendment by sewage sludge: Soil physicochemical properties, perennial ryegrass growth, and metal uptake. Soil Sci. Plant Nutr. 2013, 59, 942–952. [Google Scholar] [CrossRef]
  70. Toková, L.; Igaz, D.; Horák, J.; Aydın, E. Can application of biochar improve the soil water characteristics of silty loam soil? J. Soils Sediments 2023, 23, 2832–2847. [Google Scholar] [CrossRef]
  71. Kamali, M.; Sweygers, N.; Al-Salem, S.; Appels, L.; Aminabhavi, T.M.; Dewil, R. Biochar for soil applications-sustainability aspects, challenges and future prospects. Chem. Eng. 2022, 428, 131189. [Google Scholar] [CrossRef]
  72. Skic, K.; Sokołowska, Z.; Boguta, P.; Skic, A. The effect of application of digestate and agro-food industry sludges on dystric cambisol porosity. PLoS ONE 2020, 15, e0238469. [Google Scholar] [CrossRef] [PubMed]
  73. Dlapa, P.; Hrinik, D.; Hrabovsky, A.; Simkovic, I.; Zarnovican, H.; Sekucia, F.; Kollár, J. The impact of land-use on the hierarchical pore size loamy soils. Water 2020, 12, 339. [Google Scholar] [CrossRef]
  74. Li, Y.; Hong, C.; Wang, Z.; Xing, Y.; Yang, J.; Feng, L.; Hu, J.; Li, Z.; Zhang, Z.; Zhao, H.; et al. Fractal characteristics of biochars derived from Penicillin v potassium residue pyrolysis. J. Anal. Appl. Pyrolysis 2019, 141, 104636. [Google Scholar] [CrossRef]
  75. Franus, W.; Jozefaciuk, G.; Bandura, L.; Franus, M. Use of spent zeolite sorbents for the preparation of lightweight aggregates differing in microstructure. Minerals 2017, 7, 25. [Google Scholar] [CrossRef]
  76. Rezanezhad, F.; Quinton, W.; Price, J.; Elliot, T.; Elrick, D.; Shook, K. Influence of pore size and geometry on peat unsaturated hydraulic conductivity computed from 3D computed tomography image analysis. Hydrol. Process. 2010, 24, 2983–2994. [Google Scholar] [CrossRef]
  77. Sokołowska, Z. Fractal dimension of the peat-muck soils at different state of their secondary transformation. Acta Agroph. 2002, 68, 193–204. [Google Scholar]
  78. Sokołowska, Z.; Warchulska, P.; Sokołowski, S. Trends in soil fractal parameters caused by accumulation of soil organic matter as resulting from the analysis of water vapor adsorption isotherms. Ecol. Complex. 2009, 6, 254–262. [Google Scholar] [CrossRef]
  79. Lipetzky, P.; Wanner, A. On the problem of interpreting flexure experiments on semi-brittle materials. Mater. Sci. Eng. 1996, 211, 87–94. [Google Scholar] [CrossRef]
  80. Long, M. Review of peat strength, peat characterisation and constitutive modelling of peat with reference to landslides. Stud. Geotech. Mech. 2005, 27, 67–90. Available online: https://api.semanticscholar.org/CorpusID:54977320 (accessed on 21 November 2023).
  81. Boylan, N.; Long, M. Evaluation of peat strength for stability assessments. Geotech. Eng. 2012, 167, 421–430. [Google Scholar] [CrossRef]
  82. Julianto, F.E.; Harwadi, F.R. Characteristics of Palangkaraya fibrous peat. MATEC Web Conf. 2019, 276, 05008. [Google Scholar] [CrossRef]
  83. Assi, L.N.; Deaver, E.E.; Ziehl, P. Effect of source and particle size distribution on the mechanical and microstructural properties of fly ash-based geopolymer concrete. Constr. Build Mater. 2018, 167, 372–380. [Google Scholar] [CrossRef]
  84. Traven, K.; Cesnovar, M.; Ducman, V. Particle size manipulation as an influential parameter in the development of mechanical properties in electric arc furnace slag-based AAM. Ceram. Int. 2019, 45, 22632–22641. [Google Scholar] [CrossRef]
  85. Horvat, B.; Ducman, V. Influence of particle size on compressive strength of alkali activated refractory materials. Materials 2020, 13, 2227. [Google Scholar] [CrossRef] [PubMed]
  86. Gili, A.; Alonso, E.E. Microstructural deformation mechanisms of unsaturated granular soils. Int. J. Numer. Anal. Methods Geomech. 2002, 26, 433–468. [Google Scholar] [CrossRef]
  87. Abiven, S.; Menasseri, S.; Angers, D.A.; Leterme, P. Dynamics of aggregate stability and biological binding agents during decomposition of organic materials. Eur. J. Soil Sci. 2007, 58, 239–247. [Google Scholar] [CrossRef]
  88. Byun, Y.H.; Tran, K.; Yun, T.S.; Lee, J.S. Strength and stiffness characteristics of unsaturated hydrophobic granular media. Geotech. Test. J. 2011, 35, 193–200. [Google Scholar] [CrossRef]
  89. Chen, Y.; Sun, H. Shear behavior of hydrophilic and hydrophobic unsaturated sands. Sci. Technol. Stud. 2019, 59, 961–966. [Google Scholar] [CrossRef]
  90. de Blas, E.; Rodriguez-Alleres, M.; Almendros, G. Speciation of lipid and humic fractions in soils under pine and eucalyptus forest in northwest Spain and its effect on water repellency. Geoderma 2010, 155, 242–248. [Google Scholar] [CrossRef]
  91. Kleber, M.; Eusterhues, K.; Keiluweit, M.; Mikutta, C.; Mikutta, R.; Nico, P.S. Mineral–organic associations: Formation, properties, and relevance in soil environments. In Advances in Agronomy, 2nd ed.; Sparks, D.L., Ed.; Academic Press: Cambridge, MA, USA, 2015; Volume 130, pp. 1–140. [Google Scholar] [CrossRef]
  92. Jozefaciuk, G.; Czachor, H. Impact of organic matter, iron oxides, alumina, silica and drying on mechanical and water stability of artificial soil aggregates. Assessment of new method to study water stability. Geoderma 2014, 221, 1–10. [Google Scholar] [CrossRef]
  93. Sokołowska, Z.; Szewczuk-Karpisz, K.; Turski, M.; Tomczyk, A.; Cybulak, M.; Skic, K. Effect of wood waste and sunflower husk biochar on tensile strength and porosity of dystric cambisol artificial aggregates. Agronomy 2020, 10, 244. [Google Scholar] [CrossRef]
  94. Chan, K.Y.; Zwieten, L.V.; Meszaros, I.; Downie, A.; Joseph, S. Agronomic values of greenwaste biochar as a soil amendment. Aust. J. Soil Res. 2007, 45, 629–634. [Google Scholar] [CrossRef]
  95. Busscher, W.J.; Novak, J.M.; Ahmedna, M. Physical effects of organic matter amendment of a southeastern us coastal loamy sand. Soil Sci. 2011, 176, 661–667. [Google Scholar] [CrossRef]
  96. Zong, Y.; Xiao, Q.; Lu, S. Acidity, water retention, and mechanical physical quality of a strongly acidic Ultisol amended with biochars derived from different feedstocks. J. Soils Sediments 2016, 16, 177–190. [Google Scholar] [CrossRef]
  97. Blanco-Canqui, H. Biochar and soil physical properties. Soil Sci. Soc. Am. J. 2017, 81, 687–711. [Google Scholar] [CrossRef]
  98. Joseph, S.D.; Camps-Arbestain, M.; Lin, Y.; Munroe, P.; Chia, C.H.; Hook, J.; van Zwieten, L.; Kimber, S.; Cowie, A.; Singh, B.P.; et al. An investigation into the reactions of biochar in soil. Aust. J. Soil Res. 2010, 48, 501–515. [Google Scholar] [CrossRef]
  99. Horabik, J.; Jozefaciuk, G. Structure and strength of kaolinite-soil silt aggregates: Measurements and modelling. Geoderma 2021, 382, 114687. [Google Scholar] [CrossRef]
Figure 1. Particle size distributions of the studied substrates: silt (SILT), peat (PEAT), humic acid ex-tracted from the peat (HA), residue after HA extraction from the peat (RES), and biochars obtained from the peat after 300 °C and 600 °C heating (BC300 and BC600, respectively).
Agriculture 13 02241 g001
Figure 2. FTIR spectra of the original peat (PEAT), humic acid extracted from the peat (HA), residue after HA extraction from the peat (RES), and biochars obtained from the peat after 300 °C and 600 °C heating (BC300 and BC600, respectively). Characteristics are displayed as an average of three measurements with 256 scans at 2 cm−1 resolution each.
Agriculture 13 02241 g002
Figure 3. Average variable charge vs. pH curves (left) and distribution functions of apparent surface dissociation constants (right) for the original peat (PEAT), humic acid extracted from the peat (HA), residue after HA extraction from the peat (RES), and biochars obtained from the peat after 300 °C and 600 °C heating (BC300 and BC600, respectively). Points marked in the titration curves represent surface charge developed at mid values of the silt–organic mixtures. The error bars are omitted not to shadow the details.
Agriculture 13 02241 g003
Figure 4. SEM images (magnification 1000×) of the surfaces of the broken aggregates containing maximum doses of organic substances and that of the pure silt without organic additives and with no native organic matter. The arrow in the silt image shows mineral particles, while for aggregates with organic substrates, it shows organic particles locations. Higher magnifications of the arrow-indexed areas are presented in the lower right corner. The scale bar shown in the BC300 image is common for all pictures.
Agriculture 13 02241 g004
Figure 5. Exemplary mercury intrusion curves for the studied silt aggregates containing various proportions of original peat (PEAT), humic acid extracted from the peat (HA), the residue after HA extraction from the peat (RES), and biochars obtained from the peat after 300 °C and 600 °C heating (BC300 and BC600, respectively). The curves selected are closest to the average. The dashed lines show the curves for 100% organic aggregates and the dried suspension for HA. The curve for the original soil silt (SILT) is drawn in each figure for easier comparison. Note different scales on the V-axis for various aggregate groups. The experimental deviation ranges (error bars) are omitted not to shadow the details.
Agriculture 13 02241 g005
Figure 6. Dependence of bulk density, total pore volume and average pore diameter (from left to right) of the studied silt aggregates on the percentage of the added organic material: peat (PEAT), humic acid extracted from the peat (HA), the residue after HA extraction from the peat (RES), and biochars obtained from the peat after 300 °C and 600 °C heating (BC300 and BC600, respectively). The error bars are standard deviations.
Agriculture 13 02241 g006
Figure 7. Dependence of intrinsic pore volume (left) and average intrinsic pore diameter (right) of the studied silt aggregates on a percentage of the added organic material: peat (PEAT), humic acid extracted from the peat (HA), the residue after HA extraction from the peat (RES), and biochars obtained from the peat after 300 °C and 600 °C heating (BC300 and BC600, respectively). The error bars are standard deviations.
Agriculture 13 02241 g007
Figure 8. Dependence of pore surface fractal dimension of the studied silt aggregates on the percentage of the added organic material: peat (PEAT), humic acid extracted from the peat (HA), the residue after HA extraction from the peat (RES), and biochars obtained from the peat after 300 °C and 600 °C heating (BC300 and BC600, respectively). The error bars are standard deviations.
Agriculture 13 02241 g008
Figure 9. Exemplary stress–strain curves for the original peat (PEAT), the residue after HA extraction from the peat (RES), and biochars obtained from the peat after 300 °C and 600 °C heating (BC300 and BC600, respectively). The curves selected are the closest to the average ones. Note different units on the stress axis in both plots. The experimental deviation ranges (error bars) are omitted not to shadow the details.
Agriculture 13 02241 g009
Figure 10. Exemplary stress strain curves for the soil silt aggregates amended with various proportions of original peat (PEAT), humic acid extracted from the peat (HA), and the residue after HA extraction from the peat (RES), and for biochars obtained from the peat after 300 °C and 600 °C heating (BC300 and BC600, respectively). Selected curves are the closest to the average. Note different scales on both axes for various aggregate groups. The experimental deviation ranges (error bars) are omitted not to shadow the details.
Agriculture 13 02241 g010
Figure 11. Dependence of maximum stress of the studied silt aggregates on the percentage of the added organic material: peat (PEAT), humic acid extracted from the peat (HA), the residue after HA extraction from the peat (RES), and biochars obtained from the peat after 300 °C and 600 °C heating (BC300 and BC600, respectively). The error bars are standard deviations.
Agriculture 13 02241 g011
Table 1. Average particle diameter and solid phase (particle) density of the studied substrates.
SILTPEATHARESBC300BC600
Average particle diameter; d [µm]3.700.570.060.290.240.23
Particle density; SPD [g·cm−3]2.731.611.491.501.591.82
Table 2. Values of surface charge (Q) at mid values of the pH of silt–organic mixtures and average apparent surface dissociation constants (pKapp,av) for the studied organic substrates.
PEATHARESBC300BC600
Average particle diameter; d [µm]0.490.710.420.320.10
Particle density; SPD [g·cm−3]6.476.186.987.157.52
Table 3. Bulk densities and MIP parameters for aggregates of the pure substrates.
SILTPEATHA 1RESBC300BC600
Bulk density; BD [cm3·g−1]1.380.69n.d.0.650.820.85
Total pore volume; Vt [cm3·g−1]0.320.500.510.730.750.60
Average pore diameter; dav [µm]7.021.9713.13.852.351.10
1 HA dried paste.
Table 4. Intrinsic pore volumes and average diameters of the studied substrates.
SILTPEATHA 1RESBC300BC600
Intrinsic pore volume; Vint [cm3·g−1]0.180.230.030.380.440.37
Average intrinsic pore diameter; dav,int [µm]1.330.860.011.070.970.77
1 HA dried paste.
Table 5. Parameters of Equation (1) for the studied aggregates.
PEATHARESBC300BC600
A, [MPa]0.5923.8870.3860.0850.045
k0.0630.0900.0040.0510.955
Smax of aggregate of pure substrate, [MPa]2.10n.d.0.9400.0710.026
Table 6. General trends in changes of structural parameters for the studied aggregates. The plus and minus signs present increase or decrease of given parameter, respectively. The table is divided into two parts: the left one depicts changes in a given parameter at small doses of particular organic material, and the right one illustrates their behavior at higher doses.
Initial ChangesFurther Trends
ParameterPEATHARESBC300BC600PEATHARESBC300BC600
Maximum strength+++++
Bulk density++++
Total pore volume+++++
Average pore diameter+++++
Intrinsic pore volume+++++
Intrinsic pore diameter+++++
Fractal dimension+
Disclaimer/Publisher’s Note: The statements, opinions and data contained in all publications are solely those of the individual author(s) and contributor(s) and not of MDPI and/or the editor(s). MDPI and/or the editor(s) disclaim responsibility for any injury to people or property resulting from any ideas, methods, instructions or products referred to in the content.

