1. Introduction
The per capita disposable income of Chinese urban and rural residents in 2020 was projected to reach CNY 48,839 and CNY 17,132 yuan, respectively, representing an approximately seven-fold and four-fold increase compared to the levels observed in 1978. As income continues to grow and living conditions improve, the consumption patterns of Chinese residents have undergone significant transformations. In 2020, the national Engel coefficient stood at 30.2%, significantly lower than the level recorded in 2000 (39.4%), indicating a gradual weakening role of food expenditure within overall consumption. Moreover, there has been a notable structural adjustment in food consumption with declining trends and increasing meat consumption rates. Major factors contributing to the rapid growth of meat consumption encompass economic development and urbanization [
1,
2], an increase in average personal income and population growth [
3,
4], as well as price dynamics, population age structure, and consumption patterns outside the home [
5,
6,
7], among other determinants. In the future, meat consumption is expected to continue increasing in China and globally. Specifically, developing countries are projected to experience faster growth in meat consumption, while developed countries will see a slower rate of increase [
8].
With the increasing consumption of meat, the internal consumption structure of meat is undergoing constant adjustments, albeit in varying directions across different countries and regions. In the United States, poultry experienced rapid growth and now surpasses beef as the primary meat consumed. While beef consumption has traditionally held the top position in Brazil, however, there has been a significant surge in poultry consumption, which has now surpassed pork and mutton to become the second-largest meat consumed. The consumption of pork remains predominant in Germany and Japan, while mutton and poultry constitute the second largest meat consumption in both countries. Furthermore, there has been a continuous growth in poultry consumption observed in both nations [
9]. At the international level, there has been a declining trend in the proportion of red meat consumption, primarily attributed to pigs, cattle, and mutton, while there has been a gradual increase in the proportion of white meat consumption dominated by poultry and aquatic products [
10].
China has witnessed a rapid surge in meat consumption, with per capita intake escalating from 24.84 kg in 1990 to 61.27 kg in 2020 [
9]. China’s adjustment trend in meat demand aligns with global patterns, characterized by a declining proportion of red meat consumption and a gradual increase in white meat consumption. Between 1990 and 2020, the share of red meat consumption in China decreased from 86% to 74%, primarily driven by a remarkable consumption proportion decline exceeding 20% in pork [
9]. At the same time, poultry consumption shares increased from 13% in 1990 to 24% in 2020 and consistently maintained an upward trajectory. Poultry effectively serves as a substitute for red meat [
9].
The growth of meat consumption and structural adjustment have profound and extensive implications. Firstly, from a health perspective, the consumption of white meat is considered healthier than red meat [
11,
12]. Numerous studies have consistently demonstrated that red meat intake increases the risk of colorectal or colon cancer [
13]. Certain studies have indicated a positive association between red meat consumption and bladder cancer incidence, as well as its correlation with cardiovascular disease and diabetes [
14,
15]. Conversely, fish consumption has been inversely linked to stroke occurrence, particularly ischemic stroke and coronary heart disease [
16,
17]. White meats are abundant in nutrients containing various functional components that greatly benefit human health [
18].
Secondly, the growth of meat consumption and structural adjustment are intricately linked to environmental pollution. Currently, meat accounts for the largest proportion of carbon emissions in food consumption, making it imperative to reduce the scale of animal husbandry or meat consumption to mitigate greenhouse gas emissions [
19]. Research conducted in Brazil has demonstrated that red meat consumption significantly contributes to lowering carbon emissions [
20]. Similarly, studies based in the United States have indicated that meat consumption acts as a detrimental factor impacting terrestrial ecosystems and biodiversity [
21]. Consequently, it is recommended to decrease the intake of meat products or substitute such as cattle with poultry alternatives [
22].
Thirdly, the growth of meat consumption demand for feed grains in China. In 2014, feed grain production and consumption accounted for over one-third of that year’s total grain output, with a utilization rate of 58.79% by 2050, making it the most crucial component of China’s grain consumption. Consequently, China’s food security issue will transform into a feed food security problem [
23,
24,
25]. The influence of structural adjustments in meat consumption on feed grain utilization primarily stems from varying feed grain conversion rates between different types of meat production. Poultry exhibits stronger feed grain conversion efficiency in terms of weight gain compared with pork. Substituting poultry meat demand for pork can effectively enhance the utilization rate of feed grains and mitigate the rapid growth in demand [
25].
Fourthly, from the policy review, promoting poultry consumption as a means to address grain scarcity, improve public health, and mitigate environmental issues is not the sole solution. Improved residents’ dietary structure [
26,
27,
28], increased green-oriented public investment [
29], and the implementation of the Healthy China 2030 Strategy [
30,
31] can all address the aforementioned issues to varying degrees. However, evaluating the effectiveness of these policy clusters is not the focus of this article. On the contrary, promoting the transformation of meat consumption structure is an important supplement to such policies.
In general, many studies have examined the impact of adjusting meat consumption patterns on residents’ nutrition and health, feed and grain safety, and ecological environment, giving references for numerous studies. These studies also provide a theoretical foundation for the simulation analysis conducted in this paper. But few studies have analyzed the meat consumption structure from the dual perspectives of food security and carbon reduction. The comprehensive impact of changes in meat demand patterns has not received widespread attention. Therefore, focusing on these issues has an explicit academic contribution.
The central question addressed in this study is as follows: If China further intensifies the trend of replacing red meat with poultry consumption, what will be the implications for annual feed grain demand and agricultural carbon emissions while ensuring that residents’ nutrient intake remains unaffected? How significant is this effect? In addressing these questions, this paper not only imposes nutritional constraints on meat consumption adjustments but also comprehensively considers multidimensional influences resulting from such adjustments, thereby contributing to its novelty. The objectives of this research can be viewed as both a feasibility analysis of doubling poultry consumption to replace red meat consumption and as offering new insights into ensuring food security, achieving carbon reduction targets, and advancing Healthy China 2030.
2. Materials and Methods
2.1. Model Introduction and Theoretical Analysis
In the empirical analysis section of this paper, we primarily utilize the China Agricultural Sectoral Model (CASM) for simulation analysis. The CASM is a dynamic agricultural partial equilibrium tool for policy analysis jointly developed by the Chinese Academy of Agricultural Sciences and the International Food Policy Research Institute (IFPRI). It encompasses various commodities, including grains, cotton, oilseeds, sugar, meat, eggs, milk, and other agricultural products.
The data foundation of the CASM model is mainly based on China’s produced market balance data. “Brick Agricultural Database” and “China National Grain & Oils Information Center ” are the two most important data sources; we collect supply and demand data for different products from here. Based on these, product demand is categorized into direct consumption demand, feed demand, processing demand, and other categories to depict changes.
In recent years, the scope of the CASM model has been expanding continuously, incorporating modules for carbon emissions and nutrition and health. As a result, its functionality is becoming increasingly refined, enabling it to successfully undertake more intricate simulation tasks. Due to the complexity of the equations involved in the CASM, detailed research methods have not been provided here for simplicity’s sake. The subsequent section offers a concise overview of pertinent equations combined with the core mechanism of numerical simulation employed in this study. Particularly, the carbon emissions calculated in this article are not just carbon dioxide emissions but carbon dioxide equivalent emissions (CO
2 eq). The “carbon emission” in the following article are all CO
2 eq;
Section 2.2 presents a detailed calculation method.
where
QDFHPCC,H,T are per capita consumption;
PDCP,T is the consumer price;
INCPCH,T is per capita income;
is the price elasticity of residents’ food demand;
is the income elasticity of residents’ food demand, where
C and
CP are products;
H is population groups (including urban residents and rural residents);
T is the year; and
DFPH refers to products available for food consumption. Formula (1) describes the linkage relationship of different agricultural product markets; that is, the demand for a certain type of agricultural product is also affected by the prices of other agricultural products, and the interaction between different agricultural product markets is realized via price changes. In addition,
in Formula (1) is the residents’ spontaneous demand preference for a certain agricultural product, which is an exogenous parameter rather than an endogenous variable and needs to be calibrated according to the base period data. In this study, the simulation of changes in residents’ demand for poultry meat and demand for red meat starts from the adjustment of this item.
Formula (2) represents the market clearing equation. For crop X, domestic production
QXC,T + import
QMC,T − export
QEC,T = domestic demand
QDTC,T. Via this equation model, changes in the demand end are transmitted to the production end.
Formula (3) is the feed demand equation, where FEESCFEED,CLVS,T is the demand for various kinds of feed for each animal product; QXCLVS,T is the output of animal products; and IOXLCFEED,CLVS is the feed grain conversion rate of different livestock products. For variable subscripts, CFEED is the crop that can be used for feed, T is the time, and CLVS is various animal products. Via this equation, changes in the production end of livestock products are transmitted to the feed demand end. (1)–(3) basically describes the logic of the impact of meat demand on meat production and feed demand process.
Based on the aforementioned description of the relevant components of the CASM, presented below is a logical relationship diagram illustrating the core variables in this study (
Figure 1). As depicted, initial exogenous changes occur in the meat demand structure. Given that there exists a supply–demand equilibrium within our agricultural product model, alterations in poultry demand will consequently impact poultry meat supply and subsequently influence poultry meat output. Similarly, variations in red meat demand will lead to corresponding changes in red meat production. Furthermore, due to disparate feed conversion rates among different livestock and poultry species, modifications in the meat demand structure will further affect the overall structure of feed grain supply and demand. Likewise, distinct carbon emission coefficients associated with various production processes necessitate that any shifts in the composition of meat production will inevitably impact animal husbandry’s overall carbon emissions. From a supply-side perspective to a demand-side perspective, adjustments made to the meat demand structure are directly linked to residents’ nutritional intake. Lastly, this paper calculates carbon data by multiplying agricultural product output and demand by their respective carbon emission coefficients and nutrient content coefficients—a fundamental concept underlying our incorporation of both the carbon emission module and nutrition/health module into the CASM model framework. Subsections provide detailed explanations regarding calculation methods for both agricultural products’ carbon emission coefficients as well as nutritional health coefficients.
2.2. Carbon Emission Equivalent Measurement Methods
The measurement unit of carbon emissions in this paper is the carbon dioxide emission equivalent, which converts various greenhouse gas emissions into corresponding carbon dioxide emissions based on their actual temperature increase effects and aggregates them to obtain the total carbon emission equivalent. Specifically, for livestock products, the carbon emissions are determined by multiplying the FAO database (FAOSTAT) derived carbon emission equivalent coefficients with the corresponding product outputs.
The calculation process of carbon emissions at the crop level is relatively intricate, primarily considering four factors: straw combustion, crop residues in cultivated land, energy consumption in groundwater extraction for irrigation, and fertilizer utilization. Among these factors, the carbon emission equivalent data of different products in China from the FAOSTAT was divided by the sown area of a specific crop to derive the corresponding category’s carbon dioxide emission equivalent coefficient.
The carbon emission equivalent of fertilizer use is currently only estimated at the national level, lacking data on crop-specific variations, which necessitates segmentation and calculation based on actual fertilizer usage for different crops. The initial step involves converting the quantity of fertilizer used by various crops into an equivalent amount of compound fertilizer. Assuming comparable fertilization practices across different crops, we calculate the carbon emission equivalent of fertilizer use for each crop. This value is then divided by the corresponding sown area to derive the carbon emission equivalent coefficient specific to that crop’s fertilizer usage. By summing up these coefficients for four representative crops, we obtain the overall carbon emission coefficient per unit land area. Finally, multiplying this coefficient by a given year’s sown area yields the total carbon emissions from that crop.
It is worth noting that the carbon equivalent data utilized in this article are sourced from the 2019 FAOSTAT. The reason why the latest data are not used is mainly because the FAO has not released carbon emission data after 2019. Furthermore, considering China’s proposed “carbon peak” by 2030 and “carbon neutrality” by 2060, alongside advancements in agricultural technology leading to a reduction in carbon intensity, subsequent studies assume a gradual decline over time in the carbon emission coefficient per unit yield of livestock products and per unit area of crops.
2.3. Methods for Measuring Nutrient Content of Agricultural Products
Before calculating the nutritional content of agricultural products, this study addresses the issue of incomplete edibility in certain agricultural products. By referring to the relevant expressions in Table of Food Composition in China, we initially determine the edible proportion coefficient for different agricultural products and utilize it to derive the actual per capita consumption of agricultural products by multiplying it with the per capita demand. Similar to carbon emission data, nutrient intake data is not directly calculated by our model; instead, it represents an indirect analysis based on solution results of endogenous variables within our model. The nutrient intake (carbohydrate, protein, fat, and energy) for various agricultural products is also sourced from the China Food Composition Table.
2.4. Simulation Schemes
In this study, we first simulate the benchmark simulation scheme, which primarily focuses on the natural growth of basic economic variables such as economy and population without considering other exogenous shocks. The purpose is to provide a reference frame for other policy simulation schemes. Based on the benchmark simulation scheme, we further simulate two scenarios where poultry demand replaces red meat.
In order to ensure comparability among different simulation schemes, this study will establish the daily intake of animal product protein for residents in 2035 as the nutritional standard in the baseline scheme while maintaining a similar level of animal protein intake in other simulation schemes for 2035. Another objective of imposing such constraints is to simulate the effects of changes in meat demand structure without compromising the population’s nutritional intake.
2.4.1. Baseline Simulation Scenario (BASE)
The model employed in this study adopts a base period of 2020 and a simulation period spanning from 2021 to 2035. The baseline program primarily establishes exogenous growth factors for the economy, population, and crop yield per unit area. The GDP growth rate is derived from forecast results provided by the Macroeconomic Research Center of the Chinese Academy of Social Sciences. Population growth rate is based on projections from the United Nations World Population Prospects. Regarding crop yield per unit area, it is assumed that during the simulation period, various crops will experience an increase in yield proportionate to exogenous factors, while their individual growth rates will be determined according to historical trends. As depicted in
Table 1, under the baseline simulation scheme, China’s average daily protein intake from livestock products is projected to reach 47.32 g by 2035, among which pork protein accounts for approximately 40% with an average daily intake of 19.1 g, while poultry protein contributes around 16% toward meat protein intake with an average daily consumption of 7.4 g.
2.4.2. Simulation Scenario 1: Doubling Poultry Consumption as a Substitute for Pork (SIM1)
According to the OECD-FAO Agricultural Outlook 2021–2030, poultry meat will account for 41% of global meat protein in 2030, an increase of 2 percentage points over the base period. At present, the proportion of poultry consumption is still low, and the per capita consumption of poultry meat in 2020 is 16.6 kg, accounting for only 15% of the protein intake of animal products, which is far lower than the world average. Simulation scenario 1 assumes that poultry consumption increases to replace pork red meat products, specifically in 2035, per capita consumption of poultry meat increases by about 100% compared to 2020, reaching 33.1 kg, per capita demand for pork decreases from 28.2 kg to 26.8 kg, and the rest of meat consumption maintains natural growth. As shown in
Table 1, the average daily intake of animal product protein of residents in scenario 1 in 2035 is 47.5 g, which meets the hard constraint that the intake of animal product protein of residents will not decrease. Among them, the average daily intake of poultry protein reached 9.2 g, accounting for about 24% of the meat protein intake, an increase of 8 percentage points compared with the benchmark program.
2.4.3. Simulation Scenario 2: Substituting Poultry for Red Meat in Consumption (SIM2)
Considering the inherent consumption habits of Chinese residents, pork is still the mainstream meat consumption in China for a period in the future. Simulation scenario 2 further relaxed the assumption that the consumption of poultry meat doubled to replace the consumption of red meat such as pork, beef, mutton, and so on, and shared the declining share of pork consumption with beef and mutton. Specifically, the per capita consumption of poultry meat in 2035 in scenario 2 is 33.5 kg, still about double the 2020 level. Pork demand rose from 28.2 kg to 29 kg over the same period, up about 2.7 percent. In addition, in scenario 2, the demand for beef and mutton no longer increases naturally but assumes that China’s per capita consumption of beef and mutton in 2035 will be basically the same as that in 2020. As shown in
Table 1, the average daily protein intake of livestock products in simulation scenario 2 is about 47.4 g, which is also slightly higher than the baseline simulation scenario and meets the relevant constraints. Among them, the daily protein intake of poultry accounted for 25%, an increase of about 9 percentage points compared with the baseline, while the protein intake of beef and mutton decreased by 1 percentage point, respectively.
3. Results
3.1. Changes in Meat Demand Structure and Production Structure
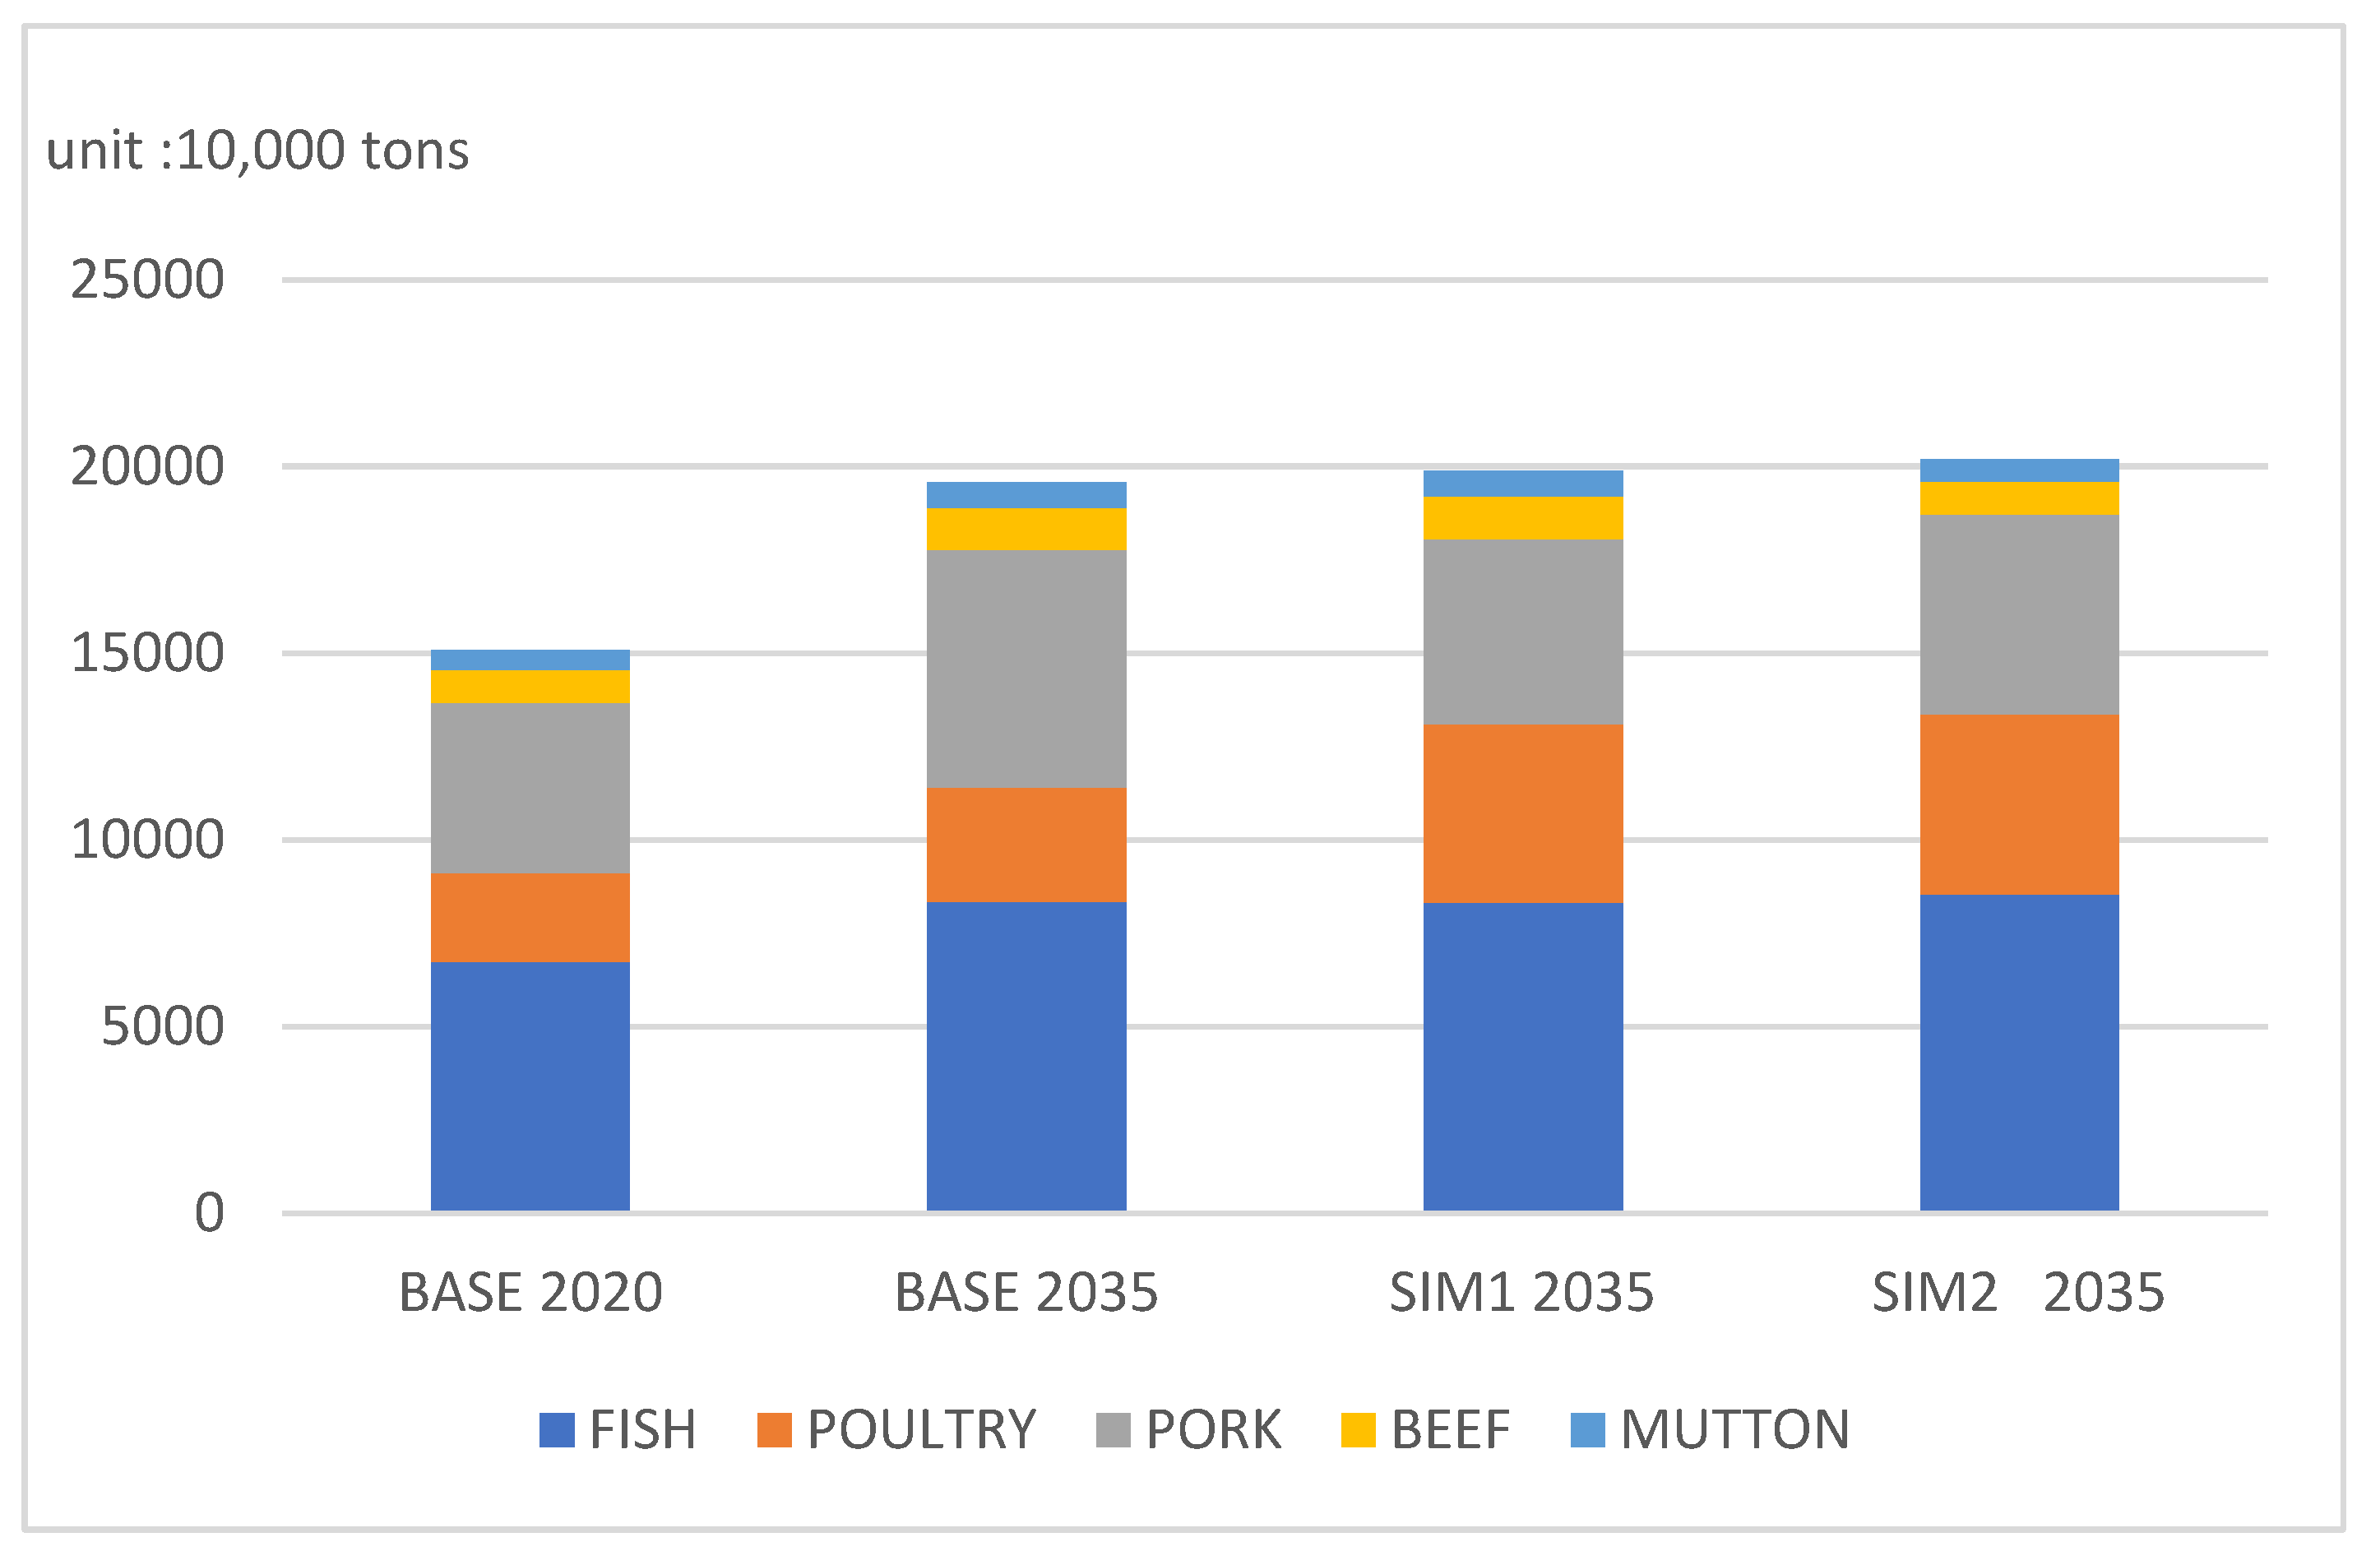
The demand for animal products in 2020 is projected to reach 151 million tons, as illustrated in
Figure 2. Under the baseline scenario, meat demand is expected to increase to 196 million tons by 2035. Considering SIM 1 and 2, China’s meat demand is estimated to reach 199 million tons and 202 million tons in 2035, respectively, surpassing the baseline scenario by approximately 3 million tons and 6 million tons.
According to the basic assumptions of meat demand growth in different simulation scenarios, the demand for poultry meat is projected to increase by approximately 100% compared to the baseline scenario by 2035 in SIM 1 and 2. Furthermore, the simulation results indicate that by 2035, pork demand in SIM 1 is expected to decrease by a significant amount of approximately 14.254 million tons compared with the baseline scenario for that year, reaching only about 47.447 million tons, representing a decline of around 22.4%. It is noteworthy that poultry consumption exhibits a substantial substitution effect on pork consumption within this context. Similarly, SIM 2 also predicts a reduction in pork demand by approximately 16% compared with the baseline scenario during the same period. However, it should be noted that this decrease rate is relatively smaller than that observed in SIM 1. The simulation results basically describe the substitution process of poultry demand for pork demand.
In terms of the demand for beef and mutton, the simulation scenarios predict a projected increase of 2.7% and 0.4%, respectively by 2035 compared to the baseline scenario. However, it is important to note that the consumption of beef and mutton is not significantly impacted as simulation 1 primarily focuses on replacing pork with poultry consumption. In SIM 2, there is a reduction in cattle and mutton consumption by 20.1% and 14%, respectively, in 2025 compared to the baseline scenario during the same period. The inclusion of poultry meat in this simulation serves as an effective substitute for pork, cattle, and sheep meat. Overall, these macro-level simulation results depict two distinct processes where poultry meat gradually replaces red meat.
Changes in demand will inevitably lead to corresponding adjustments in supply, as discussed in the theoretical mechanism section. Due to the local market equilibrium mechanism established by the CASM, changes in demand quantity will be transmitted to the supply side. Considering China’s long-term emphasis on agriculture and its commitment to ensuring self-sufficiency of important agricultural products, major animal product output is expected to increase with future demand growth while maintaining high self-sufficiency capacity. As shown in
Figure 3, China’s meat production is projected to reach 142 million tons in 2020 and 184 million tons by 2035 under baseline conditions. Under SIM 1 and 2, meat production is estimated at 187 million tons and 194 million tons, respectively, for that same year, an increase of three or ten million tons compared with benchmark simulations.
From the perspective of meat subdivision, by 2035, poultry meat production in SIM 1 is projected to reach 46.58 million tons, while pork production is estimated at 45.75 million tons. The output of poultry meat surpasses the demand for such products, aligning with the trend of increasing preference for poultry over pork. In SIM 2, poultry meat production is expected to reach 47.14 million tons in 2035, whereas pork production is forecasted to be around 49.81 million tons. Under the pressure to replace red meat consumption, some capacity from poultry meat production will be allocated toward beef and mutton products. Beef output is anticipated to decrease by approximately 6.63 million tons compared to its level in 2020; however, mutton output is expected to slightly exceed the previous year’s volume of 4.92 million tons. Poultry serves as a comprehensive alternative to red meat products.
3.2. Changes in Meat Demand Structure and Production Structure
Currently, pig and poultry feed dominate China’s feed production, with statistics from the Feed Industry Association indicating that in 2020, pig and poultry feed accounted for over 80% of total feed production. The adjustment in the meat demand structure will inevitably lead to changes in the feed demand structure. Firstly, at an aggregate level, the baseline scenario estimates a feed demand of approximately 430 million tons by 2035. In contrast, SIM 1 and 2 project a lower feed demand of 380 million tons and 410 million tons, respectively, by 2030, representing reductions of 50 million tons and 20 million tons compared to the baseline scenario during the same period. Substituting red meat consumption with poultry meat demonstrates evident grain-saving effects.
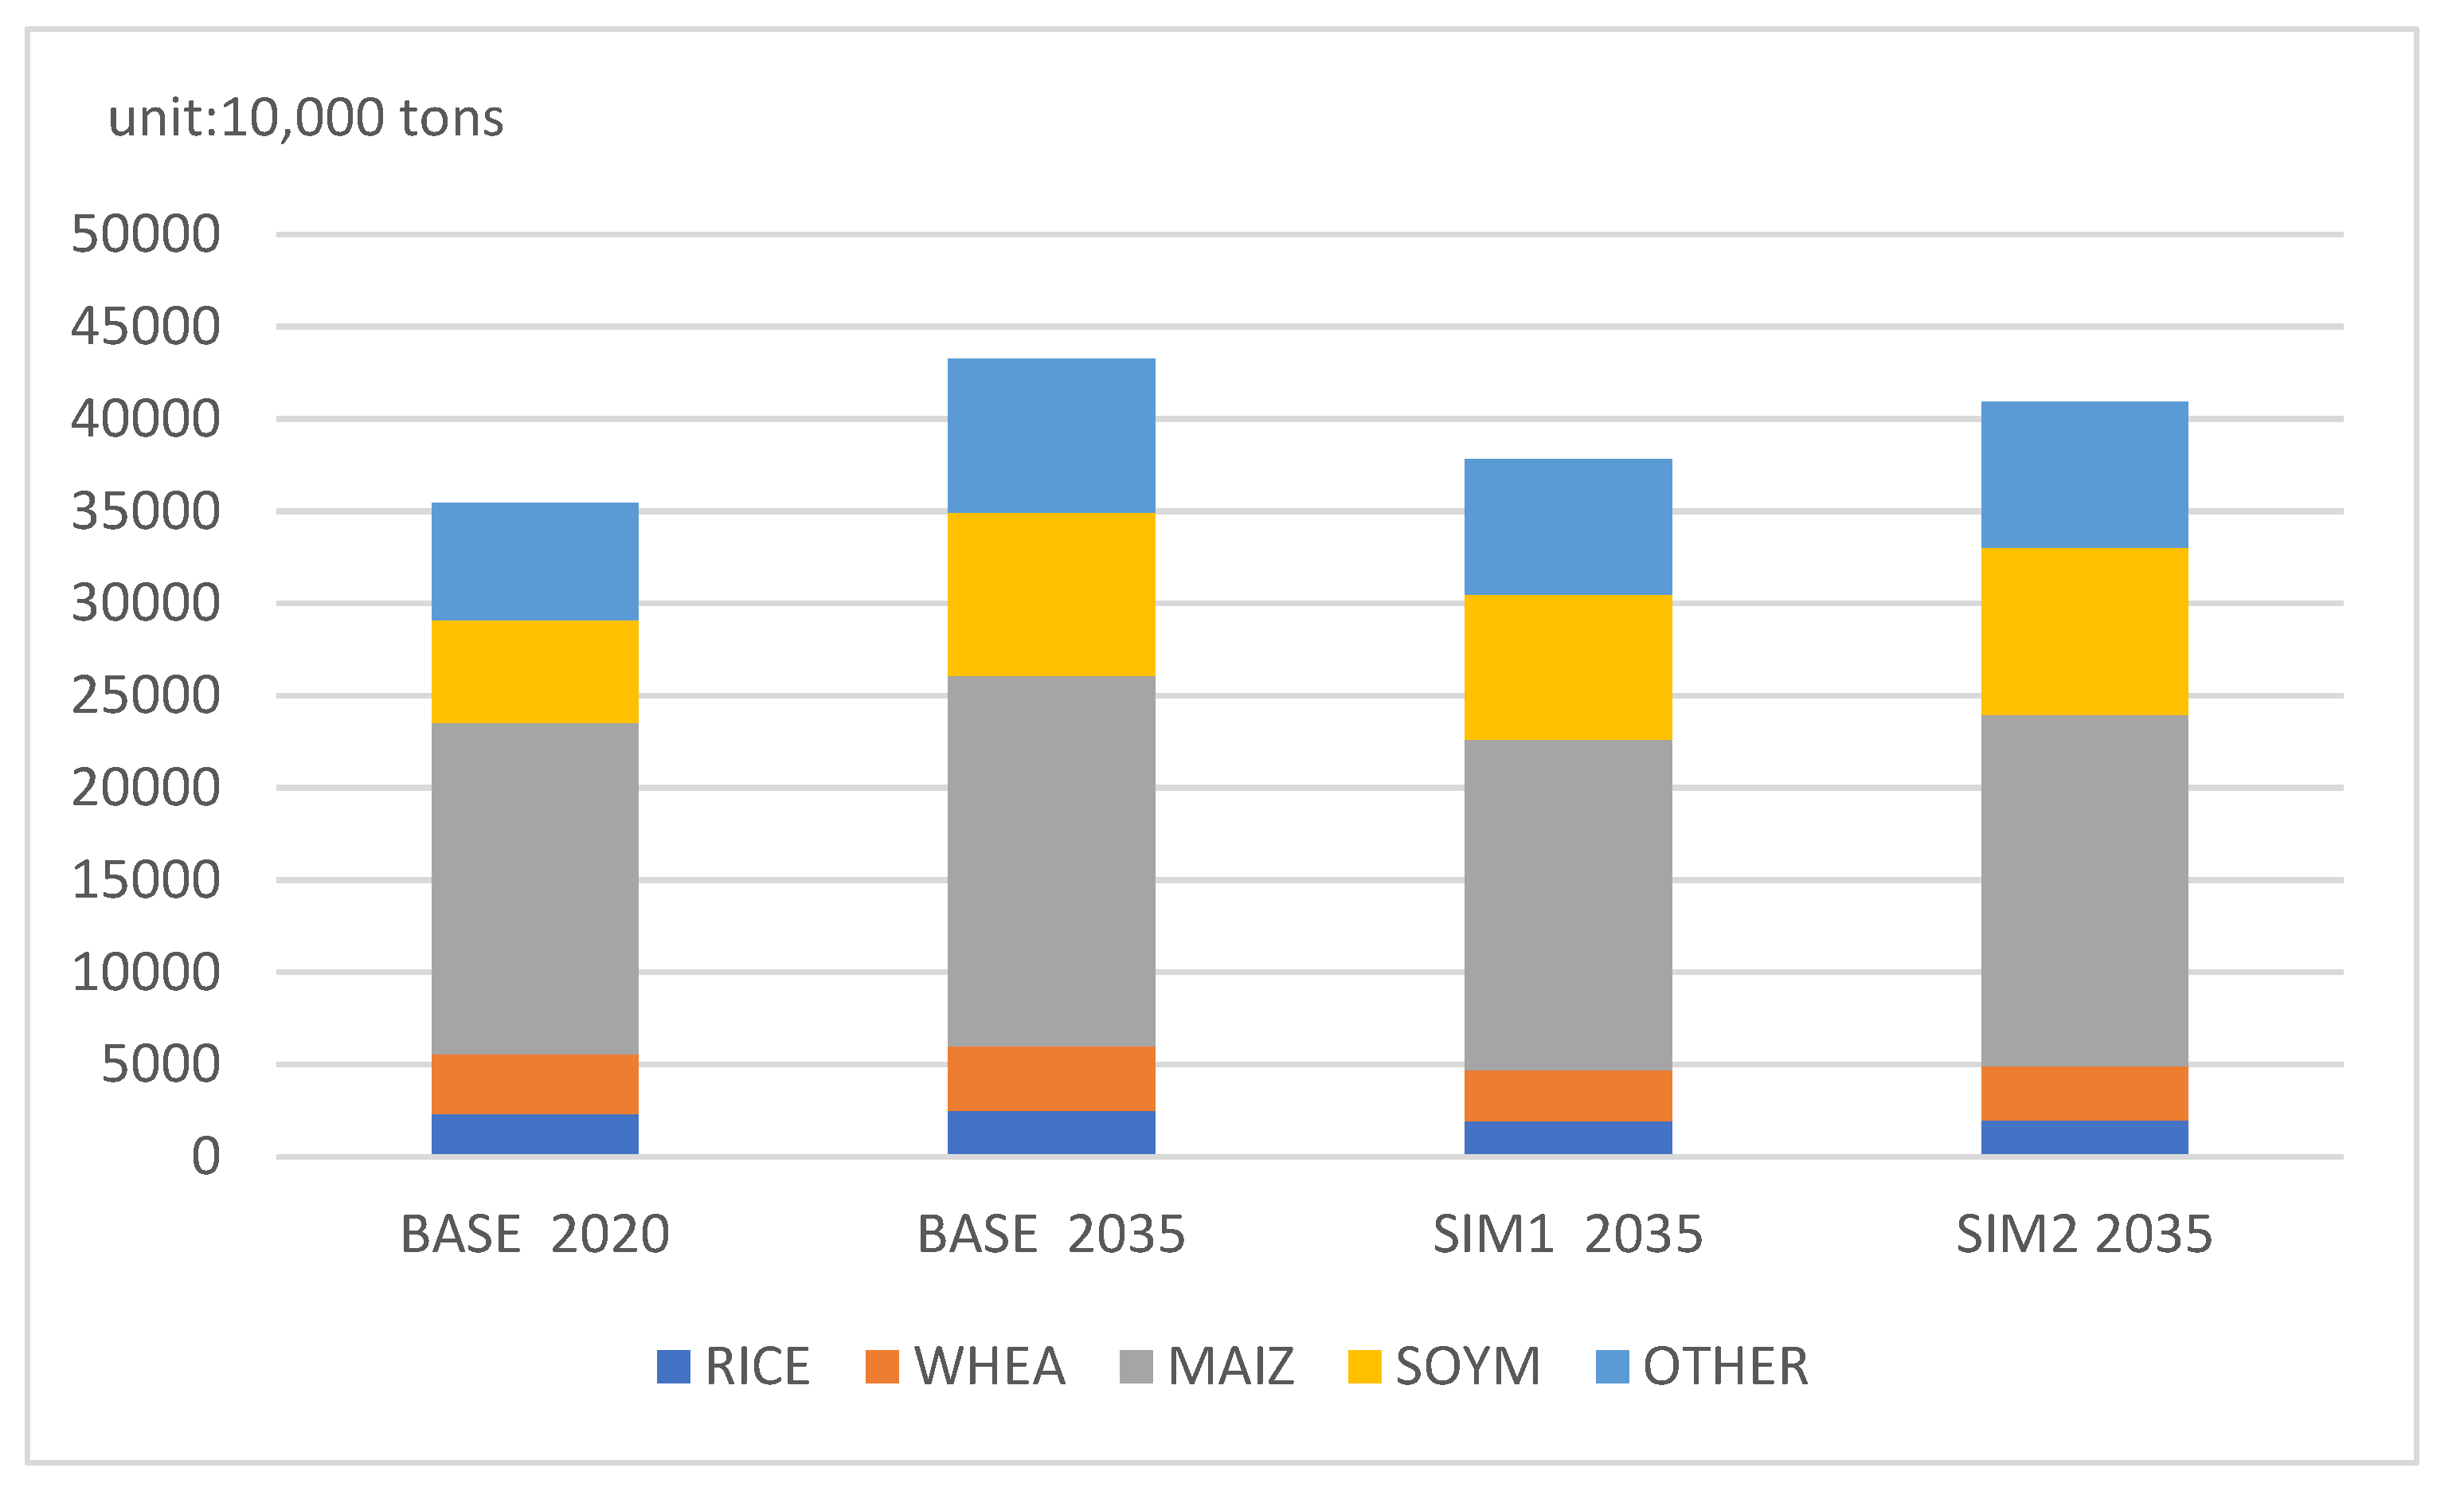
Based on the feed grain demand structure (
Figure 4), the baseline scenario shows the highest demand for wheat, followed by SIM 1 and 2. By 2035, SIM 1 and SIM 2 predict a lower demand for feed wheat at 27.49 million tons and 29.3 million tons, respectively, compared to the baseline scenario’s level of 35.18 million tons and the base period’s level of 32.66 million tons. This reduction in demand can be attributed to the use of wheat as an alternative to corn in pig breeding, which requires more wheat consumption, while poultry meat provides ample substitutes for pork, leading to a decline in forage wheat demands.
The second factor is the shift in demand structure for feed corn. Similar to feed wheat, the demand for feed corn is highest in the baseline scenario, followed by SIM 2, and lowest in SIM 1. By 2035, the demand for feed corn in SIM 2 is projected to be 190 million tons, while SIM 1 estimates a demand of 180 million tons. Both figures are lower than the baseline scenario’s level of 200 million tons during the same period. This indicates that substituting poultry meat for red meat can significantly reduce feed corn consumption. However, it should be noted that corn remains a crucial ingredient in various livestock and poultry feeds, resulting in higher demand for feed corn in SIM 2 due to increased meat output compared to SIM 1.
The third factor is the demand for soybean meal as livestock feed. Similar to corn, the demand for soybean meal is highest in the baseline scenario and lowest in SIM2. In the baseline scenario, the projected demand for soybean meal in 2035 is 88.6 million tons, whereas SIM 1 estimates it at 78.69 million tons during the same period, and SIM 2 predicts a demand of 90.6 million tons. Even from a perspective focused on soybean meal consumption, substituting red meat with poultry production capacity demonstrates a significant potential for grain savings. Furthermore, it should be noted that simulations with higher levels of meat production also exhibit greater demand for soybean meal.
3.3. Carbon Emission
Changes in meat production will inevitably result in alterations to the overall quantity and composition of agricultural carbon emissions. In the baseline scenario, agricultural carbon emissions are projected to reach 921 million tons by 2020, while by 2035, the total emissions for the baseline, SIM1, and SIM2 are estimated at approximately 1.092 million tons, 1.01 million tons, and 989 million tons, respectively. SIM 1 and 2 exhibit emission reductions of approximately 82 million tons and 103 million tons, respectively, compared to the baseline scenario, highlighting a significant mitigation effect on emissions via poultry consumption as an alternative to red meat.
According to the simulation results, the baseline, SIM 1, and SIM 2 are projected to have crop carbon emissions of 315 million tons, 306 million tons, and 321 million tons by 2035, respectively. This is primarily attributed to the direct influence of crop yield on planting carbon emissions. In this study, we simulate the linkage adjustment of meat demand structure as well as feed and grain demand structure, which directly reflects grain production. Consequently, scenarios with higher feed and grain demand exhibit elevated levels of carbon emissions.
The data presented in
Table 2 illustrates the relative proportions of agricultural carbon emissions from crops and animal products. Notably, animal products contribute significantly more to overall emissions compared to crops. By 2035, the baseline scenario estimates carbon emissions from animal products at 777 million tons, while SIM 1 and SIM 2 predict lower values of 704 million tons and 668 million tons, respectively. This disparity can be attributed to the relatively high carbon emission intensity associated with ruminant production (e.g., cattle and sheep), followed by pig breeding and poultry farming. Furthermore, red meat production exhibits a higher carbon emission intensity than poultry production. Consequently, the simulation scenario with the highest red meat output demonstrates the largest carbon emissions, whereas the scenario replacing pork with poultry meat ranks second in terms of emissions reduction potential. Remarkably, when considering a simulation scenario where poultry meat fully replaces pork, beef, mutton, and other red meats, although crop-related emissions are not minimized as expected in SIM 2, it is noteworthy that this strategy substantially reduces animal product-related emissions due to significant displacement of ruminant production capacity by poultry meat production capacity—making it the most effective scenario for emission reduction.
4. Discussion and Conclusions
Based on a comprehensive review of the existing literature on the dynamic mechanism of meat consumption structure adjustment and its impact, and in conjunction with the modeling strategy employed by China Agricultural Industry Model (CASM), this paper elucidates the underlying mechanisms through which adjustments in meat demand structure affect feed and grain demand, resident nutrition structure, agricultural carbon emissions, and other related issues. Subsequently, employing the latest version of CASM, various effects resulting from the restructuring of meat demand are simulated. Adhering to the principle that daily protein intake from livestock products for residents should not decrease, three simulation scenarios are established: baseline simulation scenario assuming no change in residents’ consumption preferences while allowing natural economic growth; SIM 1 where per capita poultry consumption is simulated to increase by 100% compared to the base period while significantly reducing per capita pork consumption and naturally increasing beef and mutton demand; In SIM 2, per capita poultry meat consumption is simulated to increase by 100% compared to the base period with replacement of red meats such as pigs, cattle, and sheep.
According to the relevant simulation results, in 2035, the average daily protein intake of livestock products will reach 47.3 g, per capita pork consumption will be 28.2 kg, per capita poultry consumption will be 19.6 kg, feed grain demand will reach 430 million tons, and agricultural carbon emissions will reach 1092 million tons. According to SIM 1, in 2035, the average daily protein intake of livestock products will reach 47.5 g, feed demand will be 380 million tons, and agricultural carbon emissions will be 1.01 billion tons, saving 50 million tons of feed grains compared with the baseline simulation scenario, and reducing emissions by 82 million tons. In SIM 2 of doubling poultry meat to replace red meat, the average daily protein intake of livestock products will reach 47.4 g in 2035, the feed demand will be 410 million tons, and the carbon emissions will be 989 million tons, saving 20 million tons of feed grains compared with the baseline simulation scenario, and reducing carbon emissions by 103 million tons. From the perspective of feed food safety, residents’ nutrition and health, and ecological environment improvement, it is quite advantageous to stimulate poultry consumption instead of red meat consumption. If the central policy objective is food security, poultry meat should be encouraged to replace pork primarily. However, if the policy is mainly to reduce carbon emissions, poultry consumption needs to be guided to replace pigs, cattle, sheep, and other products.
The “Healthy China 2030” plan explicitly emphasizes the need to promote “balanced dietary patterns” and highlights the importance of “establishing and enhancing a comprehensive nutrition monitoring system for residents, implementing targeted nutrition interventions in key regions and populations, addressing issues related to micronutrient deficiencies and excessive consumption of high-calorie foods such as oil and fat, gradually resolving the coexistence of inadequate and excessive nutrition among residents”. As previously mentioned, poultry is abundant in unsaturated fatty acids, making it a healthier alternative to red meat products like pork. Substituting poultry for pork can reduce the likelihood of residents developing cardiovascular diseases, cerebrovascular diseases, or various malignant cancers while ensuring adequate nutrient intake.
Although Chinese residents have traditionally exhibited a greater inclination toward pork consumption, consumer preferences demonstrate significant inertia. Moreover, there exist certain limitations on the immediate expansion of poultry meat production and processing capacity. This shift toward advocating poultry consumption also aligns with long-term policy objectives. Via the promotion of scientifically based dietary structures focused on nutrition and health, consumers’ preference for poultry meat is gradually increasing, leading to a more balanced consumption pattern. Additionally, it is crucial to enhance market regulations, improve monitoring systems, establish effective forecasting and early warning mechanisms, encourage local temporary storage of poultry products, and develop comprehensive plans for the production and supply of various meat commodities, including pork, beef, mutton, poultry meat, poultry eggs, and aquatic products, as well as other essential food items. By increasing the proportion of poultry production in the overall output of meat and enhancing overall production efficiency, measures can be taken toward replacing pork or red meat consumption with poultry consumption which will result in extensive nutritional benefits along with positive economic and ecological impacts. The implementation of these policies not only contributes to global food security but also directly promotes carbon emission reduction worldwide while providing significant positive externalities for regions beyond China, thereby fostering sustainable development within the global economy.


