Abstract
Preservation of widely available crop residues as silage could reduce feed shortages in Ethiopia. Four mixtures of banana pseudostem (BPS) and fresh maize stover (FMS) were prepared for fermentation considering the local conditions and available resources: 100% FMS, 80% FMS + 20% BPS, 60% FMS + 40% BPS and 95% BPS + 5% molasses. Each of the four mixtures was fermented in plastic bags as well as in plastic drums. Apart from the effect of the mixture and fermentation package, two fermentation locations were also considered. The fermentation was replicated three times for each combination of mixture, fermentation package and fermentation condition. The pH, microbial counts (total viable count, lactic acid bacteria count, Enterobacteriaceae count, yeast and mold count) and nutritional values of the fresh material and mixed silage were measured. Fermentation was successful for all mixed silages, reaching a pH below four, while the total viable count, Enterobacteriaceae count, yeast and mold count dropped (all p ≤ 0.05) and digestibility and metabolizable energy increased compared to the fresh mixtures. Enterobacteriaceae counts reached values below the detection limit in all mixed silages fermented in drums unlike the bag silages. The plastic bags used as fermentation package were found to be sensitive to damage, resulting in a a higher pH and visible signs of yeast and mold. Although fermentation of BPS with molasses resulted in a significant increase in dry matter digestibility (41.14 to 46.17–49.92%) and organic matter digestibility (50.52 to 55.22–58.75%), they were lower compared to most mixed silages with FMS. Fermentation of 80 and 60% FMS mixtures increased the crude protein content from 44.30 to 71.27–82.20 g/kg DM, and from 43.63 to 63.10–65.83 g/kg DM, respectively. The highest increase (1.77 MJ/kg DM) in metabolizable energy was recorded for 80% FMS fermented in drums. The location of fermentation had no effect on pH, microbial counts and nutritional values. This study demonstrates that crop by-products can be successfully fermented under conditions prevailing in Ethiopia, with drums being preferred over bags. Mixing BPS with FMS is advised to absorb BPS juice losses and obtain silage with more crude protein, neutral and acid detergent fibers and metabolizable energy, as well as a higher digestibility.
1. Introduction
Dairy production and productivity in Ethiopia are mainly constrained by feed shortages [1,2,3] and a lack of proper feed preservation systems [4,5], especially during the dry season. Expertise and knowledge on feed preservation is missing among the farmers and professionals working in animal feed industries [1,5,6]. As haymaking is unfeasible due to grassland shortages, the smallholder farmers have become more dependent on crop residues. In Ethiopia, for instance, maize (Zea mays L.) is cultivated on about 2 million ha of land by about 9 million smallholder farmers [7]. Similarly, banana fruit (Cavendish Val.) is cultivated on about 54 thousand ha of land [8]. Nevertheless, the by-products of these two crops, such as fresh maize stover (FMS) and banana pseudostem (BPS), are underutilized by the smallholder farmers as they spoil quickly without proper preservation techniques [9]. So far, the preservation of these locally available crop by-products has not yet been studied under the specific on-farm conditions of smallholder farms in the region [8].
The preservation of FMS and BPS in the form of silage could play a major role in reducing feed shortages and the need for free-grazing, thus improving the productivity of ruminants and saving the natural resources in the area. Silage-making involves the preservation of feeds under anaerobic conditions [10]. During such preservation, naturally occurring or inoculated lactic acid bacteria (LAB) use water-soluble carbohydrates to lower the pH [11], which prevents the growth of spoilage micro-organisms such as Clostridium bacteria, yeasts and molds [12].
Although a number of researchers have studied silage-making with different feed products and in different parts of the world, studies taking into account the specific conditions in Ethiopia are rare. In our previous studies [13,14], FMS and BPS have been fermented successfully at laboratory scale, with and without additives. In this regard, the addition of molasses was a pre-requisite for the successful fermentation of BPS, while it was not essential for the good fermentation of FMS [13,14]. Moreover, it was found that the two crop by-products can also be mixed in order to improve the fermentation quality and aerobic stability of the resulting silages. Although these preliminary tests were performed in Ethiopia, they were under laboratory conditions and at a small scale with the help of microsilos [13,14]. As such, the specific conditions that farmers face in the Global South, the materials and tools that are available for ensiling, and the scale at which this approach is relevant for local practices have not been considered in research so far.
To obtain useful insights for practical application, the four best-performing treatments in the laboratory studies were selected and evaluated under conditions common to smallholder farmers in Ethiopia. Therefore, the objective of this study was to evaluate the feasibility of silage fermentation performed at several farms in southern regions, based on an assessment of pH and microbial and nutritional properties before and after fermentation. With this research, we aim to increase the efficient use of crop by-products as a feed source, especially in regions and periods of feed shortage.
2. Materials and Methods
2.1. Raw material Collection and Experimental Plan
Maize was grown at the Arba Minch University farm demonstration site following the rainy season of the area, from 20 March to 30 June 2020. It was cut manually at 10 cm height when the maize ears reached two-thirds of the milk line stage maturity. The maize ears were detached and used for human consumption, while the fresh maize stover was used for silage-making. The maize stover included maize stalks, leaves, husks and cobs. In parallel with these activities, BPS was collected randomly from farmers nearby the Arba Minch University, Kulfo campus, immediately after fruit harvest. The outer layers of the BPS were removed, and the inner stem was sliced with a big knife, to facilitate further machine chopping (Electro Mecce, Engineering Service, Addis Ababa, Ethiopia). Both by-products were chopped separately, into particles with a length of 2–4 cm. The same procedure for preparing and chopping the by-products was followed compared to our previous studies [13,14]. FMS had a DM content of 62.38 ± 0.29%, while it was 44.37 ± 0.41% for BPS. The chopped by-products were then combined into four mixtures on the basis of their fresh weight as follows: 100% FMS (100FMS), 80% FMS + 20% BPS (80FMS), 60% FMS + 40% BPS (60FMS) and 95% BPS + 5% molasses (95BPS). The 5% molasses was added to the pure BPS according to the recommendations obtained from our previous research [13,14]. The molasses was added on weight basis and mixed manually with the chopped BPS to obtain 95BPS. The DM content of 95BPS on day 0 increased from 44.37 to 60.32 % due to juice losses during the process of harvesting, manual and machine chopping and mixing activities.
2.2. Filling and Compaction of Crums and Bags
Each of the four mixtures of the two crop by-products was divided across 6 bags and 6 drums (Figure 1), thus resulting in a total of 24 bags and 24 drums. Two layers of polyethylene bags were used, each with a thickness of 100 µm, a width of 60 cm and a height of 150 cm. The drums were made of high-density polyethylene with a wall thickness of at least 2 mm, a diameter of 50 cm and a height of 120 cm. Drums and bags were considered because these are the airtight recipients and non-degradable recipients that are available locally. The bags and the drums were filled and compacted manually with the help of wooden tools. Both the bags and the drums were sealed with five layers of adhesive polypropylene tape. The average weight of the fresh by-product in each bag or drum to be ensiled was 15 ± 0.74 kg. Half of the bags and the drums for each mixture were transported from the Kulfo campus (where they were prepared) to a local farmer in Chano Dorga, while the other half were transported to a local farmer in Kolla Shelle. Both locations are in the Arba Minch Zuria district. The bags and drums stayed at the local farms for 60 days and were not checked by the researchers during that period. This full-factorial design corresponded to 16 experimental conditions (4 mixtures × 2 fermentation packages × 2 fermentation locations) and three replicates were carried out for each condition. This experiment thus included approximately 720 kg of fresh crop by-product.
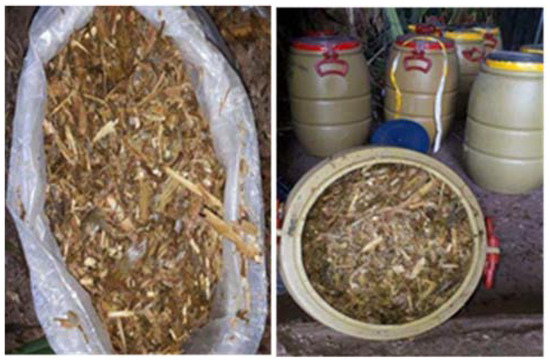
Figure 1.
Mixed silage fermented 40% banana pseudostem and 60% fresh maize stover using bags (left) and drums (right).
2.3. Sampling
Feed samples were taken aseptically for pH measurement and microbial and nutritional analyses before ensiling (day 0) and after 60 days of fermentation. In short, about 120 g of representative sample was taken from each fresh mixture or each ensiled bag or drum, and then stored at 4 °C. The samples were divided into two equal sub-samples. One sub-sample was used for pH and microbiological analyses within 24 h of sampling, while the other sub-sample was dried in a forced-air oven at 65 °C for 48 h. The dry matter (DM) content was obtained by dividing the samples weight after drying by the weight before drying. Because of convenience and limited resources, samples of the same combinations of mixture and fermentation package but fermented at a different location were combined and mixed before nutritional analysis. Obviously, silage of damaged bags was not included when mixing the samples for nutritional analysis.
2.4. pH Determination
In order to measure the pH, 10 g of the sample was put in a sterile homogenizing bag, and 90 mL of distilled water (pH = 7.0) was added. Then, the bag mixtures were homogenized for 60 s in a stomacher blender (StarBlender™ LB 400, VWR International, Fontenay Sous Bois Cedex, France). Finally, the pH of the extracts was measured by using a glass digital pH meter (PH 1100H, VWR International, Darmstadt, Germany) [15,16].
2.5. Microbial Counts
Microbiological analyses were performed using plate counts. A 5 g aliquot was transferred into a sterile homogenizing bag, after which, 45 mL peptone physiological salt solution (0.85% NaCl and 0.1% peptone; Biokar Diagnostics, Beauvais, France) was added. Subsequently, each sample was homogenized for 60 s in a stomacher (StarBlender™ LB 400, VWR International, Fontenay Sous Bois Cedex, France). Then, a serial dilution of the suspension was prepared and applied to different media using the pour-plating technique. Total viable counts (TVCs) were obtained using Plate Count Agar (PCA, VWR International, Milano, Italy) after incubating the plates aerobically at 30 °C for 72 h. LAB counts were obtained using de Man, Rogosa and Sharpe Agar (MRS, VWR International, Milano, Italy), and incubating the plates at 30 °C for 72 h. Enterobacteriaceae counts were determined after pour-plating the dilutions on Violet Red Bile Glucose Agar (VRBG, VWR International, Milano, Italy), and incubating the plates at 37 °C for 24 h. Yeast and mold counts were obtained by plating the dilutes on Dichloran Glycerol Agar (DG-18, VWR International, Milano, Italy) plus 0.1 g/L chloramphenicol (Biokar Diagnostics, Beauvais, France), and incubating the plates at 25 °C for 120 h. Clostridium endospores counts were retrieved after applying a heat shock to the sample for 15 min at 75 °C, in order to kill the vegetative cells and leaving only the endospores [14,17], followed by 10 min cooling at room temperature. Afterwards, ten-fold serial dilutions were prepared, pour-plated on Reinforced Clostridium Agar (RCA, Biokar Diagnostics, Beauvais, France), and incubated at 37 °C for 48 h in anaerobic jars containing a gas-generating kit and an indicator strip (IVD, Microbiology Anaerotest®, Merck KGaA, Darmstadt, Germany). The values for the five microbial groups (TVC, LAB, Enterobacteriaceae, yeasts and molds, and Clostridium endospore counts) were converted by log10 transformation prior to statistical analyses. Counts below the detection limit of 1 log10 cfu/g were thus indicated as <1.
2.6. Nutritional Analyses
The dried samples were ground to pass through in a 1 mm sieve (Thomas Wiley Mill Model 4, Thomas Scientific, Swedesboro, NJ, USA). Sieved samples were stored in airtight plastic sample bottles and transported to the Holeta Agricultural Research Center Animal Nutrition Research Laboratory in Ethiopia. There, the ash, organic matter (OM) and nitrogen (N) contents were analyzed following AOAC methods [18]. The total nitrogen concentration was obtained using the Kjeldahl method, and the crude protein (CP) content was derived by multiplying the nitrogen content by a conversion factor of 6.25 [18]. Neutral detergent fiber (NDF) and acid detergent fiber (ADF) were determined sequentially, using the method of Van Soest et al. [19]. Lignin (ADL) was determined by solubilization of cellulose with H2SO4 [19].
With some minor modifications, the two-stage in vitro technique developed by Tilley and Terry [20] was used to determine in vitro dry and organic matter digestibility of the feeds (IVDMD and IVOMD, respectively). About 0.6 L of rumen fluid was collected from three Zebu (Bos indicus) and three Holstein Friesian (Bos taurus) crossbreed cows in good health and physiological condition with permanent rumen cannula, to be used as an in vitro inoculum. The animals were fed ad libitum with a Desho grass hay diet. The rumen contents were mixed with a spoon and filtered through a metallic sieve with 1 mm mesh width while removing CO2, and then diluted five-fold with a phosphate buffer (1.4 g NH4Cl + 28.8 g Na2HPO4·12H2O + 6.2 g NaH2PO4 in 1 L distilled water; pH = 7.0) at 39 °C [21]. In a test tube, 0.5 g of the ground and sieved sample was weighed, and 10 mL of the diluted rumen liquor was added. The mixture was incubated at 39 °C for 48 h while being shaken by a DAISYII apparatus (ANKOM Technology Corp., Fairport, NY, USA). The tubes were then centrifuged, and the supernatant was decanted. The residue was incubated for another 48 h at 39 °C, with 60 mL of pepsin-hydrochloric acid solution to digest the protein. Subsequently, centrifugation, filtering, residue-drying and ashing were performed. To correct for the indigestible DM from the rumen liquor and to ensure that the system was working properly, two blank samples consisting of rumen liquor mixed with buffer only were included. The Metabolizable Energy (ME) contents of the samples were estimated from the in vitro organic matter digestibility [22]. The effective degradability (ED) was calculated using the equation developed by Ørskov and McDonald [22]: ED = [a + b × c/(c + kp)], where a is the soluble fraction (%), b is the slowly digestible fraction (%), c is the fractional rate of disappearance (%/h) and kp is the rate of flow of particles, assumed to be 0.0378/h. The rate of disappearance of the samples was determined using the same 6 cattle mentioned earlier. Nylon bags measuring 9 × 27 cm and having about 1600 holes/cm (pore size 40 μm) were filled with 5 g of dried and sieved sample. Only the particles not passing through the sieve with 0.5 mm holes were used, i.e., particles larger than 0.5 mm. The bags were moistened for about one minute before introducing them into the liquid phase of the ventral sac of the rumen of each cow. The bags were removed at intervals of 3, 6, 12 and 24 hrs and washed in running water until the washing water was clear. About two minutes of washing was usually required, after which the bags were dried at 70 °C for 48 hrs. The dried bags were weighed after cooling them over silica gel in a desiccator. This incubation was carried out on two consecutive days and in each of the cows. Zero-time disappearances (washing losses) were obtained after moistening the unincubated bags for one minute, leaving them for five minutes in water at 39 °C, followed by washing and drying them in a similar fashion to the incubated bags.
2.7. Statistical Analysis
One-way ANOVA tests were used to identify differences in pH, microbial counts (Section 2.4) and nutritional analyses (Section 2.5) between the four mixtures (100FMS, 80FMS, 60FMS or 95BPS) prior to fermentation. Then, three-way ANOVA tests with all interaction terms were used to evaluate the effects of the mixture (100FMS, 80FMS, 60FMS or 95BPS), fermentation package (bags or drums) and fermentation location (Chano Dorga or Kolla Shelle) on the pH and microbial counts of the samples. Due to convenience and limited resources, the nutritional analyses of the fermented samples were performed on samples that were a mixture of the two locations. Moreover, a two-way ANOVA test with an interaction term was used to evaluate the effects of the mixture (100FMS, 80FMS, 60FMS or 95BPS) and the fermentation package (bags or drums) on the nutritional value of the fermented samples. The fresh samples were considered as a control and thus compared with the fermented samples in the three-way (pH and microbial counts) and two-way ANOVA (nutritional value) tests. If an interaction term was significant, then the effects of the factors involved in that interaction were not tested individually, but the different combinations of the factors involved in the significant interaction were compared. If a factor was not involved in a significant interaction, then its individual effect was evaluated. If significant, all levels of that factor were compared. The Tukey’s HSD test was used for multiple comparison.
The mean nutritional value of the four mixtures before fermentation and each combination of mixture and fermentation package after fermentation were also presented in a two-dimensional non-metric multi-dimensional scaling ordination (NMDS) to identify the trends in the nutritional value related to the fermentation, mixture and fermentation package. Each mean nutritional value of a condition is presented by a different point on the NMDS plot and the distance between two points reflects their similarity level: the more similar the nutritional quality, the smaller the distance between the points.
All statistical analyses were performed using SPSS software (Statistics v. 23, IBM, New York, NY, USA), considering a significance level of 0.05. The NMDS plot, based on Bray–Curtis distances, was constructed using the metaMDS function of the vegan package in R (v4.1.1) [23].
3. Results
3.1. pH and Microbial Counts
As indicated in the last column of Table 1, there was a significant (p = 0.001) interaction between mixture, fermentation package and location for pH and all microbial counts. Therefore, multiple comparison tests were conducted among all combinations of mixture, fermentation package and location (Table 1).

Table 1.
Outcome of three-way ANOVA tests with all possible interactions to evaluate the effects of four mixtures of banana pseudostem (BPS) and fresh maize stover (FMS), two fermentation packages (drums or bags) and two fermentation locations (Ghano Dorga or Kolla Shelle) on the pH and microbiological counts and nutritional values before (day 0) and after (day 60) fermentation.
3.1.1. Fresh Mixtures
The pH values, microbiological counts and nutritional values of the fresh materials before fermentation are presented in the left part of Table 1. Briefly, the pH values of the fresh 95BPS samples (day 0) were significantly higher compared to the samples containing FMS, while there were no significant differences between the three samples containing FMS.
Considering the microbial counts of the fresh materials, the TVC were significantly different between 100FMS and 95BPS, but the TVC of the FMS-BPS mixtures (80FMS and 60FMS) did not differ significantly from the other mixtures. The Enterobacteriaceae counts and the Clostridium endospore counts were not significantly different between the fresh mixtures. 100FMS and 60FMS had the lowest LAB counts, while they were significantly higher for 80FMS. The LAB counts of 95BPS were not significantly different from the other mixtures. The yeast and mold counts of fresh 100FMS and 60FMS were significantly higher compared to 80FMS and 95BPS.
3.1.2. Mixed Silages
During fermentation, the pH dropped from 4.84 to 5.95 on average to values below 4 for all combinations of mixture, fermentation package and location, except for 60FMS and 100FMS in bags at Chano Dorga. The exceptionally high means and standard deviations for the pH values of 100FMS (4.33 ± 0.49) and 60FMS (4.07 ± 0.56) mixed silages in bags at Chano Dorga were due to some bags being damaged during the fermentation by free-range chickens and rodents.
The TVC declined significantly for 95BPS fermented in bags and drums at both locations. In 100FMS, TVC dropped significantly for drums in Chano Dorga and for bags in Kolla Shelle. The TVC was reduced significantly for 60FMS at Kolla Shelle, both for bags and drums. All Enterobacteriaceae counts declined significantly, except for 100FMS fermented in bags at Chano Dorga (damaged bags). For all silages fermented in drums and also for 95BPS fermented in bags at Chano Dorga, the Enterobacteriaceae counts dropped to values below the detection limit of 1 log10 cfu/g after fermentation. The LAB counts in 80FMS, 60FMS and 100FMS were significantly higher compared to 95BPS. Fermentation resulted in a significant increase in the LAB counts in 60FMS and 100FMS fermented in bags at Chano Dorga (damaged bags). The counts of LAB decreased significantly for 95BPS fermented in drums at Chano Dorga and for 60FMS and 95BPS fermented in bags at Kolla Shelle. The yeast and mold count did not decrease in 95BPS during fermentation, probably because they were already relatively low (5.48 ± 0.60) on day 0. Additionally, the yeast and mold counts decreased significantly for all combinations of mixture, fermentation package and location during fermentation, except for 80FMS fermented in bags, both at Chano Dorga and Kolla Shelle. The only significant, yet not microbiologically meaningful, decrease in Clostridium endospore count was observed for 95BPS fermented in drums at Kolla Shelle. In general, the counts for Clostridium endospores, as well as those for yeasts and molds, obtained on day 60 were higher than the recommended 2 log10 cfu/g and 3 log10 cfu/g values, respectively [24].
3.2. Nutritional Value Evaluation
Table 2 shows the outcome of the ANOVA analysis testing the interaction between the effect of the mixture and fermentation package. If no significant interaction was found, then the effects of the mixture and fermentation package were investigated independent of each other. If an effect was significant, pairwise comparisons were performed. The significant differences between levels of this effect were indicated in Table 3 by lowercase and uppercase letter superscripts for the effect of the mixture and package, respectively. If a significant interaction was found, pairwise comparisons between all combinations of the mixture and package were performed and significant differences were indicated with a number superscripts in Table 3.
Table 2.
The p-values of two-way ANOVA tests with interaction to evaluate effect of mixture and fermentation package on the nutritional values before and after fermentation.
Table 3.
Outcome of two-way ANOVA tests with interaction to evaluate effect of mixture and fermentation package on nutritional values.
3.2.1. Fresh Mixtures
Table 3 shows the nutritional value evaluation of the fresh mixtures at day 0. The DM contents were significantly lower for fresh 80FMS and 60FMS compared to 100FMS. No significant differences were found in DM contents between fresh 95BPS and the other mixtures. The ash contents of the fresh samples were lowest for 100FMS and 95BPS, while it was significantly higher for 60FMS and 80FMS. The OM contents were inversely related to the ash content, with the highest values for fresh 100 FMS and 95BPS, and significantly lower OM contents for 80FMS and 60FMS. CP contents were highest for 100FMS and lowest for 95BPS, while the other mixtures were in between. The CP content of fresh 80FMS and 60FMS was not significantly different. The NDF and ADF were highest in 100FMS and 80FMS, while it was significantly lower in 95BPS. The NDF of 60FMS was in between and significantly different from the other mixtures. The ADF of 60FMS was also in between, but not significantly different from 100FMS and 80FMS. The ADL increased with a drop in the FMS content of the mixture, although the only significant difference was found between 100FMS and 95BPS. The IVDMD, IVOMD and ME showed similar effects with lowest values in 100FMS and 95BPS, a higher value in 80FMS and an even higher value in 60FMS. Finally, the EF of 100FMS is highest, while it is lowest for 95BPS. The ED of FMS-BPS mixtures are in between, with the ED of 80FMS being not significantly lower than that of 100FMS.
3.2.2. Mixed Silages
As indicated in Table 2, the DM showed a significant (p = 0.023) interaction between the mixture and fermentation package. Consequently, a multiple comparison test was applied across the combinations of mixture and fermentation package (Table 3). In this regard, 100FMS showed the highest DM content relative to the other mixtures, before as well as after fermentation. The ash content showed no significant (p= 0.087) interaction between the mixture and fermentation package. In the univariate analyses, the ash content was significantly (p < 0.001) different between mixtures, except between 100FMS and 95BPS. Moreover, fermentation resulted in an increase (p < 0.001) in the ash content, and the increase was higher for bags compared to drums. The interaction effect for the OM content was also not significant (p = 0.188). The univariate analysis pointed out that there was a significant difference (p < 0.001) between mixtures. Additionally, fermentation resulted in a significant (p < 0.001) drop in the OM content, and this decrease was larger in bags compared to drums. The CP content was affected by a significant (p = 0.001) interaction between the mixture and fermentation package. Therefore, a multiple comparison test was conducted to compare the different combinations of the mixture and fermentation package. Moreover, the CP content of 95BPS at day 0 was the lowest compared to any other combination. This was also true after 60 days of fermentation, both in bags and drums. The CP content increased significantly during fermentation in all four mixed silages, but the increase was most prominent in 80FMS and 60FMS. Similarly, there was a significant (p = 0.024) interaction between the mixture and fermentation package in terms of NDF content. In this regard, 95BPS showed a significant increase in NDF during fermentation, but it remained lower than in any of the other mixed silages. The ADF also showed a significant (p = 0.047) interaction among the mixture and fermentation package. The ADF content did not change during fermentation for any of the mixtures, except for an increase in 100FMS fermented in bags. The ADL was also affected by a significant (p = 0.027) interaction between the mixture and fermentation package. Moreover, it increased significantly during fermentation of 95BPS and 100FMS in bags. There were significant (p = 0.001 for all three) interactions between the mixture and fermentation package for the IVDMD, IVOMD and ME. Strong significant increases in IVDMD, IVOMD and ME were noticed during fermentation in all mixtures, which were more pronounced in 80FMS, 100FMS and 95BPS, respectively. The ED showed no significant (p = 0.052) interaction between the mixture and fermentation package. The univariate analysis indicated a significant (p < 0.001) difference among mixtures. Moreover, the ED was significantly higher in 80FMS, 60FMS and 100FMS compared to 95BPS, while there were no significant differences between 80FMS and 100FMS and between 60FMS and 100FMS. Fermentation resulted in a significant (p < 0.001) increase in the ED, but there were no differences between the drums and bags.
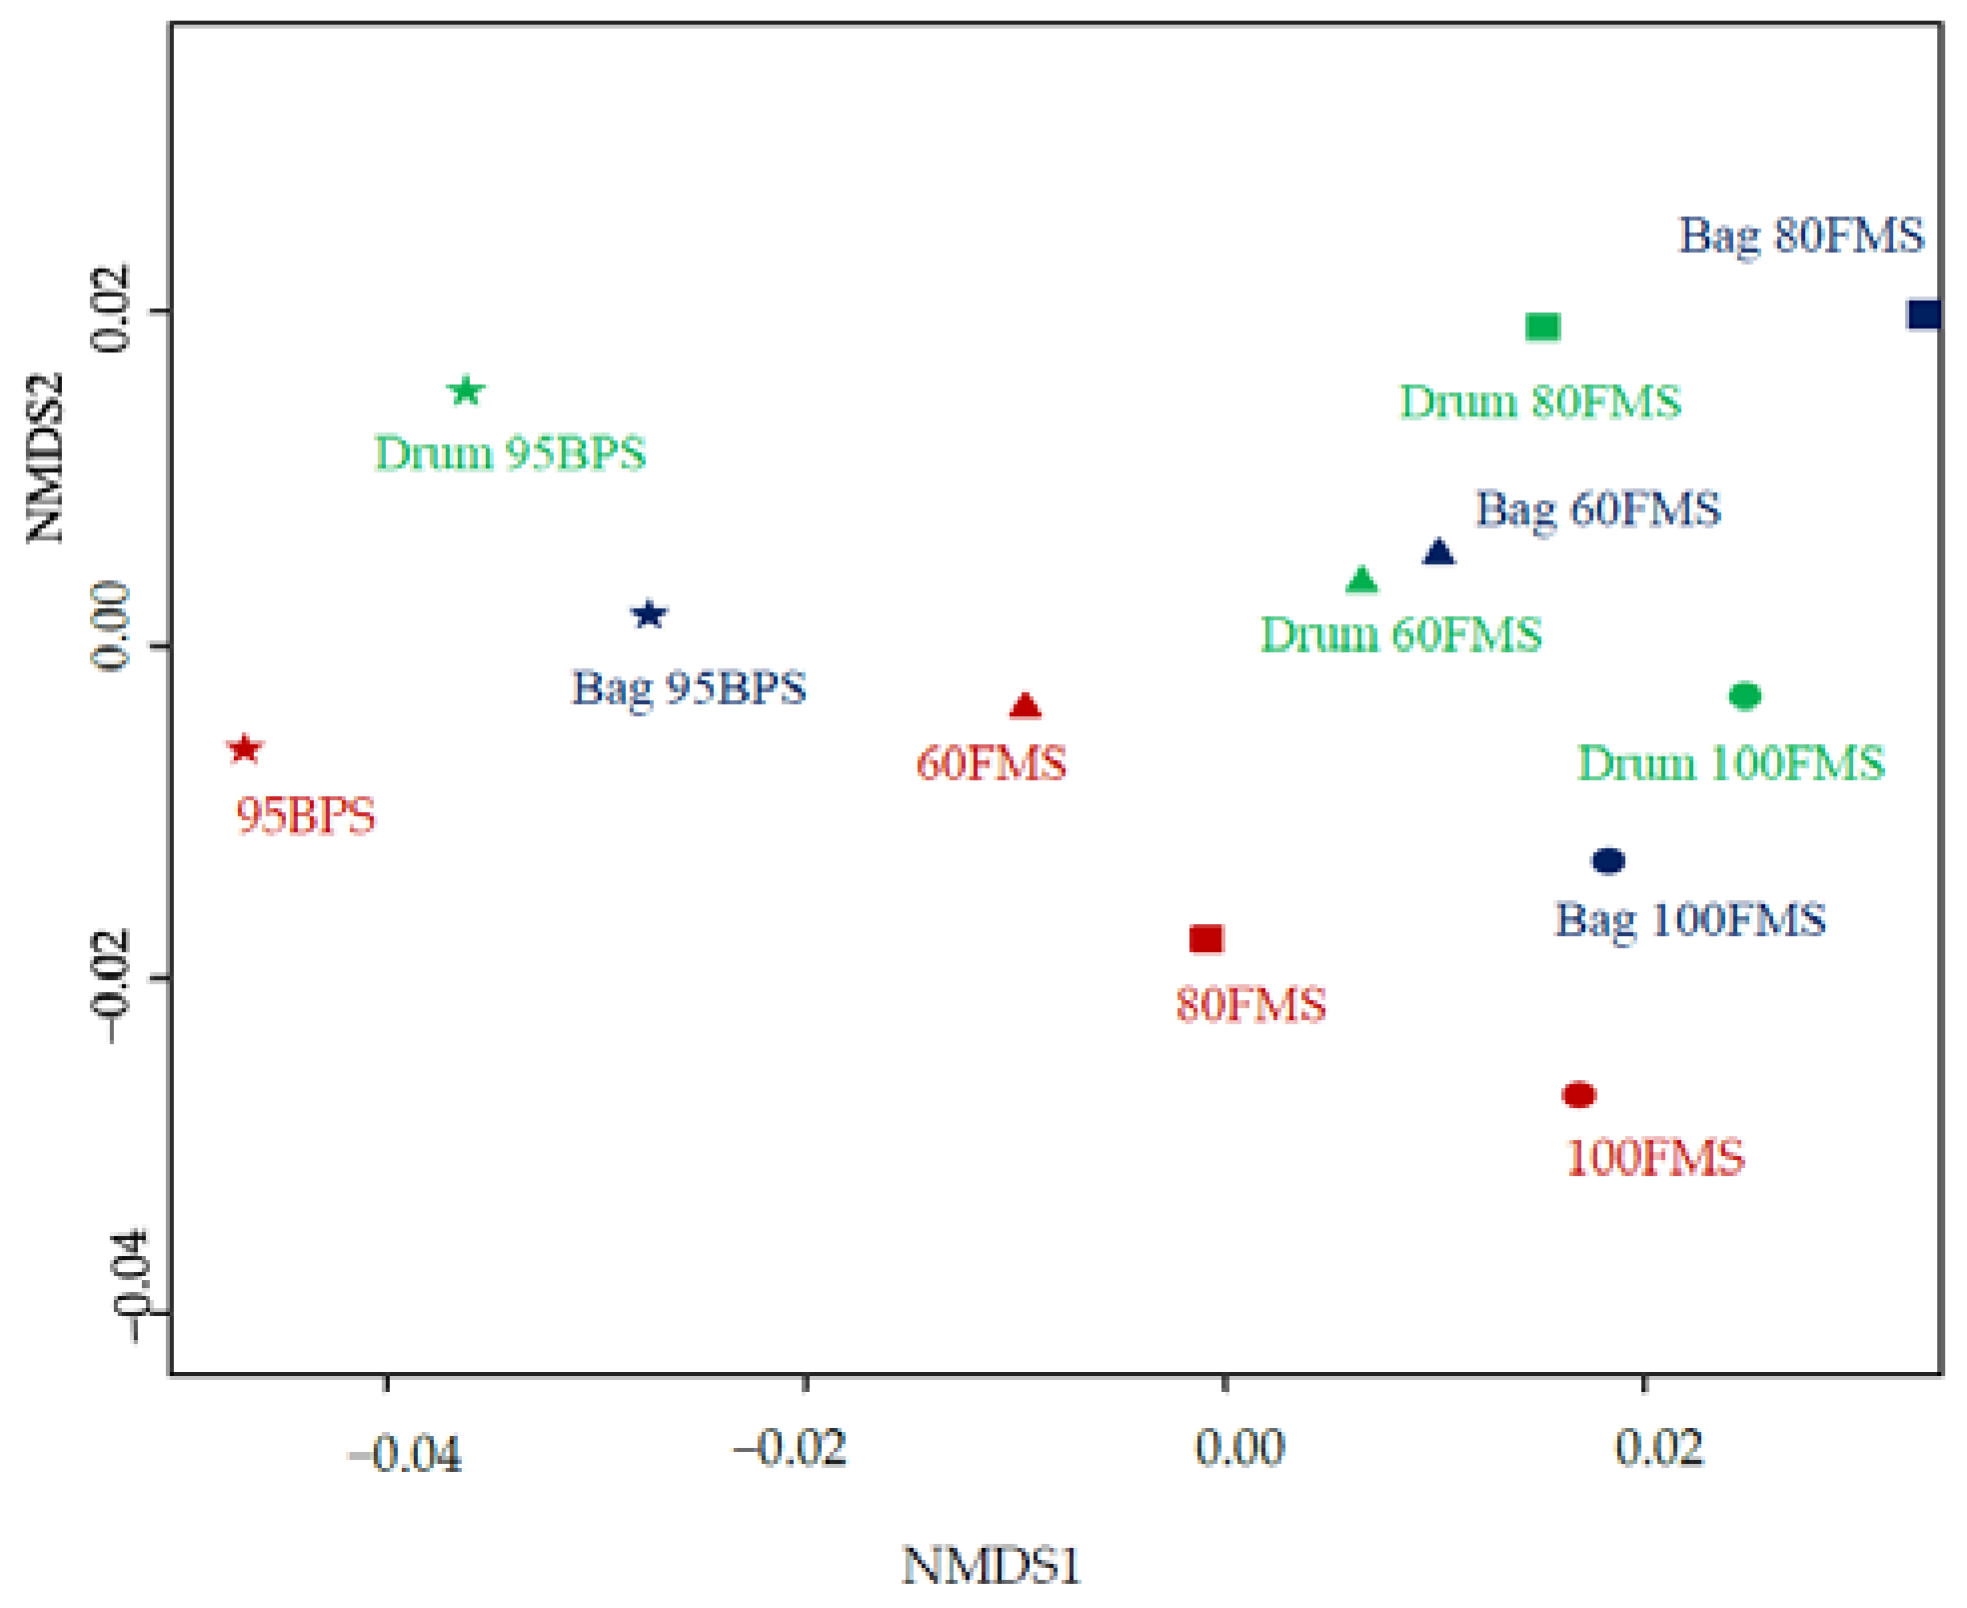
Figure 2 makes use of non-metric multidimensional scaling (NMDS) to present the mean nutritional values of the four mixtures before fermentation (red) and after fermentation, for each combination of mixture and fermentation package (bag = blue and drum = green). The mixtures with FMS (100FMS, 80FMS and 60FMS) before fermentation are relatively close together, while 95BPS is clearly separated. The nutritional quality of 95BPS after fermentation also remained distinctively separate from the other three silage mixtures, independent of the fermentation package. Fermentation forced all four mixtures to move in the direction of the top-right corner of the NMDS graph, which was most pronounced for 80FMS. The NMDS also indicated that the nutritional qualities of 100FMS and 60FMS mixtures fermented in drums were more closely related to each other than the 100FMS and 60FMS mixtures fermented in bags. A deeper investigation with improved homogeneity of the samples will be needed to better understand these effects.
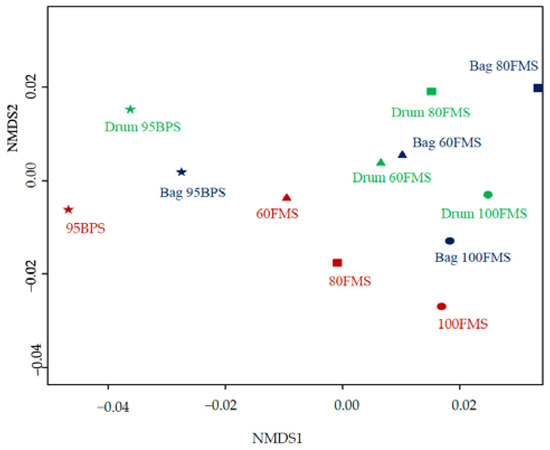
Figure 2.
Non-metric multidimensional scaling (NMDS, stress value 0.068) of the mean nutritional values for each mixture before fermentation (red symbols) and for each combination of mixture and fermentation package after fermentation. The mixtures are 100FMS (100% FMS), 80FMS (80% FMS + 20% BPS), 60FMS (60% FMS + 40% BPS) and 95BPS (95% BPS + 5% molasses), whereas the fermentation packages were bags (blue symbols) and drums (green symbols). The red symbols indicate the 4 mixtures before fermentation, while the blue symbols are the mixtures fermented in bags and the green symbols. Samples from the same mixture are displayed with the same symbol.
4. Discussion
4.1. pH and Microbial Counts
4.1.1. Fresh Mixtures
Although the pH of fresh 95BPS was significantly higher compared to the other fresh mixtures, the difference in pH of the four mixtures at the start of the fermentation is expected to have no substantial effect on the fermentation rate. The TVC of fresh 95BPS was significantly lower compared to that of pure maize (100FMS). Their mixtures (80FMS and 60FMS) were in between, but not significantly different from 95BPS nor 100FMS. This could have been caused by the fact that the fresh crop by-products (FMS and BPS) were derived from different origins and because the outer layers of the BPS were removed before chopping. However, the TVC of the fresh material generally has no direct impact on the fermentation, rather it indicates the overall microbial load present in the materials used for the study [15]. High Enterobacteriaceae counts are common in fresh samples before fermentation [15], and they were expected to be reduced below the detection limit (1 log10 cfu/g) within three days under the appropriate fermentation conditions [25]. Having a higher LAB count in the fresh mixture could have a positive effect on the silage fermentation [11,16]. Lactic acid bacteria are naturally existing acid-tolerant beneficial microbial groups that are responsible for the significant reduction in pH during fermentation. This reduction prevents the growth of spoilage micro-organisms such as yeasts and molds and Clostridium species [11,25]. The lower Clostridium endospore count in 95BPS could be due to the removal of the outer layers of the BPS that could have been in direct contact with the soil during harvesting and processing [14,25]. The low yeast and mold count in the fresh mixtures is likely due to the high DM and thus the low water activity [12].
4.1.2. Mixed Silages
This farm-scale study was conducted after two years of successive laboratory-scale studies. Although the DM content of the mixtures was high compared to the recommendations for silage making [12], the pH dropped well below the recommended threshold of 4.5, indicating a good fermentation. The pH of the fermented silages in the current study was lower compared to what we observed in our previous studies [13,14]. This difference could be due to the type and maturity stage of materials used for the fermentation. The fresh materials used in our studies do not have a high buffering capacity as they do not include legumes. Regardless of the fermentation package and location, the pH reduced substantially in all four mixtures, confirming the successful fermentation of the silages in real farm conditions [25]. Moreover, there was no significant difference in pH between the different combinations of mixture, fermentation package and location after fermentation, except for 100FMS and 60FMS mixtures fermented in bags at Chano Dorga. Some of the 100FMS and 60FMS bags fermented at Chano Dorga were damaged, which resulted in an increased mean value and standard deviation of the pH. The largest drop in pH due to fermentation was achieved in 95BPS, which may be related to the addition of molasses to enhance the fermentation conditions [26]. This trend is consistent with our laboratory studies [13,14], where the fermented 95BPS also showed a distinct but attractive smell and a yellowish color. Although the compaction process might have stretched the plastic bags, resulting in a higher oxygen permeability [25,27], this did not result in a smaller pH drop.
In most mixtures, fermentation reduced TVC approximately ten times (one log10 unit). This is likely because nutrients allowing for microbial growth are being depleted and thus microbiota counts decline. A similar decrease in TVC throughout the fermentation period was also observed in our laboratory-scale studies [13,14]. The effects of fermentation package and location on the TVC were found to be limited in the current study. The TVC of fermented 95BPS was lower compared to the other mixed silages, independent of the fermentation package and location. This is likely the effect of the lower TVC in the fresh 95PBS compared to the other fresh mixtures. The damaged bags (100FMS and 60FMS at Chano Dorga) were likely responsible for the survival of micro-organisms, including Enterobacteriaceae. Reaching an Enterobacteriaceae count below the limit of detection (1 log10 cfu/g) can be considered an indication of appropriate fermentation [2,5,15]. Accordingly, fermentation in the drums was successful at reducing the Enterobacteriaceae counts, while this was not the case for the bags. Apart from the damaged bags with 100FMS fermented in Chano Dorga, the fermentation location did not seem to affect the Enterobacteriaceae count. There was a significant increase in the LAB count in 100FMS and 60FMS fermented in bags at Chano Dorga. This coincided with the silages in which the pH did not decrease to a value below 4. The LAB are indeed inhibited in growth by a strong pH reduction, a phenomenon which is called auto-inhibition. As mentioned earlier, some of the bags with the 100FMS and 60FMS mixtures fermented at Chano Dorga were damaged, which likely allowed air to enter the silage and disturb the anaerobic fermentation conditions. The dominance of the LAB is expected to stabilize the fermentation process, as long as anaerobic conditions are maintained [16,25]. The fermentation process resulted in a reduction in the yeast and mold counts, regardless of the mixture, fermentation package and location. This is probably due to oxygen depletion and indicates a proper silage process. However, the yeast and mold counts failed to end up below the recommended 3 log10 cfu/g level [24] for any of the combinations of mixture, fermentation package and location. Additionally, frequent damage to the side of the bags at Chano Dorga resulted in the visible growth of yeasts and molds, especially at places where air could enter the silage. The lower yeasts and mold as well as Clostridium endospore counts in the fermented 95BPS mixtures compared to other mixed silages are likely the result of the lower counts in the fresh 95BPS. Fermentation by Clostridium is common in high-moisture silages with a DM content below 30% and silages with a higher buffering capacity [24]. Clostridium fermentation degrades carbohydrates and proteins, resulting in a reduction in the nutritional quality and palatability of the silage. Clostridium endospore counts in the current study were higher than recommended (2 log10 cfu/g) in all combinations of mixture, fermentation package and location [28]. Nevertheless, the detection of yeasts and molds, as well as Clostridium endospores, should be considered in relation to the high DM content, the low pH value and the low Enterobacteriaceae counts of the silages [14,24,25].
4.2. Nutritional Value Evaluation
4.2.1. Fresh Mixtures
From the nutritional analysis, the two mixtures of FMS and BPS (80FMS and 60FMS) were found to have a lower DM content than the pure maize stover (100FMS) due to the addition of BPS. During preparation and chopping of BPS, juices were flowing because of the lower DM content. These juices were absorbed by the drier FMS in the mixtures (80FMS and 60FMS). For BPS95, however, part of the juices leaked out, increasing its DM by approximately 10%. In the report of Rochana et al. [29], the CP content of BPS varied from 2.4 to 8.3%, depending on the DM content and the maturity stage of the banana plant. In this regard, the addition of molasses (having 6% CP) has a minimal effect on the CP content of 95BPS [29]. The water-soluble carbohydrates in molasses also facilitate the fermentation and help improve the aerobic stability after the silage process [14,25]. The NDF and ADF contents of BPS before fermentation were also comparable to those reported by Wang et al. [30], who evaluated the fermentation and ruminal degradability of BPS. In general, 95BPS showed the lowest CP, NDF and ADF contents compared to the other fresh mixtures, while the ADL content was highest. Compared to different studies conducted on pure BPS silage, our 95PBS silage has a lower CP content [29,30] and a higher ADL content. In terms of the digestibility parameters (IVDMD and IVOMD), 95BPS showed lower digestibility than any of the other fresh mixtures and 100FMS. This may be due to the higher ADL content of 95BPS. The two fresh crop mixtures of FMS and BPS (80FMS and 60FMS) have the highest digestibility of the feeds, also yielding a higher ME compared to 100FMS and 95BPS. In general, this study points out several positive effects of mixing the two fresh crop by-products in terms of ash, CP, IVDMD, IVOMD, ME and ED nutritional qualities.
4.2.2. Mixed Silages
Mixing the two crop by-products resulted in a better DM content of feeds to be fermented [13]. In this regard, the DM content increased during fermentation both in drums and bags. During fermentation, the ash content increased significantly, and this increase was higher in bags compared to drums. Moreover, the OM content decreased significantly during fermentation, and this was much more prominent in the bags compared to the drums. This could be related to the relative permeability of bags supporting the growth of facultative anaerobic micro-organisms that may grow even in lower pH conditions [25]. There was a higher increase in the CP content of 80FMS and 60FMS during fermentation compared to 100FMS and 95BPS. This could have been due to the mixing of the two crop by-products in 80FMS and 60FMS. The mixing may have created favorable conditions, by providing a better balance between sulfur, phosphorus and nitrogen to promote microbial protein synthesis during fermentation [29]. Even though the mineral contents of the feeds used in the current study were not studied, the application of sulfur, phosphorus and nitrogen sources has been reported to increase the microbial protein contents of banana by-product silage [29]. Furthermore, the addition of molasses in 95BPS may also have additional benefits, by providing additional carbon sources to support the formation of adenosine triphosphate. Adenosine triphosphate is required for the enzymatic transformation of glucose to glycogen, where the latter is essential for microbial protein synthesis during fermentation [22,28,31]. The results of this study are also in agreement with those reported by Wang et al. [30], who found an increase in CP contents of BPS silage after 90 days of fermentation. In general, the CP content of 80FMS, 60FMS and 100FMS silage had reached the 6–7.5% that is required for the optimum rumen functioning [19]. However, the use of 95BPS for silage may require the additional supplementation of protein. The increases in NDF and ADF after fermentation may have been due to the slight hydrolysis of the cellulose and hemicellulose during the process of fermentation [29,30]. Compared to a similar study on maize stover silage by Geberemariyam et al. [4], we found higher NDF and ADF contents and comparable ADL contents. The higher fiber content in the current study could be due to the later harvesting stage of the maize stover, as it was collected when the maize ears reached two-thirds of the milk line maturity stage [20]. The increase in IVDMD, IVOMD and ME during fermentation were very much alike for the different mixtures. The significantly higher ME in 95BPS compared to all other mixtures may have been related to the addition of molasses. Our findings were comparable to the IVOMD of 48.5% and ME of 7.20 MJ/kg DM, but lower than the IVDMD of 55.4% for maize silage reported by Filya and Sucu [32].
4.3. Future Perspectives
This research clearly illustrates the importance of translating laboratory studies into on-farm conditions, resulting in specific guidelines essential for the success of the implementation. As a general recommendation, the use of drums should be preferred over bags for farm-scale silage in the area. From our previous laboratory-scale study [13], the aerobic stability of the silage ranged from 24 to 72 hours. Therefore, silage fermented using a drum of 15 ± 0.74 kg capacity can be fed within 2 to 3 days for a zebu cow without spoilage. In future research, a cost–benefit analysis of the use of drums for silage making may be beneficial. Overall, drums are durable, can be recycled for future use and reduce pollution, unlike bags, which could also lead to environmental concerns.
5. Conclusions
The four mixtures of banana pseudostem and fresh maize stover by-products that were fermented at farm-scale under local conditions produced silages of good quality. In all mixtures, fermentation resulted in a clear pH drop below four, a decrease in the total viable counts with at least one log10 unit and increases in neutral and acid detergent fiber content, the digestibility and the metabolizable energy. Yeast and mold as well as Clostridium endospore counts dropped, but never went below the recommended levels. The addition of molasses to the banana pseudostem supported the development of lactic acid bacteria to lower the pH as well as contributing to the metabolizable energy. Generally, the microbial counts did not differ between the four fermented mixtures. The fresh and fermented banana pseudostem has a significantly lower content of crude protein, neutral and acid detergent fiber, digestibility and metabolizable energy compared to fresh maize stover. Additionally, chopping the banana pseudostem resulted in a significant amount of juice losses. Therefore, it is advised to mix the chopped banana pseudostem with fresh maize stover. Our study pointed out that drums are preferred over bags as the fermentation package. The Enterobacteriaceae counts dropped below the detection limits for all silages fermented in drums, while the bag silages generally failed to lower the undesirable micro-organisms such as the Enterobacteriaceae. Moreover, the bags were found to be very sensitive to being damaged, resulting in a higher pH and Enterobacteriaceae count, as well as visible signs of yeast and mold. The location of fermentation had no effect on pH, microbial counts and nutritional values.
Author Contributions
Conceptualization, A.A.M., L.V.C. and B.A.; methodology, A.A.M.; software, A.A.M. and B.A.; validation, A.A.M. and B.A.; formal analysis, A.A.M. and B.A.; investigation, A.A.M.; resources, Y.K. and L.V.C.; data curation, A.A.M. and B.A.; writing—original draft preparation, A.A.M., D.V., I.A., Y.K., L.V.C. and B.A.; writing—review and editing, A.A.M., D.V., I.A., Y.K., L.V.C. and B.A.; visualization, A.A.M., D.V. and B.A.; supervision, Y.K., L.V.C. and B.A.; project administration, Y.K. and L.V.C.; funding acquisition, Y.K. and L.V.C. All authors have read and agreed to the published version of the manuscript.
Funding
This research was funded by the Flemish Interuniversity Council for University Development Cooperation (VLIR-UOS), under the project grant number AMU 2017IUC035A10.
Institutional Review Board Statement
Not applicable.
Data Availability Statement
The data presented in this study are available on request from the corresponding author.
Conflicts of Interest
The authors declare no conflict of interest.
References
- Yisehak, K.; Biruk, K.; Abegaze, B.; Janssens, G.P.J. Growth of Sheep Fed Tannin-Rich Albizia Gummifera with or without Polyethylene Glycol. Trop. Anim. Health Prod. 2014, 46, 1113–1118. [Google Scholar] [CrossRef] [PubMed]
- Wallie, M.; Mekasha, Y.; Urge, M.; Abebe, G.; Goetsch, A.L. Effects of Form of Leftover Khat (Catha edulis) on Feed Intake, Digestion, and Growth Performance of Hararghe Highland Goats. Small Rumin. Res. 2012, 102, 1–6. [Google Scholar] [CrossRef]
- Saylor, B.A.; Min, D.H.; Bradford, B.J. Productivity of Lactating Dairy Cows Fed Diets with Teff Hay as the Sole Forage. J. Dairy Sci. 2018, 101, 5984–5990. [Google Scholar] [CrossRef] [PubMed]
- Geberemariyam, T.; Getu, K.; Mulugeta, W.; Dereje, F.; Aeimro, K.; Mesfin, D.; Betlehem, M.; Endale, Y. Feed Intake and Growth Performance of Jersey Calves in Maize Stover Silage Based Total Mixed Ration. J. Biol. Agric. Healthc. 2020, 10, 9–13. [Google Scholar] [CrossRef]
- Mekuriaw, S.; Tsunekawa, A.; Ichinohe, T.; Tegegne, F.; Haregeweyn, N.; Kobayashi, N.; Tassew, A.; Mekuriaw, Y.; Walie, M.; Tsubo, M.; et al. Effect of Feeding Improved Grass Hays and Eragrostis Tef Straw Silage on Milk Yield, Nitrogen Utilization, and Methane Emission of Lactating Fogera Dairy Cows in Ethiopia. Animals 2020, 10, 1021. [Google Scholar] [CrossRef]
- Kassa, A. Review of Performance, Marketing and Milk Processing of Dairy Cattle Production System in Ethiopia. J. Dairy Vet. Anim. Res. 2019, 8, 1–9. [Google Scholar]
- Abate, T.; Shiferaw, B.; Menkir, A.; Wegary, D.; Kebede, Y.; Tesfaye, K.; Kassie, M.; Bogale, G.; Tadesse, B.; Keno, T. Factors That Transformed Maize Productivity in Ethiopia. Food Secur. 2015, 7, 965–981. [Google Scholar] [CrossRef]
- Mellisse, B.T.; Descheemaeker, K.; Giller, K.E.; Abebe, T.; van de Ven, G.W.J. Are Traditional Home Gardens in Southern Ethiopia Heading for Extinction? Implications for Productivity, Plant Species Richness and Food Security. Agric. Ecosyst. Environ. 2018, 252, 1–13. [Google Scholar] [CrossRef]
- Moselhy, M.A.; Borba, J.P.; Borba, A.E.S. Improving the Nutritive Value, in Vitro Digestibility and Aerobic Stability of Hedychium Gardnerianum Silage through Application of Additives at Ensiling Time. Anim. Feed Sci. Technol. 2015, 206, 8–18. [Google Scholar] [CrossRef]
- Tadesse, M.; Fentahun, M.; Tadesse, G. Dairy Farming and Its Economic Importance in Ethiopia: A Review. World J. Dairy Food Sci. 2017, 12, 42–51. [Google Scholar]
- Gallo, A.; Bernardes, T.F.; Copani, G.; Fortunati, P.; Giuberti, G.; Bruschi, S.; Bryan, K.A.; Nielsen, N.G.; Witt, K.L.; Masoero, F. Effect of Inoculation with Lactobacillus Buchneri LB1819 and Lactococcus Lactis O224 on Fermentation and Mycotoxin Production in Maize Silage Compacted at Different Densities. Anim. Feed Sci. Technol. 2018, 246, 36–45. [Google Scholar] [CrossRef]
- Wilkinson, J.M.; Davies, D.R. The Aerobic Stability of Silage: Key Findings and Recent Developments. Grass Forage Sci. 2013, 68, 1–19. [Google Scholar] [CrossRef]
- Mitiku, A.A.; Vandeweyer, D.; Lievens, B.; Bossaert, S.; Crauwels, S.; Aernouts, B.; Kechero, Y.; Van Campenhout, L. Microbial Profile during Fermentation and Aerobic Stability of Ensiled Mixtures of Maize Stover and Banana Pseudostem in South Ethiopia. J. Appl. Microbiol. 2022, 132, 126–139. [Google Scholar] [CrossRef] [PubMed]
- Mitiku, A.A.; Andeta, A.F.; Borremans, A.; Lievens, B.; Bossaert, S.; Crauwels, S.; Aernouts, B.; Kechero, Y.; Van Campenhout, L. Silage Making of Maize Stover and Banana Pseudostem under South Ethiopian Conditions: Evolution of PH, Dry Matter and Microbiological Profile. Microb. Biotechnol. 2020, 13, 1477–1488. [Google Scholar] [CrossRef]
- Andeta, A.F.; Vandeweyer, D.; Teffera, E.F.; Woldesenbet, F.; Verreth, C.; Crauwels, S.; Lievens, B.; Vancampenhout, K.; Van Campenhout, L. Effect of Fermentation System on the Physicochemical and Microbial Community Dynamics during Enset (Ensete ventricosum) Fermentation. J. Appl. Microbiol. 2019, 126, 842–853. [Google Scholar] [CrossRef]
- Andeta, A.F.; Vandeweyer, D.; Woldesenbet, F.; Eshetu, F.; Hailemicael, A.; Woldeyes, F.; Crauwels, S.; Lievens, B.; Ceusters, J.; Vancampenhout, K.; et al. Fermentation of Enset (Ensete ventricosum) in the Gamo Highlands of Ethiopia: Physicochemical and Microbial Community Dynamics. Food Microbiol. 2018, 73, 342–350. [Google Scholar] [CrossRef]
- Santos, A.O.; Ávila, C.L.S.; Schwan, R.F. Selection of Tropical Lactic Acid Bacteria for Enhancing the Quality of Maize Silage. J. Dairy Sci. 2013, 96, 7777–7789. [Google Scholar] [CrossRef]
- AOAC International. Official Methods of Analysis, 16th ed.; Association of Official Analytical Chemists: Washington DC, USA, 1995. [Google Scholar]
- Van Soest, P.J.; Robertson, J.B.; Lewis, B.A. Methods for Dietary Fiber, Neutral Detergent Fiber, and Nonstarch Polysaccharides in Relation to Animal Nutrition. J. Dairy Sci. 1991, 74, 3583–3597. [Google Scholar] [CrossRef]
- Tilley, J.M.A.; Terry, R.A. A Two-Stage Technique for the Invitro Digestions of Forage Crops. Grass Forage Sci. 1963, 18, 104–111. [Google Scholar] [CrossRef]
- Fievez, V.; Dohme, F.; Danneels, M.; Raes, K.; Demeyer, D. Fish Oils as Potent Rumen Methane Inhibitors and Associated Effects on Rumen Fermentation in Vitro and in Vivo. Anim. Feed Sci. Technol. 2003, 104, 41–58. [Google Scholar] [CrossRef]
- Ørskov, E.R.; McDonald, I. The Estimation of Protein Degradability in the Rumen from Incubation Measurements Weighted According to Rate of Passage. J. Agric. Sci. 1979, 92, 499–503. [Google Scholar] [CrossRef]
- Oksanen, J.; Blanchet, F.G.; Friendly, M.; Kindt, R.; Legendre, P.; McGlinn, D. R Package, version 2; Vegan: Community Ecology Package; 2019; Available online: https://cran.r-project.org/package=vegan (accessed on 20 September 2023).
- McEniry, J.; O’Kiely, P.; Clipson, N.J.; Forristal, P.D.; Doyle, E.M. The Microbiological and Chemical Composition of Baled and Precision-Chop Silages on a Sample of Farms in County Meath. Ir. J. Agric. Food Res. 2006, 45, 73–83. [Google Scholar]
- Wambacq, E.; Latré, J.P.; Haesaert, G. The Effect of Lactobacillus Buchneri Inoculation on the Aerobic Stability and Fermentation Characteristics of Alfalfa-Ryegrass, Red Clover and Maize Silage. Agric. Food Sci. 2013, 22, 127–136. [Google Scholar] [CrossRef]
- Ni, K.; Wang, F.; Zhu, B.; Yang, J.; Zhou, G.; Pan, Y.; Tao, Y.; Zhong, J. Effects of Lactic Acid Bacteria and Molasses Additives on the Microbial Community and Fermentation Quality of Soybean Silage. Bioresour. Technol. 2017, 238, 706–715. [Google Scholar] [CrossRef]
- Dolci, P.; Tabacco, E.; Cocolin, L.; Borreani, G. Microbial Dynamics during Aerobic Exposure of Corn Silage Stored under Oxygen Barrier or Polyethylene Films. Appl. Environ. Microbiol. 2011, 77, 7499–7507. [Google Scholar] [CrossRef]
- Ni, K.; Zhao, J.; Zhu, B.; Su, R.; Pan, Y.; Ma, J.; Zhou, G.; Tao, Y.; Liu, X.; Zhong, J. Assessing the Fermentation Quality and Microbial Community of the Mixed Silage of Forage Soybean with Crop Corn or Sorghum. Bioresour. Technol. 2018, 265, 563–567. [Google Scholar] [CrossRef]
- Rochana, A.; Dhalika, T.; Budiman, A.; Kamil, K.A. Nutritional Value of a Banana Stem (Musa Paradisiaca Val) of Anaerobic Fermentation Product Supplemented with Nitrogen, Sulphur and Phosphorus Sources. Pak. J. Nutr. 2017, 16, 738–742. [Google Scholar] [CrossRef]
- Wang, C.F.; Muhammad, A.U.R.; Liu, Z.Y.; Huang, B.Z.; Cao, B.H.C.B.H. Effects of Ensiling Time on Banana Pseudo-Stem Silage Chemical Composition, Fermentation and in Sacco Rumen DegradationEffects of Ensiling Time on Banana Pseudo-Stem Silage Chemical Composition, Fermentation and in Sacco Rumen Degradation. J. Anim. Plant Sci. 2016, 26, 339–346. [Google Scholar]
- Lima, E.M.d.; Gonçalves, L.C.; Keller, K.M.; Rodrigues, J.A.d.S.; Santos, F.P.C.; Michel, P.H.F.; Raposo, V.S.; Jayme, D.G. Re-Ensiling and Its Effects on Chemical Composition, in Vitro Digestibility, and Quality of Corn Silage after Different Lengths of Exposure to Air. Can. J. Anim. Sci. 2016, 97, 250–257. [Google Scholar] [CrossRef]
- Filya, I.; Sucu, E. The Effects of Lactic Acid Bacteria on the Fermentation, Aerobic Stability and Nutritive Value of Maize Silage. Grass Forage Sci. 2010, 65, 446–455. [Google Scholar] [CrossRef]

Disclaimer/Publisher’s Note: The statements, opinions and data contained in all publications are solely those of the individual author(s) and contributor(s) and not of MDPI and/or the editor(s). MDPI and/or the editor(s) disclaim responsibility for any injury to people or property resulting from any ideas, methods, instructions or products referred to in the content. |
© 2023 by the authors. Licensee MDPI, Basel, Switzerland. This article is an open access article distributed under the terms and conditions of the Creative Commons Attribution (CC BY) license (https://creativecommons.org/licenses/by/4.0/).