Article

Biometric Trait Characterization and Multivariate Discriminant Analysis of Traditionally Bred Autochthonous Chickens in Ethiopia

1
Department of Animal Science, College of Agriculture and Environmental Science, Arsi University, Asella P.O. Box 193, Ethiopia
2
Department of Animal Science and Technology, Sunchon National University, Suncheon 57922, Republic of Korea
*
Author to whom correspondence should be addressed.
Agriculture 2023, 13(11), 2142; https://doi.org/10.3390/agriculture13112142
Submission received: 7 October 2023 / Revised: 7 November 2023 / Accepted: 10 November 2023 / Published: 13 November 2023
(This article belongs to the Special Issue Latest Updates in Livestock Nutrition, Processing and Breeding)

Abstract

:
The biometric characterization of autochthonous Ethiopian chickens has not been fully investigated in the study area. In this study, we aimed to conduct biometric trait characterization and multivariate discriminant analysis of traditionally bred autochthonous chickens in Ethiopia and assess the wide range of phenotypic diversity within these populations. A multi-stage sampling procedure was used, and data on biometric traits and body weight were collected from adult chickens. Principal component and correlation analyses were performed to explore the discriminating factors and relationships among traits. All autochthonous chickens showed clear sexual dimorphism, with the Agarfa chickens having the highest biometric traits and body weight. Across the study area, the majority of biometric values showed variation between age group 1 (AG-1) and age group 3 (AG-3). All autochthonous chickens showed a strong correlation between wingspan and back length (p ≤ 0.001). Roosters and hens also showed a strong correlation between the keel and neck length (p ≤ 0.001). Principal component 1 (PC1) and principal component 2 (PC2) explained 56.44%, 55.09%, and 47.86% of the total variation in the original variables for all autochthonous chickens, roosters, and hens, respectively. Univariate and multivariate analyses revealed the existence of biometric trait and body weight variations among autochthonous chickens from different districts. Therefore, genetic profiling should be performed to better understand the genetic potential of autochthonous Ethiopian chickens.

1. Introduction

Applying biometric trait characterization to livestock, including chickens, enables the identification of distinct breed populations and the description of their characteristics and production environments [1]. The term “autochthonous chicken” refers to native chickens raised in an extensive system with the ability to scavenge freely in an open range. These chickens lack a defined description, serve multiple purposes, and have undergone limited improvements [2,3]. According to Horst [2], autochthonous chickens can be considered gene reservoirs, specifically for genes associated with adaptation to tropical conditions. The high phenotypic diversity observed among the autochthonous chickens in Ethiopia indicates significant genetic variability [4]. Local communities selectively bred these chickens for several generations, resulting in distinct phenotypic and genetic characteristics.
In Ethiopia, governmental and non-governmental organizations usually supply improved chickens to replenish existing autochthonous chicken flocks [5]. However, limited scientific research has quantified or evaluated the potential of traditional breeding methods to maintain and enhance the unique quality of these chickens. Consequently, there is a need to identify, characterize, and document autochthonous chickens and ensure the conservation of identified genotypes to prevent the loss of genetic material [6]. It is crucial to have the knowledge and understanding of the unique characteristics of these chickens to design and implement autochthonous-chicken-based development programs that can ultimately benefit rural societies [7].
Hence, the first step toward identifying genotypes is to conduct the biometric trait characterization of chickens in their original rearing areas [8]. These traits, influenced by both genetic and non-genetic factors, are commonly used to describe livestock and poultry types and functions. However, biometric traits play a crucial role in predicting body weight and assessing the efficiency of animal carcasses, comprising a substantial economic selection criterion that significantly influences the ancestral lineage of autochthonous chicken populations [9,10]. However, research that will assist in designing appropriate utilization strategies for autochthonous chickens by providing a comprehensive understanding of their biometric characteristics and diversity has not been conducted extensively in the study region. Therefore, in this study, we aimed to conduct biometric trait characterization and multivariate discriminant analysis of traditionally bred autochthonous chickens in Ethiopia, assess the wide range of phenotypic diversity within these populations, and identify the principal components of the biometric traits contributing to this variation.

2. Materials and Methods

2.1. Site Selection and Sampling Approaches

The study was conducted in the Agarfa and Goba districts of the Bale administrative zone of the Oromia Regional State, which is located 430 km southeast of Addis Ababa (the capital city of the Oromia regional state, the Federal Democratic Republic of Ethiopia). The administrative zone has 11 districts and 2 urban self-administrative towns. Bale Zone has an altitude of 300–4377 m above sea level, with longitudes 38°40’–46°3’ E and latitudes 4°11’–8°11’ N. Rainfall per annum ranges between 1100 and 1300 mm, while the mean day and night temperatures range between 3.5 and 30 °C.
Multi-stage purposive sampling techniques were used to select the representative districts and kebeles (the smallest administrative units within a district) in the zone. In the first stage, two districts, Agarfa and Goba, were selected based on their potential for autochthonous chicken production. In the second sampling stage, six kebeles were selected from two districts based on the distribution of the autochthonous chicken population. Accordingly, three kebeles from each district were proportionally selected. In the third stage, 180 households with at least 4 adult chickens of both sexes and sufficient experience in chicken rearing were randomly selected, proportional to the population size of the selected kebeles. A total of 176 males and 544 females were sampled from the two districts. Most rural communities in the country traditionally manage and rear all autochthonous chickens included in this study for egg and meat production, as well as breeding for replacement stocks. Roosters reach their ideal slaughter age at 24 weeks (6 months), and the same applies to hens for egg production. Therefore, all adult chickens aged 28–112 weeks were included in the biometric trait and body weight measurements and clustered into three groups—age group 1 (AG-1), age group 2 (AG-2), and age group 3 (AG-3)—to compare the effect of age on the traits. The chicken owners determined the age of their chickens using a recall method. Additionally, proximity to all-weather roads and the negligible chance of the presence of exotic/crossbred chickens (owing to the lack of an outreach program in the near past) were considered. At least two neighboring households sharing the same rooster were excluded from the study to avoid the risk of sampling chickens that shared the same rooster.

2.2. Biometric Traits and Body Weight Measurement

Data on nine biometric traits, including body length (BL), keel length (KL), back length (BkL), chest circumference (CC), shank length (SL), wingspan length (WL), neck length (NL), shank circumference (SC), and body weight (BW), were measured following the descriptor list of FAO [1], as indicated in Table 1. All biometric traits were measured in centimeters with calipers and a textile measuring tape. Body weight, however, was recorded in kilograms using a portable spring balance (SALTER Model 235, Salter Brecknell, West Midland, UK) with a weighing capacity of 10 kg and an accuracy of 50 g.

2.3. Statistical Analysis

All data pertaining to biometric traits and body weight measurements were encoded and documented in a Microsoft Excel spreadsheet and, subsequently, archived as a “CSV” file. Data analyses, graphical data visualization, and presentations were performed using SAS 2012 ver. 9.4, and R software ver. 4.3.1 [11].

2.3.1. Univariate Analysis

The GLM procedure was used to assess the effects of age, sex, district, and their interactions on autochthonous chicken biometric traits and body weight measurements. Age, sex, and district were independent variables. Means were compared using Duncan’s multiple range test (p ≤ 0.05). The following model was used to illustrate the effects of age group, sex, district, and their interactions on autochthonous chicken biometric traits and body weight measurements:
Y ijk = μ +   A i + S j + D k + ( SD ) ij + ε ijk
where Y ijk represents the observed value of individual phenotypes; μ is the vector of the overall mean; A i is the vector fixed effect of the age group (i = age group 1 (AG-1), age group 2 (AG-2), and age group 3 (AG-3)); S j represents the vector fixed effect of sex (j = rooster and hen); D k denotes the vector fixed effect of district (k = Agarfa and Goba); SD ij represents the interaction effect of sex with district; and ε ijk accounts for the effect of the random error term on the analysis.

2.3.2. Multivariate Analysis

The associations between biometric traits and body weight measurements, as represented by the Pearson correlation coefficient matrix, were assessed using multiple correspondence analysis in R software. The results were analyzed and visualized using the “FactoMineR”, “factoextra”, and “correlation” packages.
To discern variations and identify the most significant components contributing to the overall variability in the dataset, biometric traits and body weight measurements were subjected to a stepwise discriminant analysis procedure using principal component analysis (PCA) in R software. Initially, all variables for the autochthonous chickens were subjected to PCA to determine the most discriminant traits for the entire population. Subsequently, the biometric traits and body weight measurements of the autochthonous hens and roosters were analyzed separately using principal component analysis to identify the most significant traits or combinations of traits contributing to the variances among the studied populations.

3. Results

3.1. Sexual Dimorphism and the District Effect

The investigation of biometric traits and body weight revealed a highly significant difference in sexual dimorphism (p ≤ 0.05) (Table 2). Autochthonous roosters exhibited higher values for most biometric traits and body weight measures than hens, except for the keel length (KL), regardless of the district. Sex affected all biometric traits and body weight.
The biometric traits and body weights of autochthonous hens from Agarfa and Goba are presented in Table 2. A significant difference was observed between the autochthonous hens from the two districts (p ≤ 0.05), except for the shank circumference. The results indicated that the values of all biometric traits and body weight measurements were higher in Agarfa autochthonous hens (p ≤ 0.05).
The biometric traits and body weights of the autochthonous roosters from the two districts are presented in Table 2. Significant differences were observed in all traits (p ≤ 0.05). The findings indicated that the values of all traits were higher among autochthonous roosters in the Agarfa district than in the Goba district (p ≤ 0.05).

3.2. Age Group and District Effect

Table 3 shows the effects of age group and district on the biometric traits and body hens. BkL, SC, BL, and BW did not differ significantly among the three age groups (p > 0.05), whereas NL did differ significantly (p ≤ 0.05). CC and KL values differed significantly between AG-1 and AG-3 and between AG-2 and AG-3 (p ≤ 0.05). WL was significantly different between AG-1 and AG-3, and SL was significantly different between AG-1 and AG-2 (p ≤ 0.05). Concerning the district effect, BkL, WL, NL, and KL differed significantly among the three age groups in Agarfa (p ≤ 0.05). CC and BL differed significantly between AG-1 and AG-2, and CC and SL differed significantly between AG-2 and AG-3 (p ≤ 0.05). No significant differences in SC or BW were observed among the three age groups (p > 0.05). Autochthonous hens in the Goba district showed significant differences in BkL and WL between AG-1 and AG-2 as well as in WL, SL, NL, and BW between AG-1 and AG-3 (p ≤ 0.05). However, CC, SC, KL, and BL did not differ significantly across age groups for Goba hens (p > 0.05).
Table 3 also illustrates the average values of the age groups and district effects on biometric traits and body weight in autochthonous roosters. CC, BkL, WL, SL, NL, KL, and BL differed significantly between AG-1 and AG-3, with AG-3 exhibiting the highest values (p ≤ 0.05). CC also differed significantly between AG-2 and AG-3, with AG-3 showing the highest values (p ≤ 0.05). BL showed a difference between AG-1 and AG-2, with higher values in AG-2 (p ≤ 0.05). No differences were observed between SC and BW in the autochthonous roosters. In addition, no differences in biometric traits or body weight were found across the age groups in the Agarfa district. In the Goba district, CC, BkL, WL, SL, and BL were significantly different between AG-1 and AG-3, with higher values in AG-3 (p ≤ 0.05). The WL was higher in the AG-3 group than in the AG-2 group. The BW was higher in the AG-2 group than in the AG-1 group.

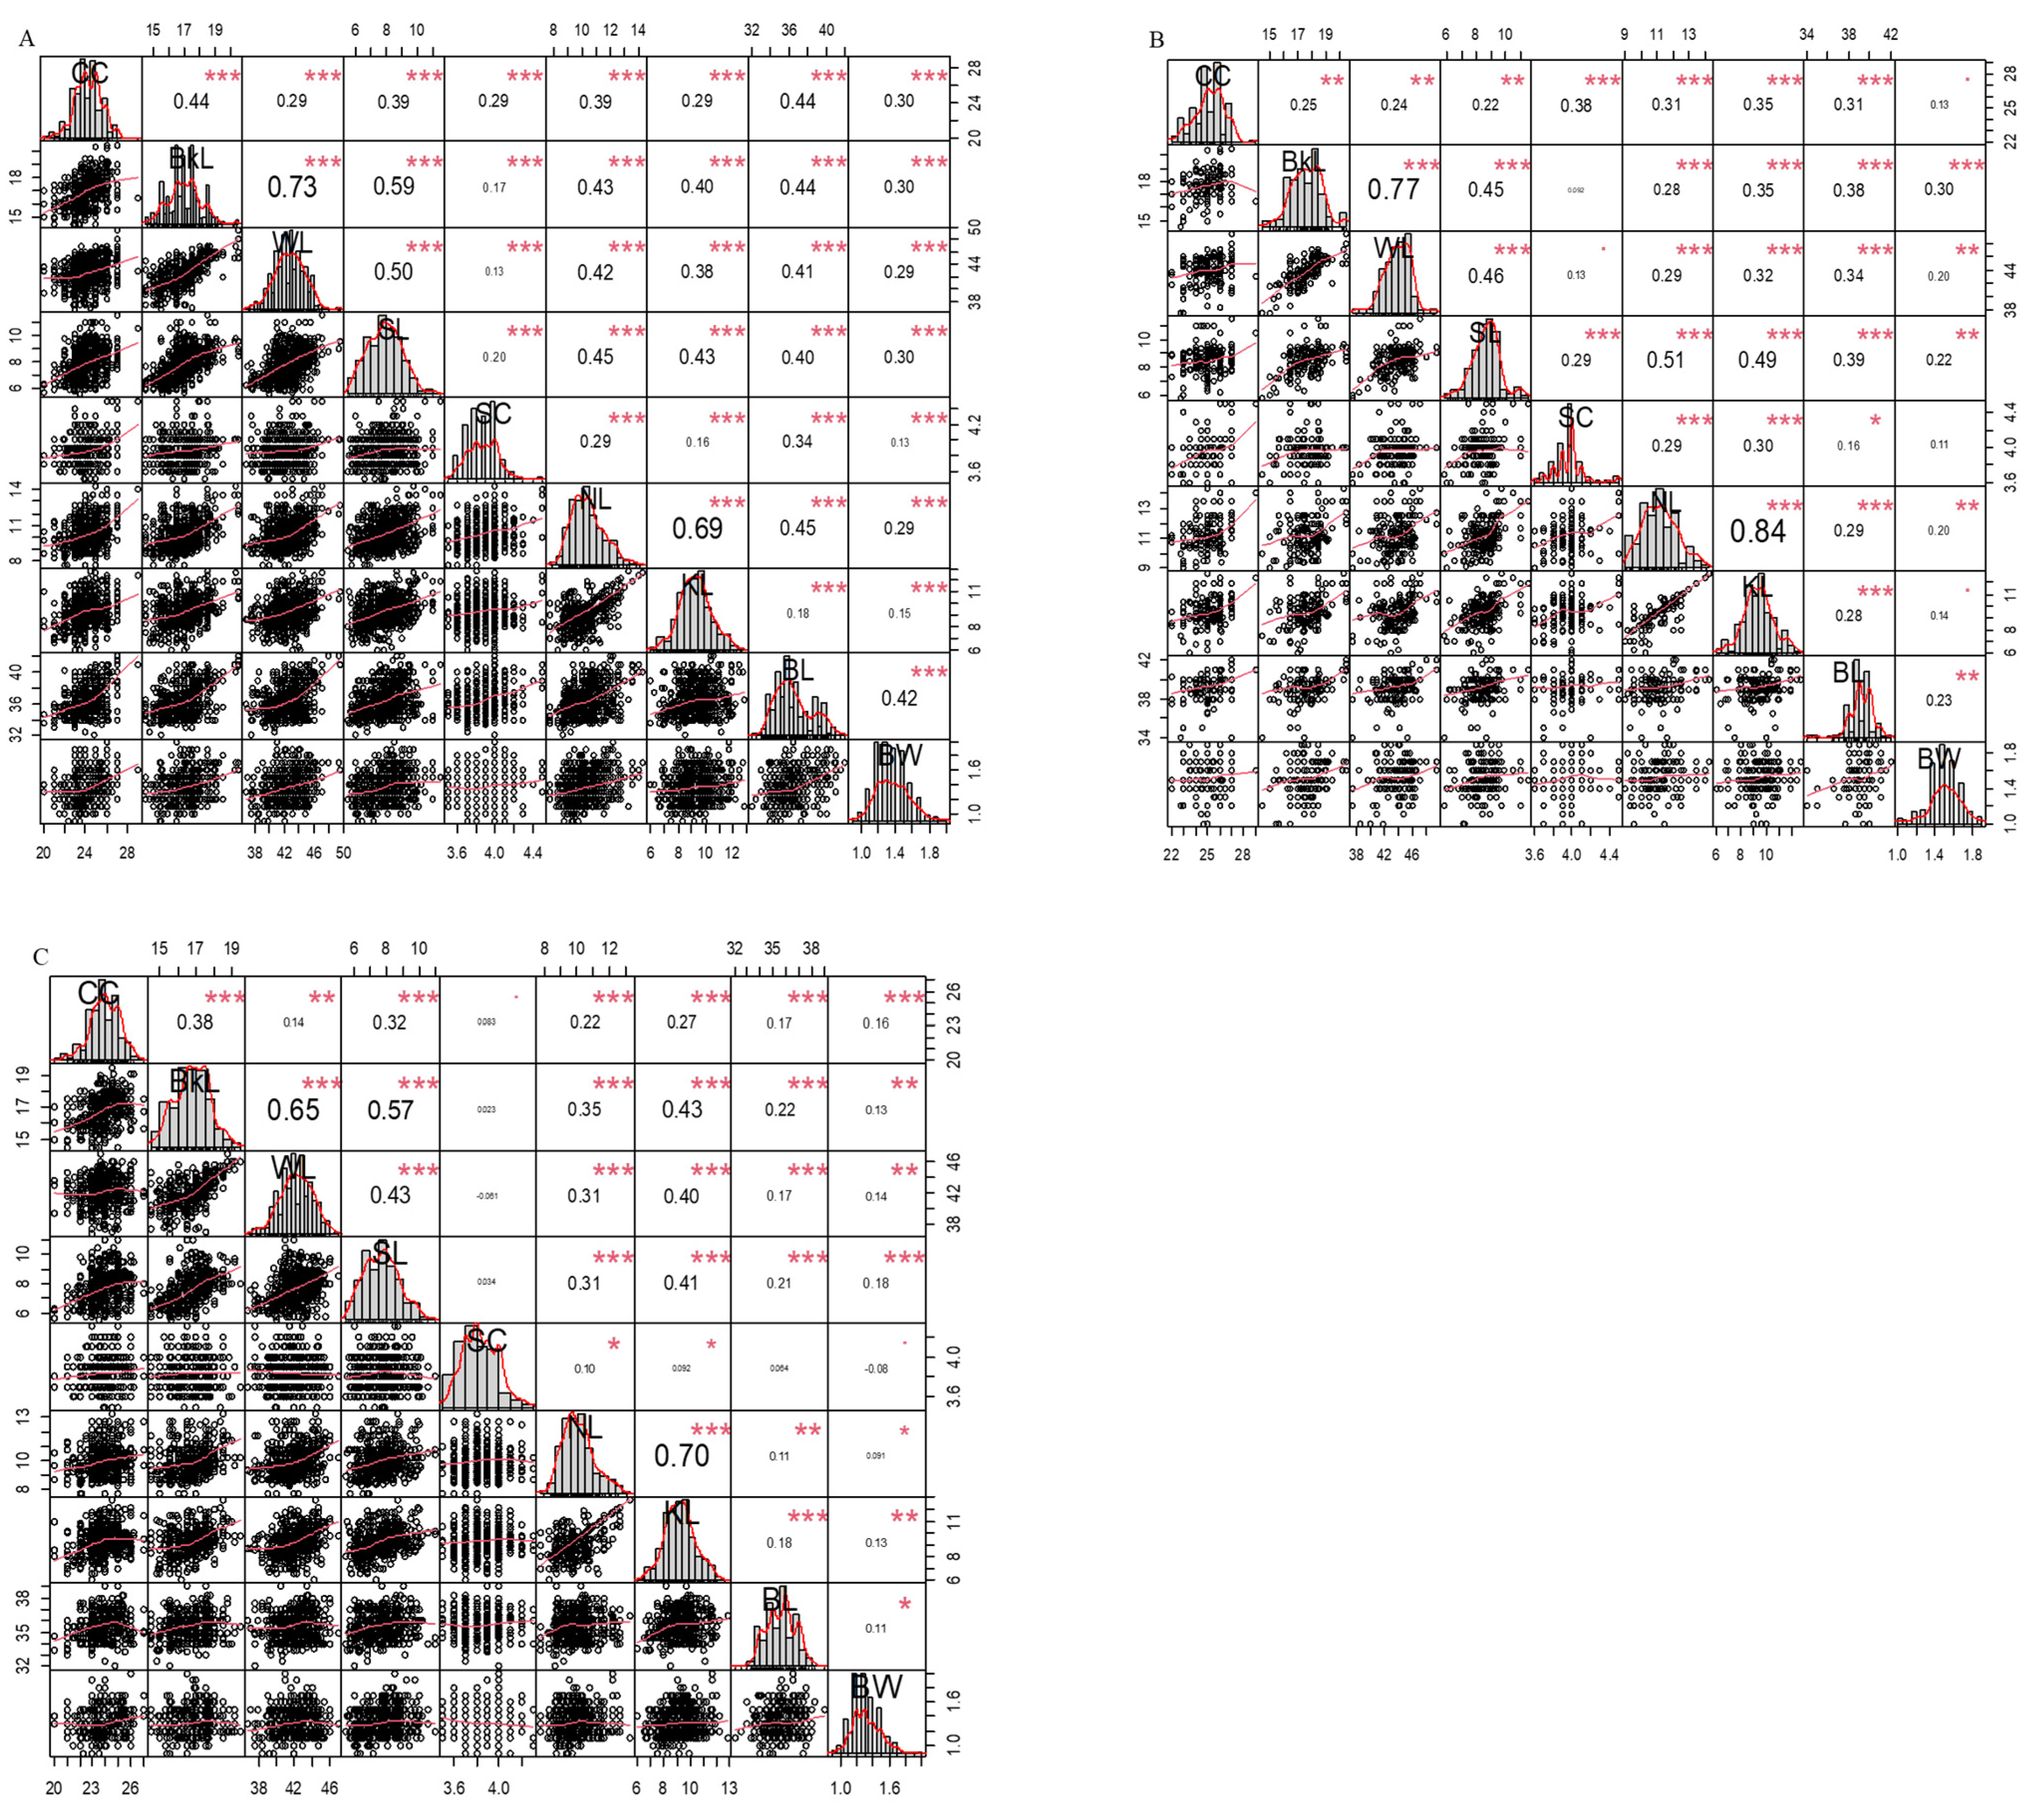
3.3. Phenotypic Correlations

The phenotypic correlations between biometric traits and body weight for all autochthonous chicken populations, regardless of sex, are presented in Figure 1A. The results revealed that all phenotypic correlations between biometric traits and body weight were positive and significant (p ≤ 0.001) in the entire population. The strongest correlation was observed between wingspan length (WL) and back length (BkL) (p ≤ 0.001), with a correlation coefficient of 0.73. Significant positive correlations were also observed between the autochthonous chicken populations between keel length and neck length (0.69), shank length and back length (0.59), and shank length and wingspan length (0.50) (p ≤ 0.001). However, a relatively lower positive correlation was observed between the shank circumference and wingspan length (0.13), as well as between body weight and shank circumference (0.13), for the autochthonous chicken population (p ≤ 0.001).
Figure 1B presents the phenotypic correlation values between the biometric traits and BW of the Ethiopian autochthonous roosters. The highest correlation value was observed between KL and NL (0.84) and between WL and BkL (0.77), with a significance value of p ≤ 0.001. Although no significant correlations were found between certain biometric traits and body weight, no negative correlations were observed among these traits in Ethiopian autochthonous roosters.
The phenotypic correlation between the biometric traits and body weight of autochthonous Ethiopian hens is presented in Figure 1C. The presented values indicate the correlation between traits with different significance levels and the degrees of correlation. The strongest correlations were observed between NL and KL (0.70), BkL and WL (0.65), and BkL and SL (0.57) (p ≤ 0.001). SC demonstrated the lowest correlation with most other traits and exhibited a negative correlation with some traits in Ethiopian autochthonous hens.

3.4. Multivariate Discriminant Analysis

Table 4 presents the eigenvalues, total variance percentages, rotated component matrices, and communalities of the biometric traits and weights of the autochthonous hens and roosters. Communalities denote the amount of variance in each variable that is explained by or attributed to the components, indicating the extent to which the components contribute and capture the variability observed for each specific variable. Communality values ranged from 0.412 to 0.668 for all variables, 0.134 to 0.680 for hens, and 0.222 to 0.814 for roosters. The eigenvalue results provide the amount of variance accounted for by each component, with higher eigenvalues indicating a greater proportion of the total variance.
A scatter plot of the first and second principal component (PC) analyses of biometric traits and body weights of all autochthonous chicken populations is shown in Figure 2A. The results indicate that two principal components, denoted as the first principal component (PC1) and the second principal component (PC2), had eigenvalues of 3.971 and 1.109, respectively. Together, these two principal components contributed 56.44% of the total variance in the nine original variables for biometric traits and body weight measurements across all the autochthonous chicken populations studied. Among the nine traits, PC1 had high loadings for back length (0.398), neck length (0.378), shank length (0.372), and wingspan length (0.366), whereas PC2 was positively correlated with keel length (0.458).
Figure 2B shows a scatter plot of the first and second principal component analyses (PCA) of the biometric traits and body weights of autochthonous roosters. In the rooster dataset, two PCs were extracted, with eigenvalues of 3.156 for PC1 and 1.151 for PC2, which accounted for 55.09% of the total variance in the original variables. PC1 had high positive loadings for the keel length (0.398), neck length (0.391), and shank length (0.390). PC2 had the strongest positive correlation with wingspan length (0.449) and back length (0.488).
Figure 2C presents a scatter plot illustrating the results of the first and second principal component analyses (PCA), along with their loadings for the biometric traits and body weights of the autochthonous hens. The two principal components explained 47.86% of the variance, with eigenvalues of 3.621 for PC1 and 1.337 for PC2. PC1 exhibited the strongest correlation with the back length (0.454), keel length (0.425), and shank length (0.409), whereas PC2 demonstrated a significant positive correlation with the shank circumference (0.691).

4. Discussion

Mean and standard deviation analyses showed significant differences in biometric traits and body weights between autochthonous hens and roosters, reflecting sexual dimorphism and sex–district interactions. Sex had a significant effect on biometric traits and body weight, with autochthonous roosters having higher values than hens, with the exception of keel length. Autochthonous roosters outperformed hens in this study, likely because of the sexual dimorphism caused by higher male sex hormone levels, which leads to greater muscle growth in males [12,13].
Autochthonous roosters and hens had a mean body weight of 1.52 kg and 1.32 kg, respectively, regardless of district. This can be explained by sexual dimorphism, as males and females have different growth rates [12,13]. Agarfa hens (1.35 kg) and roosters (1.55 kg) had higher body weights than Goba hens (1.29 kg) and roosters (1.47 kg). It is possible that the higher body weights of Agarfa hens and roosters were due to genotype–environment interactions and not just sexual dimorphism. The rooster values in this study were similar to those reported by Getu et al. [14] and Negassa et al. [15] but lower than those reported by Halima [16]. In contrast, Aklilu [17] reported higher values. However, Getu et al. [14] and Negassa et al. [15] found similar body weights to hens in the present study, whereas Alemu and Tadelle [18] reported lower values. Differences in body weight between studies may be due to genetic and non-genetic factors, such as management practices, including feeding, watering, and night sheltering.
The chest circumferences of autochthonous roosters (25.19 cm) and hens (23.97 cm) differed significantly, which was likely due to sexual dimorphism. This follows Rensch’s law of sexual size dimorphism [19]. The CC values showed a genotype-by-environment interaction, with Agarfa autochthonous roosters and hens having higher values than those from Goba. Chest circumference is economically important because of the position of vital organs and more space leads to better muscle development [20]. The chest circumferences of the roosters observed in the present study aligned with the findings of Yisma [21]. Aklilu [17] reported that Horro and Jarso roosters from Ethiopia with higher chest circumference had higher body weights than those with lower chest circumference. The hens’ chest circumference in the present study differed from that of Yisma [21] from the North Shewa part of Ethiopia. Agarfa autochthonous roosters and hens had a higher CC than Goba autochthonous roosters and hens. In addition, individuals with higher body weights had higher CC in both autochthonous roosters and hens.
The body lengths of autochthonous roosters (39.18 cm) and hens (35.63 cm) were significantly different, regardless of location, with roosters having higher values than hens. This finding is in agreement with Rensch’s law [19], which states that sexual dimorphism applies to body length. The results also showed that Agarfa hens (35.88 cm) and roosters (39.54 cm) had significantly higher values than Goba hens (35.27 cm) and roosters (38.65 cm) (p ≤ 0.05) of the same sex. Chickens with longer body lengths (BL) are expected to have higher BW because the skeletal dimensions of such birds are expected to be larger [22]. The current findings regarding the body length of roosters were consistent with those of Aklilu [17]. The body lengths of the roosters in the present study were greater than those reported in the North Gonder Zone of Ethiopia [14]. However, the body lengths of the hens were closely aligned with the findings of the same study. Overall, autochthonous roosters and hens from Agarfa exhibited greater body lengths than those from Goba.
Regardless of location, autochthonous roosters and hens had significantly different shank lengths (SL) and circumferences (SC) (p ≤ 0.05). Agarfa hens (8.38 cm) and roosters (8.8 cm) had higher SL than Goba hens (6.8 cm) and roosters (8.17 cm). Agarfa autochthonous roosters (4.02 cm) had a wider SC than Goba autochthonous roosters (3.97 cm). Longer shanks and wider SCs are associated with higher body weights [23]. Getu et al. [14] also reported similar SL and SC values in autochthonous roosters. The shank lengths of the hens in this study were similar to those reported by Getu et al. [14] in northern Ethiopia. Negassa et al. [15] reported lower values of these traits, whereas Melesse and Negesse [23] reported higher values. In this study, autochthonous chickens of both sexes with wider SC and longer SL had higher body weights than those with narrower SC and shorter SL.
The analysis of wingspan length indicates that, regardless of location, there were significant differences between autochthonous hens (42.14 cm) and roosters (43.86 cm), which aligns with the principles of sexual dimorphism. The results of the current study indicate that autochthonous hens (42.83 cm) and roosters (44.29 cm) from Agarfa performed better than autochthonous hens (41.19 cm) and roosters (43.23 cm) from Goba. The WL of both sexes observed in this study was lower than that reported by Getu et al. [14] in the North Gondar region of Ethiopia. However, the current findings demonstrate significantly higher values than those reported by Negassa et al. [15] in the Arsi Zone of Southeastern Oromia, Ethiopia. In addition, Guni et al. [24] reported higher values in the southern highlands of Tanzania. Chickens with longer wingspans usually have strong pectoral muscles that are helpful during flight [25].
Keel length analysis revealed a significant difference between Agarfa hens (9.73 cm) and roosters (9.89 cm) and between Goba hens (8.79 cm) and roosters (9.03 cm). Agarfa roosters and hens had longer keel bones than Goba roosters, suggesting skeletal variations. Keel length corresponds to the length of the sternum of birds [26]. Kokoszyński et al. [27] found that keel length followed sexual dimorphism and was correlated with thoracic length. The rooster keel length in the current study was similar to that reported by Negassa et al. [15], whereas Getu et al. [14] recorded shorter keel bone lengths in roosters from northern Gondar, Ethiopia. The keel bone length of the hens in the present study was greater than that reported by Aklilu et al. [4] in Horro and Jarso, Ethiopia.
In this study, we observed that some biometric traits differed with age. Both the roosters and hens exhibited slight increases in CC, WL, NL, and KL with age. SC and BW did not change significantly among the three age groups, contradicting the observation of Brito et al. [28] regarding the difference in CC between the first and third groups. However, the BW of roosters increased with age, which is consistent with a report by Brito et al. [28] that there were significant differences in body weight among the three age groups of roosters. An increase in the BW was accomplished by strengthening the rooster shank. In hens, in addition to an increase in BW, more evident differences have been observed in chest and wing enlargement. Chest circumference is a good indicator of meatiness in most poultry species [29,30].
Phenotypic correlations between biometric traits and body weight measurements of autochthonous Ethiopian chicken populations are shown in Figure 1A–C. The results showed that the BW of roosters and hens correlated with most of the traits studied. The BW of the hens was positively correlated with all traits except that it was negatively correlated with SC. However, rooster BW was positively correlated with all traits studied across all populations. Each trait was correlated with other traits. Among the traits studied in both chicken populations, NL and KL and BL and WL were highly correlated, whereas the other traits showed low to moderate correlations. The BW of roosters and hens, which correlated with most of the traits studied, was in line with the findings of Adeniji and Ayorinde [31] and Fayeye et al. [32]. However, in contrast to the findings of Paxton et al. [33], the SC was negatively correlated among hens and weakly correlated among roosters. Significant correlations between the chest circumference and all traits, irrespective of sex, except SC, aligned with the findings of Semakula et al. [34]. Significant correlations were also observed among all traits studied, including body length (BL), wing length (WL), shank length (SL), neck length (NL), and keel length (KL), which is consistent with the findings of Vincent et al. [35]. The presence of positive and significant correlations between biometric trait measurements and body weight in all autochthonous chicken, hen, and rooster populations suggests strong predictability among these variables. Similar observations were reported by Ajayi et al. [36], Mendes [37], Putra and Ilham [38] and Udeh and Ogbu [39]. A positive phenotypic correlation between most biometric traits and body weight indicates that body weight can be estimated or predicted using biometric trait measurements [40,41,42].
Discriminant analysis was conducted to identify the biometric traits and body weight measurements that were most significant in differentiating the autochthonous chicken, hen, and rooster populations. The eigenvalues of the total variance, rotated component matrix, and communalities of the traits under investigation indicated the extent to which each principal component explained the total variance of the observed traits after the varimax rotation of the component matrix. Principal components (PCs) with eigenvalues of 3.971 for PC1 and 1.109 for PC2 were calculated in all autochthonous chickens. Similarly, we calculated PCs with eigenvalues of 3.621 for PC1 and 1.337 for PC2 for the hen samples. In contrast, PCs with eigenvalues of 3.156 for PC1 and 1.151 for PC2 were calculated for the roosters. For all autochthonous chickens, PC1 explained 44.12% of the total variance, and PC2 explained 12.32%. When combined, the first two PCs accounted for 56.44% of the total variability of the measured traits. Although PC1 explained 40.23% of the variance and PC2 explained 14.86%, they accounted for a combined value of 55.09% of the total variability observed in the measured rooster traits. Similarly, the first two PCs for hens accounted for 35.07% (PC1) and 12.79% (PC2) of the total variance. When combined, the first two PCs accounted for 47.86% of the total variability of the measured traits. All autochthonous chicken and rooster groups showed higher values for the combined principal components compared to the autochthonous hen group, indicating a greater amount of total variability in the measured traits. Mendes [37] suggested that, in most cases, the first principal component (PC1) effectively summarizes the data. According to Udeh and Ogbu [39], PC1 can be used to describe the generalized form of broiler chickens. The communality values observed in this study varied across the chicken categories. For all chickens, the range was 0.412 (BW) to 0.668 (BkL). For hens, the range was 0.134 (BL) to 0.680 (BkL). For roosters, the range was 0.222 (BW) to 0.814 (BkL). These values indicate that the dataset was suitable for PCA in all groups. The higher communality values observed for back length (BkL) in the three groups indicate the strength of the biometric trait measurements in explaining the total variation. Mendes [37] provided a similar explanation for the higher communality values observed in Ross broilers, and Yakubu et al. [43] for Arbor Acre broilers. However, the lower communality values observed for the other traits in the three groups indicate a weakness in the ability of the biometric trait measurements to explain the total variance. Udeh and Ogbu [39] reported a similar finding, indicating that the lower communality values observed for body measurements in Arbor Acre broilers suggests that these body parameters have a weaker ability to explain the total variation in body measurements.

5. Conclusions

Univariate analyses of biometric traits and body weight indicated sexual dimorphism, with roosters having higher biometric traits and body weights than hens. For biometric traits and body weight, the analysis of the location effect indicated that for both sexes, roosters and hens from the Agarfa district had higher values than their counterparts from the Goba district. The majority of biometric and body weight measurements in autochthonous chickens showed variability between the AG-1 and AG-3 categories across the study area. The positive phenotypic correlations between most biometric traits and body weight measurements indicated that BW can be estimated from biometric traits. Multivariate analysis using PCs is useful for differentiating between the components of biometric traits and body weight, which are the most discriminating variables for separating autochthonous chickens from the two districts. BkL in all autochthonous chicken populations and hens and KL in roosters were the most discriminating variables in differentiating autochthonous chickens from the Agarfa and Goba districts. This study analyzed quantitative data from biometrics and body weight to differentiate the total variation within the studied population. However, molecular-based characterization should be considered for the appropriate differentiation, conservation, and utilization of autochthonous Ethiopian chickens to properly unravel the genetic distinctiveness among the autochthonous chicken genotypes.

Author Contributions

Conceptualization, K.T.M. and K.-S.S.; methodology, K.T.M., D.-H.L. and Y.-G.C.; software, K.T.M. and D.-H.L.; validation, K.T.M., K.-S.S. and Y.-G.C.; formal analysis, K.T.M., D.-H.L. and Y.-G.C.; investigation, K.T.M.; resources, A.-Y.S. and Y.-G.C.; data curation, K.T.M. and A.-Y.S.; writing—original draft preparation, K.T.M.; writing—review and editing, K.T.M. and K.-S.S.; visualization, K.T.M. All authors have read and agreed to the published version of the manuscript.

Funding

This research received no external funding.

Institutional Review Board Statement

The study was duly reviewed and approved by Arsi University College of Agriculture and Environmental Science (AU-CoAES). Thereafter, the Department of Animal Science at Arsi University, the College of Agriculture and Environmental Science, issued a letter of support on 13 January 2022, detailing the objectives of the study, to the district agricultural and livestock development sector offices. The chicken owners who voluntarily participated in the study provided verbal informed consent.

Data Availability Statement

The data presented in this study are available upon request from the corresponding author. The data are not publicly available due to [privacy for an ongoing research].

Acknowledgments

The authors express their gratitude to the rural community for their kind cooperation and access to chickens for data collection. We are also grateful to the data-gathering team for their valuable assistance.

Conflicts of Interest

The authors declare no conflict of interest.

References

  1. FAO. Phenotypic Characterization of Animal Genetic Resources; Animal Production and Health Guidelines No. 11; Food and Agricultural Organization: Rome, Italy, 2012. [Google Scholar]
  2. Horst, P. Native fowl as reservoir for genomes and major genes with direct and indirect effects on the adaptability and their potential for tropically orientated breeding plans. Arch. Fuer Gefluegelkunde 1989, 53, 93–101. [Google Scholar]
  3. Pedersen, C. Productivity of Semi-Scavenging Chickens in Zimbabwe. Ph.D. Thesis, The Royal Veterinary and Agricultural University, Copenhagen, Denmark, 2002. [Google Scholar]
  4. Aklilu, E.; Kebede, K.; Dessie, T.; Banerjee, A. Phenotypic characterization of indigenous chicken population in Ethiopia. Int. J. Interdiscip. Multidiscip. Stud. 2013, 1, 24–32. [Google Scholar]
  5. Demeke, S. Poultry Sector Country Review; Food and Agricultural Organizations, Animal Production and Health Division: Rome, Italy, 2008; Available online: ftp://ftp.fao.org/docrep/fao/011/ai320e/ai320e00.pdf (accessed on 1 December 2008).
  6. Dessie, T.; Dana, N.; Ayalew, W.; Hanotte, O. Current state of knowledge on indigenous chicken genetic resources of the tropics: Domestication, distribution and documentation of information on the genetic resources. World’s Poult. Sci. J. 2012, 68, 11–20. [Google Scholar] [CrossRef]
  7. Guèye, E.H.F. Village egg and fowl meat production in Africa. World’s Poult. Sci. J. 1998, 54, 73–86. [Google Scholar] [CrossRef]
  8. Ajayi, O.O.; Adeleke, M.A.; Sanni, M.T.; Yakubu, A.; Peters, S.O.; Imumorin, I.G.; Ozoje, M.O.; Ikeobi, C.O.N.; Adebambo, O.A. Application of principal component and discriminant analyses to morpho-structural indices of indigenous and exotic chickens raised under intensive management system. Trop. Anim. Health Prod. 2012, 44, 1247–1254. [Google Scholar] [CrossRef] [PubMed]
  9. Falconer, D. Introduction to Quantitative Genetics, 3rd ed.; Longman Scientifical Techniqual: London, UK, 1989. [Google Scholar]
  10. Lin, F.-B.; Zhu, F.; Hao, J.-P.; Yang, F.-X.; Hou, Z.-C. In vivo prediction of the carcass fatness using live body measurements in Pekin ducks. Poult. Sci. 2018, 97, 2365–2371. [Google Scholar] [CrossRef]
  11. Team, R.D.C. R: A Language and Environment for Statistical Computing; R Foundation for Statistical Computing: Vienna, Austria, 2020. [Google Scholar]
  12. Rotimi, E.; Egahi, J.; Adeoye, A. Phenotypic characterization of indigenous chicken population in Gwer-West, Benue State, Nigeria. World Sci. News 2016, 3, 343–353. [Google Scholar]
  13. Melesse, A.; Tadele, A.; Assefa, H.; Taye, K.; Kebede, T.; Taye, M.; Betsha, S. Assessing the morphological diversity of Ethiopian indigenous chickens using multivariate discriminant analysis of morphometric traits for sustainable utilization and conservation. Poult. Sci. J. 2021, 9, 61–72. [Google Scholar]
  14. Getu, A.; Alemayehu, K.; Wuletaw, Z. Phenotypic characterization of indigenous chicken ecotypes in the north Gondar zone, Ethiopia. Anim. Genet. Resour./Resour. Génétiques Anim. 2014, 54, 43–51. [Google Scholar] [CrossRef]
  15. Negassa, D.; Melesse, A.; Banerjee, S. Phenotypic characterization of indigenous chicken populations in Southeastern Oromia Regional State of Ethiopia. Anim. Genet. Resour./Resour. Génétiques Anim. 2014, 55, 101–113. [Google Scholar] [CrossRef]
  16. Halima, H. Phenotypic and Genetic Characterization of Indigenous Chicken Populations in Northwest Ethiopia. Ph.D. Thesis, University of the Free State, Bloemfontein, South Africa, 2007. [Google Scholar]
  17. Aklilu, E. On-Farm Phenotypic Characterization of Indigenous Chicken and Chicken Production Systems in Horro and Jarso Districts, Oromia Regional State. Master’s Thesis, Haramaya University, Haramaya, Ethiopia, 2013. [Google Scholar]
  18. Alemu, Y.; Tadelle, D. The Status of Poultry Research and Development in Ethiopia, Research Bulletin No. 4, Poultry Commodity Research Program Debrezeit Agricultural Research Center; Alemaya University of Agriculture: Haramaya, Ethiopia, 1997; Volume 62. [Google Scholar]
  19. Rensch, B. Die Abhängigkeit der relativen Sexualdifferenz von der Körpergrösse. Bonn. Zool. Beiträge 1950, 1, 58–69. [Google Scholar]
  20. Ojedapo, L.; Amao, S.; Ameen, S.; Adedeji, T.; Ogundipe, R.; Ige, A. Prediction of body weight and other linear body measurement of two commercial layer strain chickens. Asian J. Anim. Sci. 2012, 6, 13–22. [Google Scholar] [CrossRef]
  21. Yisma, A. On-Farm Phenotypic Characterization of Indigenous Chicken and Chicken Production Practices in North Shewa Zone. Master’s Thesis, Haramaya University, Haramaya, Ethiopia, 2015. [Google Scholar]
  22. Dumont, E.R. Bone density and the lightweight skeletons of birds. Proc. R. Soc. B Biol. Sci. 2010, 277, 2193–2198. [Google Scholar] [CrossRef]
  23. Melesse, A.; Negesse, T. Phenotypic and morphological characterization of indigenous chicken populations in southern region of Ethiopia. Anim. Genet. Resour./Resour. Génétiques Anim. 2011, 49, 19–31. [Google Scholar] [CrossRef]
  24. Guni, F.; Katule, A.; Mwakilembe, P. Characterization of local chickens in selected districts of the Southern Highlands of Tanzania: II. Production and Morphometric traits. Livest. Res. Rural Dev. 2013, 25, 25–190. [Google Scholar]
  25. Biewener, A.A. Muscle function in avian flight: Achieving power and control. Philos. Trans. R. Soc. B Biol. Sci. 2011, 366, 1496–1506. [Google Scholar] [CrossRef]
  26. Bell, D.; Weaver, W. Commercial Chicken Meat and Egg Production; Springer: Berlin, Germany, 2002. [Google Scholar]
  27. Kokoszyński, D.; Bernacki, Z.; Saleh, M.; Stęczny, K.; Binkowska, M. Body conformation and internal organs characteristics of different commercial broiler lines. Braz. J. Poult. Sci. 2017, 19, 47–52. [Google Scholar] [CrossRef]
  28. Brito, N.V.; Lopes, J.C.; Ribeiro, V.; Dantas, R.; Leite, J.V. Biometric characterization of the Portuguese autochthonous hens breeds. Animals 2021, 11, 498. [Google Scholar] [CrossRef]
  29. Olawunmi, O.; Salako, A.; Afuwape, A. Morphometric Differentiation and Asessment of Function of the Fulani and Yoruba Ecotype Indigenous Chickens of Nigeria. Int. J. Morphol. 2008, 26, 71067471. [Google Scholar] [CrossRef]
  30. Fayeye, T.; Ayorinde, K.; Ojo, V.; Adesina, O. Frequency and influence of some major genes on body weight and body size parameters of Nigerian local chickens. Livest. Res. Rural Dev. 2006, 18, 37. [Google Scholar]
  31. Adeniji, F.O.; Ayorinde, K.L. Prediction of body weight of broilers at different ages from linear body measurements. Niger. J. Anim. Prod. 1990, 17, 42–47. [Google Scholar] [CrossRef]
  32. Fayeye, T.R.; Hagan, J.K.; Obadare, A.R. Morphometric traits and correlation between body weight and body size traits in Isa Brown and IlorinEcotype chickens. Iran. J. Appl. Anim. Sci. 2014, 4, 609–614. [Google Scholar]
  33. Paxton, H.; Tickle, P.G.; Rankin, J.W.; Codd, J.R.; Hutchinson, J.R. Anatomical and biomechanical traits of broiler chickens across ontogeny. Part II. Body segment inertial properties and muscle architecture of the pelvic limb. PeerJ 2014, 2, 473. [Google Scholar] [CrossRef] [PubMed]
  34. Semakula, J.; Lusembo, P.; Kugonza, D.; Mutetikka, D.; Ssennyonjo, J.; Mwesigwa, M. Estimation of live body weight using zoometrical measurements for improved marketing of indigenous chicken in the Lake Victoria basin of Uganda. Livest. Res. Rural Dev. 2011, 23, 170. [Google Scholar]
  35. Vincent, S.; Yakubu, A.; Momoh, O.; OEgahi, J. Linear weight estimation tapes from predictive models for matured normal feathered Nigerian indigenous chickens. Development 2015, 27, 10. [Google Scholar]
  36. Ajayi, F.O.; Ejiofor, O.; Ironkwe, M.O. Estimation of body weight from linear body measurements in two commercial meat-type chicken. Glob. J. Agric. Sci. 2008, 7, 57–59. [Google Scholar] [CrossRef]
  37. Mendes, M. Multivariate multiple regression analysis based on principal component scores to study relationships between some pre-and post-slaughter traits of broilers. J. Agric. Sci. 2011, 17, 77–83. [Google Scholar]
  38. Putra, W.; Ilham, F. Principal component analysis of body measurements and body indices and their correlation with body weight in Katjang does of Indonesia. J. Dairy Vet. Anim. Res 2019, 8, 124–134. [Google Scholar]
  39. Udeh, I.; Ogbu, C. Principal component analysis of body measurements in three strains of broiler chicken. Sci. World J. 2011, 6, 11–14. [Google Scholar]
  40. Johnson, R.A.; Wichern, D.W. The multivariate normal distribution. In Applied Multivariate Statistical Analysis; Prentice-Hall Inc.: Englewood Cliffs, NJ, USA, 1982; pp. 150–173. [Google Scholar]
  41. Ceccobelli, S.; Di Lorenzo, P.; Lancioni, H.; Ibánez, L.M.; Tejedor, M.; Castellini, C.; Landi, V.; Martínez, A.M.; Bermejo, J.D.; Pla, J.V.; et al. Genetic diversity and phylogeographic structure of sixteen Mediterranean chicken breeds assessed with microsatellites and mitochondrial DNA. Livest. Sci. 2015, 175, 27–36. [Google Scholar] [CrossRef]
  42. Bila, L.; Tyasi, T.L.; Tongwane, T.W.; Mulaudzi, A.P. Correlation and Path Analysis of Body Weight and Biometric Traits of Ross 308 Breed of Broiler Chickens. J. World’s Poult. Res. 2021, 11, 344–351. [Google Scholar] [CrossRef]
  43. Yakubu, A.; Kuje, D.; Okpeku, M. Principal components as measures of size and shape in Nigerian indigenous chickens. Thai J. Agric. Sci. 2009, 42, 167–176. [Google Scholar]
Figure 1. Correlation matrix plot with significance value. (A) Between all traits for all autochthonous chickens (n = 720). (B) Between all traits for autochthonous roosters (n = 176). (C) Between all traits for autochthonous hens (n = 544). The distribution of each variable is shown on the diagonal. On the top of the diagonal, to the right, the value of the Pearson correlation coefficient along with the significance level is represented as stars. On the bottom of the diagonal, to the left, bivariate scatterplots featured with a fitted line are displayed. Each significance level is denoted by corresponding p-values of 0.001 (***), 0.01 (**), and 0.05 (*). Abbreviations: CC: chest circumference; BkL: back length; WL: wingspan length; SL: shank length; SC: shank circumference; NL: neck length; KL: keel length; BL: body length; BW: body weight.
Agriculture 13 02142 g001
Figure 2. Scatter plot of the first and second principal component analyses of biometric traits and body weights. (A) PCA of all autochthonous chicken populations; (B) PCA of autochthonous rooster populations; (C) PCA of autochthonous hen populations.
Agriculture 13 02142 g002
Table 1. Descriptions of biometric trait measurements and how the trait was measured.
Biometric TraitTraits Measurement Descriptions
Body lengthExtending from the tip of the beak to the tip of the tail (cloacae)
Back lengthFrom the insertion of the neck into the body to the base of the tail
Chest circumferenceThe circumference around the deepest region of the breast
Keel lengthThe length between vertices of the sternum leaning the bird on its back
Neck lengthThe length between the nape and insertion of the neck into the body
Shank lengthThe length between the hock joint to the spur of either leg
Shank circumferenceThe circular measurement in the middle of the shank
Wingspan lengthThe length between the tips of the right and left wings after a full stretch
Table 2. Effects of sex and sex–district interaction on biometric traits and body weight measurements in autochthonous hens and roosters (mean ± SD).
EffectAll Sex District—HenDistrict—Rooster
Biometric Traits and Body WeightHen (n = 544)Rooster (n = 176)Agarfa (n = 316)Goba (n = 228)Agarfa (n = 104)Goba (n = 72)
Chest circumference23.97 ± 1.2 b25.19 ± 1.2 a24.27 ± 0.9 a23.55 ± 1.35 b25.42 ± 1.1 a24.85 ± 1.27 b
Back length16.8 ± 1.0 b17.71 ± 1.1 a17.34 ± 0.7 a16.05 ± 0.73 b18.11 ± 1.0 a17.13 ± 0.94 b
Wingspan length 42.14 ± 1.8 b43.86 ± 2.0 a42.83 ± 1.6 a41.19 ± 1.77 b44.29 ± 1.9 a43.23 ± 1.98 b
Shank length7.72 ± 1.1 b8.54 ± 1.0 a8.38 ± 0.8 a6.8 ± 0.60 b8.8 ± 0.90 a8.17 ± 0.97 b
Shank circumference3.84 ± 0.2 b3.98 ± 0.2 a3.85 ± 0.2 a3.82 ± 0.14 a4.02 ± 0.2 a3.92 ± 0.14 b
Neck length10.06 ± 1.0 b11.3 ± 1.1 a10.23 ± 1.0 a9.82 ± 1.05 b11.49 ± 1.2 a11.02 ± 1.04 b
Keel length9.34 ± 1.2 a9.54 ± 1.3 a9.73 ± 1.0 a8.79 ± 1.17 b9.89 ± 1.2 a9.03 ± 1.18 b
Body length35.63 ± 1.1 b39.18 ± 1.2 a35.88 ± 1.1 a35.27 ± 1.11 b39.54 ± 0.9 a38.65 ± 1.38 b
Body weight1.32 ± 0.2 b1.52 ± 0.2 a1.35 ± 0.2 a1.29 ± 0.16 b1.55 ± 0.2 a1.47 ± 0.18 b
a,b Means with different superscript letters are significantly different for each biometric trait and body weight between all sexes and districts’ hens and roosters (p ≤ 0.05). n = number of chickens sampled. Biometric traits were measured in centimeters, and body weight was measured in kilograms (kg). The number in the bracket is total number of chickens sampled for the respective categories.
Table 3. Effects of age group and district on biometric traits and body weight in autochthonous hens and roosters (mean ± SD).
All AgarfaGoba
Group AG-1AG-2AG-3AG-1AG-2AG-3AG-1AG-2AG-3
Hen n = 166n = 285n = 93n = 124n = 147n = 45n = 42n = 138n = 48
CC23.89 ± 1.01 b23.92 ± 1.2 b24.27 ± 1.39 a24.07 ± 0.91 b24.29 ± 0.84 b24.77 ± 0.80 a23.36 ± 1.13 a23.53 ± 1.29 a23.79 ± 1.65 a
BkL16.79 ± 0.89 a16.8 ± 0.9 a16.81 ± 1.11 a17.13 ± 0.67 a17.41 ± 0.64 b17.72 ± 0.69 c15.81 ± 0.69 b16.16 ± 0.75 a15.95 ± 0.66 ab
WL41.83 ± 1.78 b42.24 ± 1.8 ab42.41 ± 1.92 a42.33 ± 1.55 c43.01 ± 1.43 b43.61 ± 1.54 a40.34 ± 1.60 b41.42 ± 1.84 a41.29 ± 1.53 a
SL7.99 ± 1.09 a7.54 ± 1 b7.76 ± 1.1 ab8.45 ± 0.82 ab8.25 ± 0.74 b8.61 ± 0.81 a6.65 ± 0.57 b6.79 ± 0.58 ab6.96 ± 0.66 a
SC3.85 ± 0.16 a3.84 ± 0.2 a3.82 ± 0.14 a3.85 ± 0.16 a3.85 ± 0.17 a3.82 ± 0.15 a3.82 ± 0.15 a3.83 ± 0.14 a3.81 ± 0.14 a
NL9.79 ± 0.87 c10.06 ± 1 b10.52 ± 1.14 a9.87 ± 0.87 c10.27 ± 0.89 b11.09 ± 0.94 a9.54 ± 0.82 b9.84 ± 1.10 ab9.99 ± 1.06 a
KL9.17 ± 0.99 b9.3 ± 1.1 b9.72 ± 1.38 a9.37 ± 0.87 c9.77 ± 0.89 b10.59 ± 0.94 a8.59 ± 1.09 a8.81 ± 1.17 a8.91 ± 1.22 a
BL35.6 ± 1.06 a35.67 ± 1.1 a35.55 ± 1.32 a35.75 ± 1.02 b35.92 ± 1.05 ab36.12 ± 1.23 a35.15 ± 1.06 a35.4 ± 1.10 a35.02 ± 1.17 a
BW1.32 ± 0.18 a1.32 ± 0.2 a1.34 ± 0.15 a1.34 ± 0.18 a1.36 ± 0.18 a1.34 ± 0.13 a1.25 ± 0.19 b1.28 ± 0.14 ab1.34 ± 0.17 a
Rooster n = 41n = 73n = 62n = 18n = 45n = 41n = 23n = 28n = 21
CC24.8 ± 1.17 b25.06 ± 1.2 b25.59 ± 1.2 a25.43 ± 0.97 a25.43 ± 0.97 a25.70 ± 1.16 a24.31 ± 1.09 b24.31 ± 1.09 ab25.38 ± 1.29 a
BkL17.34 ± 1.12 b17.7 ± 1 ab17.95 ± 1.14 a18.11 ± 0.75 a18.11 ± 0.75 a18.15 ± 1.26 a16.74 ± 1.00 b16.74 ± 1.00 ab17.56 ± 0.75 a
WL43.18 ± 2.05 b43.76 ± 2 ab44.42 ± 1.77 a44.13 ± 1.54 a44.13 ± 1.54 a44.47 ± 1.97 a42.43 ± 2.12 b42.43 ± 2.12 b44.33 ± 1.33 a
SL8.1 ± 0.91 b8.53 ± 0.9 a8.85 ± 1.05 a8.54 ± 0.63 a8.54 ± 0.63 a9.01 ± 1.12 a7.76 ± 0.96 b7.76 ± 0.96 ab8.55 ± 0.85 a
SC3.97 ± 0.19 a3.99 ± 0.2 a3.97 ± 0.16 a4.08 ± 0.21 a4.08 ± 0.21 a4.00 ± 0.16 a3.89 ± 0.13 a3.89 ± 0.13 a3.90 ± 0.14 a
NL10.94 ± 1.07 b11.25 ± 1.1 ab11.6 ± 1.15 a11.18 ± 1.25 a11.18 ± 1.25 a11.76 ± 1.20 a10.75 ± 0.89 a10.75 ± 0.89 a11.28 ± 0.99 a
KL9.29 ± 1.08 b9.4 ± 1.3 ab9.86 ± 1.3 a9.58 ± 1.25 a9.58 ± 1.25 a10.16 ± 1.20 a9.06 ± 0.89 a9.06 ± 0.89 a9.27 ± 1.31 a
BL38.73 ± 1.43 b39.18 ± 1.1 a39.47 ± 1.1 a39.39 ± 0.82 a39.39 ± 0.82 a39.68 ± 1.01 a38.21 ± 1.60 b38.21 ± 1.60 ab39.05 ± 1.17 a
BW1.47 ± 0.2 a1.53 ± 0.2 a1.53 ± 0.17 a1.56 ± 0.13 a1.56 ± 0.13 a1.56 ± 0.17 a1.41 ± 0.22 b1.41 ± 0.22 b1.48 ± 0.14 a
a–c Means with different superscript letters are significantly different between age groups among all hens, roosters, and district categories for each trait (p ≤ 0.05). n = number of chickens sampled, SD: standard deviation, the number displayed beneath each age group represents the total number of hens and roosters within each respective group category; AG: age group; AG-1: between 28 and 56 weeks; AG-2: between 57 and 84 weeks; AG-3: between 85 and 112 weeks of age; BW: body weight; CC: chest circumference; BkL: back length; WL: wingspan length; SL: shank length; SC: shank circumference; NL: neck length; KL: keel length; BL: body length. BW was measured in kilograms, whereas other biometric traits were measured in cm.
Table 4. Eigenvalues, percentage of total variance, rotated component matrix, and communalities of biometric traits and body weight measurements of autochthonous hens and roosters.
All ChickensHensRooster
VariablesPC1PC2CommunalitiesPC1PC2CommPC1PC2Communalities
Chest circumference0.320−0.2780.4920.2880.0180.2620.280−0.2440.362
Back length0.3980.1870.6680.454−0.1640.6800.3700.4880.814
Wingspan length0.3660.2500.6010.394−0.2460.5590.3620.4490.743
Shank length0.3720.1480.5720.409−0.1340.5490.3900.0170.551
Shank circumference0.199−0.5050.4400.0470.6910.5570.232−0.4140.423
Neck length0.3780.1640.5970.3750.3790.6080.391−0.3640.731
Keel length0.3170.4580.6330.4250.2930.6690.398−0.3470.734
Body length0.343−0.4220.6650.203−0.0560.1340.3090.1550.378
Body weight0.257−0.3660.4120.156−0.4300.2890.2050.2280.222
Eigenvalues3.9711.109-3.6211.337-3.1561.151-
% variance44.12012.320-35.07012.790-40.23014.860-
PC1: principal component 1, PC2: principal component 2.
Disclaimer/Publisher’s Note: The statements, opinions and data contained in all publications are solely those of the individual author(s) and contributor(s) and not of MDPI and/or the editor(s). MDPI and/or the editor(s) disclaim responsibility for any injury to people or property resulting from any ideas, methods, instructions or products referred to in the content.

