Article

The Carbon Footprint of a 5000-Milking-Head Dairy Operation in Central Texas

1
Division of Agribusiness and Agricultural Economics, Department of Agricultural and Consumer Sciences, Tarleton State University, P.O. Box T-0040, Stephenville, TX 76402, USA
2
Department of Accounting, Finance, and Economics, Tarleton State University, P.O. Box T-0920, Stephenville, TX 76402, USA
*
Authors to whom correspondence should be addressed.
Agriculture 2023, 13(11), 2109; https://doi.org/10.3390/agriculture13112109
Submission received: 3 October 2023 / Revised: 27 October 2023 / Accepted: 5 November 2023 / Published: 7 November 2023
(This article belongs to the Section Ecosystem, Environment and Climate Change in Agriculture)

Abstract

:
Texas is the third-largest milk-producing state in the U.S., with Central Texas being the second-largest milk-producing region in Texas. The average size of a dairy herd in Texas is 1829 cows. In Central Texas alone, there are 88,000 dairy cows. However, there is a lack of environmental impact research for this region. The overall objective of this case study is to evaluate the net carbon and carbon equivalent balances for a large dairy operation in Central Texas. The dairy selected for this study has a herd size of 5000 milking cows. The data assumptions were made regarding the selected dairy’s performance and production for the 2021 production year. These data include herd size and management, milk production, crop production, feed purchases, and on-farm energy usage. The USDA-Integrated Farm System Model (IFSM) was used to estimate the daily and annual greenhouse gas emissions and environmental footprint of the dairy by quantifying the operation’s carbon footprint based on its 2021 performance and management practices. Research outcomes identify and quantify sources of greenhouse gas (GHG) emissions produced on the dairy farm. Additionally, the carbon footprint (CF) was determined by estimating the CO2 equivalents (CO2-eq) emitted or sunk from animal and manure emissions, direct and indirect land emissions, net biogenic and anthropogenic CO2 emissions, and the production of resource inputs. The results of this case study indicated that the carbon footprint (CF) of the 5000-milking-head dairy in Central Texas was 0.40 lb. of CO2 per lb. of fat- and protein-corrected milk (FPCM) when considering biogenic CO2 and 0.83 lb. of CO2 per lb. of FPCM without biogenic CO2.

1. Introduction

Climate change can be defined as the long-term shift in temperature and weather patterns due to an increase in heat-trapping gases in the atmosphere. These gases are referred to as greenhouse gases (GHGs). This issue is viewed as a global concern, and efforts are being made to reduce the impact various sectors have on GHG emissions and climate change. Carbon dioxide (CO2) is one of the most important greenhouse gases because it absorbs and then re-radiates heat, keeping the global surface temperature above freezing. However, there has been an increase in atmospheric CO2, which has led to an increase in the global surface temperature [1]. According to the Bulletin of the American Meteorological Society’s global climate report, the seven warmest years since the mid to late 1800s occurred from 2015 to 2021 [2]. CO2 comes from various sources, such as animals, the extraction and burning of fossil fuels, farming, wildfires, manufacturing, deforestation, etc. Most activities impact atmospheric CO2 by either emitting it into the atmosphere or capturing it on earth [3]. Much like CO2, there are several other greenhouse gases that impact the atmosphere. These gases include, but are not limited to, methane (CH4) and nitrous oxide (N2O). They are often referred to and measured as CO2 equivalents (CO2-eq). CO2-eq is the metric measurement used to estimate or compare the emissions from other GHGs based on their global warming potential (GWP) [4]. For example, at a 100-year GWP, every 1 kilogram (kg) of CH4 is equivalent to 25 kg of CO2, and every 1 kg of N2O is equivalent to 298 kg of CO2 [5,6].
GHG emissions can be classified into several sectors. Some of these sectors include energy, industry, buildings, transportation, and, lastly, agriculture, forestry, and other land use (AFOLU) [7]. AFOLU was estimated to be responsible for 18.4% of global GHG emissions [8] and 11.2% of total U.S. emissions in 2020 [9]. Figure 1 takes a closer look at GHG emissions for the U.S. in 2019 by quantifying GHG emissions for each of the 11 identified sectors [8]. The GHG emissions were converted into CO2-eq and measured in millions of tons (Mt). The agriculture sector was ranked 6th, emitting 381.37 Mt of CO2-eq, respectively. Figure 2 presents the allocation and quantification of CO2-eq emissions for the agriculture sector. The categories represent groups pertaining to crop and livestock production and management activities [10].
A focus has been placed on the dairy industry, as it is estimated to contribute 1.3 to 1.5% of total U.S. emissions [11,12]. Cattle alone are estimated to produce about 11% of all human-induced GHG emissions globally [13]. In 2020, the Net Zero Initiative was launched within the U.S. dairy community. This initiative encourages dairy operations to adopt technology and practices to achieve an industrywide “net zero” GHG emission status by 2050 [14,15]. Due to initiatives like the Net Zero Initiative, measuring GHG emissions has become more popular at the operational source, industry, state, national, and global scales. Several whole-farm models have been developed to help estimate the GHG emissions, considering that about 72% of emissions occur during production before the milk has left the farm [16]. Listed are some of the modeling systems developed: AgRE Calc, COMET-Farm, Cool Farm Tool, DairyGEM, DairyMod, and several others [17]. The IPCC developed the GWP, or “carbon footprint (CF)”, metric to standardize emissions from multiple gases [18]. CFs are used to evaluate the potential climate impact of products. They can be calculated using life-cycle assessment (LCA) methodology, which quantifies the impact of goods and services over their full life cycle [18].
In 2021, Texas ranked fourth in U.S. milk production. With 335 Grade A dairy farms and an estimated 625,000 cows, 15.6 billion pounds of milk were produced [9]. According to the Texas Association of Dairymen, the Texas dairy industry contributed USD 39.6 billion to the U.S. economy. The direct and indirect economic impact on the economy was USD 50.3 billion, which includes local, state, and federal taxes as well as wages [19]. Dairy farming is the state’s second-largest agricultural commodity behind the cattle industry [20], generating 2.8% of Texas’ GDP in 2021 [21]. A trend throughout the history of the U.S. and Texas dairy industries is consolidation, resulting in fewer and larger farms [22]. The USDA reported that the number of dairy farms decreased from 59,130 to 37,468 between 2007 and 2018, but herd size increased [22].
The Panhandle region of Texas accounts for 80% of the state’s dairy industry [20]. Other top milk-producing counties include Erath and Comanche, located in Central Texas, and Hopkins County, located in Northeast Texas. Northeast Texas was once the leading region for dairy production; however, the amount of rainfall and humidity were not the most ideal conditions for dairy operations [20]. In the 1980s, Central Texas dairy production surpassed Northeast Texas production [23]. By the 1990s, Erath County had become the leading dairy-producing county in the state [24]. Around the 21st century, the dairy industry expanded to the Texas High Plains as several producers from Central Texas and surrounding states moved to that region [25]. By 2010, the Panhandle had become the number one milk-producing region of the state [26]. The drier climate provides a better quality of life for the dairy cattle, and the cheaper land provides a better quality of life for the dairymen. The consolidation of the dairy industry, as discussed by Son, Richard, and Lambert [22], is one of the factors that has influenced Texas dairy producers to re-locate. The availability of land in the Texas Panhandle provides dairy producers with the opportunity to increase herd size and overall profitability as a result of economies of scale [27]. The NASS [28] reported that the costs of production for dairies with 1000–1999 heads were 16% and 30%, respectively, lower than farms with 200–499 heads and 100–199 heads.
In order to demonstrate these trends leading to further analysis, the literature relevant to this paper combines a particular focus on three main parts. The first part is the environmental assessment of the dairy industry. The U.S. dairy industry has set goals to become carbon neutral or better, optimize water use while maximizing recycling, and improve water quality by optimizing the utilization of manure and nutrients by 2050. Studies evaluating the environmental impacts of dairy production have been performed for dairy operations that are general in nature or, at the other extreme, specific to location or production system. Rotz et al. [11] performed a study to build on a regional approach to quantify the important environmental footprints of milk production on dairy farms throughout six regions of the U.S., which include the Northeast, Southeast, Midwest, South Central, Northwest, and Southwest, according to climate, soils, feed production, and animal management practices. For each region, process-level simulations of individual systems provided data on performance and environmental impacts. Regional estimates were used to calculate the national estimate by weighing the footprints of individual production systems by the portion of milk they contributed. A partial LCA was performed using the Integrated Farm System Model (IFSM) to simulate and examine the performance, environmental impacts, and economics of dairy systems.
According to Rotz et al. [11], the total national GHG emissions from dairy farms are 99,000 ± 8480 kg CO2. The Midwest region accounted for one-third of national emissions. The Southwest region accounted for 27% of national emissions. Enteric emissions contributed 45% [29], and manure emissions contributed 26% of the total carbon footprint. Compared to the 2018 estimated national GHG emissions, the dairy industry accounted for 1.5% of total U.S. GHG emissions. NH3 is the most concerning emission coming from dairy farms, as it accounts for 24% of all NH3 emissions in the U.S. Due to the diversity of dairy operations, mitigation strategies need to be tailored to meet the individual needs of the farms. Results indicated that mitigation needs should focus on reducing NH3 emissions from manure sources, reducing water and energy use within feed production, and reducing CH4 emissions from enteric and long-term manure storage sources.
Within the context of a full environmental assessment, there is specific literature on the carbon footprint (CF) of milk production, the second major literature focus. Rotz [17] models the GHG emissions from dairy farms and claims that livestock contributes 11% [17] to 14.5% [30] of all GHG emissions and that dairy cattle are responsible for 1.3% of the U.S. total and 20% of the total sector emissions. The study also claims that 72% of emissions happen before the milk has left the farm. The milk CF has been shown to be reduced by increasing milk production per cow rather than by reducing daily emissions of GHGs [31]. Enteric CH4, manure management, and feed production contribute to approximately 70% of the United States milk CF. The CF of milk production may vary depending on the choice of functional unit, system boundary, LCA methodology, methods of calculations, methods of co-product allocation, and other assumptions. Vida and Tedesco [30] sought to empirically assess the CF of milk production for a dairy farming system that intentionally directs its efforts to reduce environmental impact through mitigation option strategies in order to evaluate the environmental impact of milk production. The case study suggested that enteric CH4 was the greatest source of GHG emissions. Nutrition and feeding approaches could potentially reduce CH4 emissions by 2.5 to 15%. N2O was the second-largest source of GHG emissions due to soil treatments with organic and inorganic fertilizer. The total farm GHG emissions per year were 8592 tons of CO2 equivalents. The CF of the case farm located in Italy was 1.11 kg CO2-eq/kg fat- and protein-corrected milk (FPCM) [30].
The third major part of the literature discusses an ever-growing trend in the dairy industry—this inverted relationship noted by Lauer, Hansen, Lamers, and Thrän [32] in their study shows that as the number of Idaho dairy farms decreased, the number of dairy cows increased from 153,000 to 592,000 cows from 2012 to 2017. This is a trend that has been seen in all of U.S. dairy production [33]. As a result of this trend, there is an urgent push to reduce the environmental impact of the dairy industry. A potential solution is the implementation of an anerobic digestion system (ADS), which converts manure waste into biogas or biomethane. Biogas produces electricity and heat. Biomethane is biogas that is converted into renewable natural gas and can be injected into pipelines. Through a non-linear optimization model, the study analyzed the economic viability of on-farm biogas use and the injection of biomethane into the natural gas grid by optimizing the net present value (NPV) of anerobic digestion. The results of the study indicated that farm size has a substantial influence on the choice of manure management practices adopted by farms [34]. For a dairy farm with 3700 or more cows, the conversion of biogas to biomethane becomes more economically feasible. Additionally, for dairy farms with a herd between 3700 and 5900, a complete mix digester achieves a higher NPV than other types of ADSs. However, for dairy farms with a herd size greater than 6000, the covered lagoon digestor achieves the highest NPV [33]. With consideration of the trend discussed previously, it may be inferred that the adoption of a covered lagoon ADS that produces biomethane will reduce a dairy farm’s environmental impact as well as be economically feasible. Results from other studies also indicated that ADSs were viable; however, significant government support is still needed to yield financial returns that are attractive to investors [35].
The existing literature discusses the U.S. dairy industry as a whole, as well as an Italy dairy case study and the Idaho dairy industry in regards to GHG emissions, carbon footprint, and farm management economics. However, through a comprehensive literature review process, it has been determined that there is a lack of environmental research pertaining to the Texas dairy industry. Firstly, this paper discusses the farm structure and management of a large Texas dairy operation. Secondly, the environmental impact of the dairy farm is explained with respect to on-farm activities including crop and milk production, manure management, and housing facilities. Lastly, the research presented in this paper provides a breakdown of a dairy operation’s carbon footprint.
The overall objectives of this study were to evaluate the environmental impact of a 5000-milking-head dairy operation located in Central Texas as well as the environmental impact of a similar dairy system located in the Panhandle region of Texas. More specifically, this study will analyze the annual emission and allocation of GHGs in addition to the CO2-eq footprints of animal emissions, manure emissions, direct and indirect land emissions, net biogenic CO2 emissions, anthropogenic CO2 emissions, and the production of resource inputs. Lastly, this study will discuss the economic analysis resulting from the modeling system.

2. Materials and Methods

2.1. Integrated Farm System Model Version 4.7

The model being used to compute the carbon footprint is the Integrated Farm System Model (IFSM) version 4.7, developed by the Agricultural Research Service (ARS) of the USDA. IFSM 4.7 is a process-based, whole-farm model used to assess and compare the environmental and economic sustainability of farming systems. Initially, the tool was developed for the comprehensive evaluation and comparison of dairy production systems. Now, it can be utilized in crop, dairy, and beef production systems. Due to the complexity of the production systems, the whole farm model is composed of several sub-models with built-in subroutines that organize the farm activities and identify representative inputs for each type of system. The subroutines organize the processes that take place within the sub-models [36].

2.1.1. IFSM 4.7 Model Input

The IFSM 4.7 starts by collecting input information, which includes farm type, machinery, and weather, that is supplied to the user as files. Based on the type of operation chosen, the input files the user chooses will automatically set the parameters. The parameters are presented in the following divided sub models: crop and soil, grazing, machinery, tillage and planting, harvest, feed and grain storage, animal and feeding, manure, and economic information. For example, the machinery file selected will link appropriate machinery parameters into operations for tillage, planting, harvesting, and feeding. However, most of the input parameters can be modified to best represent the specific farming systems being analyzed [36].
With inputs identified, the simulation is performed using a weather data file representative of the general location of the operation being analyzed. The weather data file selected contains many years of daily weather data for the specified location.

2.1.2. IFSM 4.7 Model Output

The model presents the results in four separate files: the summary output, the full report, the optional output, and parameter tables. (1) The summary output file is made up of several tables that show the average performance, costs, and returns over the number of years simulated. The values include the mean and standard deviation over all simulated years of crop yields, feeds produced, feeds purchased and sold, manure produced, a summary of feed production ingredients, manure handling, and other farm costs, and the profitability of the farm. (2) The full report provides the same information; however, values are given for each simulated year. (3) Upon request, the optional output tables provide a closer inspection of how the components of the full simulation are functioning, which includes the daily values of crop growth and development, monthly summaries of suitable days for field work, a daily summary of forage harvest operations, annual summaries of machine, fuel, and labor use, and the ingredients of animal feeding components. (4) The parameter tables may also be requested, which summarize the input parameters specified for a given simulation: crop, soil, tillage, and planting parameters; grazing parameters; machine parameters; and economic parameters.

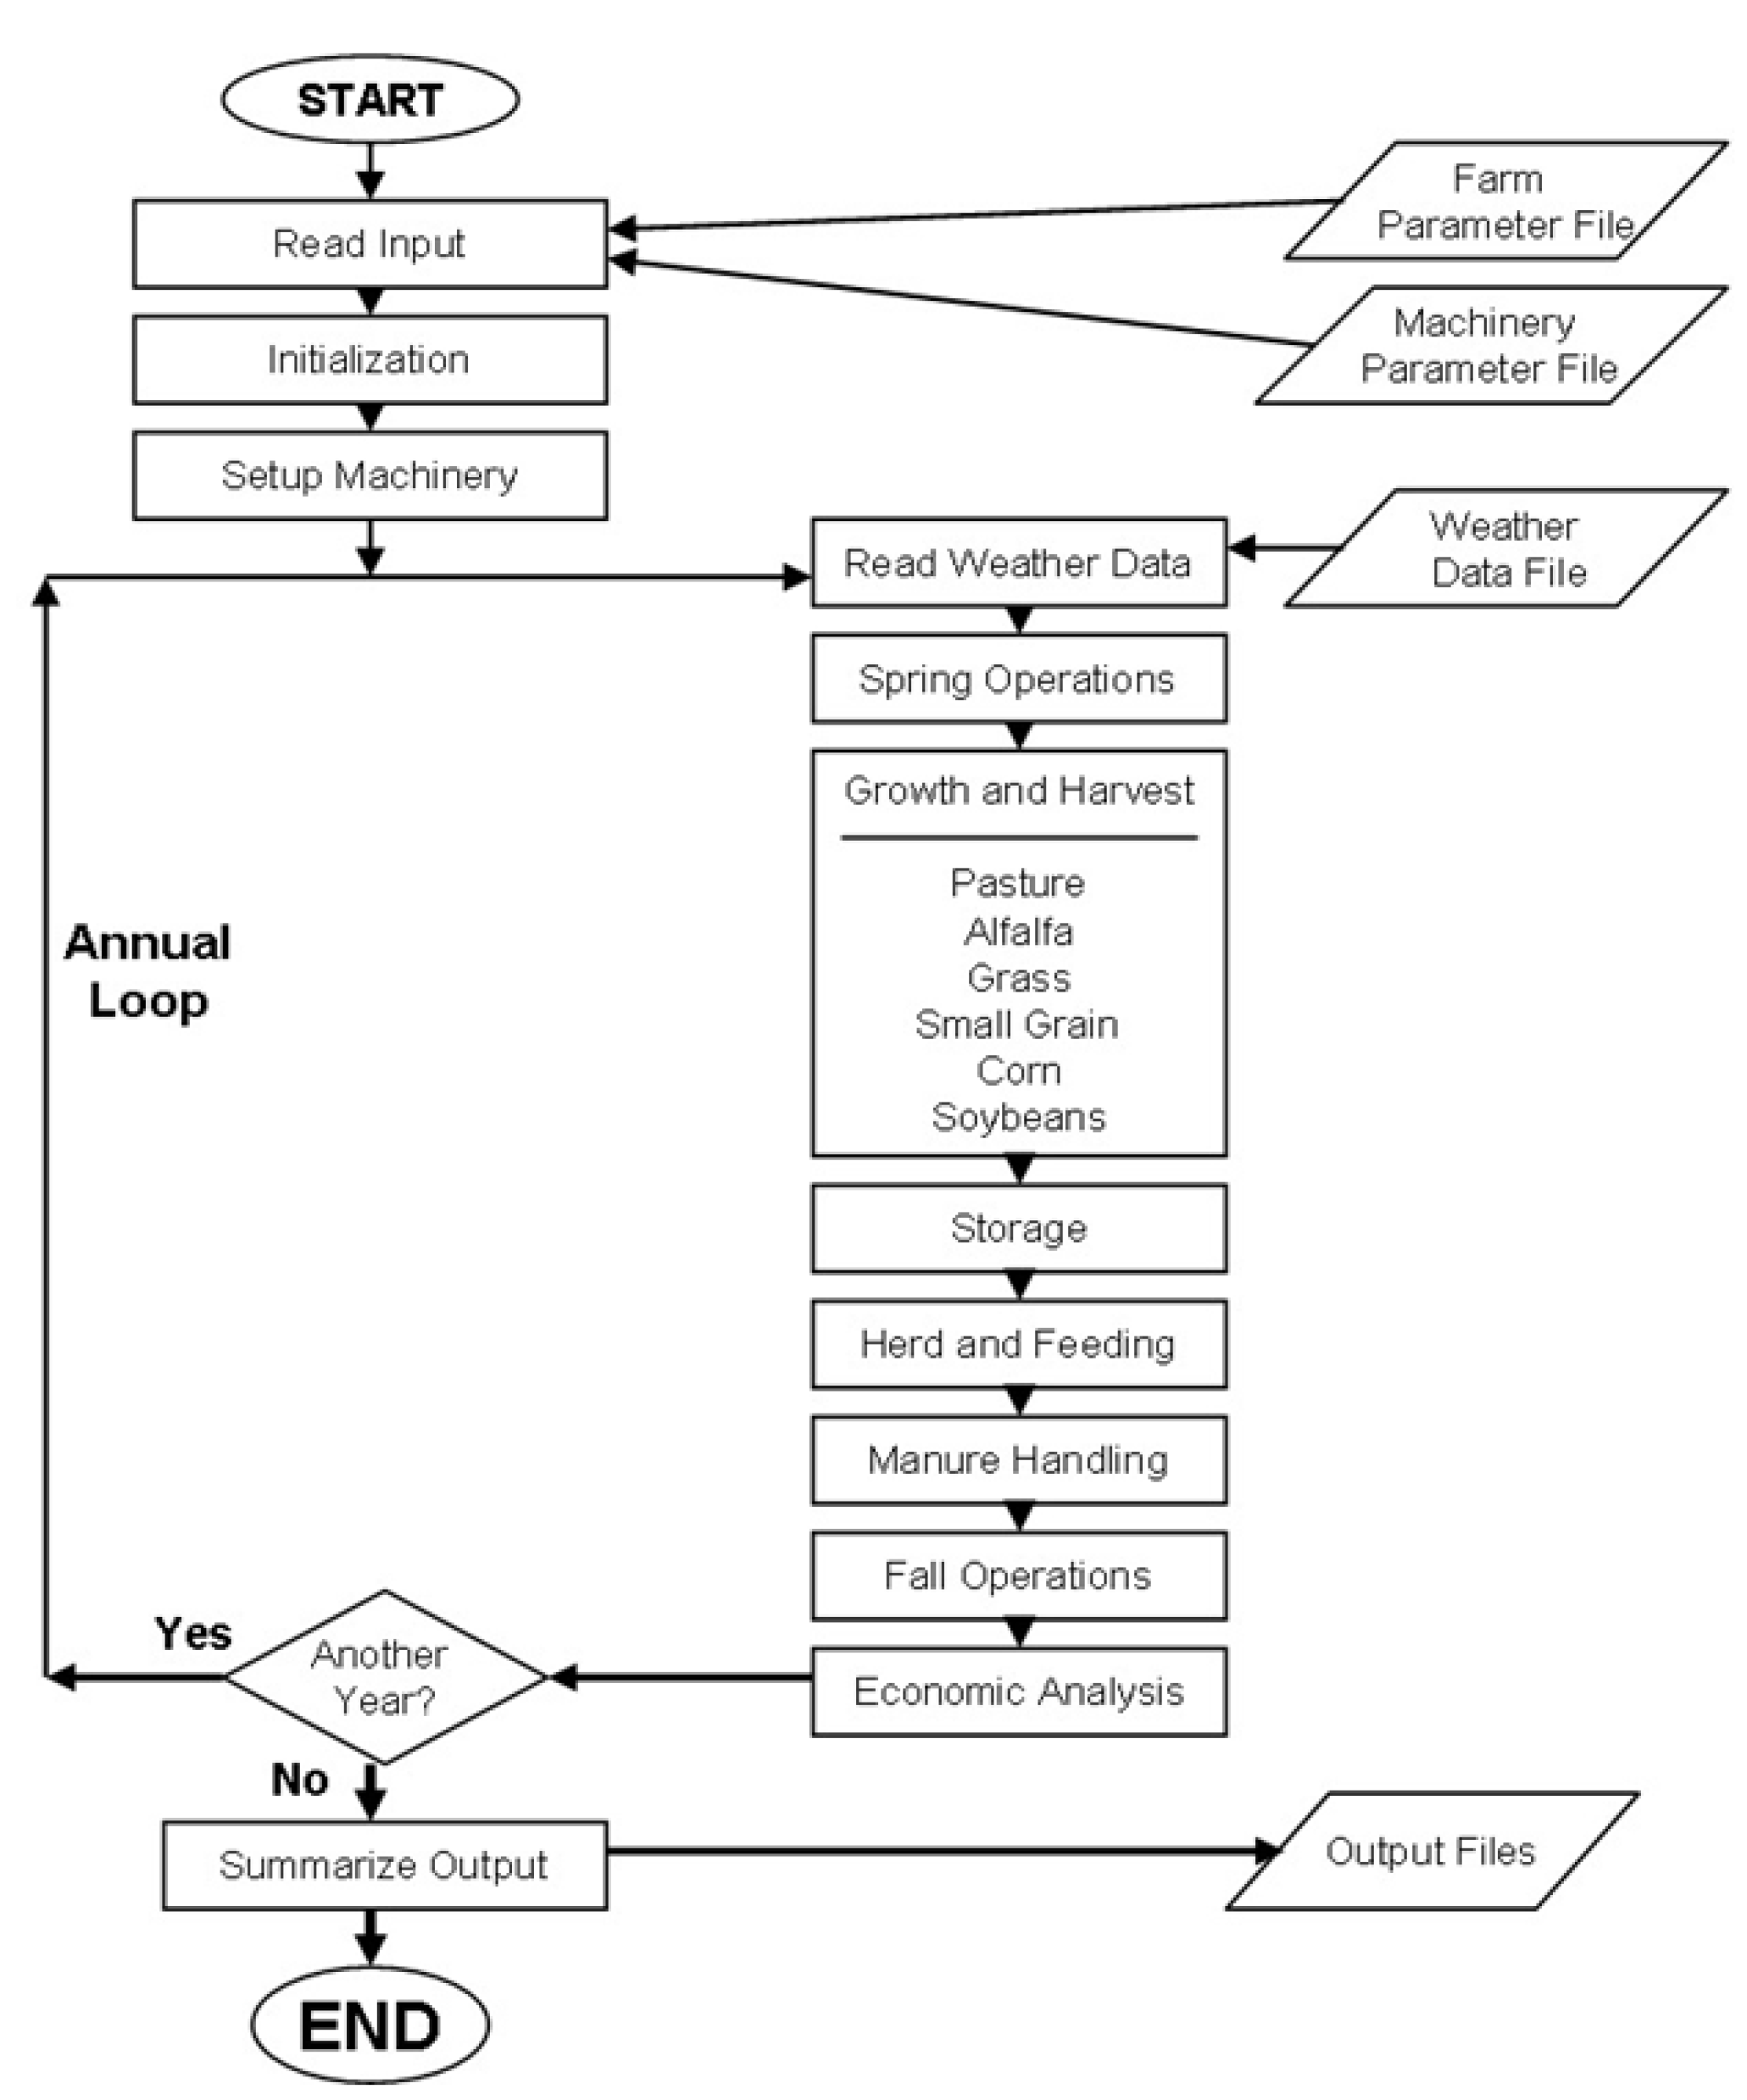
2.1.3. IFSM 4.7 Model Algorithm

Figure 3 illustrates the algorithm of the IFSM 4.7. The model starts by integrating farm and machinery file input data depending on farm type and the size of the operation. Next, weather input data are incorporated based on farm location. From there, farm-specific inputs are entered regarding production levels and management practices. Once all input data for a given year have been entered, additional operating years may be entered. If no other data are needed, the model simulates farm results and summarizes data based on the information entered into the model.

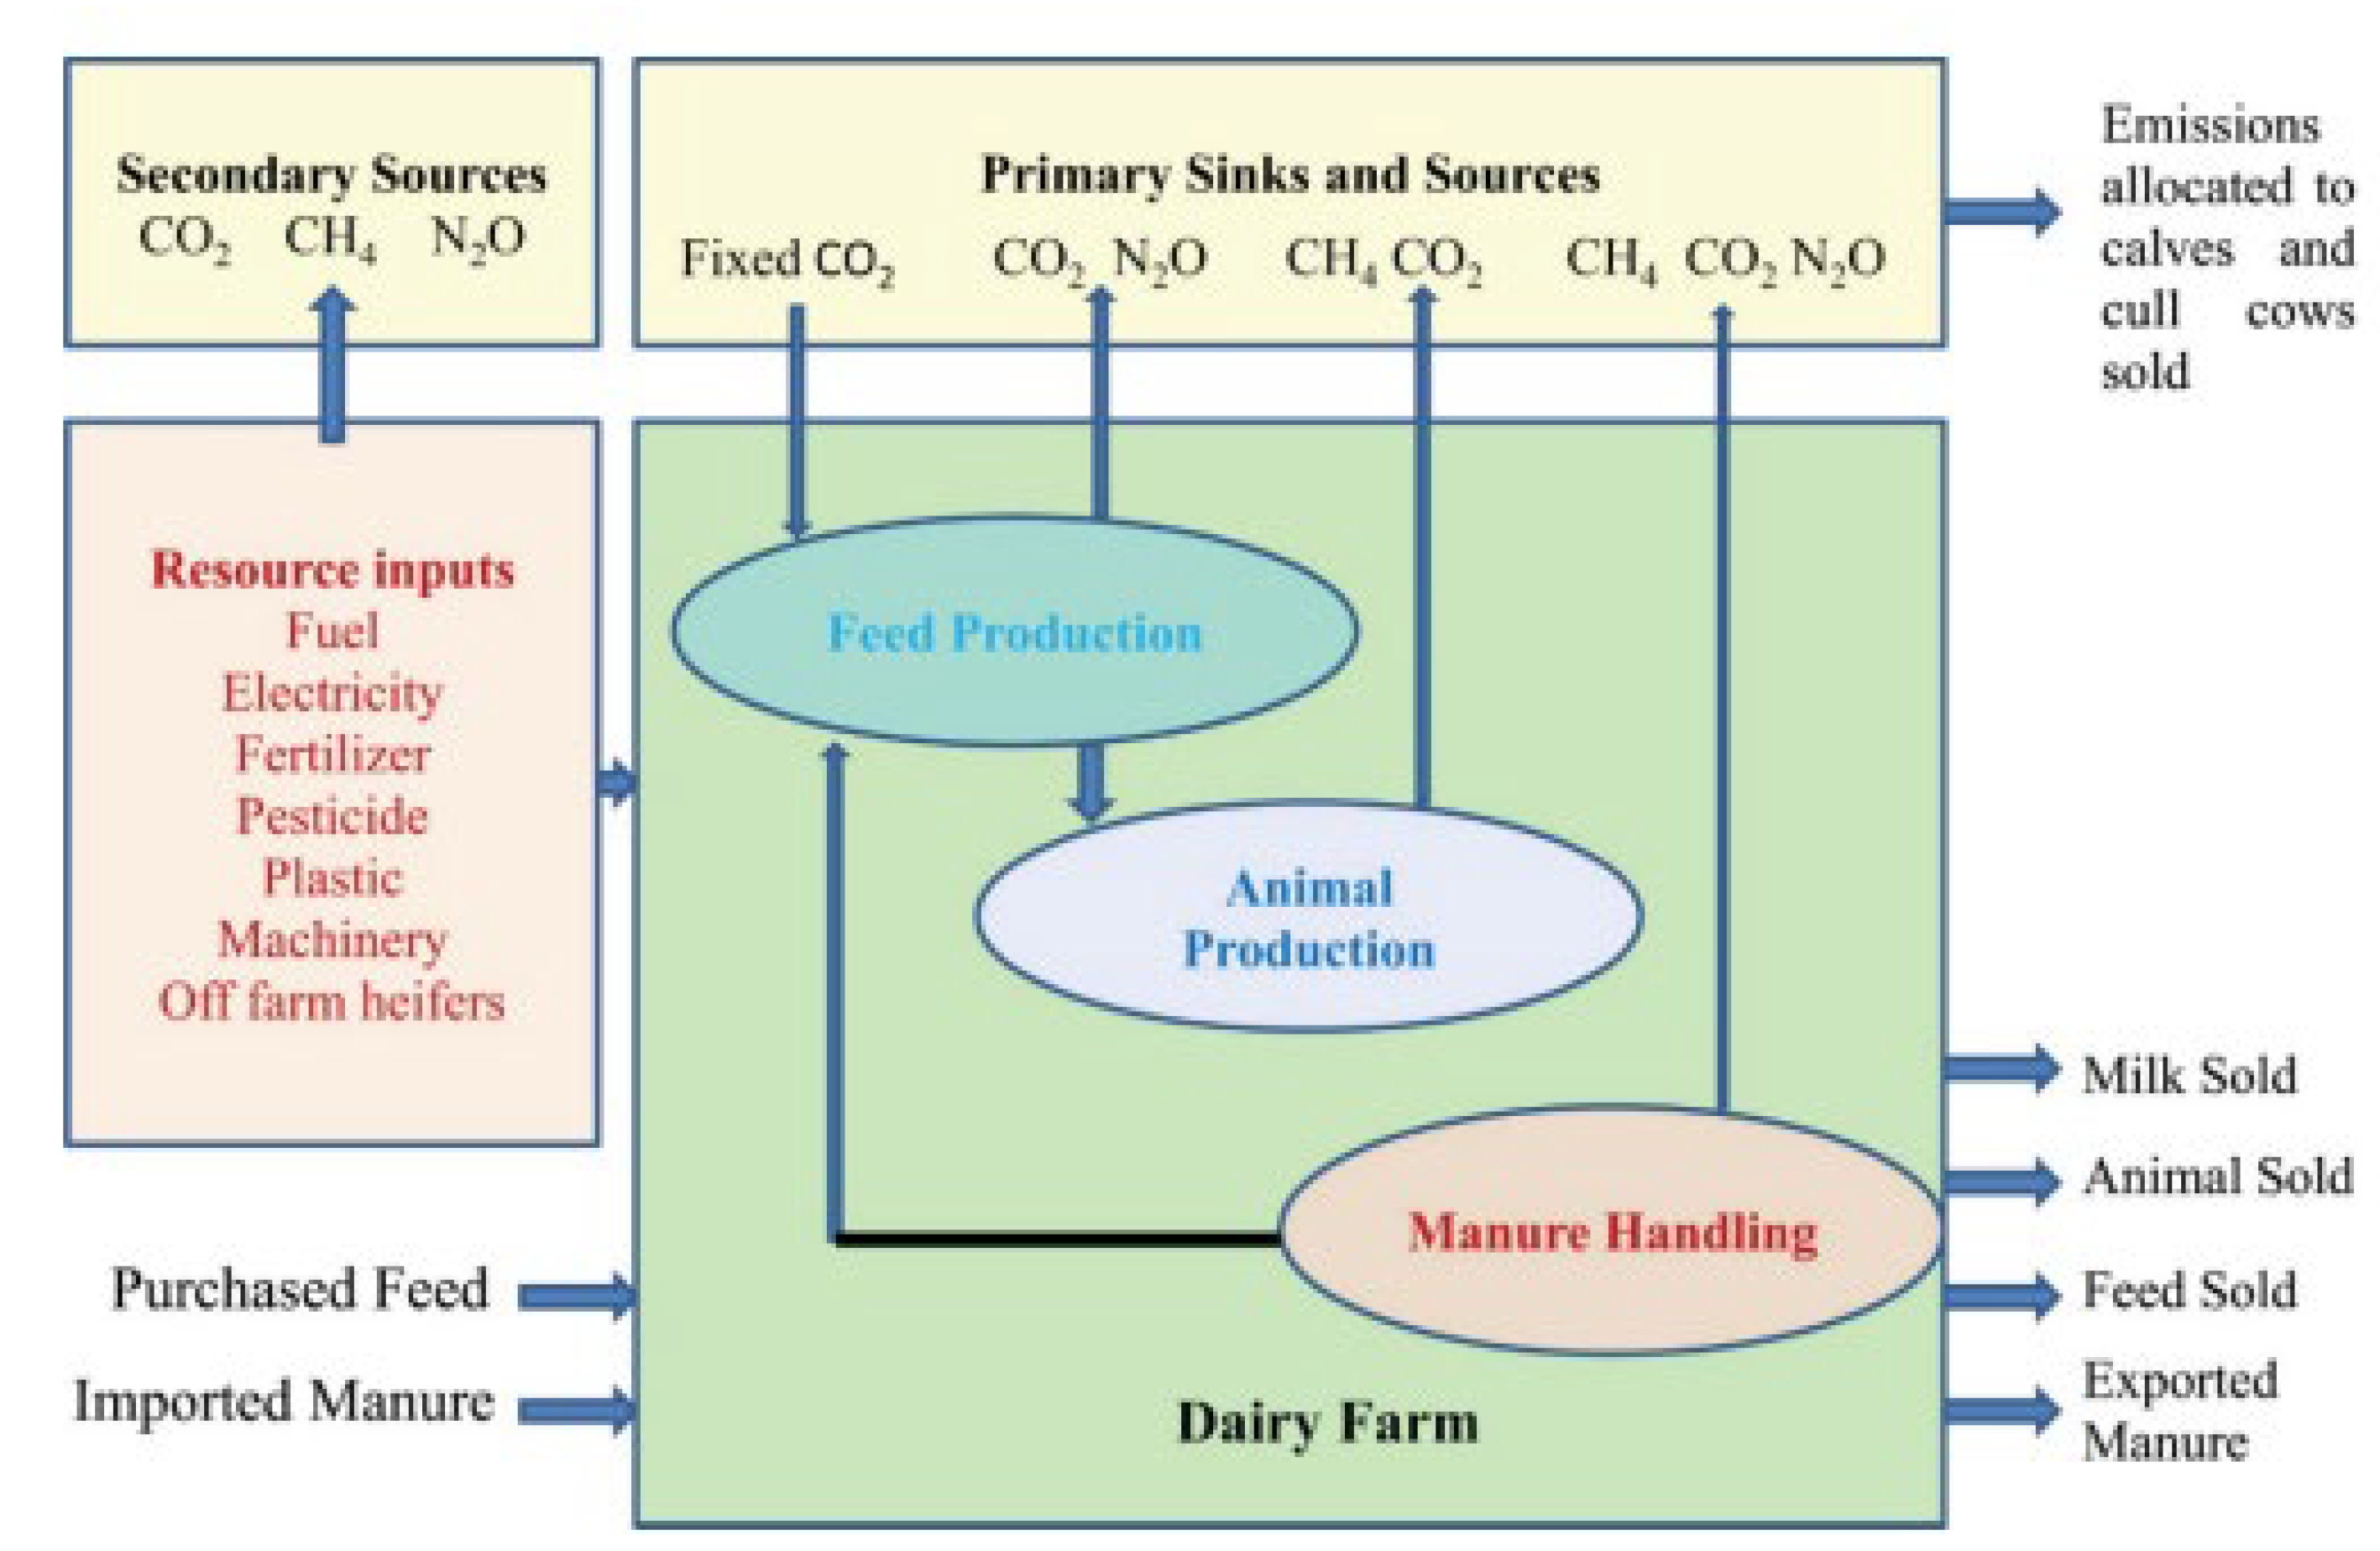
2.1.4. IFSM 4.7 Carbon Footprint

In addition to the model outputs presented in the model output subsection, the IFSM assesses the environmental footprints of water use, reactive N loss, energy use, and carbon emissions. Several other environmental impacts are also simulated. However, this study will focus on analyzing the carbon emissions, or “carbon footprint”. The carbon footprint comprises the total GHG emissions expressed in CO2-eq. To measure CO2-eq the values for CH4 and N2O are based on their 100-year global warming potential (GWP) [6]. The 100-year GWP values used for CH4 and N2O are 25 and 298 CO2-eq/kg, respectively [36].
According to the IFSM 4.7, the carbon footprint is the result of dividing the total amount of greenhouse gases produced by the net amount of greenhouse gases assimilated and emitted during production. For dairy operations, the product is fat- and protein-corrected milk. Net emissions are determined through a partial LCA of the production system. A partial LCA is an LCA that focuses on the GHG emissions of a product up to the farm gate, whereas a whole-system LCA focuses on the GHG emissions of a product from the farm level or gate to the consumer [37]. GHG emissions other than CO2 are converted into their respective CO2-eq units. Net emissions are calculated by summing the emissions of CO2, CH4, and N2O from primary and secondary sources, then subtracting the net CO2 assimilated in feed production. Emissions from primary sources are those emitted from the farm or production system during the production process. Secondary emissions include those that occur during the manufacture or production of resources used in the production system (machinery, fuel, fertilizer, etc.). Figure 4 is a representation of the sources and allocation of GHG emissions from a dairy farm operation.

2.2. Data

2.2.1. Dairy Farm Input Parameters

The Central Texas dairy operation consists of Holstein dairy cows. Herd size is composed of 5000 milking cows or heads, 1150 dry cows or heifers older than one year, and 400 heifers younger than one year. Lactating cows are housed in a mechanically ventilated, free-stall confinement barn. Dry cows and heifers are housed in open lots. This assumption was made based on data collected from an anonymous dairy operation located in Central Texas.
Lactating cows are taken to the barn’s rotary parlor, where they are milked twice per day. The cows spend an average of 10 min milking per day. The operation’s total annual milk production is 131,424,000 lbs., which is about 72 lbs. per cow per day and an estimated 26,285 lbs. per cow per year. This assumption was made based on data collected from an anonymous dairy operation located in Central Texas.
A slurry lagoon is used to store manure for 6 months until it is used to spread slurry on cropland and fields. The average diameter and depth of the lagoon are 100 and 15 feet, respectively. This assumption was made based on data collected from an anonymous dairy operation located in Central Texas.
In a production year, the dairy farm harvests two cuts of corn silage and one cut of grass silage. The land allocation for crop production in terms of acreage for corn and grass silage is about 1200 acres for each crop. Each cut produces about 13 tons of corn and grass silage per acre. Additional feed was purchased to meet the dietary needs of the cattle. This assumption was made based on data collected from an anonymous dairy operation located in Central Texas. Table 1 expresses the input parameters discussed in this section (Section 2.2.1).

2.2.2. Weather and Machinery Data

The IFSM weather data file is specific to location and contains 25 years’ worth of daily historical data. The weather file (TX-ErathCounty) was selected as it contains historical weather data from 1988 to 2012. Daily data include total daily solar radiation, mean temperature (°C), maximum temperature (°C), minimum temperature (°C), total precipitation, and average wind speed. Summary monthly statistics of weather data for the study area are provided in Table 2. The machinery component is used to determine the performance and resource rates for all machinery components on the farm.
The machinery parameter file is selected based on farm type and size of equipment. It is composed of predetermined “default” values that are representative of the operation type and size. Machine draft parameters represent machine-specific parameters that are obtained from the American Society of Agricultural Engineers’ (ASAE) Machinery Management Standards [39]. Default values may be modified. For the purpose of this study, the machinery file (LargeFarm.mch) was selected, and no modifications were made. Relationships based upon operation type, size of equipment, and machinery parameters specified to describe each machine are used by the IFSM 4.7 to predict the performance and power requirements of each operation [36].

3. Results

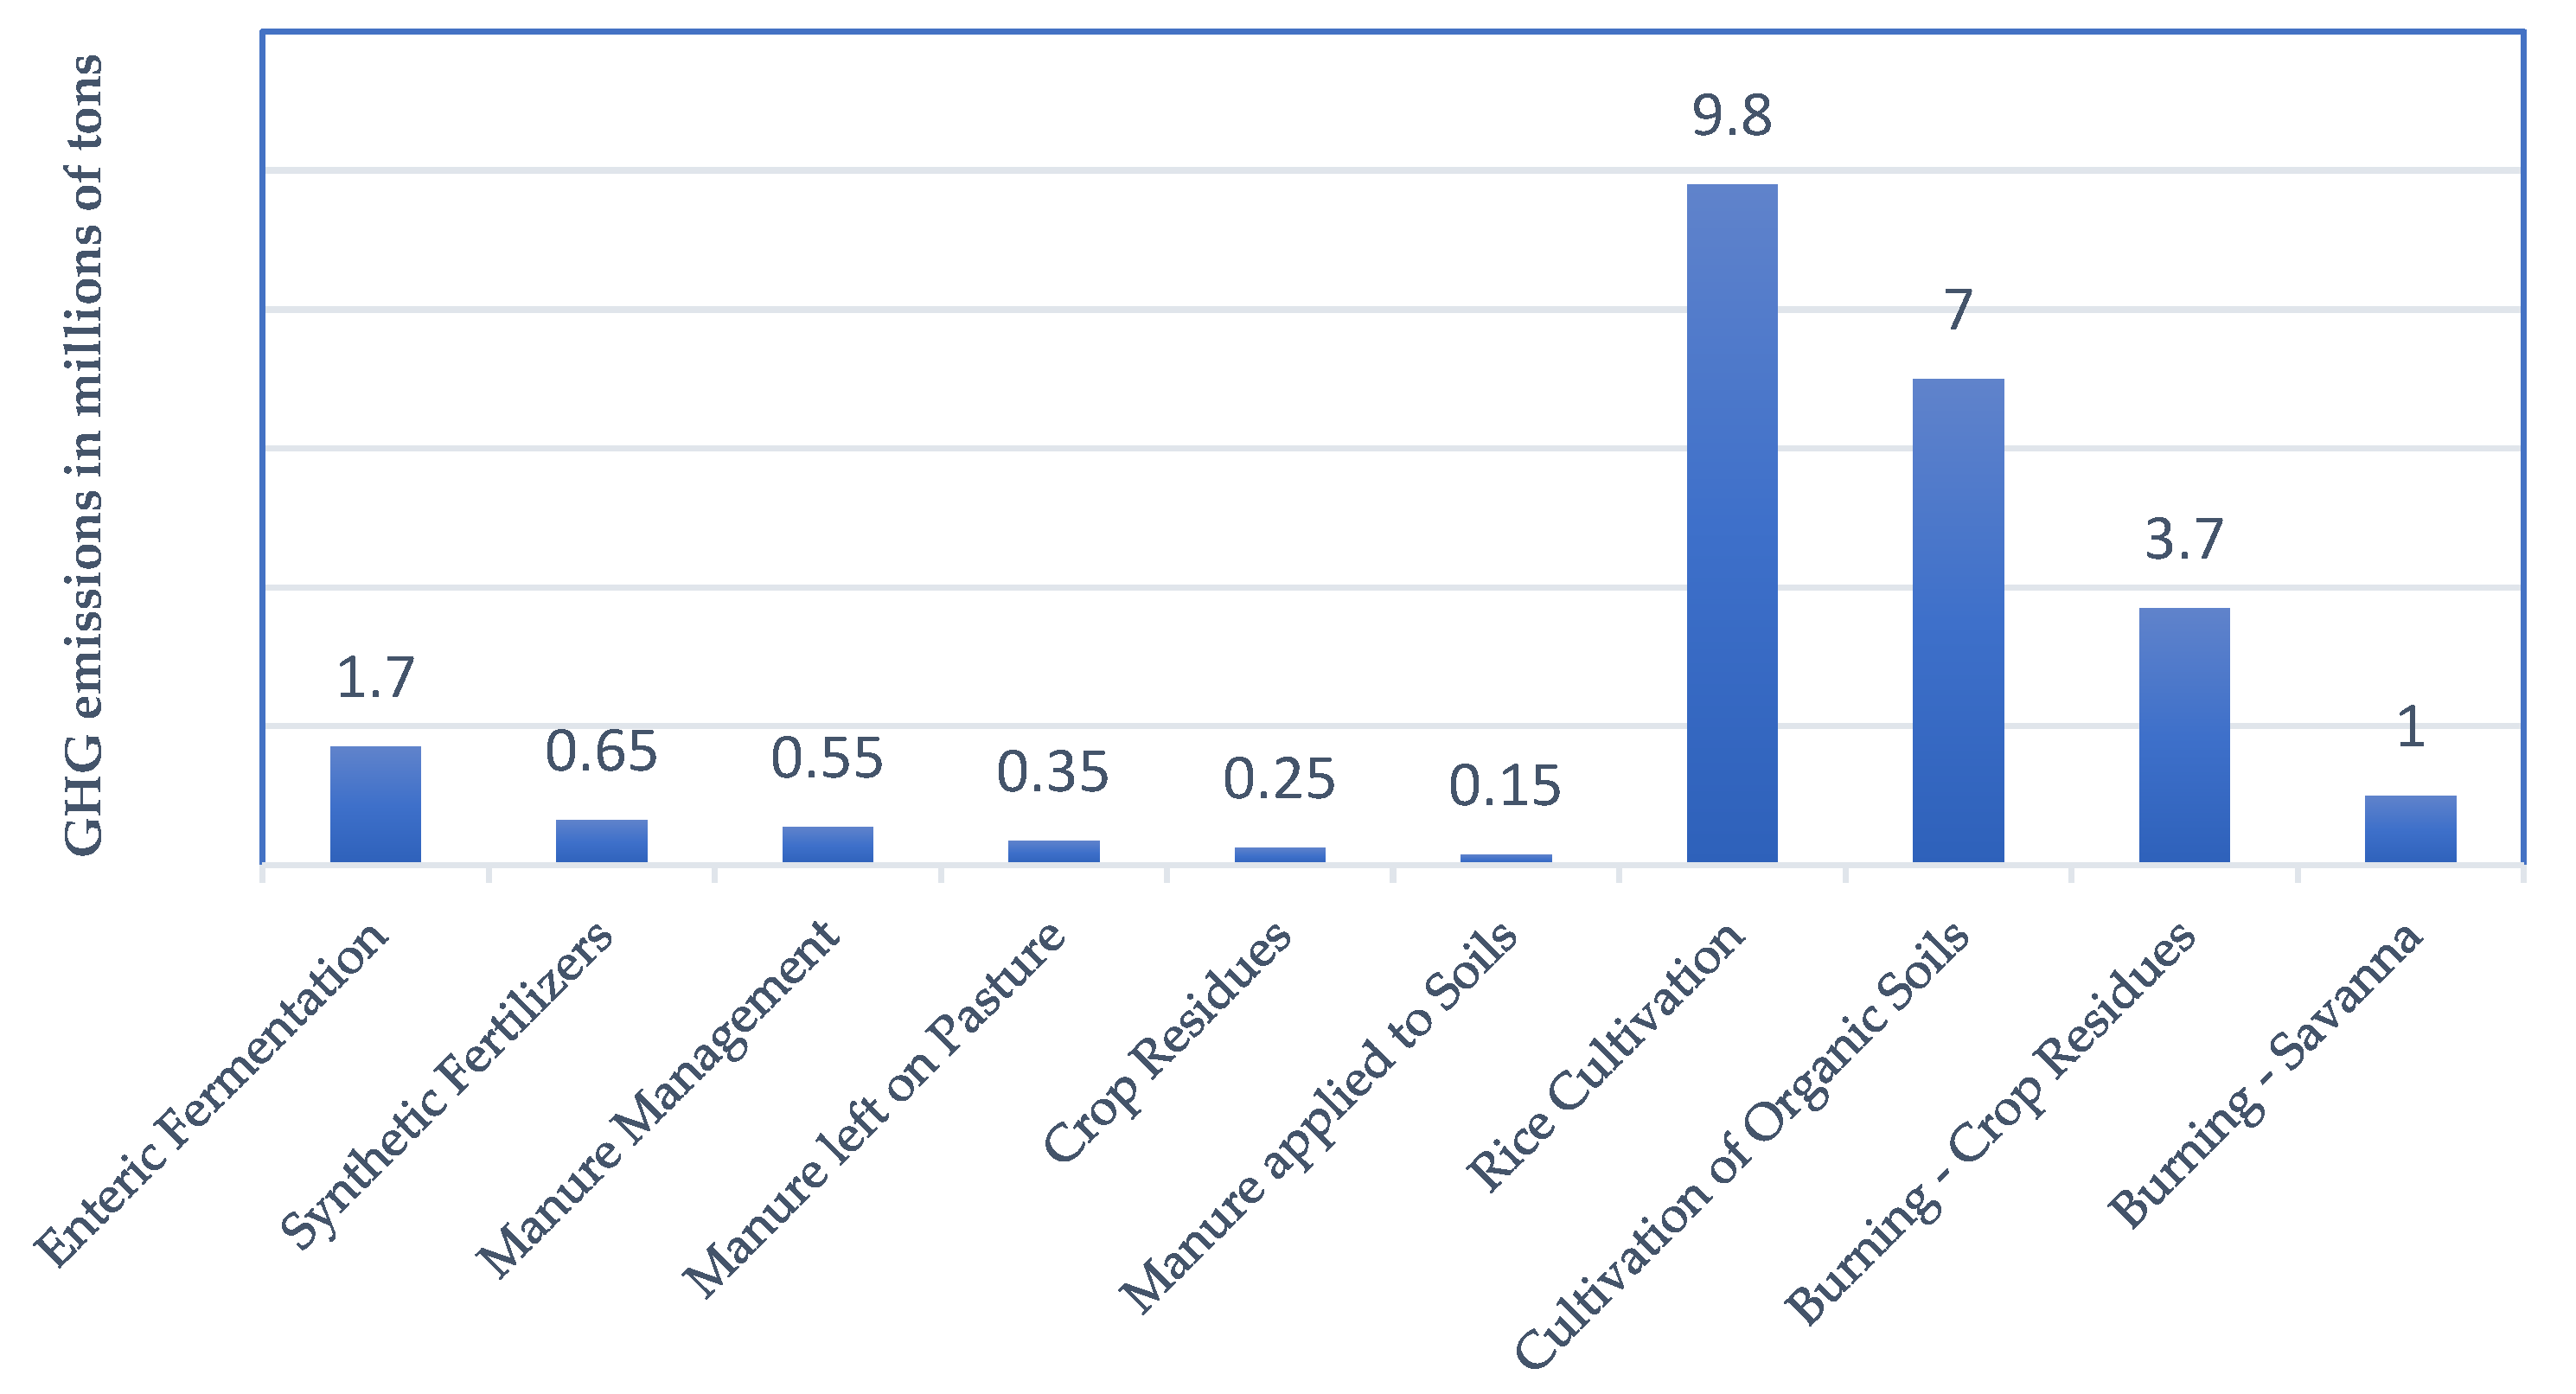
3.1. Annual GHG Emissions

As part of the environmental impact assessment performed by the IFSM 4.7, daily and yearly estimates of GHG emissions were calculated. Table 3 identifies and allocates the specific GHGs produced on the dairy farm as well as the total annual emissions based on farm activities. Both total pounds and pounds per animal are available for emission results.
Ammonia (NH3) is a GHG typically produced from animal manure. The sources of ammonia emissions for the dairy farm include animal housing, manure storage, and manure application to fields. The average daily NH3 emission from the housing facility is estimated to be 1369 lbs., or 0.274 lbs. per cow per day. Annually, that is equivalent to 499,699 lbs. of NH3, or 99.9 lbs. per cow per year. According to the model, manure storage is the greatest source of NH3 emissions for the operation, producing 522,334 lbs. of NH3 annually, which is about 104.5 lbs. per cow per year produced. The application of manure to fields emits less NH3 than the other sources; however, it continues to emit an estimated 84,411 lbs. annually. Taking into consideration the listed NH3 sources, the total annual NH3 emissions for the dairy farm are estimated to be 1,106,444 lbs., or 221.3 lbs. per cow per year.
Hydrogen sulfide (H2S) is another GHG produced from manure. Specifically, it is produced during the anaerobic decomposition of organic matter in manure. Sources of H2S emissions also include animal housing, manure storage, and the application of manure to fields. The housing facility is the largest source of H2S emissions, with an annual total of 3600 lbs. of H2S produced. The field application of manure is also a major source of H2S emissions, producing an estimated 2892 lbs. of H2S annually. According to the model, manure storage contributes the least to H2S emissions, with an annual total of 283 lbs. Based on the sources of H2S emissions, the farm produces 6775 total lbs. of H2S per year.
Ozone-forming volatile organic compound (VOC) emissions contribute to the formation of ground-level smog. Due to manure and silage being major sources of VOC emissions, emission estimates are provided for the following sources: silo faces, silage feeding, housing manure, manure storage, and field application. Silage-associated sources, silo face and silage feeding, emit the greatest amount of VOCs at an estimated total of 26,911 and 61,967 lbs. per year. Manure-associated sources, including housing manure, manure storage, and field application, contribute an estimated 4491, 2687, and 4953 lbs. of VOCs per year. Annually, the farm emits an estimated total of 101,009 lbs. of VOCs.
Methane (CH4) is a major contributor to GHG emissions. The digestive processes of livestock, manure production and storage, and the application of manure to fields all produce and emit CH4. The enteric CH4 produced during animal digestion emits an estimated annual total of 1,535,836 lbs. That is equal to 307.2 lbs. of CH4 per animal per year. Manure-associated sources of CH4 emissions include housing manure, manure storage, and field application. Manure storage is the second major source of CH4 emissions, with an estimated annual total of 602,181 lbs. produced. Other manure-associated sources, such as housing manure and field application, contribute an estimated total of 56,095 and 587 lbs. of CH4 annually. Considering the emissions of CH4 from each identified source, the dairy farm emits an estimated 2,194,699 lbs. of CH4 per year.
Nitrous oxide (N2O) is a powerful GHG with a GWP 298 times that of CO2 [17]. Sources of N2O emissions for the dairy farm operation estimated in the IFSM include livestock, housing manure, manure storage, farmland, and indirect sources. Livestock produce an estimated 0.4 lbs. of N2O per year per animal, totaling 1904 lbs. Manure-associated sources of N2O, such as housing manure and manure storage, produce an estimated 10,579 and 14,120 lbs. of N2O annually. Additionally, farmland is a source of N2O emissions, with an estimated annual total contribution of 2394 lbs. This emission is stimulated by the deposit of urine in the soil. Lastly, an estimated annual total of 15,243 lbs. of N2O comes from indirect sources. Indirect sources may include, but are not limited to, nitrification and denitrification processes in the soil used to produce feed crops and pasture [17]. The dairy farm’s estimated total annual N2O emissions are 44,240 lbs.
Biogenic CO2 can be defined as the natural cycle of carbon, also known as the recycling of carbon within the environment [17], which is the process of storing it in biomass and losing it in respiration. The biogenic carbon dioxide section represents and quantifies the activities of the partial life cycle that relate to the natural carbon cycle. The sources that represent the natural carbon cycle for the dairy include the housing facility, manure storage, net land, and feed. The results from the modeling indicate that the housing facility source emits an estimated total of 67,423,288 lbs. of CO2 annually. Manure storage, like the housing facility, is an emitter of CO2, with an estimated total annual emission of 661,682 lbs. However, this may not always be the case for a dairy operation, as results depend on manure storage and handling practices. Lastly, land and feed production are part of the natural carbon cycle that sinks CO2 as it is absorbed by crops and sequestered in soil through the process of photosynthesis. The results indicate land and feed production sink an estimated 122,380,680 lbs. of CO2 per year. Because of the impact land and feed production have on the biogenic CO2 emission section, the dairy operation absorbs or sequesters an estimated annual total of 54,295,724 lbs. of CO2.
The final result presented in Table 3 is the CO2 emission from anthropogenic sources. A living organism produces biogenic CO2, whereas human activity produces anthropogenic CO2 [17]. Examples of these sources include the combustion of fossil fuels or the application of lime to farmlands. Taking human impact into consideration, the estimated annual anthropogenic CO2 emissions for the dairy operation are 1,987,294 lbs. of CO2. This value is calculated based on the estimated amount of fuel used in the production system.

3.2. Carbon Footprint

According to the IFSM 4.7, the CF is the result of dividing the total amount of GHGs produced by the net amount of GHGs assimilated and emitted during production. N2O and CH4 emissions were converted into CO2-eq units according to their GWP indexes. The sum of CO2, N2O, and CH4 emissions was subtracted from the CO2 assimilated in feed production to give the net emissions of the production system. Emissions account for both primary and secondary sources. The primary sources are the GHG emissions produced or emitted from the dairy operation during the production process. Secondary sources are the emissions produced or emitted during the production of fuel, electricity, fertilizer, pesticides, and plastic used in feed production and animal maintenance. Table 4 presents the carbon footprint results estimated by the IFSM 4.7.
The CF is described by the measurement of CO2 and CO2-eq emissions in pounds for the following “big picture” sources: animals, manure, land, biogenic, anthropogenic, resource inputs, and products exported from the farm. The following information describes the contribution each source has to the CF of the dairy operation being studied. The average annual GHG emissions produced from animals and manure are estimated to be 43,508,036 and 24,993,304 lbs. of CO2-eq. The estimated average direct and indirect land emissions are 4,673,748 lbs. of CO2-eq. As previously discussed in Section 4.1, CO2 is either classified as biogenic (the natural cycle of CO2 through living organisms) or anthropogenic (produced from human activities). The net biogenic CO2 emission results indicate it to be a GHG sink sinking an estimated average of 54,295,740 lbs. of CO2-eq. However, due to the man-made nature of anthropogenic CO2, approximately 1,987,294 lbs. of CO2-eq are emitted. The GHG emission source production of resource inputs accounts for the inputs used during production, such as fuel, electricity, machinery, fertilizer, pesticides, seeds, and plastic. The production of resource inputs emits an estimated 34,022,084 lbs. of CO2-eq. Lastly, the GHG source “not allocated to milk production” is estimated to sink 8,695,361 lbs. of CO2-eq.
The overall CF calculation of the dairy is measured by pounds of CO2 per pound of fat- and protein-corrected milk (FPCM). Two CFs are calculated: one with biogenic CO2 and one without biogenic CO2. The CF without biogenic CO2 represents solely the GHG emissions produced or emitted by the farm during production. The CF with biogenic CO2 takes into consideration all possible sources and sinks of the natural carbon cycle and the dairy production system. Due to the dairy CF calculation being based on milk production, the GHG source identified as “not allocated to milk production” was not included in the CF calculation. The calculated CF of the Central Texas dairy operation without and with biogenic CO2 is 0.83 and 0.40 lbs. of CO2-eq per lb. of FPCM, respectively. The CF without biogenic CO2 falls in between two partial life-cycle studies performed by McGeough, Little, and Janzen [40] and Aguirre-Villegas, Passos-Fonseca, and Reinemann [40]. The studies determined the CFs to be 0.92 lb. CO2 per lb. of FPCM [40] and 0.63 to 0.77 lb. CO2 per lb. of FPCM [41].
To provide a whole-farm perspective, the per-unit CF data were used to compute total CO2 emissions for the entire farm. Using recorded milk production data, the whole-farm CO2 emissions without biogenic CO2 were computed simply as shown in Table 4.
T C w = N Y E w
where T C w are total CO2 emissions without biogenic CO2, N is the number of milking cows on the farm, Y is the milk yield in lbs/milking cow/year, and E w are the per unit CO2 emissions per lb. of FPCM without biogenic CO2. Similarly, total emissions for the case of biogenic CO2 are calculated using a similar Formula (2), as indicated below:
T C b = N Y E b
where T C b are total CO2 emissions with biogenic CO2, and E b are the per unit CO2 emissions per lb. of FPCM with biogenic CO2.
The number of milking cows has already been specified above as 5000. Production records indicate that annual milk production per cow is 26,285 lbs. of FPCM produced per cow per year. Thus, using the data presented in Table 4, the total CO2 equivalent emissions with and without biogenic CO2 are, respectively,
T C w = ( 5000   cows × 26,285   lbs .   of   FPCM / cow ) × 0.83   lb .   of   CO 2   per   lb .   of   FPCM = 109,082,750   l b s .   o f   C O 2
T C b = ( 5000   cows × 26,285   lbs .   of   FPCM / cow ) × 0.40 lb .   of   CO 2   per   lb .   of   FPCM = 52,570,000   l b s .   o f   C O 2
The dairy farm’s total CO2 emissions, “net CF”, without consideration of biogenic CO2, are 109,082,750 lbs. of CO2 per year. The total CO2 emissions, with consideration of biogenic CO2, are 52,570,000 lbs. of CO2 per year. This indicates that accounting for biogenic CO2 reduces the CF of the dairy operation by 48.15%.

3.3. Economic Results

As a result of the model, an economic analysis of the dairy farm was conducted. In order to forecast the farm’s potential net return or profit, the IFSM 4.7 performs an economic analysis of the whole farm budget. The model is simulated for each weather year, and the values are then averaged to determine the mean over all simulated years. The results of the analysis are displayed as the average annual production costs and return over 25 years. The results of the economic analysis are presented in Table 5.
To simulate the economic analysis, the IFSM 4.7 used a partial budget analysis to determine the cost of production for corn and grass silage, the total cost of feed production and use, and the cost of manure handling. Sources of these costs include equipment, facilities, energy, labor, seed and crop inputs, livestock, milk transportation and marketing, and property tax. Taking into consideration the listed production costs, the dairy farm has an annual total cost of USD 18,606,326.
The results of the economic analysis indicated that the annual income from milk and animal sales is USD 24,037,520 and USD 1,787,436, respectively. Indicating the dairy farms’ total income to be USD 25,824,956. The return, or profit, is found by subtracting the difference between total income and total cost. A net return is determined as the sum of all revenues minus the sum of all production costs, which represents the potential profitability of the farm. Therefore, the annual return to management, or potential profit, is estimated at USD 7,218,626. When interpreting the economic analysis results determined by the IFSM 4.7, it is important to remember that the values presented are assumed by the model and may not accurately represent the Central Texas dairy operation.

4. Conclusions and Recommendations

4.1. Conclusions

This paper analyzes the carbon footprint as well as the movement of GHGs throughout a production year for the dairy farm used to conduct this study. A partial life-cycle assessment was performed using the USDA Integrated Farm System Model (IFSM) 4.7 to determine the results and achieve this study’s objectives. Results indicated that the CF of the 5000-milking-head dairy in Central Texas was 0.40 lb. of CO2 per lb. of FPCM when considering biogenic CO2 and 0.83 lb. of CO2 per lb. of FPCM without biogenic CO2.
When analyzing the sources of GHG emissions, manure and animal emissions are the leading contributors to the dairy operation’s CF. These emissions contribute about 63% of the total CF. Results show that for the dairy farm being studied, manure and animal-related sources typically produce more GHGs than other farm sources. This conclusion is consistent with the literature that indicates manure and enteric emissions from animals accounted for about 69% of the Southwest region’s total CF. A reduction in these emissions would reduce the CF of both the dairy industry and the agricultural sector as a whole.

4.2. Recommendations

With the Net Zero Initiative in place, technology has been developed to benefit both the environment and producers. Technology such as the anerobic digestor eliminates GHG emissions from manure and, in return, can produce clean energy, renewable natural gas, animal bedding, etc. By adopting an anerobic digestor, producers can achieve net zero status. However, adopting such technology is time-consuming and costly and involves several legal aspects. These factors may prevent a producer from adopting technology because of the short-run implications that come with the high initial investment costs as well as the lengthy start-up process.
The government should establish a cooperative anerobic digester program. Dairy producers within a community would be able to utilize the manure waste service by transporting the waste to the facility. This would benefit dairy producers by alleviating the financial stress of adopting the costly technology, the surrounding community by providing clean energy or renewable natural gas opportunities, and the environment by reducing GHG emissions. With government assistance and financial support, dairy producers would be encouraged to adopt environmentally friendly technology and achieve net zero status.
Additional future research could determine the short- and long-run economic and environmental impacts of utilizing an anerobic digestor as a manure management mitigation strategy. By conducting this research with a focus on short-run issues, producers would be informed of the initial investment risk. A long-run analysis studying the economic return and environmental impact of an ADS would indicate the financial feasibility as well as the possibility for an operation to achieve net zero status.

4.3. Limitations of this Study

A limitation of this study is the fact that an in-depth analysis of Central Texas dairy farms was not performed. According to the Texas Association of Dairymen [18], the two Central Texas milk-producing counties, Comanche and Erath, consist of 51,061 cows and 58 dairies. However, no data were obtained that relate operations to herd size or farm management practices. Due to this limitation, this study is not considered to cover the whole region because of the uncertainty of similar dairy operations. To better represent the area, future research could perform a survey to collect representative data from dairy operations regarding herd size, production, and management practices. By analyzing the survey data, representative values may be assumed regarding the average herd size and management, feed and crop management, and manure management to determine the average CF of a Central Texas dairy operation.

Author Contributions

Conceptualization, S.W. and E.O.; methodology, S.W. and E.O.; software, S.W.; validation, S.W., E.O., M.Y., and S.G.; formal analysis, S.W., E.O., M.Y., and S.G.; investigation, S.W.; resources, S.W. and E.O.; data curation, S.W., E.O., M.Y., and S.G.; writing the original draft preparation, S.W.; writing, review, and editing, S.W., E.O., M.Y., S.G., A.L., and H.J.; visualization, S.W., E.O., M.Y., and S.G.; supervision, E.O., M.Y., S.G., A.L., and H.J.; project administration, E.O., M.Y., and S.G.; funding acquisition, E.O. All authors have read and agreed to the published version of the manuscript.

Funding

This research received no external funding.

Institutional Review Board Statement

Not applicable.

Data Availability Statement

The datasets used and analyzed during the current study are available from the corresponding author on reasonable request.

Acknowledgments

We appreciate the support from Department of Agricultural Education and Communication and College of Agricultural and Environmental Science, Tarleton State University. The authors also acknowledge research support from Ashlyn Ballard and Stefan Baimbill-Johnson. Any errors remain the sole responsibility of the authors.

Conflicts of Interest

The authors declare no conflict of interest.

References

  1. Vakilifard, N.; Williams, R.; Holden, P.; Turner, K.; Edwards, N.; Beerling, D. Impact of negative and positive CO2 emissions on global warming. Biogeosciences 2022, 19, 4249–4265. [Google Scholar] [CrossRef]
  2. Blunden, J.; Boyer, T. State of the Climate in 2021. Bull. Am. Meteorol. Soc. 2022, 103, S1–S465. [Google Scholar] [CrossRef]
  3. Verbič, M.; Satrovic, E.; Mujtaba, A. Assessing the Driving Factors of Carbon Dioxide and Total. Int. J. Environ. Res. 2022, 16, 105. [Google Scholar] [CrossRef]
  4. Johnson, J.; Franzluebbers, A.; Weyers, S.; Reicosky, D. Agricultural opportunities to mitigate greenhouse gas emissions. Environ. Pollut. 2007, 150, 107–124. [Google Scholar] [CrossRef] [PubMed]
  5. Koushki, R.; Sharma, S.; Warren, J.; Foltz, M. Life cycle greenhouse has emissions for irrigated corn production in the U.S. great plains. Environ. Chall. 2023, 13, 100750. [Google Scholar] [CrossRef]
  6. MakeWay. CO2 Equivalents. Climate Change Connection. 23 June 2020. Available online: https://climatechangeconnection.org/emissions/co2-equivalents/ (accessed on 3 October 2023).
  7. Lamb, W.; Weidmann, T.; Pongratz, J.; Andrew, R.; Crippa, M.; Olivier, J.; House, J. A review of trends and drivers of greehouse has emissions by sector from 1990 to 2018. Environ. Res. Lett. 2021, 16, 073005. [Google Scholar] [CrossRef]
  8. Ritchie, H.; Roser, M.; Rosado, P. CO2 and Greenhouse Gas Emissions. 2022. Available online: https://ourworldindata.org/co2-and-greenhouse-gas-emissions (accessed on 3 October 2023).
  9. USDA. Annual Dairy Review Texas and U.S. Inventory and Production. Texas Field Office, USDA-NASS. nass.usda.gov; 2022. Available online: https://www.nass.usda.gov/Statistics_by_State/Texas/Publications/Current_News_Release/2022_Rls/tx-dairy-review-2022.pdf (accessed on 3 October 2023).
  10. Food and Agriculture Organization of the United Nations (FAO). FAOSTAT Database. 2018. Available online: http://www.fao.org/faostat/en/#data/EL (accessed on 3 October 2023).
  11. Rotz, A.; Stout, R.; Leytem, A.; Feyereisen, G.; Waldrip, H.; Thoma, G.; Kleinman, P. Environmental assessment of United States dairy farms. J. Clean. Prod. 2021, 315, 128153. [Google Scholar] [CrossRef]
  12. EPA. Inventory of U.S. Greenhouse Gas Emissions and Sinks: 1990–2015; Environmental Protection Agency: Washington, DC, USA, 2017.
  13. Smith, P.; Bustamante, M.; Ahammad, H.; Clark, H.; Dong, H.; Elsiddig, E.; Tubiello, F. Agriculture, Forestry and Other Land Use (AFOLU). In Climate Change; Cambridge University Press: Cambridge, UK, 2014; pp. 811–922. [Google Scholar]
  14. Place, S.; McCabe, C.; Mitloehner, F. Symposium review: Defining a pathway to climate neutrality for US dairy cattle production. J. Dairy Sci. 2022, 105, 8558–8568. [Google Scholar] [CrossRef]
  15. Oliver, J.; Ray, L.; Workman, K. Best Management Practices for Dairy Producers to Reduce Their GHG Emissions from Manure; Progressive Dairy: Oakdale, CA, USA, 2023; pp. 1–3. [Google Scholar]
  16. Thoma, G.; Popp, J.; Nutter, D.; Shonnard, D.; Ulrich, R.; Matlock, M.; Adom, F. Greenhouse gas emissions from milk production and consumption in the United States: A cradle-to-grave life cycle assessment circa 2008. Int. Dairy J. 2013, 31, S3–S14. [Google Scholar] [CrossRef]
  17. Rotz, A. Symposium review: Modeling greenhouse gas emissions from dairy farms. J. Dairy Sci. 2018, 101, 6675–6690. [Google Scholar] [CrossRef]
  18. Dillion, J.; Stackhouse-Lawson, K.; Thoma, G.; Gunter, S.; Rotz, C.; Kebreab, E.; Mueller, N. Current state of enteric methane and the carbon footprint of beef and dairy cattle in the United States. Anim. Front. 2021, 11, 57–68. [Google Scholar] [CrossRef] [PubMed]
  19. Dairymen, T.A. Economics. 7 November 2022. Available online: https://www.milk4texas.org/issues/economics/ (accessed on 3 October 2023).
  20. Minton, L. The Thriving Texas Dairy Industry. July 2021. Available online: https://www.idfa.org/dairydelivers (accessed on 3 October 2023).
  21. IDFA. The Economic Impact of Dairy Products in the United States. International Dairy Foods Association. milk4texas.org. 7 November 2022. Available online: https://milk4texas.org/issues/economics/ (accessed on 3 October 2023).
  22. Son, M.; Richard, J.; Lambert, D.U.S. Dairy Farm Transition and Exits, 1987–2017. J. Agric. Appl. Econ. 2022, 54, 242–261. [Google Scholar] [CrossRef]
  23. Odom, D. Dairy Industry. Handbook of Texas. 9 March 2023. Available online: https://www.tshaonline.org/handbook/entries/dairy-industry (accessed on 3 October 2023).
  24. Ledbetter, K. High Plains Takes over as Leader in Texas Dairy Industry. Texas A&M AgriLife. 7 October 2011. Available online: https://agrilifetoday.tamu.edu/2011/10/07/high-plains-takes-over-as-leader-in-texas-dairy-industry/ (accessed on 3 October 2023).
  25. Guerrero, B.; Owens, R.; Amosson, S.; Sukcharoen, K.; Richeson, J.; Almas, L. Assessing Economic Changes Due to an Expanding Dairy Industry in the Texas High Plains. J. Am. Water Resour. Assoc. 2019, 55, 670–679. [Google Scholar] [CrossRef]
  26. Bechtel, W. High Plains Boom States. Dairy Herd Management. 7 January 2015. Available online: https://www.dairyherd.com/news/business/high-plains-boom-states (accessed on 3 October 2023).
  27. Schulte, K. Dairy Profit Projection Model for the High Plains Region. Ph.D. Thesis, Kansas State University, Manhattan, KS, USA, 2011. [Google Scholar]
  28. U.S. Department of Agriculture. Census of Agriculture. 1987–2017. Available online: https://www.nass.usda.gov/AgCensus/ (accessed on 2 October 2023).
  29. Rotz, C.; Thoma, G. Assessing Carbon Footprints of Dairy Production Systems, 3rd ed.; American Dairy Society Association: Champaign, IL, USA, 2017. [Google Scholar]
  30. Vida, E.; Tedesco, D. The carbon footprint of integrated milk production and renewable energy systems—A case study. Sci. Total Environ. 2017, 609, 1286–1294. [Google Scholar] [CrossRef] [PubMed]
  31. Uddin, M.; Aguirre-Villegas, H.; Larson, R.; Wattiaux, M. Carbon footprint of milk from Holstein and Jersey cows fed low or high forage diet with alfalfa silage or corn silage as the main forage source. J. Clean. Prod. 2021, 298, 126720. [Google Scholar] [CrossRef]
  32. Lauer, M.; Hansen, J.; Lamers, P.; Thrän, D. Making money from waste: The economic viability of producing biogas and biomethane in the Idaho dairy industry. Appl. Energy 2018, 222, 621–636. [Google Scholar] [CrossRef]
  33. Powell, J.; Russelle, M.; Martin, N. Trends in the dairy industry and their implications for producers and the environment. In Livestock in a Changing Landscape: Experiences and Regional Perspectives; Island Press: Washington, DC, USA, 2010; Volume 2, pp. 115–139. [Google Scholar]
  34. Aguirre-Villegas, H.; Larson, R. Evaluating greenhouse gas emissions from dairy manure management practices using survey data and lifecycle tools. J. Clean. Prod. 2017, 143, 169–179. [Google Scholar] [CrossRef]
  35. O’Connor, S.; Ehimen, E.; Pillai, S.; Lyons, G.; Bartlett, J. Economic and environmental analysis of small-scale anaerobic digestion plants on Irish dairy farms. Energies 2020, 13, 637. [Google Scholar] [CrossRef]
  36. Rotz, A.; Corson, M.; Chianese, D.; Montes, F.; Hafner, S.; Bonifacio, H.; Coiner, C. The Integrated Farm Systen Model Refernce Manual 4.7. Pasture Systems and Watershed Management Research Unit. 28 February 2022. Available online: https://www.ars.usda.gov/ARSUserFiles/80700500/Reference%20Manual.pdf (accessed on 3 October 2023).
  37. Alvarez-Hess, P.; Little, S.; Moate, P.; Jacobs, J.; Beauchemin, K.; Eckard, R. A partial life cycle assessment of the greenhouse gas mitigation potential of feeding 3-nitrooxypropanol and nitrate to cattle. Agric. Syst. 2019, 169, 14–23. [Google Scholar] [CrossRef]
  38. Sejian, V.; Prasadh, R.; Lees, A.M.; Lees, J.C.; Al-Hosni, Y.; Sullivan, M.L.; Gaughan, J.B. Assessment of the carbon footprint of four commercial dairy production systems in Australia suing an integrated farm system model. Carbon Manag. 2018, 9, 57–70. [Google Scholar] [CrossRef]
  39. ASAE. Agricultural Machinery Management Standards, 47th ed.; ASAE: St. Joseph, MI, USA, 2000. [Google Scholar]
  40. McGeough, E.; Little, S.; Janzen, H.; McAllister, T.; McGinn, S.; Beauchemin, K. Life-cycle assessment of greenhouse gas emissions from dairy production in eastern Canada: A case study. J. Dairy Sci. 2012, 95, 5164–5175. [Google Scholar] [CrossRef] [PubMed]
  41. Aguirre-Villegas, H.; Passos-Fonseca, T.; Reinemann, D.; Armentano, L.; Wattiaux, M.; Cabrera, V.; Larson, R. Green cheese: Partial life cycle assessment of greenhouse gas emissions and energy intensity of integrated dairy production and bioenergy systems. J. Dairy Sci. 2015, 98, 1571–1592. [Google Scholar] [CrossRef] [PubMed]
Figure 1. United States GHG emissions in 2019 by sector measured in CO2-eq (source: Our World in Data).
Agriculture 13 02109 g001
Figure 2. United States agriculture sector GHG emissions in 2019 measured in CO2-eq (source: Climate Watch).
Agriculture 13 02109 g002
Figure 3. IFSM 4.7 modeling system algorithm illustration (source: the IFSM reference manual).
Agriculture 13 02109 g003
Figure 4. Sources and allocation of dairy farm GHG emissions [38].
Agriculture 13 02109 g004
Table 1. Data input parameters representing the Central Texas dairy operation.
Data Input ParameterValueUnits
Herd/facility parameters
Animal typeHolstein
 Number of lactating animals5000
 Number of young stock (over 1 year)1150
 Number of young stock (under 1 year)400
Milk production
 Target milk production per cow26,285lb/cow/year
 Target milk production—TOTAL131,524,000lb/year
Animal facilities
 Milking centerDouble twenty-four parlor
 Cow housingFree stall barn, mechanically ventilated
  Heifer housingCalf hutches
  Dry cows/older heifersOpen lot
  Feed facilityCommodity shed
  Labor for milking and animal handling10minutes/cow/day
Feeding
 GrainLoader and mixer wagon
 SilageLoader and mixer wagon
 HayTub grinder
Ration constituents
 Minimum dry hay in rations50% of forage
 Relative forage to grain ratioLow
 Crude protein supplementCotton seed meal
 Undegradable protein supplementDistillers grain
 Phosphorus feeding level in rations
  Early lactation0.39%
  Mid lactation0.42%
  Late lactation0.42%
  Dry cow0.30%
  Young heifer0.42%
  Older heifer0.38%
 Protein feeding level in rations
  Early lactation16.60%
  Mid lactation17.20%
  Late lactation17.20%
  Dry cow15%
  Young heifer14.20%
  Older heifer13.20%
Table 2. Monthly statistics of weather parameters at the study location.
StatisticJanFebMarAprMayJunJulAugSepOctNovDec
Average monthly maximum air temp (°C)14.7416.1820.7125.3628.8132.5934.9535.3131.4526.2620.1514.95
Average monthly min air temp (°C)0.332.426.810.9616.0420.1321.5221.3517.5211.696.150.90
Monthly average standard deviation of daily max temp (°C)6.587.245.844.563.602.432.112.533.64.525.656.46
Monthly average standard deviation of daily min temp (°C)4.394.824.904.363.552.021.321.583.614.575.214.88
Average monthly precipitation (mm) 43.453.467.960.6114.9104.451.661.467.88053.841.8
Monthly standard deviation of daily precipitation (mm)4.514.935.665.428.308.494.845.346.077.024.623.58
Monthly skew coefficient for daily precipitation3.63.33.13.12.83.13.63.23.13.33.33.3
Monthly probability of wet day after dry day0.0890.1090.130.130.1290.1140.0960.1060.1050.1030.0850.099
Monthly probability of wet day after wet day0.0980.1080.1220.1090.1820.1590.1080.1190.1230.1370.1250.108
Average number days of rain per month (days)6.06.78.17.310.08.66.67.27.27.46.66.6
Table 3. Annual greenhouse gas emission results determined by the IFSM.
Total Annual GHG Allocation and Emissions
lb/Cowlb
Ammonia
 Housing facility99.9499,699
 Manure storage104.5522,334
 Field application 16.984,411
  Total farm221.31,106,444
Hydrogen sulfide
 Housing facility0.73600
 Manure storage0.1283
 Field application 0.62892
  Total farm1.46775
Ozone forming VOC
 Silo face5.426,911
 Silage feeding12.461,967
 Housing manure0.94491
 Manure storage0.52687
 Field application14953
  Total farm20.2101,009
Methane
 Animal307.21,535,836
 Housing manure11.256,095
 Manure storage120.4602,181
 Field application 0.1587
  Total farm438.92,194,699
Nitrous oxide
 Animal0.41904
 Housing manure2.110,579
 Manure storage2.814,120
 Farmland0.52394
 Indirect sources315,243
  Total farm8.844,240
Biogenic CO2
 Housing facility13,484.7067,423,288
 Manure storage132.3661,682
 Net land and feed−24,476.10−122,380,680
  Total farm−10,859.10−54,295,724
Anthropogenic CO2397.501,987,294
Table 4. Carbon footprint results determined by the IFSM 4.7.
Greenhouse Gas Emissions (CO2-eq)
UnitMean
Animal emissionslb43,508,036
Manure emissionslb24,993,304
Direct and indirect land emissionslb4,673,748
Net biogenic CO2 emissionslb−54,295,740
Anthropogenic CO2 emissionslb1,987,294
Production of resource inputslb34,022,084
Not allocated to milk productionlb−8,695,361
Carbon footprint without biogenic CO2lb/lb FPCM0.83
Carbon footprint with biogenic CO2lb/lb FPCM0.40
Carbon footprint without biogenic CO2lb/131,524,000 FPCM43,508,036
Carbon footprint with biogenic CO2lb/131,524,000 FPCM24,993,304
Table 5. Simulated average annual economic output from the IFSM 4.7.
Annual Production Costs and Return to Management for a 25-Year Analysis
UnitMeanStandard Deviation
Equipment costUSD 1,199,41243,405
Facilities costUSD 1,067,8561843
Energy costUSD 717,0945282
Labor costUSD 3,826,5045073
Seed, fertilizer, and chemical costUSD 342,622-
Net purchased feed and bedding costUSD 7,599,146142,711
Animal purchase and livestock expenseUSD 2,433,500-
Milk hauling and marketing feesUSD 1,313,4463506
Property taxUSD 106,746-
Total CostUSD 18,606,326
Income from milk salesUSD 24,037,52064,162
Income from animal salesUSD 1,787,436-
Return to management and unpaid factorsUSD 7,218,630157,819
Disclaimer/Publisher’s Note: The statements, opinions and data contained in all publications are solely those of the individual author(s) and contributor(s) and not of MDPI and/or the editor(s). MDPI and/or the editor(s) disclaim responsibility for any injury to people or property resulting from any ideas, methods, instructions or products referred to in the content.

