Abstract
The number of wheat ears per unit area is crucial for assessing wheat yield, but automated wheat ear counting still faces significant challenges due to factors like lighting, orientation, and density variations. Departing from most static image analysis methodologies, this study introduces Wheat-FasterYOLO, an efficient real-time model designed to detect, track, and count wheat ears in video sequences. This model uses FasterNet as its foundational feature extraction network, significantly reducing the model’s parameter count and improving the model’s inference speed. We also incorporate deformable convolutions and dynamic sparse attention into the feature extraction network to enhance its ability to capture wheat ear features while reducing the effects of intricate environmental conditions. To address information loss during up-sampling and strengthen the model’s capacity to extract wheat ear features across varying feature map scales, we integrate a path aggregation network (PAN) with the content-aware reassembly of features (CARAFE) up-sampling operator. Furthermore, the incorporation of the Kalman filter-based target-tracking algorithm, Observation-centric SORT (OC-SORT), enables real-time tracking and counting of wheat ears within expansive field settings. Experimental results demonstrate that Wheat-FasterYOLO achieves a mean average precision (mAP) score of 94.01% with a small memory usage of 2.87MB, surpassing popular detectors such as YOLOX and YOLOv7-Tiny. With the integration of OC-SORT, the composite higher order tracking accuracy (HOTA) and counting accuracy reached 60.52% and 91.88%, respectively, while maintaining a frame rate of 92 frames per second (FPS). This technology has promising applications in wheat ear counting tasks.
1. Introduction
Wheat is one of the world’s primary staple crops, playing a crucial role in meeting global food demands. Its production and quality control are critical factors in ensuring global food security [1], with the wheat ear as the reproductive organ of the wheat plant, directly influencing both the yield and quality of wheat [2]. Research indicates that the number of ears per unit area is the dominant yield component, and negative correlations were obtained between most of the parameters affecting the yield per plant and the yield per unit area [3]. Plant breeding experts utilize the information on wheat ear quantities from different varieties, combining these data with genetic and environmental factors. Through hybridization experiments involving a large number of wheat varieties, they select strains suited to various growing conditions, developing more resistant and higher-yielding varieties [4]. Effective detection and counting of wheat ears are essential for wheat yield prediction and ensuring food security [5]. Therefore, building a fast and efficient automatic counting method for wheat ears is of great significance, and wheat ear detection technology enables precise assessment of wheat ear quantities in fields, providing vital support for agricultural production, field management, and food trade [6].
Due to the high planting density of wheat, accurate counting of wheat ears is a challenging task. In the past, wheat yield estimation relied primarily on labor-intensive manual counting [7,8] and expert visual estimation [9]. The former approach is not only time-consuming and inefficient but also struggles to acquire accurate data in large-scale farmland settings. The latter method is subjective, demanding a high level of expertise in agriculture and resulting in difficulties in scientifically and accurately estimating the correct yield. As a result, the aforementioned methods are unable to rapidly and precisely estimate the wheat yield in large-scale wheat fields.
With the advancement of computer vision technology, image processing techniques have been widely applied in agricultural production. Fernandez-Gallego et al. proposed a method for automatic wheat ear counting using RGB drone images. This method utilizes techniques such as frequency filtering, segmentation, and feature extraction to achieve efficient and accurate wheat ear counting [10]. Tan et al. introduced a rapid identification method for field wheat ears based on superpixel segmentation algorithms and digital images. This approach involves image classification based on color feature parameters and analysis of wheat ear morphology, demonstrating both speed and accuracy [11]. Bao et al. presented a wheat ear counting method based on frequency domain decomposition. They employed multiscale support value filtering (MSVF) in combination with improved sampling contour transformation (ISCT) for frequency domain decomposition of wheat ear images. At last, the wheat ear images are segmented and counted [12]. Fang et al. proposed an automatic wheat tiller counting algorithm based on ground LiDAR data. This algorithm utilizes adaptive hierarchical and hierarchical clustering algorithms to comprehensively leverage 3D crop information in field environments, successfully counting wheat tillers of different varieties, nitrogen levels, planting densities, and ecological conditions [13].
In recent years, an increasing number of researchers have begun using deep learning techniques to use in agriculture. Compared to traditional image processing methods, deep learning offers higher adaptability, accuracy, generalization, and scalability, thus demonstrating better performance in processing large-scale image datasets and handling complex image tasks. Pérez-Porras et al. proposed a method for early on-ground image-based detection of poppies (Papaver rhoeas) in wheat using the YOLO architecture. Their research findings demonstrate that the deep-learning-based object detection strategy can accurately identify poppies at an early stage, providing precise information for the development of accurate wheat weed management [14]. Yang et al. proposed a deep-learning-based cross-platform model for wheat ear counting. This model combines a collaborative attention mechanism, achieving high-density counting of wheat ears while maintaining high counting accuracy and a reduced number of model parameters [15]. Zaji et al. introduced automatic object level augmentation (AutoOLA), which decouples different objects in wheat images and generates augmented images through random combinations, significantly reducing the required training sample size for the wheat ear model [16]. Alkhudaydi et al. introduced SpikeCount, a density-based method for wheat ear counting. This approach automatically extracts useful features from images using a fully convolutional neural network and utilizes transfer learning to optimize model training [17]. Qiu et al. proposed an unsupervised learning method that automatically detects and labels wheat ears from wheat ear images. They established a dataset to train a deep convolutional neural network model for accurate detection and counting of wheat ears [18].
The Internet and computer technology are finding broader applications in agriculture [19]. Modern agriculture is increasingly demanding efficient and precise intelligent solutions. Despite the considerable research efforts focused on wheat ear counting [20], challenges persist due to variations in wheat plants across growth stages and environmental conditions, as well as the diversity of wheat ears in images. Achieving accurate and efficient wheat ear counting remains a complex task. Furthermore, previous studies on wheat ear counting, whether based on image processing or deep learning methods, predominantly employed static counting approaches. This involves counting wheat ears in acquired images and then summing up the counts from each image to obtain the total count. However, this approach lacks real-time capability and involves time-consuming and intricate data preparation processes. To avoid repetitive counting of the same wheat ears, data collectors need to precisely control the shooting range while capturing images of wheat ears. This necessity introduces challenges such as difficulties in field operation, time consumption, and inefficiency during data collection. Wu et al. used YOLOv7 and DeepSORT to train on a subset of the GWHD dataset for real-time wheat ear counting [21]. However, the model has too many parameters and slow inference speed. On a high-end GPU like 3090TI, it only achieved 14 FPS, making it unsuitable for real-time counting in large wheat fields. This approach also demands high computational resources, increasing hardware costs and hindering model deployment on mobile devices in the future.
In response to the challenges outlined above and to address the complex issues related to efficient automatic wheat ear counting, our main objectives were as follows: (i) to propose a novel lightweight wheat ear counting model, introducing an innovative and efficient real-time wheat ear counting method based on applying leading-edge artificial intelligence (AI) and Internet technology (IT) solutions, and (ii) to further advance the globally important agriculture practices in wheat monitoring and production. The new method implemented by our model is intended for accurate identifying and counting of wheat ears in real time under unmanned aerial vehicle (UAV) conditions, thereby significantly reducing the manual labor, and effectively auto-calculating the number of wheat ears, thereby conducting a preliminary evaluation of wheat yield in the field to help agriculture management and decision-making processes. We pursue our main objectives by addressing our computational research hypotheses in the background of the following proposed technological approaches and specific objectives:
- (1)
- To enhance the robustness of our model performance, various data augmentation methods were applied to the acquired dataset to ensure it would perform well under diverse conditions, such as different contrast, lighting, and environments.
- (2)
- To improve the computational efficiency of our model, FasterNet [22] was utilized as the primary backbone for feature extraction. A specific objective was to enhance computational efficiency while minimizing the number of parameters, thereby making the model easily deployable on mobile devices.
- (3)
- To enhance the backbone network, dynamic sparse attention and deformable convolution models were integrated into the model. A specific objective was to mitigate the influence of intricate environmental factors, such as the stickiness of wheat ears, while improving the model’s capability to efficiently extract wheat ear features.
- (4)
- To comprehensively capture fine details and context characteristics, feature pyramid network (FPN) [23] and lightweight upsampling operators were integrated into the PAN [24]. A specific objective was to enhance the capability of the proposed model to detect various sizes of wheat ears by optimal extraction of multi-scale features while minimizing the information loss during the upsampling process.
- (5)
- To further build upon the wheat ear detection algorithms, the Kalman filter-based tracking algorithm was incorporated into our model. A specific objective was to overcome the limitations of traditional image-based counting methods by achieving accurate motion prediction, and thereby avoid repeated counting in the continuous sequence by analyzing the context of video frames. Another objective was to significantly decrease the amount of manual work for wheat ear counting in the field.
2. Materials and Methods
2.1. Data Acquisition and Processing
To train and validate Wheat-FasterYOLO, we prepared two different categories of datasets. These include a wheat ear image dataset for the object detection training phase and a wheat ear video dataset for the object tracking evaluation phase. Specifically, we employed the Global Wheat Head Detection (GWHD) [25] dataset for training and validating our wheat ear detection model. Furthermore, we utilized wheat ear video data captured by UAV to assess the model’s performance in practical applications.
2.1.1. Source of Image Dataset
In order to obtain a universal and reliable wheat ears detection model, we utilized the GWHD dataset for model training. This dataset is the world’s first large-scale and diverse collection of labeled wheat ear images, originating from the collaboration of nine research institutions across seven countries. GWHD encompasses high-resolution images of wheat ears at different growth stages, varieties, and cultivation conditions. These image data are sourced from multiple countries, exhibiting rich genotypic characteristics and diverse growth phases, thereby providing robust support for the methodology proposed in this study.
2.1.2. Image Data Partitioning and Augmentation
In this study, we obtained a total of 3372 annotated wheat ear image data. To ensure the validity of the experiments, we used the hold-out method to randomly partition the dataset, dividing the 3372 image data into training, testing, and validation sets in proportions of 7:2:1, respectively. During the training process, the model’s hyperparameters were adjusted and optimized based on various indicators from the validation set, and the final performance of the model was evaluated on the test set.
Wheat ear images gathered from the field are impacted by factors like weather, lighting, and variety, resulting in diverse color variations and disruptions. To enhance the model’s generalization ability and robustness, making it suitable for different wheat varieties, accurate counting can also be carried out, even in cases of overlapping wheat ears and interference from weed occlusion. This research utilizes the ImgAug [26] algorithm library to augment the data; after data augmentation, the dataset increased from the original 3372 images to 4899 images, comprising 3954 images in the training set, 675 images in the validation set, and 270 images in the test set. Details of augmentation techniques and outcomes are illustrated in Figure 1.

Figure 1.
Data augmentation effect display. (a) Original figure. (b) Contrast adjustment. (c) Diffuse focus blur. (d) Fogging noise. (e) Gaussian noise. (f) Sharpening and hue change.
2.1.3. Video Data Collection
To validate the real-time tracking and counting effectiveness of the model in actual scenarios, we visited three different wheat cultivation locations in the Guangxi Zhuang Autonomous Region of China. We collected and processed multiple segments of wheat ear videos. The wheat ear data collection equipment used was the DJI Mavic 3, manufactured by DJI Innovations, headquartered in Shenzhen, China. This drone was equipped with a 4/3-inch CMOS Hasselblad camera, which is from a Hasselblad in Gothenburg, Sweden. We have collected a total of tens of thousands of frames of wheat ear video data. In this study, considering the actual workload, we extracted some representative data, and the basic information of the data used is shown in Table 1.

Table 1.
Wheat ear video data collection and processing information.
During the data collection process, the drone operated at an altitude of 4 m, and we used a 7× telephoto camera manufactured by Zeiss, a company based in Germany. This camera features a fixed focal length of 166mm and captures an 80-degree downward view. The collected wheat ear videos had a resolution of 1920 × 1080 pixels at a frame rate of 60 frames per second. Using DJI Mavic 3’s fixed-speed cruise function, the UAV autonomously collected wheat video data based on pre-planned flight routes, maintaining a constant speed of 0.1 m per second. In the collected and processed data, the drone flew a total of 14.76 m. The acquired data examples are shown in Figure 2.
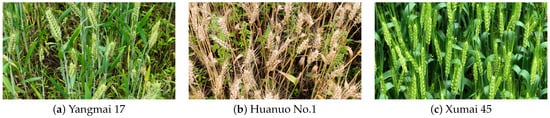
Figure 2.
Collected data on wheat ears characteristics from different varieties.
2.1.4. Annotation of Video Data
In the annotation process of the wheat ear video dataset, we utilized DarkLabel version 2.4 [27]. A total of 8858 frames from the video sequences were annotated. Starting from frame 0, wheat ear images were marked with rectangular bounding boxes frame by frame. These manually annotated real target positions and trajectory information help us to evaluate the model’s performance in practical applications. The annotation results are shown in Figure 3.
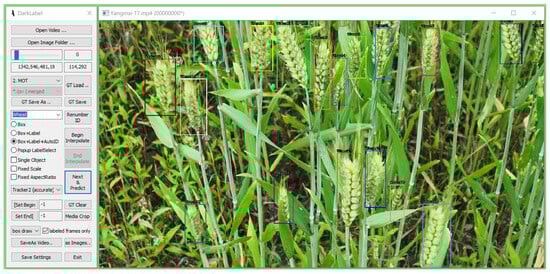
Figure 3.
Annotation of wheat ear video data.
2.2. Model Design Method
This work focuses on real-time wheat ear tracking and counting, which is an object-tracking task. It involves accurate detection and positioning of wheat ear targets within images, followed by trajectory prediction using target-tracking algorithms. The study utilizes FasterNet as the baseline model, enhancing it through analysis of wheat ear recognition challenges and their integration with target-tracking algorithms. The outcome is the proposed Wheat-FasterYOLO, a model for real-time wheat ear counting.
2.2.1. FasterNet
In vast wheat fields, wheat ear detection and counting often require a substantial amount of computation time. Mobile and embedded devices have limited power, memory, and storage, making complex models impractical. Lightweight models like GhostNet [28], MobileNet [29,30,31], and ShuffleNet [32,33] utilize techniques such as group convolutions and depthwise convolutions for feature extraction. However, these methods primarily focus on reducing floating-point operations (FLOPs), which frequently result in increased memory access during this process, consequently leading to lower floating-point operations per second (FLOPS). The formula relating latency and FLOPs is as follows:
The formula implies that latency does not solely connect with FLOPs, but also with their FLOPS. In order to create a genuinely fast and efficient neural network, this study adopts the FasterNet, rooted in partial convolution (PConv) [22], as its benchmark model. Its aim is to lighten the device load for wheat ear counting tasks while achieving enhanced FPS rates. The PConv’s architecture, showcased in Figure 4, engages convolutions solely with select input feature map channels, leaving the remaining channels unaltered.
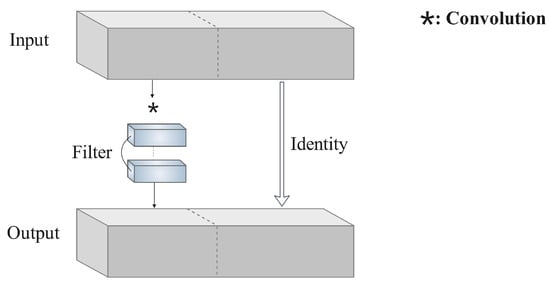
Figure 4.
The structure of PConv.
2.2.2. Loss Function
The proposed wheat ear detection model in this study employs object confidence and bounding box regression losses. While conventional bounding box regression uses intersection over union (IoU) [34] for alignment, limited to area overlap, we introduce SCYLLA intersection over union (SIoU) [35]. It also includes angle, distance, and shape losses, accelerating convergence. This improves accuracy and precision in localizing wheat ears.
The formula for object confidence loss is as follows:
where represents the predicted object confidence. denotes the IoU of the predicted bounding box. signifies the binary cross entropy loss function for binary classification. embodies the weight coefficient for the object loss.
Introducing angle loss seeks to penalize model errors in angle predictions, enhancing the precise alignment of wheat ear angles. Angle loss is defined as follows:
where indicates a vertical disparity between the predicted and ground truth bounding box centers, while represents their horizontal difference.
Introducing the concept of distance loss to penalize the model for inaccuracies in distance prediction helps the model better capture spatial relationships between wheat ears. The loss is defined as follows:
where
where is the horizontal coordinate value of the center point of the ground truth bounding box, while represents their vertical coordinate value. signifies the width of the minimum bounding rectangle for both the ground truth and predicted bounding boxes, while represents the height of the minimum bounding rectangle.
Introducing shape loss to refine shape predictions enhances the model’s grasp of wheat ear morphology. The shape loss is defined as:
where
Among them, w and h represent the width and height of the predicted bounding box, respectively. and represent the width and height of the ground truth bounding box, respectively. indicates the degree of attention to the shape loss.
In summary, the final loss function of the Wheat-FasterYOLO is as follows:
2.2.3. BiFormer
The attention mechanism enhances the network’s capability to extract wheat ear features while reducing the influence of complex backgrounds (such as weeds resembling wheat ear characteristics). However, in most cases, it faces challenges of high computational complexity and memory consumption. Therefore, in Wheat-FasterYOLO, we have incorporated BiFormer consisting of bi-level routing attention (BRA) [36]. By incorporating sparsity and query-aware adaptability, BiFormer efficiently models pivotal image regions globally. This method has moderately enhanced the precision of matching wheat ear samples amid intricate backgrounds, concurrently guaranteeing minimal memory utilization and reduced computational intricacy.
The BRA module’s structure is shown in Figure 5. First, the height of the input feature map is H, the width is W, and the number of channels is C. Next, the feature map is divided into distinct regions, and key-value pairs are collected for the first N regions. Each region contains feature vectors, which are linearly mapped to obtain the corresponding Q, K, and V. An adjacency matrix is used to construct a directed graph to determine the participating relationships for different key-value pairs. As the routing regions are distributed across the entire feature map, it is necessary to aggregate the tensors of keys and values. The aggregated tensors of and are obtained. Matrix multiplication (mm) is performed between and Q, followed by a softmax operation. The obtained matrix A, representing the index of region-to-region routing, is multiplied with using matrix multiplication. Ultimately, a fine-grained token-to-token attention is achieved.

Figure 5.
The structure of BRA.
2.2.4. DCNv2
Throughout the growth stages, wheat ears can exhibit diverse shapes, colors, and densities due to different growth factors. Furthermore, during UAV flights, camera motion may distort wheat ear images. The factors mentioned above can easily cause errors in wheat ear detection models. Models should adapt to changing feature distributions. Traditional convolutions ignore target deformation and position, yielding poor results for uneven features. Thus, this study introduces Deformable ConvNets v2 (DCNv2), a neural network using offsets for deformable convolutions [37]. DCNv2 dynamically adjusts kernel positions to precisely address target changes. This adaptation empowers the feature layer to adjust the receptive field and scale, resulting in improved performance in detecting wheat ear targets of different characteristics.
DcnV2’s learning is shown in Figure 6. Extra convolutional layers learn offsets from the input feature map through convolutional operations, forming a channel dimension. This dimension signifies and coordinate axes offsets for each pixel in an N-sized kernel. Inputs to the deformable convolutional layer are the feature map and offsets, where sampling points are shifted. Following convolutions, an output feature map is obtained.
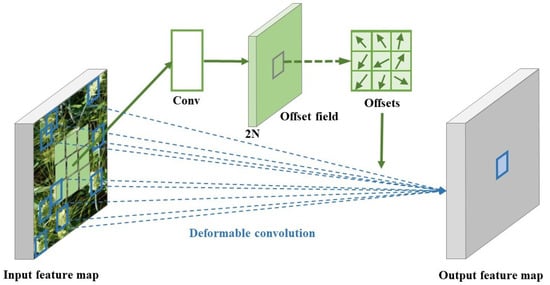
Figure 6.
Illustration of deformable convolution.
2.2.5. Improving the PAN Architecture
The FPN acquires multi-scale contextual information by integrating feature maps from different scales. It not only captures texture information in lower-level feature maps but also extracts rich semantic information from higher-level feature maps. Building on this, the PAN further enhances performance through additional sampled fusion.
Conventional upsampling methods focus only on spatial distances among sub-pixel neighbors. However, in the task of wheat ears detection, due to the limited feature information that wheat ears can capture, this approach cannot fully grasp the hidden semantic information in the feature map. This may result in the loss of important details and contextual information. To address this issue, we introduce the lightweight upsampling operator CARAFE [38] in PAN. During the upsampling process, CARAFE aggregates extensive contextual information, enabling PAN to better capture wheat ear details and context, thus reducing feature loss during upsampling. Figure 7 illustrates the structure of CARAFE-PAN.
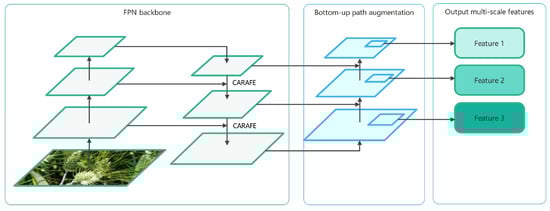
Figure 7.
Illustrates the structure of CARAFE-PAN.
2.2.6. OC-SORT
To achieve real-time tracking and counting of wheat ears in a video stream, we adopt the OC-SORT [39] algorithm. This method reduces noise and enhances robustness using observation-centric techniques.
In consecutive video frames, the motion of the same target can be seen as linear. The Kalman filter is suitable for position estimation, but noise can lead to inaccurate motion direction estimation, causing target loss. OC-SORT integrates the observation-centric momentum (OCM) strategy, reducing noise impact.
During wheat ear tracking and counting tasks, to prevent the parameter bias of the Kalman filter from causing recurrent losses of detected wheat ear targets, OC-SORT employs the observation-centric re-update (ORU) strategy. When re-tracking, Kalman filter parameters adjust through virtual trajectories, reducing errors.
Natural wind can briefly obstruct wheat ear targets, and traditional tracking algorithms may mislead target loss or counting errors. OC-SORT leverages the observation-centric recovery (OCR) strategy, attempting a second association to restore trajectories.
The OC-SORT workflow is shown in Figure 8.
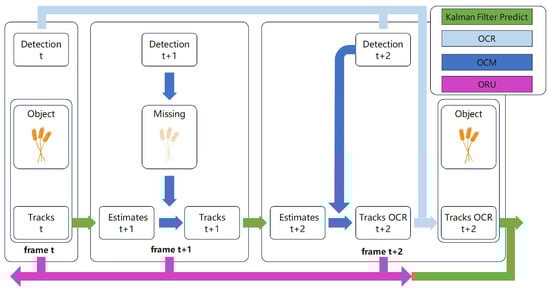
Figure 8.
The pipeline of OC-SORT. During association, OCM introduces velocity consistency cost, but the target is momentarily obscured in frame t + 1 due to occlusion. However, in the subsequent frame, the target is successfully regained by referencing its observation in frame t using OCR. This re-tracking event then prompts ORU to update the parameters of its Kalman Filter from t to t + 2.
2.2.7. Wheat-FasterYOLO Model Structure
As depicted in Figure 9, the Wheat-FasterYOLO framework incorporates FasterNet with DCNv2 and BiFormer in its backbone. Employing PAN with CARAFE in the network’s neck and three YOLO heads in the head predicts wheat ear target regression. OC-SORT enables efficient real-time tracking and updates of wheat ear positions, enabling real-time wheat ear tracking and counting.
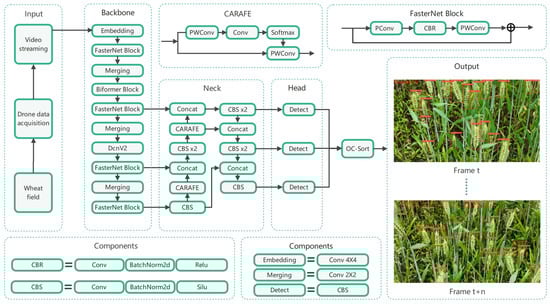
Figure 9.
Comprehensive architecture of the Wheat-FasterYOLO.
2.2.8. Practical Application Process of the Model
In our research, the process of using a model for actual counting is illustrated in Figure 10. First, based on the features of the actual wheat field, manual route planning for the drone’s flight path is conducted to ensure that every area is scanned by the drone. Subsequently, the automatic cruise function is initiated, and the drone will autonomously fly and capture a sequence of wheat ear videos based on the previously established flight route. Finally, when the drone begins its operation, real-time captured video data are transmitted to our mobile computing device terminal through DJI’s OcuSync transmission technology. Running our models on mobile devices with the PyTorch deep learning framework, real-time detection and counting of the wheat ear video sequence are performed, providing real-time counting results.
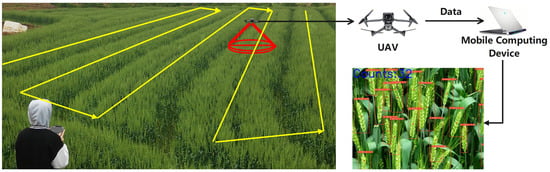
Figure 10.
The process in the actual counting of wheat ears, with the yellow line in the diagram representing the planned route and the red area indicating the area being scanned by the UAV.
2.3. Evaluation Indicators
In wheat ears object detection, we employ the P, R, , and metrics to comprehensively evaluate detector effectiveness. P represents the proportion of actual wheat ears detected by the model within the detected wheat ears, while R denotes the proportion of successfully detected wheat ears by the model out of all the true wheat ears. provides a comprehensive assessment of precision and recall across target categories, and is the harmonic mean of precision and recall. The specific calculations are as follows:
where is the accurate wheat ear predictions, is non-target samples misclassified as ears and is the missed number of actual wheat ear detection.
In the task of wheat ear tracking, the performance of the model in tracking targets after detecting wheat ears is measured using , , , , and [40]. signifies ]precise detection ratio, while indicates the association accuracy of tracking. and are the ratios of successfully detected and associated wheat ears to all true targets. assesses the overall t performance in detection and tracking. The specific calculation methods are as follows:
where , , and have the same definitions as in formulas 9 and 10. , , and correspond to accurate positives, incorrect negatives, and incorrect positives. is the association accuracy threshold, and c represents any point within .
3. Results and Discussion
This study trained and tested the model on the Ubuntu 18.04.5 LTS 64-bit operating system. The experimental environment employed an NVIDIA RTX 3090 (24G) graphics card with a CUDA 11.1 driver. Python 3.8.3 and the deep learning framework PyTorch 1.8.0 were utilized. The final set of hyperparameters is presented in Table 2.
Table 2.
Training and testing hyperparameter information.
During training, we employed common object detection techniques like mosaic data augmentation, cosine learning rate scheduling, and hyperparameter evolution. Figure 11 visualizes bounding box regression loss, confidence loss, precision, and recall for the Wheat-FasterYOLO model’s validation set.
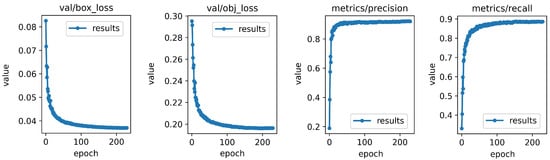
Figure 11.
Visualization of Wheat-FasterYOLO detection model training data.
3.1. The Impact of Data Augmentation
Data augmentation experiments trained the baseline model on original and augmented GWHD datasets, resulting in two models. As shown in Table 3, using FasterNet as the baseline, the non-augmented model achieved mAP and F1 scores of 84.91% and 81.17%. After augmentation, scores improved to 85.66% and 81.97%, confirming data augmentation’s necessity for field-derived wheat ear images.
Table 3.
Comparison before and after data augmentation.
3.2. Comparative Experiments with Different Attention Integrations
Attention mechanisms typically enhance model performance. In the context of the FasterNet backbone feature extraction network for global wheat ear detection datasets, we assessed various attention mechanisms’ effectiveness. The comparative experimental results, showcased in Table 4, illustrate the impact of different attention mechanisms within the augmented global wheat ears detection dataset.
Table 4.
Results of comparative experiments incorporating different attentional mechanisms in the data-enhanced GWHD dataset.
It can be observed that compared to the baseline model, the inclusion of SimAM [41] and CBAM [42] resulted in a slight improvement in model performance, with an increase of 0.45% and 0.15% in mAP values, and 0.31% and 0.66% in F1 values, respectively. In contrast, incorporating GAM [43] significantly boosted performance, with mAP and F1 values rising by 4.83% and 4.93%. However, SE [44] had no positive impact; instead, it led to a 0.48% and 0.46% decrease in mAP and F1 values, indicating its unsuitability for this model.
It is worth noting that BiFormer performed the best in the experiments, with mAP and F1 values reaching 91.21% and 87.71%, respectively, marking a significant improvement of 5.55% and 5.74% compared to the baseline model. Figure 12 visually presents heatmaps depicting various attention mechanisms, illustrating the model’s precise targeting of wheat ear objectives. These findings reaffirm BiFormer’s commendable performance in the realm of wheat ear detection tasks.
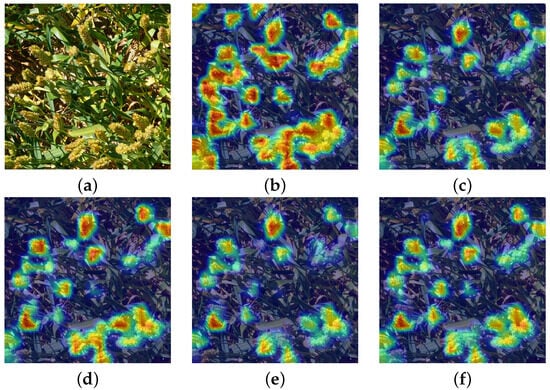
Figure 12.
Heat maps of attention to the target after incorporating different attention mechanisms. (a) Original figure. (b) BiFormer. (c) CBAM. (d) GAM. (e) SE. (f) SinAM.
3.3. Ablation Experiment
To validate the effectiveness of the wheat ear detection model improvement, we conducted ablation experiments, and the results are shown in Table 5. The experimental results demonstrate a significant enhancement in the model’s performance after the incorporation of BiFormer, with an increase of 5.55% in mAP and 5.74% in F1. BiFormer, with its unique sparsity and query-aware adaptability, can effectively model regions of interest across the feature maps globally.
Table 5.
Results of model ablation experiments.
By introducing the improved upsampling operator path aggregation network, the mAP and F1 of the wheat ear detection model improved by 2.37% and 2.65%, respectively. The path aggregation network helps the model better fuse multiscale features in the feature maps. After upsampling with the lightweight operator CARAFE, the model can capture the details and contextual information of wheat ears more effectively.
With the addition of the DcnV2 module, the mAP of the wheat ear detection model increased by 0.43%, and the F1 increased by 0.44%. Deformable convolution adjusts the position information of convolution kernels dynamically, responding more accurately to the deformation and spatial positional changes in wheat ear targets.
The mAP of the improved wheat ear detection model reached 94.01%, and the F1 score reached 90.8%. Compared to the baseline model before improvement, there was an 8.35% increase in mAP and an 8.83% increase in F1 score. The proposed improvement methods in this paper have played a significant role in the wheat ear detection model, effectively enhancing its performance. The detection results of wheat ears before and after the model improvement are shown in Figure 13.
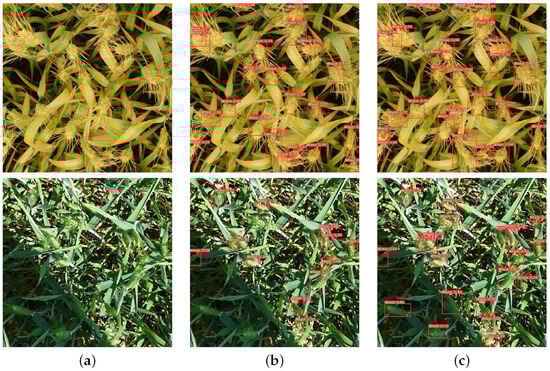
Figure 13.
Comparison of the wheat ear detection model’s performance before and after improvement. (a) Pictures of primitive wheat ears. (b) Before the model improvement, there were varying degrees of missed and false detections in wheat ear detection. (c) After the model improvement, the wheat ear detection performance has been greatly enhanced, significantly reducing missed and false detections.
3.4. Comparative Experimental Analysis of Different Detection Models
In order to evaluate the performance of our proposed wheat ear detection model, we conducted a comparative analysis with popular object detection models. We utilized the same set of parameters and dataset, and each model underwent training in the same experimental environment. The experimental findings in Table 6 reveal that our Wheat-FasterYOLO model, introduced in this study, outperformed in terms of P, R, mAP, and F1 scores, achieving high scores of 92.63%, 89.04%, 94.01%, and 90.8%, respectively. Furthermore, our model has fewer parameters and lower computational complexity, with a mere 1.34 parameters and 3.9 GFLOPs. Additionally, it demonstrated a faster speed; the frame rate reached 185 FPS.
Table 6.
Performance of different object detection models in a wheat ear detection task.
Wheat-FasterYOLO outperforms SSD-VGG [45,46], SSD-MobileNet [29], Faster R-CNN [47], and EfficientDet [48] significantly, even though Faster R-CNN and EfficientDet exhibit FPS of only 30 and 21. However, the introduction of tracking algorithms, requiring increased computational resources for Kalman filtering to estimate target motion, makes it unsuitable for real-time wheat ear tracking. Compared to SSD-MobileNet, Wheat-FasterYOLO experiences a slight 0.9 increase in GFLOPs, but its parameters are only 37.93% of SSD-MobileNet. It also achieves a 98 FPS boost, demonstrating Wheat-FasterYOLO’s fast and lightweight performance despite increased GFLOPs, with superior FPS and fewer parameters.
While Wheat-FasterYOLO has a slightly lower F1 score compared to YOLOX [49] and YOLOv7-Tiny [50], it surpasses all other models in terms of mAP. This indicates that Wheat-FasterYOLO may not have the absolute best precision and recall. However, in terms of mAP, it outperforms all other models, which means it is better in overall detection accuracy across a range of confidence thresholds. It stands out for its efficiency, requiring only 16.71% of YOLOX’s parameters and 22.36% of YOLOv7-Tiny’s parameters, with computational demands at 18.06% of YOLOX and 30% of YOLOv7-Tiny. Combining the highest mAP with faster speed, Wheat-FasterYOLO demonstrates better overall performance, making it a suitable choice for real-time wheat ear tracking and counting tasks.
3.5. Comparative Experiments Incorporating Different Tracking Algorithms
In the real-time wheat ear tracking and counting task, the wheat ear detection model is combined with popular target-tracking algorithms. Through comparative experiments in different wheat varieties and using the TrackEval [51] evaluation, the performance differences in models incorporating different tracking algorithms in practical wheat ear counting applications are assessed. The results of the experiment are shown in Table 7.
Table 7.
Scores of different tracking algorithms in conjunction with an object detection model for various metrics in different varieties of wheat ears.
According to the experiment data, OC-SORT achieved the best performance, with an average HOTA of 60.52%, which is 7.04% higher than ByteTrack [52] and 13.05% higher than StrongSORT [53]. When working in conjunction with the wheat ear detector, OC-SORT had a slightly lower average FPS than ByteTrack. However, its average DetA, AssA, DetRe, and AssRe were 9.36%, 3.2%, 13.54%, and 5.65% higher than ByteTrack, respectively, indicating that it outperformed ByteTrack comprehensively. StrongSORT had a higher DetRe than OC-SORT in testing. However, its HOTA metric was significantly lower than OC-SORT, indicating that StrongSORT’s overall performance in real-time wheat ear counting tasks was unsatisfactory. Additionally, due to the introduction of the feature re-identification network, StrongSORT consumed a large amount of computational resources, resulting in high latency, with an average FPS of only 20, making it unsuitable for practical wheat ear tracking and counting tasks. The feature re-identification network is able to recapture a similar-looking target and confirm whether it is the same target as the previously detected one. In StrongSORT, the feature re-identification network tends to misidentify different wheat ear targets as the same target when dealing with wheat ears with highly similar appearance features, significantly affecting the counting results.
In summary, the Wheat-FasterYOLO model proposed in this paper, when integrated with the OC-SORT algorithm, achieved higher HOTA and overall performance compared to ByteTrack and StrongSORT. It achieved an average FPS of 92, meeting the requirements of real-time wheat ear tracking and counting. Figure 14 shows the HOTA, DetA, AssA, DetRe, and AssRe curves of OC-SORT at different association accuracy threshold values “alpha”, reflecting the variations in scores of various metrics with the threshold “alpha”.
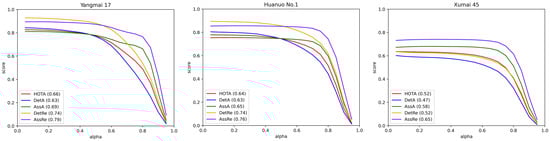
Figure 14.
The variations in HOTA, DetA, AssA, DetRe, and AssRe curves under different threshold values “alpha” for OC-SORT.
3.6. Analysis of Counting Accuracy in the Wheat-FasterYOLO Model
When collecting data with UAV, wheat ear targets are prone to temporary loss in the detector due to motion blur or occlusion. However, by integrating target-tracking algorithms, as long as the wheat ear target is detected once in the video sequence, a unique ID can be assigned and counted. In subsequent detections, if the detector redetects the lost target and the target has not undergone significant irregular motion or severe deformation, the tracking algorithm will ensure consistent ID recognition. Wheat-FasterYOLO avoids the issue of the same target being counted repeatedly in different video sequences, as shown in Figure 15 for a specific illustration.
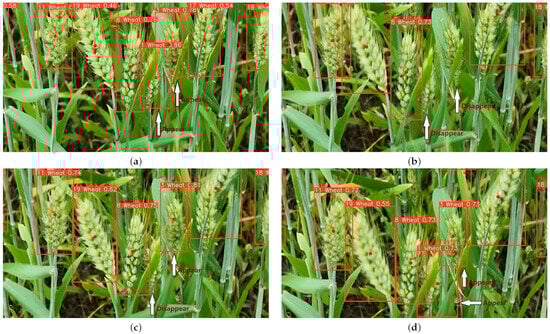
Figure 15.
The demonstration of Wheat-FasterYOLO’s tracking effect on the same wheat ear object in different video sequences. The rectangular box in the figure shows the location of the wheat target detected by the model, and the red dot is the center of the rectangular box. (a) In the first frame of the video sequence, target number 1’s and target number 3’s wheat ears are in a detected state, included in the total count of wheat ears. (b) In the 64th frame of the video sequence, target number 1’s wheat ear was temporarily lost by the detector due to motion blur, and target number 3’s wheat ear was excessively occluded by leaves. (c) In the 76th frame of the video sequence, target number 3’s wheat ear was re-detected, the ID number remained unchanged, and the tracking algorithm successfully identified it as the same target, restoring the label for target number 3’s wheat ear. (d) In the 105th frame of the video sequence, similar to target number 3’s wheat ear, target number 1’s wheat ear was re-detected.
Table 8 shows the counting results for three different types of wheat ears. In the table, “IDs” represent the model’s counting results, “GT_IDs” represent the actual number of wheat ears, and “Counting accuracy” reflects the accuracy of the model in practical wheat ear counting tasks. As shown in Figure 16, a linear regression analysis is performed between the model count results and the actual quantity over a period of time. R reflects the degree of agreement between the model count values and the actual values. The closer its value is to 1, the better the fit. RMSE represents the deviation between the calculated value of the model and the actual value. It can be seen from this that there is a strong correlation between the counting results of the wheat ear counting method proposed in this study and the manual counting results, indicating that our method is practical.
Table 8.
Practical counting performance of Wheat-FasterYOLO in ears of three different wheat varieties.
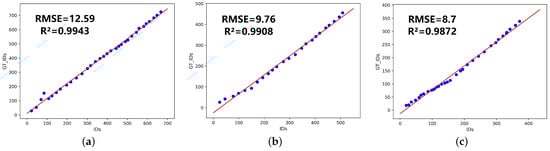
Figure 16.
Scatter plot of model-based and manual counting results for three different types of wheat ears in a video sequence. (a) Yanmai 17.mp4. (b) Huanuo No.1.mp4. (c) Xumai 45.mp4.
In the wheat ear counting experiment, the accuracy rates for Yangmai 17, Huanuo No.1, and Xumai 45 were 91.71%, 92.66%, and 91.28%, respectively, with an average accuracy rate of 91.88%. By analyzing the detection results, it was found that there were weeds in Yangmai 17 and Huanuo No.1 with heights similar to wheat ears, leading to the model mistakenly identifying weeds as wheat ears. Additionally, in windy conditions, when the wheat ears moved only slightly in the wind, the model was able to track the wheat ear targets well. However, when strong winds caused the wheat ears to sway significantly, the model had difficulty accurately capturing the same wheat ear target, resulting in the model incorrectly considering wheat ears that moved significantly before and after as different objects, ultimately leading to an overestimation of the detected wheat ear count.
In the case of Xumai 45 detection, there were no issues related to weeds with heights similar to wheat ears or interference from strong winds. However, due to the heavy overlap and occlusion of Xumai 45 wheat ears, the model erroneously identified overlapped wheat ears as a single target. Furthermore, the wheat ears of Xumai 45 had a relatively large aspect ratio, making it difficult for the model to fit the position information of the real bounding boxes. These factors led to instances of missed detections, resulting in a lower detected wheat ear count compared to the actual count.
Figure 17 shows a randomly selected frame from the three detection video sequences, illustrating the counting results of Wheat-FasterYOLO. The top-left corner displays the total number of different wheat plants detected by the model from the first frame to the currently selected frame. The information displayed above the detection boxes indicates the wheat ear’s ID value, category, and confidence level.
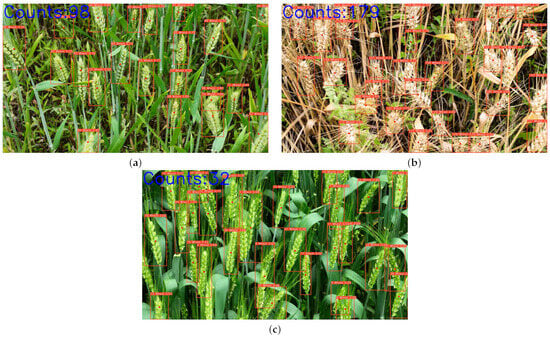
Figure 17.
Wheat-FasterYOLO shows the counting results in a video sequence of one of the three different wheat ear varieties (wheat ear counting begins from the first frame of the video sequence and continues until the last frame). (a) Frame 794 of Yangmai 17.mp4. At this point, the cumulative count is 98 wheat ears. (b) Frame 620 of Huanuo No.1.mp4. At this point, the cumulative count is 179 wheat ears. (c) Frame 10 of Xumai 45.mp4. At this point, the cumulative count is 32 wheat ears.
3.7. Advantages and Limitations
In this subsection, we will discuss the advantages and limitations of Wheat-FasterYOLO in detail as follows:
Firstly, we employed a combined model approach by introducing the OC-SORT algorithm based on the Kalman filter into the wheat ear detection model under study. This integration enables the model to accurately estimate the motion of wheat ear targets in UAV video sequences. By assigning a unique identification number (ID) to each wheat ear target, we achieved non-repetitive and high-precision counting. Farm owners only need to plan the drone’s flight path based on real-world conditions to automatically obtain the desired wheat ear count information for a better preliminary assessment and decision-making regarding their wheat fields.
Secondly, we recognized the critical importance of GPU resource allocation in our approach. While ensuring sufficient GPU resources for effective YOLO operation, allocating a processing layer for tracking is a key consideration. In extensive tests, we found that the tracking algorithm typically consumes fewer resources than YOLO. The fast and lightweight nature of Wheat-FasterYOLO allows it to operate on a variety of devices, reducing hardware costs and enabling real-time counting in diverse environments. However, for optimal results and to prevent processing delays during counting, we recommend using a GTX 1050 or higher image processor to ensure the quality of wheat ear detection and tracking in various scenarios.
Moreover, understanding the growth stages of wheat is crucial for making informed agricultural decisions. Wheat growth can be divided into six distinct phases: germination, vegetative growth, heading, flowering, grain filling, and maturation. Our model, trained on a diverse dataset, is capable of effectively counting wheat heads during the flowering stage and beyond. This feature provides valuable insights for farmers during the mid to late stages of wheat growth, contributing to improved crop management and planning.
Finally, although our model can perform real-time counting for different wheat varieties in general, there are limitations. In some cases, wheat ears may be empty, and since our model was not trained on samples of empty wheat ears, it cannot effectively handle this specific situation. To address this limitation, we plan to collect more samples in future research and continuously enhance our model to make it more versatile.
4. Conclusions
In this study, we utilized the path planning and constant-speed cruising functions of UAV to automatically collect video sequences of wheat ears and achieved real-time tracking and counting of wheat ears in the field environment using the proposed Wheat-FasterYOLO. Compared to target detection and counting methods focused solely on static images, our approach circumvented the complexities associated with the operation, time-consuming, and low efficiency associated with data collection processes. Compared to existing real-time wheat ear counting models, our approach has fewer parameters, faster speed, and can achieve good results. In practical applications, it significantly enhanced the level of automation in wheat ear counting.
In the wheat ear detection method, we trained the Wheat-FasterYOLO model based on the GWHD dataset. Its mAP, F1 score, parameter count, GFLOPs, and FPS are 94.01%, 90.8%, 1.34 × 10, 3.9, and 185, respectively. This model combines lightweight design with speed and accuracy, demonstrating better overall performance than many popular object detection models and showing great potential for wheat ear detection tasks.
For wheat ear tracking and counting tasks, this study integrated the Kalman filter-based object tracking algorithm OC-SORT with the wheat ear detection model. We collected video sequences of three different wheat varieties using the DJI Mavic 3 and annotated them frame by frame. In multi-object tracking tests, the average HOTA reaches 60.52%, and the FPS is 92. In actual wheat ear counting scenarios, the average RMSE is 10.35, R is 99.08%, and the counting accuracy is 91.88%. The lightweight design of Wheat-FasterYOLO makes it suitable for mobile edge terminals such as drones, allowing for rapid completion of wheat ear counting tasks in field environments and further advancing agricultural automation.
The effectiveness of the tracking algorithm is influenced by the detection model, as well as factors such as motion blur, image distortion generated during the drone flight, and the mutual occlusion of wheat ears, all of which can introduce certain interference into the counting results. In future research, we will continuously improve the quality of the wheat ear detection model and explore more stable counting methods to achieve efficient and accurate detection and counting of wheat ears in high-density wheat field scenarios. This will provide strong support for field management, grain trade, and agricultural production.
Author Contributions
Conceptualization, X.H. (Xiaochun Hu) and Y.C.; Data curation, J.C., X.H. (Xiaochun Hu), J.L. and X.H. (Xin Huang); Formal analysis, Y.C. and X.H. (Xin Huang); Funding acquisition, Y.C. and X.H. (Xin Huang); Methodology, J.C.; Project administration, X.H. (Xiaochun Hu) and J.L.; Resources, J.C. and X.H. (Xin Huang); Software, J.C., X.H. (Xiaochun Hu), J.L. and Y.C.; Supervision, X.H. (Xiaochun Hu), Y.C. and X.H. (Xin Huang); Validation, J.C., J.L. and Y.C.; Visualization, J.C., X.H. (Xiaochun Hu), J.L. and X.H. (Xin Huang); Writing—original draft, J.C. and Y.C.; Writing—review and editing, J.C., Y.C. and X.H. (Xin Huang). All authors have read and agreed to the published version of the manuscript.
Funding
This research was funded by the Guangxi Scientific Research and Technology Development Plan Project grant number AA20302002-3 and the Guangxi Vocational University of Agriculture Natural Science and Technology Development Program Project grant number XKJ2357.
Institutional Review Board Statement
Not applicable.
Informed Consent Statement
Not applicable.
Data Availability Statement
The data used in this study consists of two components: the GWHD Global Wheat Head Detection dataset and our self-collected video dataset for wheat ear tracking. The GWHD dataset is publicly available and can be accessed at http://www.global-wheat.com (accessed on 19 February 2023).
Conflicts of Interest
The authors declare no conflict of interest.
References
- Zhao, J.; Yan, J.; Xue, T.; Wang, S.; Qiu, X.; Yao, X.; Tian, Y.; Zhu, Y.; Cao, W.; Zhang, X. A deep learning method for oriented and small wheat spike detection (OSWSDet) in UAV images. Comput. Electron. Agric. 2022, 198, 107087. [Google Scholar] [CrossRef]
- Zhou, H.; Riche, A.B.; Hawkesford, M.J.; Whalley, W.R.; Atkinson, B.S.; Sturrock, C.J.; Mooney, S.J. Determination of wheat spike and spikelet architecture and grain traits using X-ray Computed Tomography imaging. Plant Methods 2021, 17, 26. [Google Scholar] [CrossRef] [PubMed]
- Nerson, H. Effects of population density and number of ears on wheat yield and its components. Field Crops Res. 1980, 3, 225–234. [Google Scholar] [CrossRef]
- Madec, S.; Jin, X.; Lu, H.; De Solan, B.; Liu, S.; Duyme, F.; Heritier, E.; Baret, F. Ear density estimation from high resolution RGB imagery using deep learning technique. Agric. For. Meteorol. 2019, 264, 225–234. [Google Scholar] [CrossRef]
- Sadeghi-Tehran, P.; Virlet, N.; Ampe, E.M.; Reyns, P.; Hawkesford, M.J. DeepCount: In-field automatic quantification of wheat spikes using simple linear iterative clustering and deep convolutional neural networks. Front. Plant Sci. 2019, 10, 1176. [Google Scholar] [CrossRef]
- Sun, J.; Yang, K.; Chen, C.; Shen, J.; Yang, Y.; Wu, X.; Norton, T. Wheat head counting in the wild by an augmented feature pyramid networks-based convolutional neural network. Comput. Electron. Agric. 2022, 193, 106705. [Google Scholar] [CrossRef]
- Zhang, L.; Chen, Y.; Li, Y.; Ma, J.; Du, K. Detection and Counting System for winter wheat ears based on convolutional neural network. Trans. Chin. Soc. Agric. Mach. 2019, 50, 144–150. [Google Scholar]
- Ma, J.; Li, Y.; Liu, H.; Wu, Y.; Zhang, L. Towards improved accuracy of UAV-based wheat ears counting: A transfer learning method of the ground-based fully convolutional network. Expert Syst. Appl. 2022, 191, 116226. [Google Scholar] [CrossRef]
- Zhou, X.; Zheng, H.; Xu, X.; He, J.; Ge, X.; Yao, X.; Cheng, T.; Zhu, Y.; Cao, W.; Tian, Y. Predicting grain yield in rice using multi-temporal vegetation indices from UAV-based multispectral and digital imagery. ISPRS J. Photogramm. Remote Sens. 2017, 130, 246–255. [Google Scholar] [CrossRef]
- Fernandez-Gallego, J.A.; Lootens, P.; Borra-Serrano, I.; Derycke, V.; Haesaert, G.; Roldán-Ruiz, I.; Araus, J.L.; Kefauver, S.C. Automatic wheat ear counting using machine learning based on RGB UAV imagery. Plant J. 2020, 103, 1603–1613. [Google Scholar] [CrossRef]
- Tan, C.; Zhang, P.; Zhang, Y.; Zhou, X.; Wang, Z.; Du, Y.; Mao, W.; Li, W.; Wang, D.; Guo, W. Rapid recognition of field-grown wheat spikes based on a superpixel segmentation algorithm using digital images. Front. Plant Sci. 2020, 11, 259. [Google Scholar] [CrossRef]
- Bao, W.; Lin, Z.; Hu, G.; Liang, D.; Huang, L.; Zhang, X. Method for wheat ear counting based on frequency domain decomposition of MSVF-ISCT. Inf. Process. Agric. 2023, 10, 240–255. [Google Scholar] [CrossRef]
- Fang, Y.; Qiu, X.; Guo, T.; Wang, Y.; Cheng, T.; Zhu, Y.; Chen, Q.; Cao, W.; Yao, X.; Niu, Q.; et al. An automatic method for counting wheat tiller number in the field with terrestrial LiDAR. Plant Methods 2020, 16, 132. [Google Scholar] [CrossRef] [PubMed]
- Pérez-Porras, F.J.; Torres-Sánchez, J.; López-Granados, F.; Mesas-Carrascosa, F.J. Early and on-ground image-based detection of poppy (Papaver rhoeas) in wheat using YOLO architectures. Weed Sci. 2023, 71, 50–58. [Google Scholar] [CrossRef]
- Yang, B.; Pan, M.; Gao, Z.; Zhi, H.; Zhang, X. Cross-Platform Wheat Ear Counting Model Using Deep Learning for UAV and Ground Systems. Agronomy 2023, 13, 1792. [Google Scholar] [CrossRef]
- Zaji, A.; Liu, Z.; Xiao, G.; Bhowmik, P.; Sangha, J.S.; Ruan, Y. AutoOLA: Automatic object level augmentation for wheat spikes counting. Comput. Electron. Agric. 2023, 205, 107623. [Google Scholar] [CrossRef]
- Alkhudaydi, T.; De la Lglesia, B. Counting spikelets from infield wheat crop images using fully convolutional networks. Neural Comput. Appl. 2022, 34, 17539–17560. [Google Scholar] [CrossRef]
- Qiu, R.; He, Y.; Zhang, M. Automatic Detection and Counting of Wheat Spikelet Using Semi-Automatic Labeling and Deep Learning. Front. Plant Sci. 2022, 13, 872555. [Google Scholar] [CrossRef]
- Dimitrov, D.D. Internet and Computers for Agriculture. Agriculture 2023, 13, 155. [Google Scholar] [CrossRef]
- Zaji, A.; Liu, Z.; Xiao, G.; Sangha, J.S.; Ruan, Y. A survey on deep learning applications in wheat phenotyping. Appl. Soft Comput. 2022, 131, 109761. [Google Scholar] [CrossRef]
- Wu, T.; Zhong, S.; Chen, H.; Geng, X. Research on the Method of Counting Wheat Ears via Video Based on Improved YOLOv7 and DeepSort. Sensors 2023, 23, 4880. [Google Scholar] [CrossRef]
- Chen, J.; Kao, S.h.; He, H.; Zhuo, W.; Wen, S.; Lee, C.H.; Chan, S.H.G. Run, Do not Walk: Chasing Higher FLOPS for Faster Neural Networks. In Proceedings of the IEEE/CVF Conference on Computer Vision and Pattern Recognition, Vancouver, BC, Canada, 18–22 June 2023; pp. 12021–12031. [Google Scholar]
- Lin, T.Y.; Dollár, P.; Girshick, R.; He, K.; Hariharan, B.; Belongie, S. Feature pyramid networks for object detection. In Proceedings of the IEEE Conference on Computer Vision and Pattern Recognition, Honolulu, HI, USA, 21–26 July 2017; pp. 2117–2125. [Google Scholar]
- Liu, S.; Qi, L.; Qin, H.; Shi, J.; Jia, J. Path aggregation network for instance segmentation. In Proceedings of the IEEE Conference on Computer Vision and Pattern Recognition, Salt Lake City, UT, USA, 18–23 June 2018; pp. 8759–8768. [Google Scholar]
- David, E.; Madec, S.; Sadeghi-Tehran, P.; Aasen, H.; Zheng, B.; Liu, S.; Kirchgessner, N.; Ishikawa, G.; Nagasawa, K.; Badhon, M.A.; et al. Global Wheat Head Detection (GWHD) dataset: A large and diverse dataset of high-resolution RGB-labelled images to develop and benchmark wheat head detection methods. Plant Phenomics 2020, 2020, 3521852. [Google Scholar] [CrossRef]
- Jung, A.B.; Wada, K.; Crall, J.; Tanaka, S.; Graving, J.; Reinders, C.; Yadav, S.; Banerjee, J.; Vecsei, G.; Kraft, A.; et al. Imgaug. Available online: https://github.com/aleju/imgaug (accessed on 5 June 2023).
- DarkLabel. Available online: https://github.com/darkpgmr/DarkLabel (accessed on 1 June 2023).
- Han, K.; Wang, Y.; Tian, Q.; Guo, J.; Xu, C.; Xu, C. Ghostnet: More features from cheap operations. In Proceedings of the IEEE/CVF Conference on Computer Vision and Pattern Recognition, Seattle, WA, USA, 13–19 June 2020; pp. 1580–1589. [Google Scholar]
- Howard, A.G.; Zhu, M.; Chen, B.; Kalenichenko, D.; Wang, W.; Weyand, T.; Andreetto, M.; Adam, H. Mobilenets: Efficient convolutional neural networks for mobile vision applications. arXiv 2017, arXiv:1704.04861. [Google Scholar]
- Sandler, M.; Howard, A.; Zhu, M.; Zhmoginov, A.; Chen, L.C. Mobilenetv2: Inverted residuals and linear bottlenecks. In Proceedings of the IEEE Conference on Computer Vision and Pattern Recognition, Salt Lake City, UT, USA, 18–23 June 2018; pp. 4510–4520. [Google Scholar]
- Howard, A.; Sandler, M.; Chu, G.; Chen, L.C.; Chen, B.; Tan, M.; Wang, W.; Zhu, Y.; Pang, R.; Vasudevan, V.; et al. Searching for mobilenetv3. In Proceedings of the IEEE/CVF International Conference on Computer Vision, Seoul, South Korea, 27 October–2 November 2019; pp. 1314–1324. [Google Scholar]
- Zhang, X.; Zhou, X.; Lin, M.; Sun, J. Shufflenet: An extremely efficient convolutional neural network for mobile devices. In Proceedings of the IEEE Conference on Computer Vision and Pattern Recognition, Salt Lake City, UT, USA, 18–23 June 2018; pp. 6848–6856. [Google Scholar]
- Ma, N.; Zhang, X.; Zheng, H.T.; Sun, J. Shufflenet v2: Practical guidelines for efficient cnn architecture design. In Proceedings of the European Conference on Computer Vision (ECCV), Munich, Germany, 8–14 September 2018; pp. 116–131. [Google Scholar]
- Yu, J.; Jiang, Y.; Wang, Z.; Cao, Z.; Huang, T. Unitbox: An advanced object detection network. In Proceedings of the 24th ACM International Conference on Multimedia, Amsterdam, The Netherlands, 15–19 October 2016; pp. 516–520. [Google Scholar]
- Gevorgyan, Z. SIoU loss: More powerful learning for bounding box regression. arXiv 2022, arXiv:2205.12740. [Google Scholar]
- Zhu, L.; Wang, X.; Ke, Z.; Zhang, W.; Lau, R.W. BiFormer: Vision Transformer with Bi-Level Routing Attention. In Proceedings of the IEEE/CVF Conference on Computer Vision and Pattern Recognition, Vancouver, BC, Canada, 18–22 June 2023; pp. 10323–10333. [Google Scholar]
- Zhu, X.; Hu, H.; Lin, S.; Dai, J. Deformable convnets v2: More deformable, better results. In Proceedings of the IEEE/CVF Conference on Computer Vision and Pattern Recognition, Long Beach, CA, USA, 15–20 June 2019; pp. 9308–9316. [Google Scholar]
- Wang, J.; Chen, K.; Xu, R.; Liu, Z.; Loy, C.C.; Lin, D. Carafe: Content-aware reassembly of features. In Proceedings of the IEEE/CVF International Conference on Computer Vision, Seoul, South Korea, 27 October–2 November 2019; pp. 3007–3016. [Google Scholar]
- Cao, J.; Pang, J.; Weng, X.; Khirodkar, R.; Kitani, K. Observation-centric sort: Rethinking sort for robust multi-object tracking. In Proceedings of the IEEE/CVF Conference on Computer Vision and Pattern Recognition, Vancouver, BC, Canada, 18–22 June 2023; pp. 9686–9696. [Google Scholar]
- Luiten, J.; Osep, A.; Dendorfer, P.; Torr, P.; Geiger, A.; Leal-Taixé, L.; Leibe, B. Hota: A higher order metric for evaluating multi-object tracking. Int. J. Comput. Vis. 2021, 129, 548–578. [Google Scholar] [CrossRef]
- Qin, X.; Li, N.; Weng, C.; Su, D.; Li, M. Simple attention module based speaker verification with iterative noisy label detection. In Proceedings of the ICASSP 2022–2022 IEEE International Conference on Acoustics, Speech and Signal Processing (ICASSP), Singapore, 22–27 May 2022; pp. 6722–6726. [Google Scholar]
- Woo, S.; Park, J.; Lee, J.Y.; Kweon, I.S. Cbam: Convolutional block attention module. In Proceedings of the European Conference on Computer Vision (ECCV), Munich, Germany, 8–14 September 2018; pp. 3–19. [Google Scholar]
- Liu, Y.; Shao, Z.; Hoffmann, N. Global attention mechanism: Retain information to enhance channel-spatial interactions. arXiv 2021, arXiv:2112.05561. [Google Scholar]
- Hu, J.; Shen, L.; Sun, G. Squeeze-and-excitation networks. In Proceedings of the IEEE Conference on Computer Vision and Pattern Recognition, Salt Lake City, UT, USA, 18–23 June 2018; pp. 7132–7141. [Google Scholar]
- Liu, W.; Anguelov, D.; Erhan, D.; Szegedy, C.; Reed, S.; Fu, C.Y.; Berg, A.C. Ssd: Single shot multibox detector. In Proceedings of the Computer Vision–ECCV 2016: 14th European Conference, Amsterdam, The Netherlands, 11–14 October 2016, Proceedings, Part I 14; Springer International Publishing: Cham, Switzerland, 2016; pp. 21–37. [Google Scholar]
- Simonyan, K.; Zisserman, A. Very deep convolutional networks for large-scale image recognition. arXiv 2014, arXiv:1409.1556. [Google Scholar]
- Ren, S.; He, K.; Girshick, R.; Sun, J. Faster r-cnn: Towards real-time object detection with region proposal networks. In Proceedings of the Advances in Neural Information Processing Systems 28 (NIPS 2015), Montreal, QC, Canada, 7–12 December 2015. [Google Scholar]
- Tan, M.; Pang, R.; Le, Q.V. Efficientdet: Scalable and efficient object detection. In Proceedings of the IEEE/CVF Conference on Computer Vision and Pattern Recognition, Seattle, WA, USA, 13–19 June 2019; pp. 10781–10790. [Google Scholar]
- Ge, Z.; Liu, S.; Wang, F.; Li, Z.; Sun, J. Yolox: Exceeding yolo series in 2021. arXiv 2021, arXiv:2107.08430. [Google Scholar]
- Wang, C.Y.; Bochkovskiy, A.; Liao, H.Y.M. YOLOv7: Trainable bag-of-freebies sets new state-of-the-art for real-time object detectors. In Proceedings of the IEEE/CVF Conference on Computer Vision and Pattern Recognition, Vancouver, BC, Canada, 18–22 June 2023; pp. 7464–7475. [Google Scholar]
- Jonathon, L.; Arne, H. TrackEval. Available online: https://github.com/JonathonLuiten/TrackEval (accessed on 21 June 2023).
- Zhang, Y.; Sun, P.; Jiang, Y.; Yu, D.; Weng, F.; Yuan, Z.; Luo, P.; Liu, W.; Wang, X. Bytetrack: Multi-object tracking by associating every detection box. In Proceedings of the European Conference on Computer Vision; Springer Nature Switzerland: Cham, Switzerland, 2022; pp. 1–21. [Google Scholar]
- Du, Y.; Zhao, Z.; Song, Y.; Zhao, Y.; Su, F.; Gong, T.; Meng, H. Strongsort: Make deepsort great again. IEEE Trans. Multimed. 2023. Early Access. [Google Scholar] [CrossRef]
Disclaimer/Publisher’s Note: The statements, opinions and data contained in all publications are solely those of the individual author(s) and contributor(s) and not of MDPI and/or the editor(s). MDPI and/or the editor(s) disclaim responsibility for any injury to people or property resulting from any ideas, methods, instructions or products referred to in the content. |
© 2023 by the authors. Licensee MDPI, Basel, Switzerland. This article is an open access article distributed under the terms and conditions of the Creative Commons Attribution (CC BY) license (https://creativecommons.org/licenses/by/4.0/).