Article

Stray Currents in Livestock Farming: Electrical Diagnosis in Farms

1
University Limoges, CNRS, XLIM, UMR 7252, F-87000 Limoges, France
2
University Limoges, IUT, 12 Allée André Maurois, F-87065 Limoges, France
3
University Limoges, ENSIL-ENSCI, 16 rue Atlantis, F-87280 Limoges, France
*
Author to whom correspondence should be addressed.
Agriculture 2023, 13(10), 2010; https://doi.org/10.3390/agriculture13102010
Submission received: 11 September 2023 / Revised: 6 October 2023 / Accepted: 12 October 2023 / Published: 17 October 2023
(This article belongs to the Section Digital Agriculture)

Abstract

:
For several years, farmers have been questioning the effects of electromagnetic fields and stray electrical currents on the health of their animals. Observing changes in behavior or a decline in livestock productivity, farmers suspect that electrical installations on or near the farm may be responsible. Indeed, these systems can generate fault currents or stray currents, some of which may pass through the animals, affecting their well-being and productivity. To identify the origin and address this issue, an electrical diagnosis can be performed. In this study, diagnostics were carried out in eleven bovine farms considered “healthy”. These measurements included earth resistance equipment insulation resistance, continuity, leakage currents, as well as contact and step voltages, with some farms presenting non-conformities. This study will better understand the potential links between electrical installations and animal well-being, correlate the results of this study with those obtained in diagnostics conducted on farms experiencing such concerns and implement appropriate preventative and corrective measures.

1. Introduction

In 1948, Churchwood, an Australian researcher, suggested that currents from electrical equipment in the milking area could have a negative effect on cows [1]. Similar statements were published a few years later in New Zealand by Phillips [2,3].
The first cases of stray voltage in North America were reported in the state of Washington in 1969 [4], and then in Canada in 1975 [5].
Initially, these cases were considered unusual and localized, and thus received little attention and media coverage in popular press and specialized journals. Starting from 1977, many farms in the upper Midwest and on the East Coast of the United States and Canada were identified as having stray voltage/current issues. Between 1978 and 1982, several detailed bulletins from the Extension Service were published, addressing the identification and resolution of stray voltage/current problems. The one by Cloud et al. [6] was widely distributed throughout the United States. and recommends checking the electrical system, ensuring that all service entrance earthing is adequate, looking for faulty equipment likely to present leakage currents, and earthing all electrical equipment such as manure pumps, silo unloaders, water heaters and water pumps at the service entrance.
In France, two protocols exist, drawn up by the CNIEL [7] and the GPSE [8]. This electrical diagnosis is sometimes supplemented by an analysis of the sanitary situation and, in some cases, by a geobiological diagnosis. But even with these protocols, it has not always been possible to conclude on the causes of the problems.
There are many reasons for the presence of these stray currents and voltages in a farm. Some may come from external sources, such as the Very Hight Voltage/Hight Voltage (VHV/HV) electrical network [9,10], the railway network [11] and the communication network (GSM, 3G, 4G, 5G) [12] which can produce stray currents spreading in the farm’s soils and rising via the grounding and metal parts [13]. However, in the majority of cases, they directly originate from the farm’s internal electrical system and are the result of equipment insulation faults [14], poor continuity of a protective conductor, faulty grounding [15], or improper equipotential bonding between metal structures [16].
Some of these currents can pass through the animal if it is in contact with a conductor (such as headlocks, drinkers, milking machines, etc.) or simply when the animal moves around the farm due to the conductivity of the soils and their variability [17]. These currents are suspected to have detrimental effects on animal well-being. A meta-analysis based on 22 publications demonstrated that the perception threshold ranges between 2 and 8 mA [18] for a frequency of 50/60 Hz, with initial behavioral reactions typically occurring around 3 mA. Similar results were obtained in a subsequent study on heifers [19].
The objective of this article Is to present various intervention and analysis methodologies aimed at assessing the impact of parasitic currents on farms.
Firstly, this study will detail the various measurement methods, including earth resistance, equipment insulation resistance, continuity, leakage currents, as well as contact and step voltages. Secondly, it will present the results of measurements carried out on eleven cattle farms considered ‘healthy’, meaning that no changes in behavior or a decrease in the quality or quantity of milk were identified.

2. Materials and Methods

In the context of our study, an electrical diagnosis, including 5 different types of measurements that could be the source of harmful stray currents, was conducted on 11 healthy (without apparent defects) farms (Table 1).
The objective of the study is to determine the thresholds corresponding to each of the measurements that can be considered as having no effect on the animal. Some of these measurements are normative and adapted to the protection of people and property, but not necessarily to livestock. Others, although essential for this type of diagnosis, are not standardized.

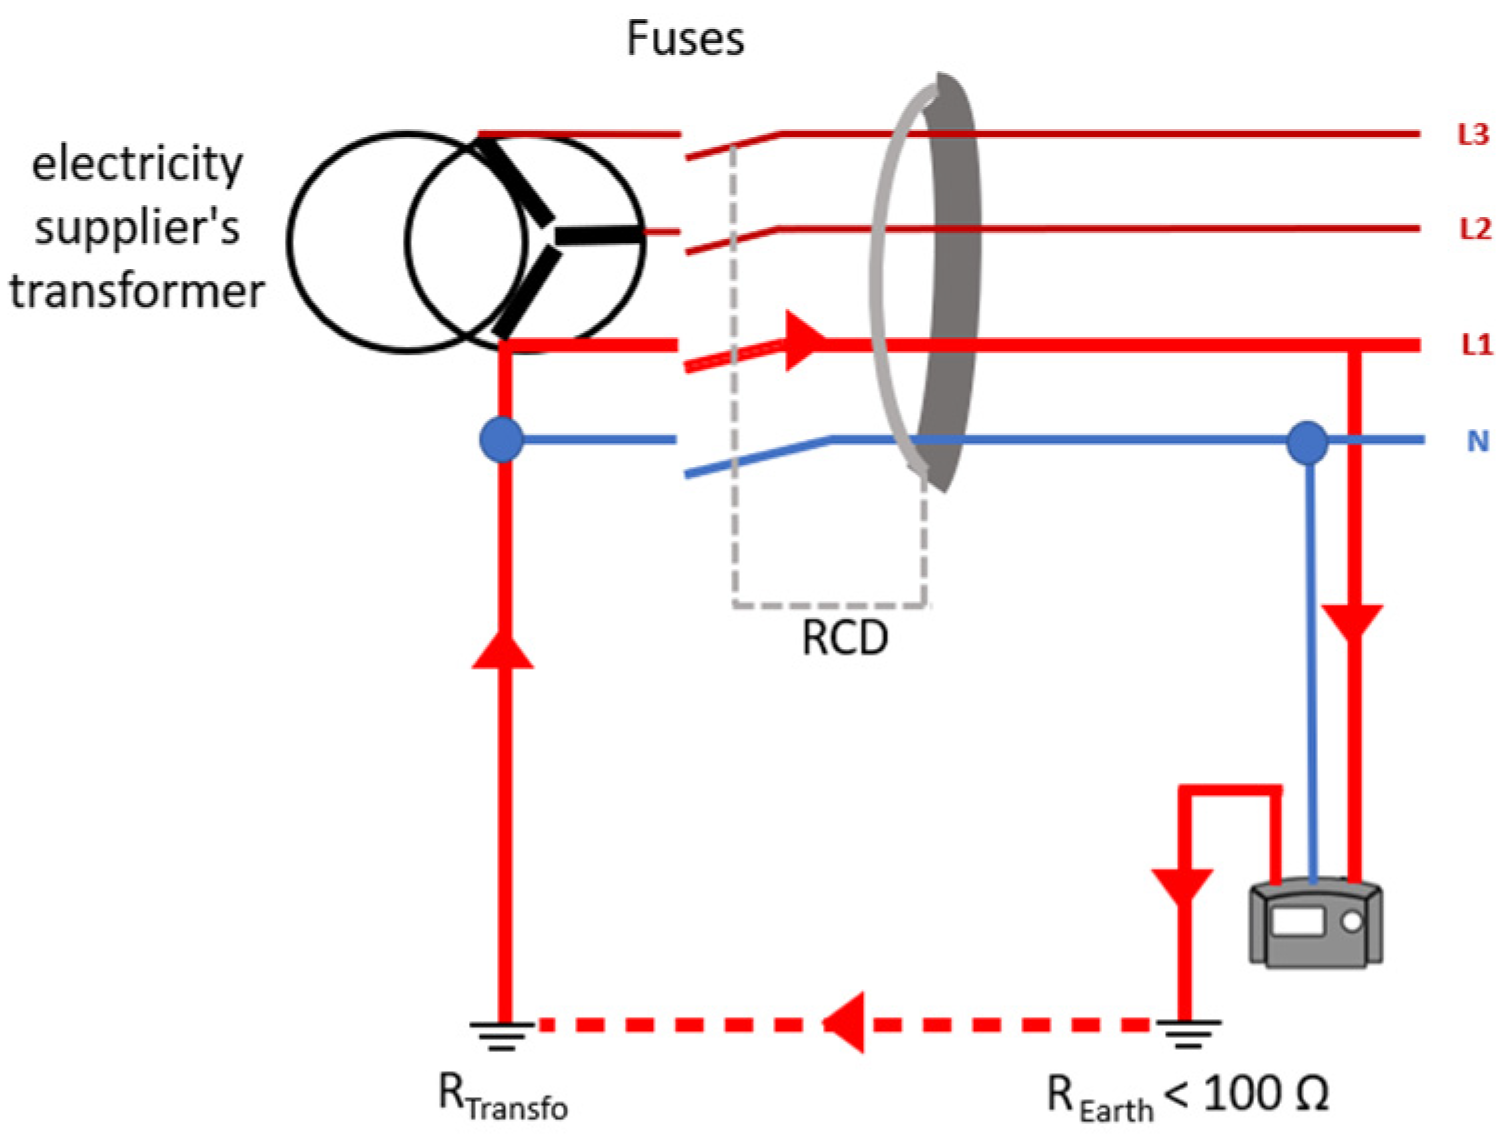
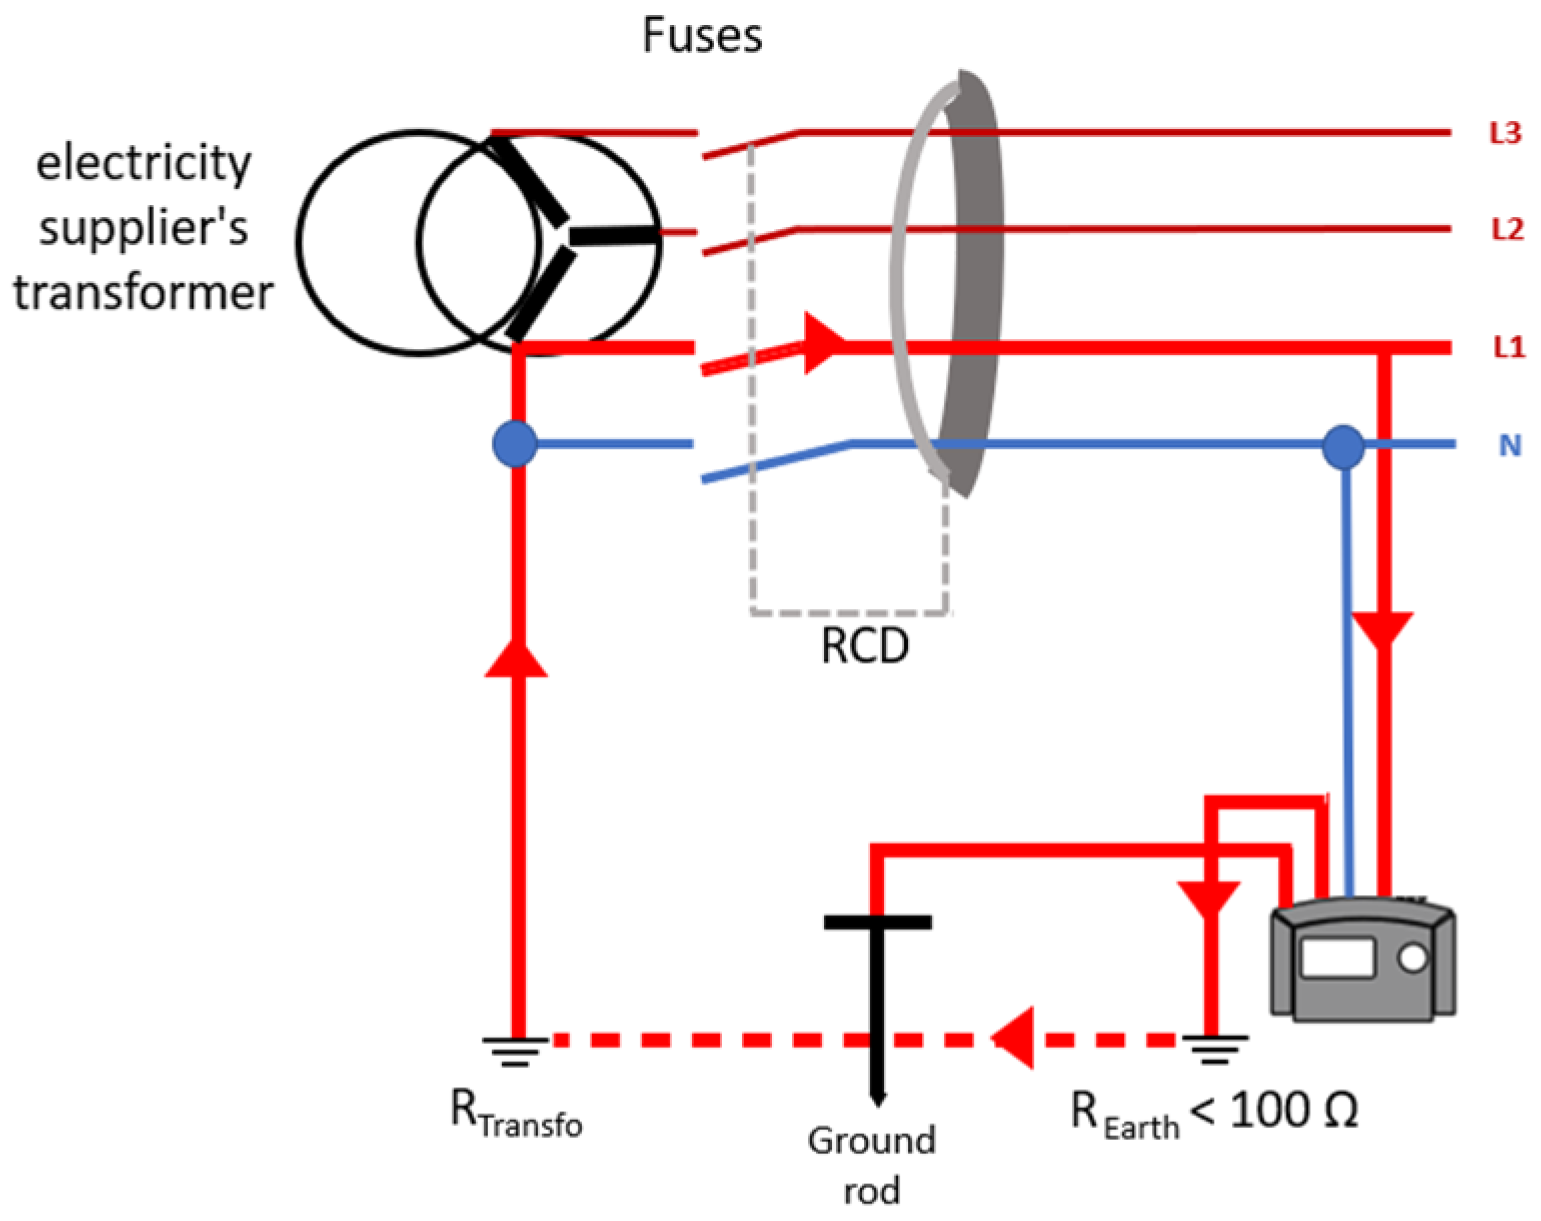
2.1. Earth Resistance Measurement

The role of the grounding system is to protect people, animals and property against insulation faults in an energized equipment. The protective conductors (PE) and the grounding system are used to dissipate fault currents, also known as leakage currents, into the ground.
To ensure the safety of a property and people, general Residual Current Devices (RCDs) must trip (at a current of 500 mA) as soon as a “fault voltage” circulating in the installation exceeds the limit voltage accepted by the human body, which is 50 V AC for dry locations (corresponding to a current of 30 mA, considering a human body resistance of around 2000 Ω).
According to Equation (1), the value of earth resistance not to be exceeded for property safety is 100 Ω, according to the NF C 15 100 standard [20].
R E a r t h = U I = 50   V 0.5   A = 100  
In our study, the measurement of the earth resistance of agricultural buildings is carried out using a Chauvin Arnoux CA 6115N (portable test and measurement instruments, Chauvin Arnoux, Reux, France) installation tester.
Two methods can be used for this measurement. The loop impedance method (Figure 1) provides an overestimated value that includes the resistance of the earthing of the low voltage (LV) masses of the installation, the earthing of the transformers neutral of the distribution, the cable resistance and the soil resistivity.
The auxiliary earth electrode method (Figure 2) can also be used. This method also provides an accurate measurement of earth resistance. It involves adding an auxiliary earth electrode (earth spike), located 62% away from the house’s earthing strip, in relation to the earthing point of the general transformer. This rod is then used to measure the ground resistance of the building alone, excluding other elements such as soil resistivity. This method can provide a more specific assessment of the earth resistance of the building itself.

2.2. Insulation Resistance Measurement

An equipment with an insulation fault can trigger protection devices (fuse, RCD), fail, burn, cause a fire, and present an electrical hazard to people or animals (stress, electrification, electrocution).
The minimum value of insulation resistance for active conductors (phase, neutral) compared to the protective conductor PE must not be less than 500 kΩ, according to the NF C 15-100 standard [20].
Indeed, it is necessary to ensure that the current resulting from insulation faults does not exceed 0.5 mA, the perception threshold at 50 Hz for humans [22], which corresponds to the requirement of the 500 kΩ in the standard (Equation (2) and Figure 3).
U = R h .   I = V R M S . R h R i + R h
R i = V R M S I R h = 230 0.0005 2200 = 457800  
In our study, the measurement of insulation fault resistance of the devices is performed using a Chauvin Arnoux CA 6115N installation tester (Figure 4). The device injects a relatively high DC voltage (500 V) between the active conductors (phase and neutral) and earth. This voltage is generated by the device itself. The injected voltage passes through the insulation of the cables and components of the circuit under test. If the insulation is in good condition, the voltage should not flow significantly through it. However, if the insulation has defects, such as cracks, cuts, conductive impurities or high levels of humidity, some of the voltage will be dissipated through these defects. So, the device measures the resulting electrical resistance between the active conductors (phase and neutral) and earth, as well as between the active conductors.

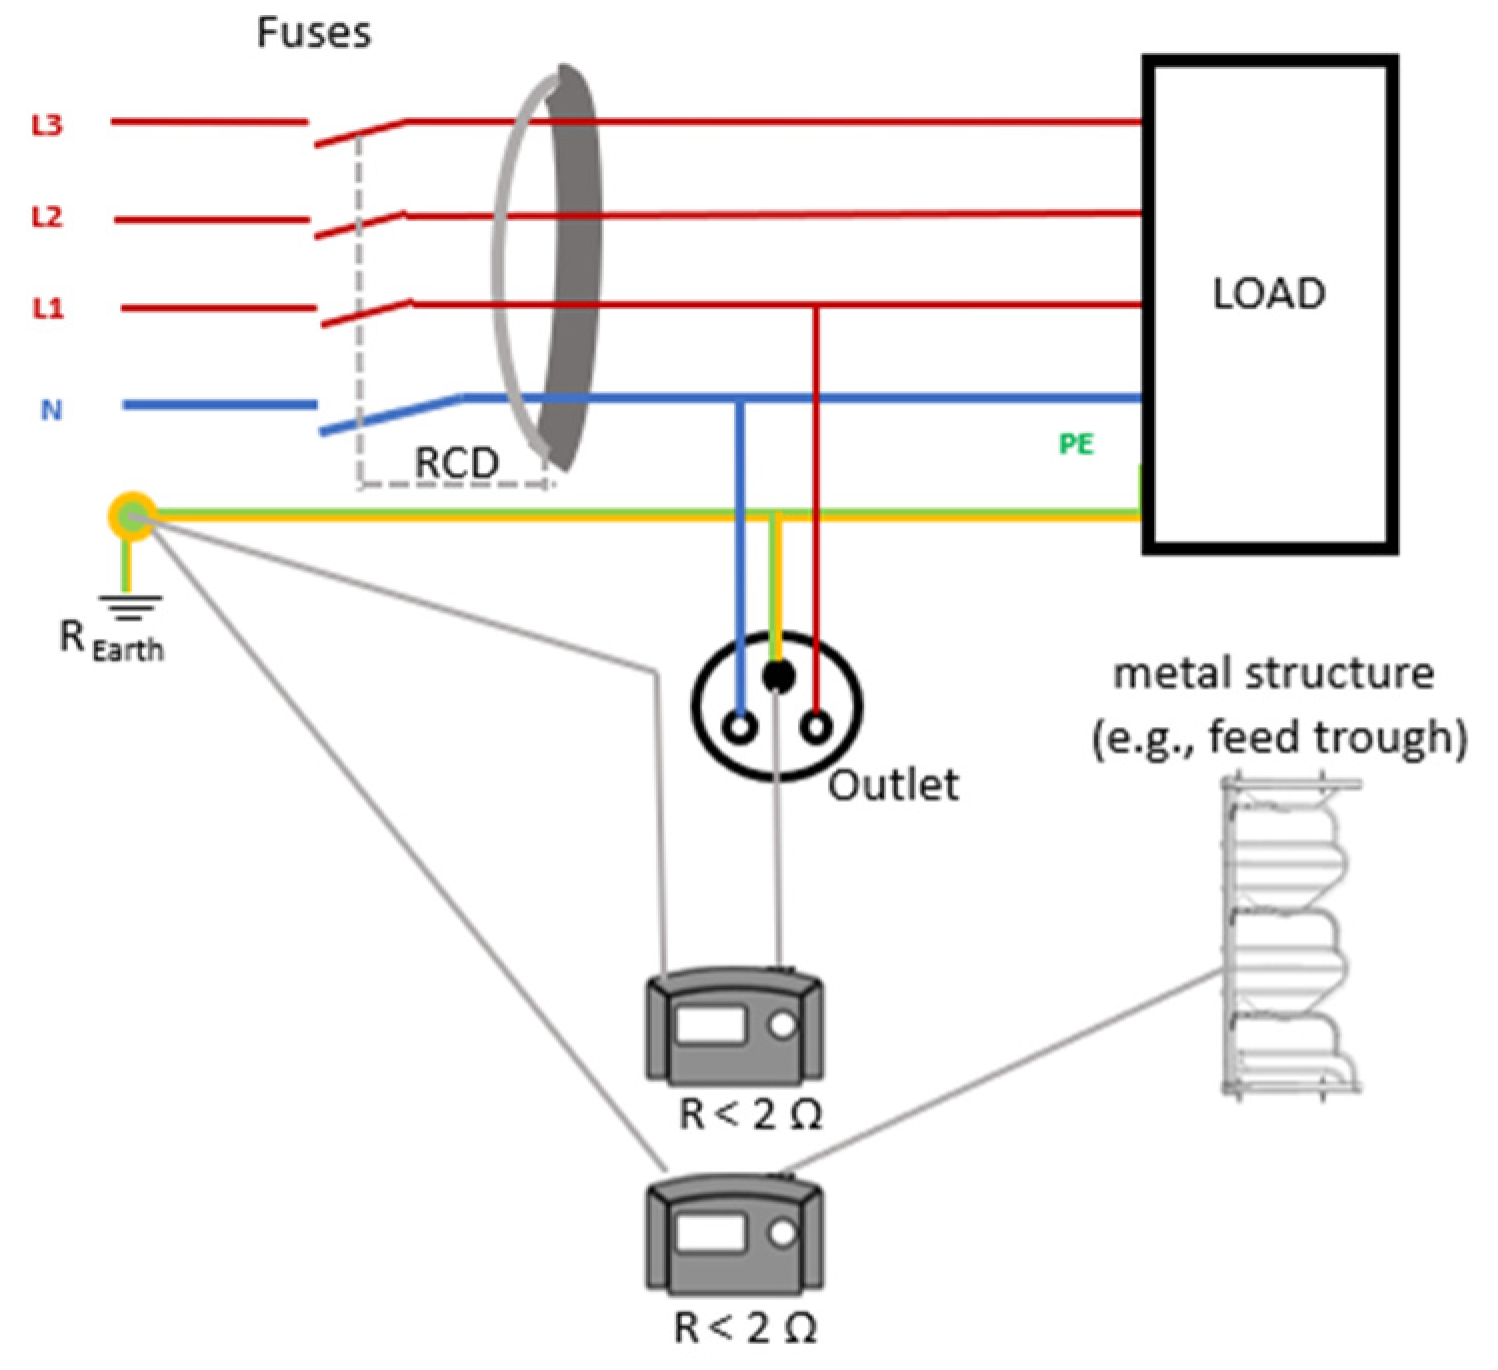
2.3. Measurement of Continuity and Equipotential Bonding

All electrical appliance metal parts and metallic pipelines must be interconnected with a conductor connected to the same earth connection. The objective is to prevent any potential difference between conductive elements within a building.
In the case of continuity, the theoretical resistance should be zero, but the resistance of the copper cables used to achieve this continuity must be taken into account.
The resistance of a cable follows Equation (3).
R = ρ L S
with:
ρ: The resistivity of the copper cable (0.01724 Ω. mm2/m).
L: The length of the cable. It is considered that in a building, the length of the cable does not exceed 175 m.
S: The cross-sectional area of the cable, typically 1.5 mm2.
The resistance of a cable is calculated using the following Equation (3):
R = 0.01724 · 10 6 · 175 1.5 · 10 6 = 2  
In our study, the continuity measurement was carried out using the Chauvin Arnoux CA 6115N installation tester (Figure 5). The device sends a test voltage of 18V DC between the metal elements to be tested (e.g., between the chassis of a device and a metal pipe) and the ground. The injected voltage flows through the conductive elements of the circuit. If all elements are correctly connected, the voltage flows freely without any significant voltage drop. The device then measures the resulting electrical resistance between the metal elements under the test and the ground. This resistance is measured in ohms (Ω) and represents the ability of the elements to carry electric current. The lower the resistance, the better the electrical continuity.
In addition to continuity measurement, the equipotential bonding measurement can also be performed, which also aims to prevent a potential difference between metallic elements within a building. This measurement is not subject to norms or laws, but it is recommended not to exceed 0.2 Ω. According to Equation (3), a resistance of 0.2 Ω corresponds to 17.5 m of cables, allowing the equipotential bonding between structures that can be simultaneously touched by the animal. Ideally, it should be closer to 0.03 Ω, which corresponds to a distance of 3 m. However, it is important to note that measurements of such low resistances are subject to significant uncertainties when performed using a multimeter, hence the value of 0.2 Ω.

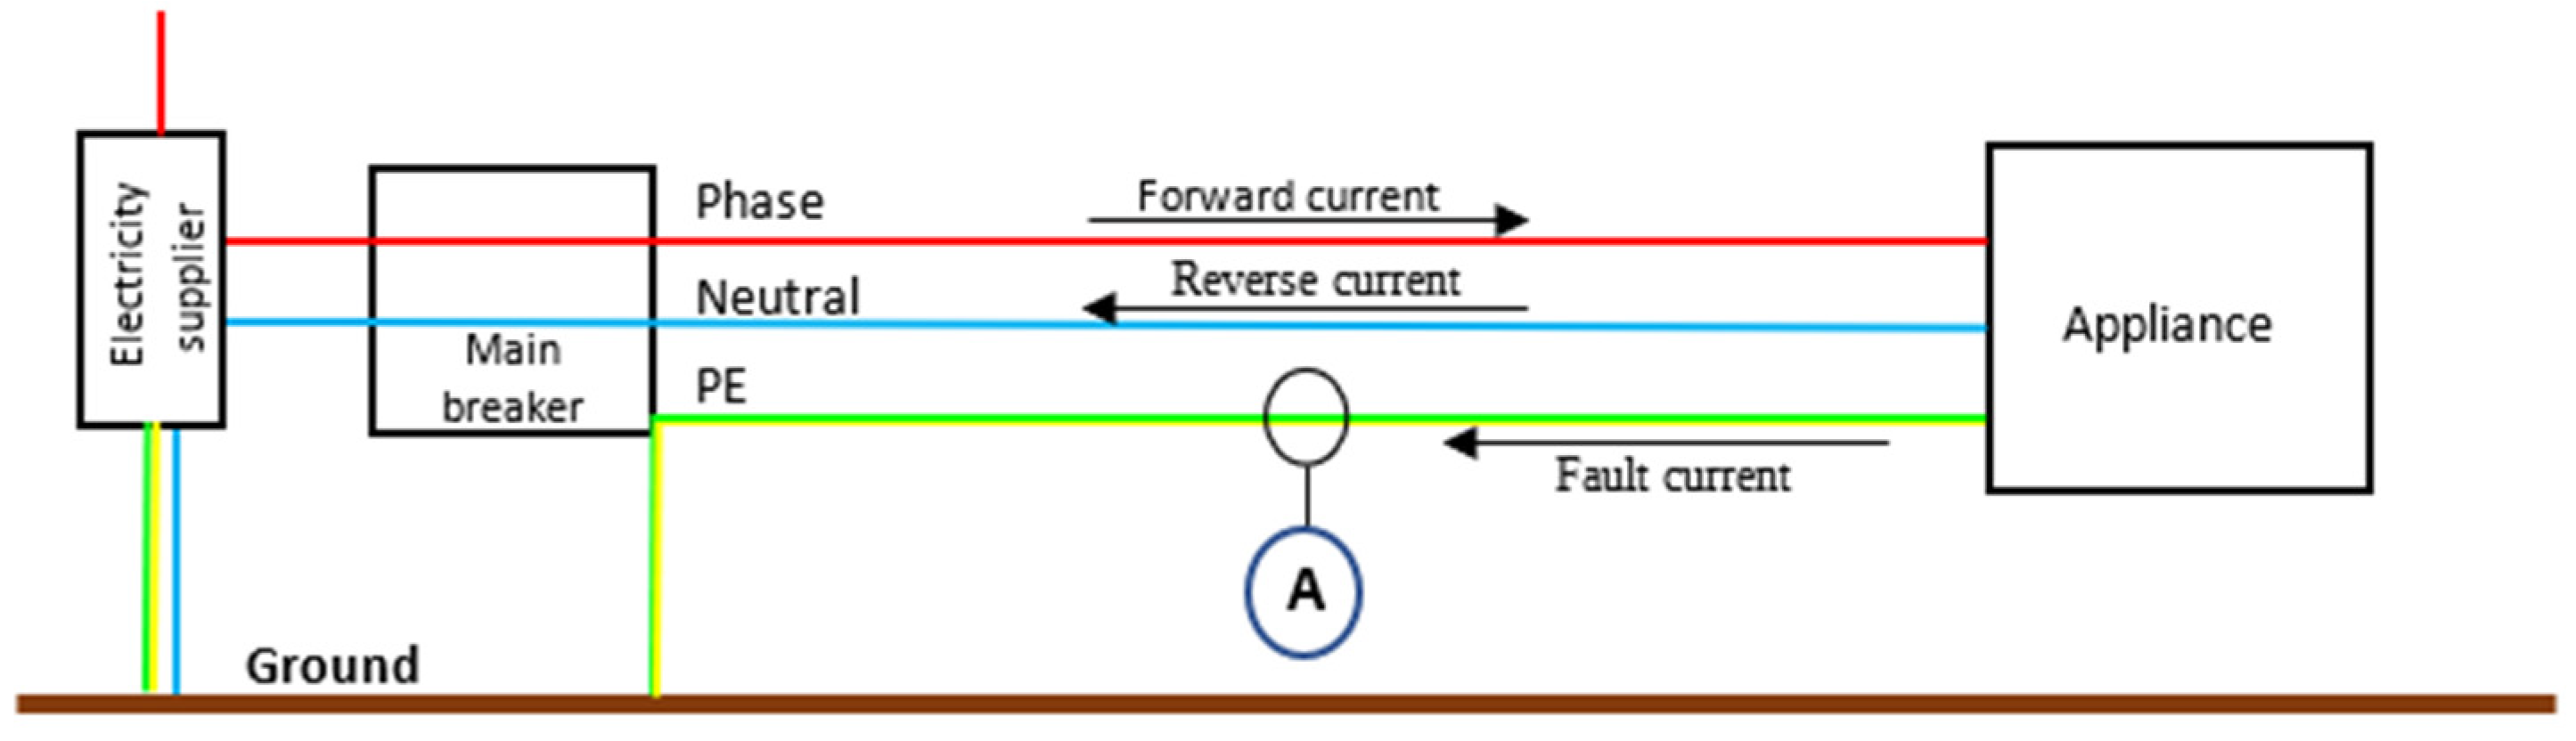
2.4. Measurement of Equipment Leakage Currents

Leakage current corresponds to a loss of electrical current to the ground or to conductive elements such as water or a metal object. It is usually measured by connecting an ammeter clamp to the protective conductor of the equipment (Figure 6).
In our study, the maximum, minimum, and effective current values of the devices during their operating cycle will be collected every second for frequencies ranging from 30 Hz to 2 kHz during their operating cycle. The sampling period for the measurement points is 20 μs. This measurement, although non-normative, aims to draw a parallel between the leakage currents of equipment and the stray currents circulating in the soils, both of which can have an impact on livestock animals.

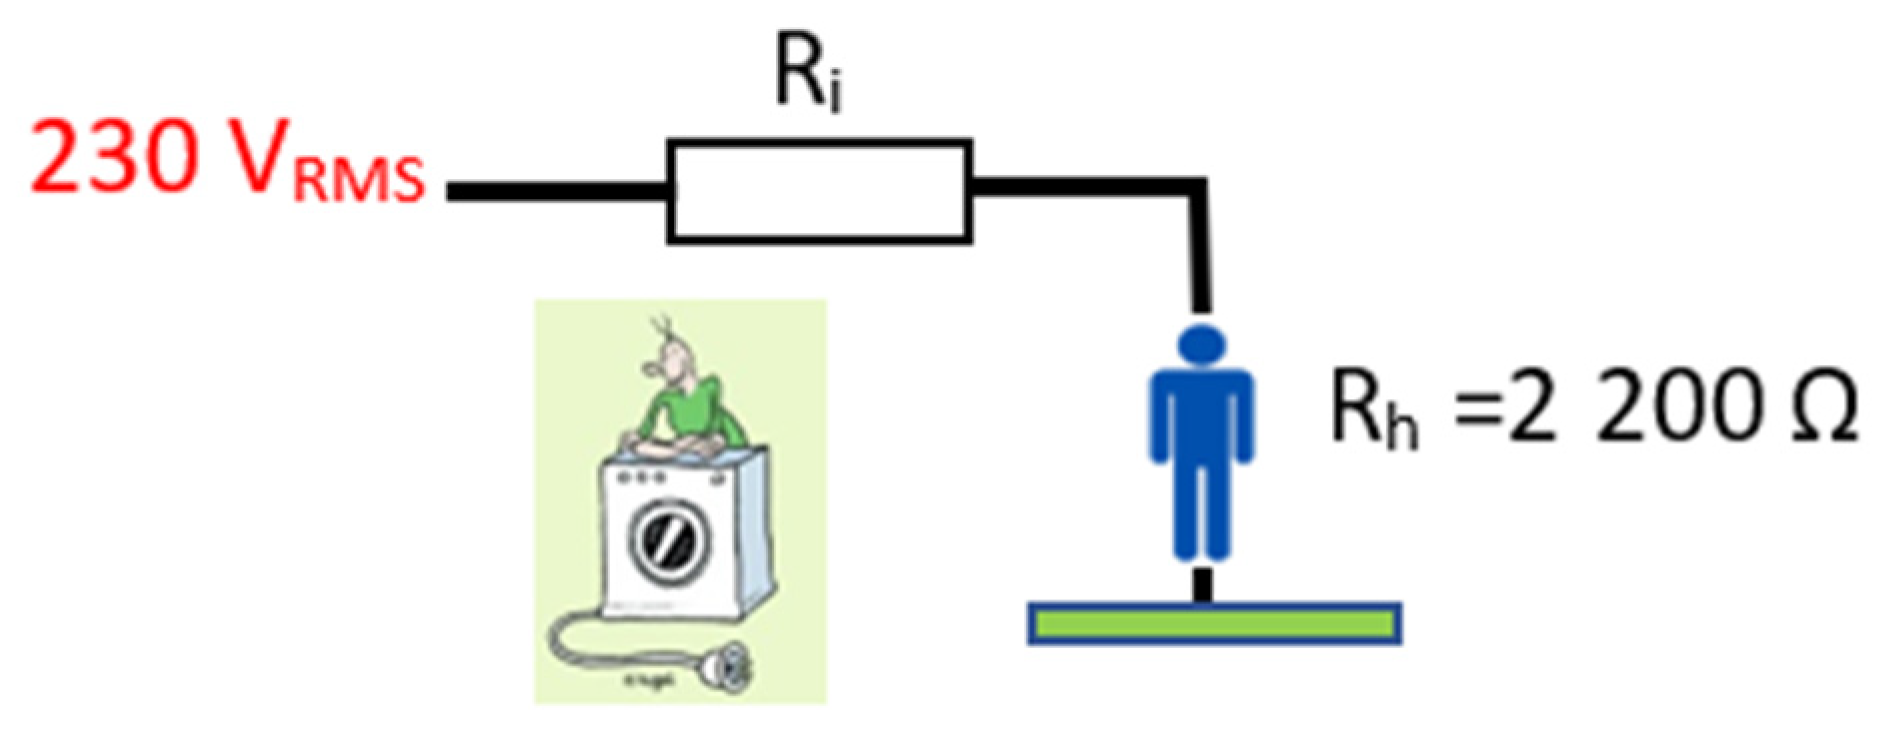
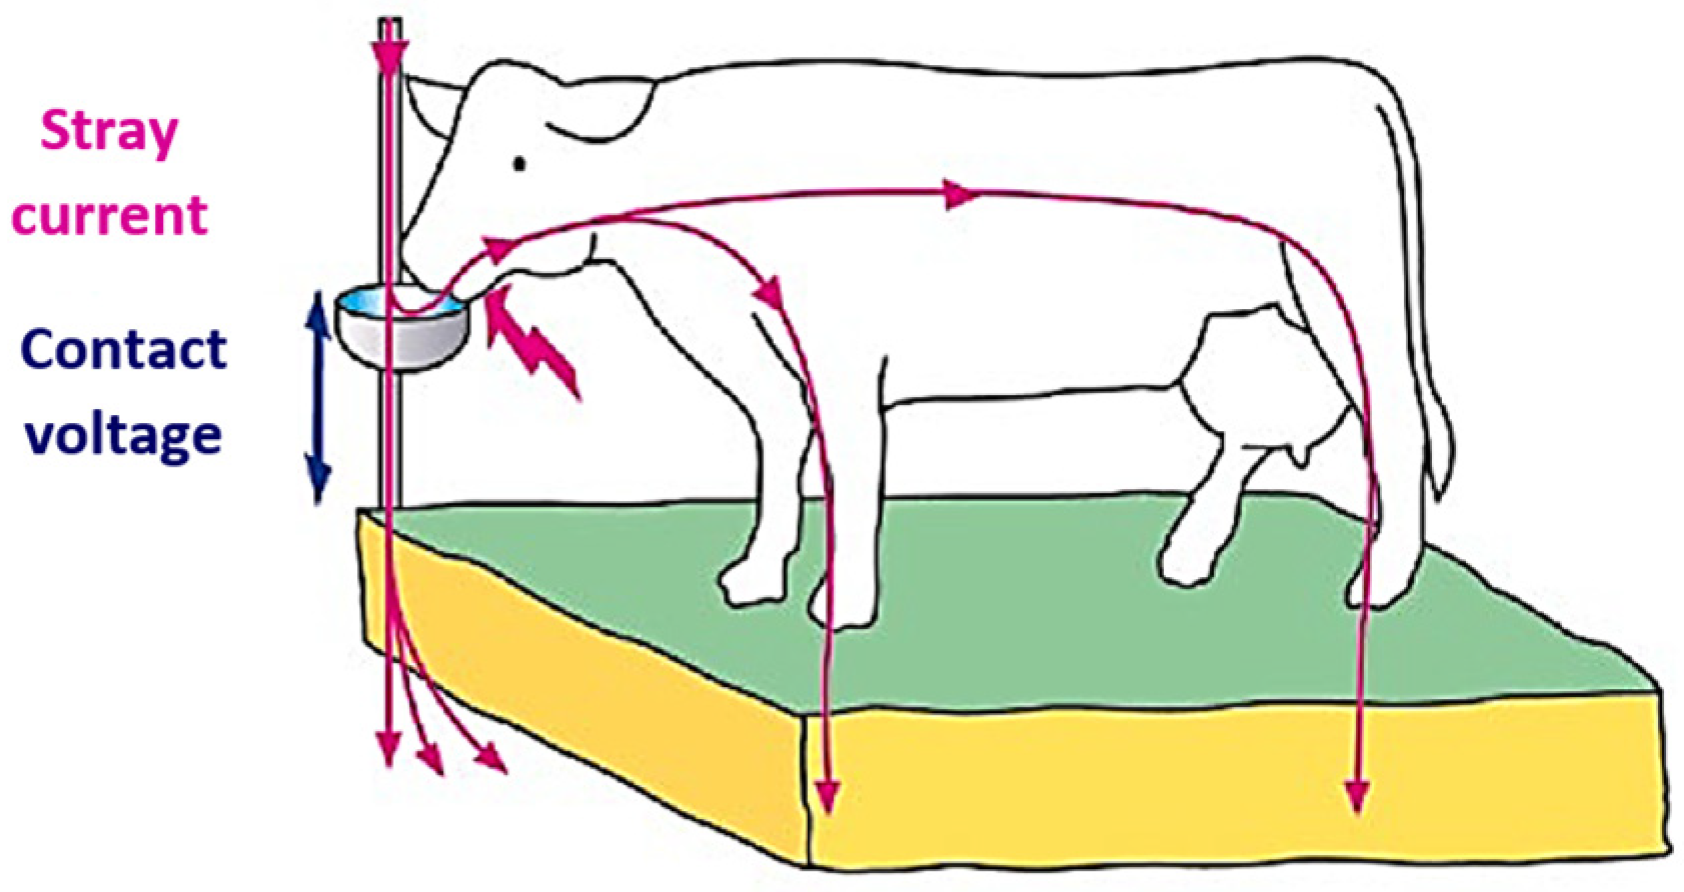
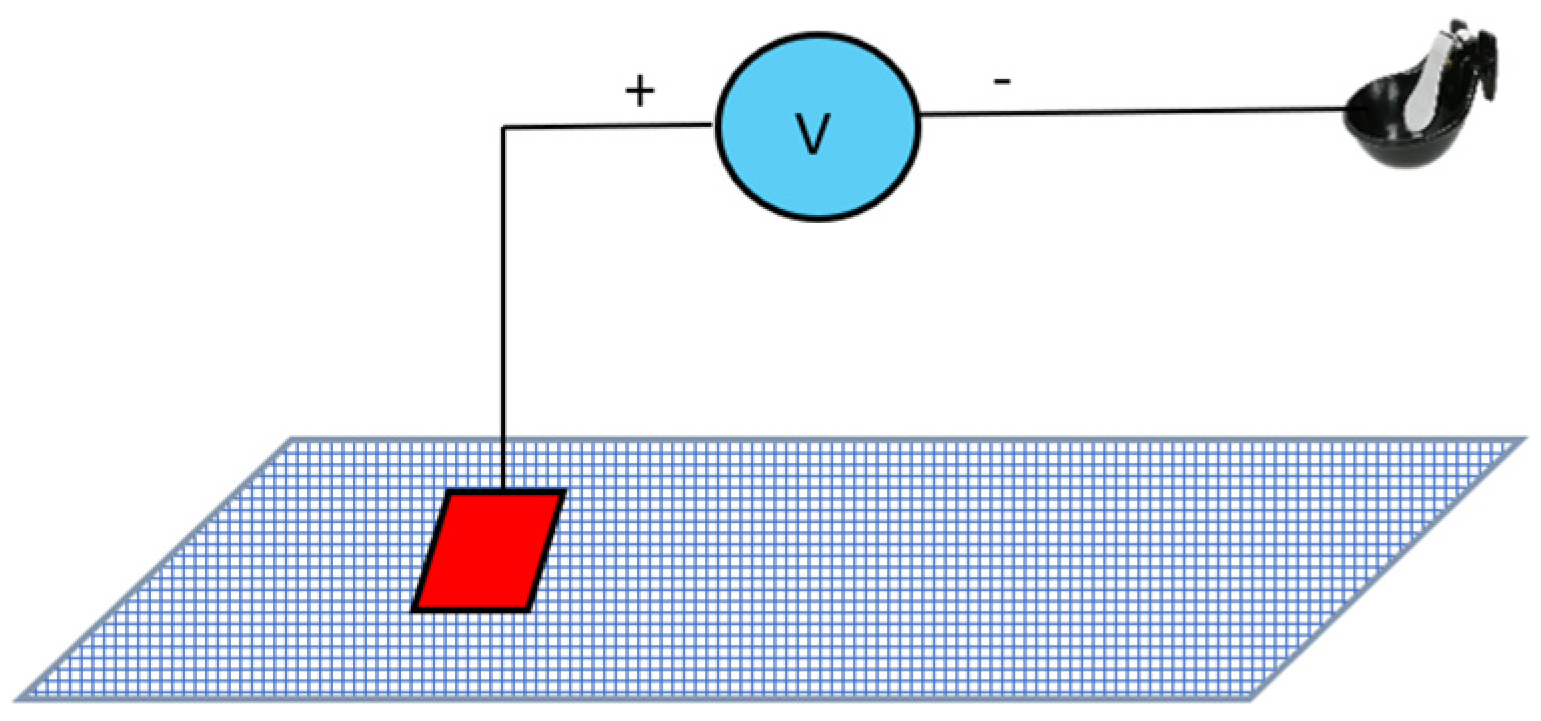
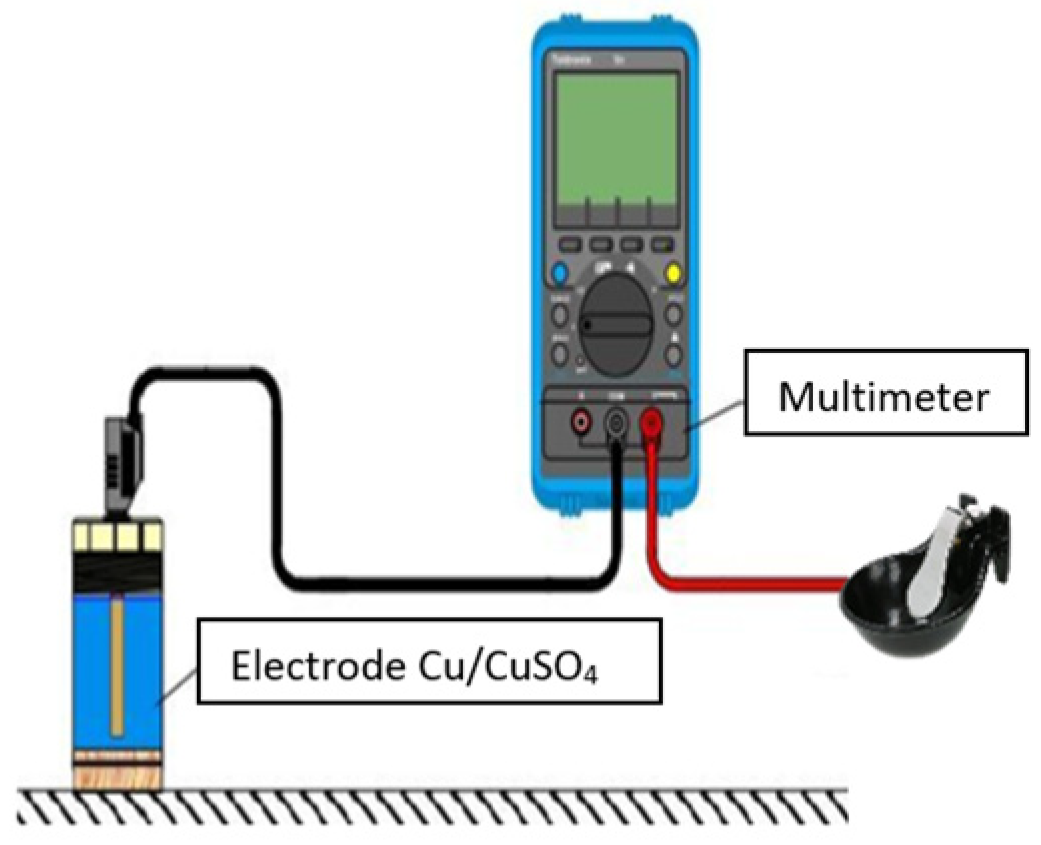
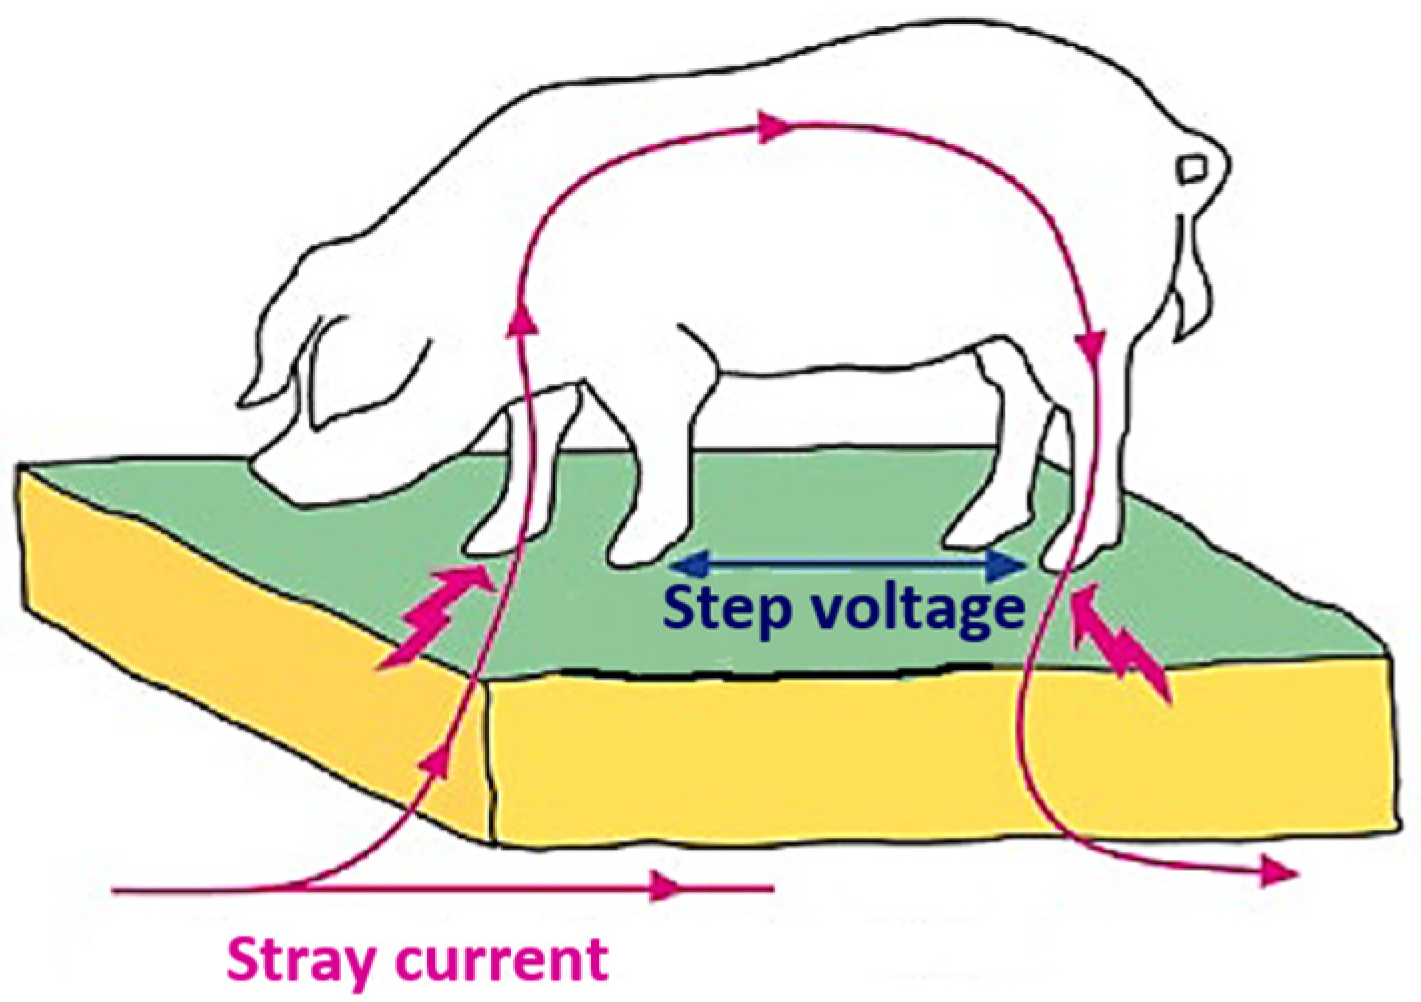
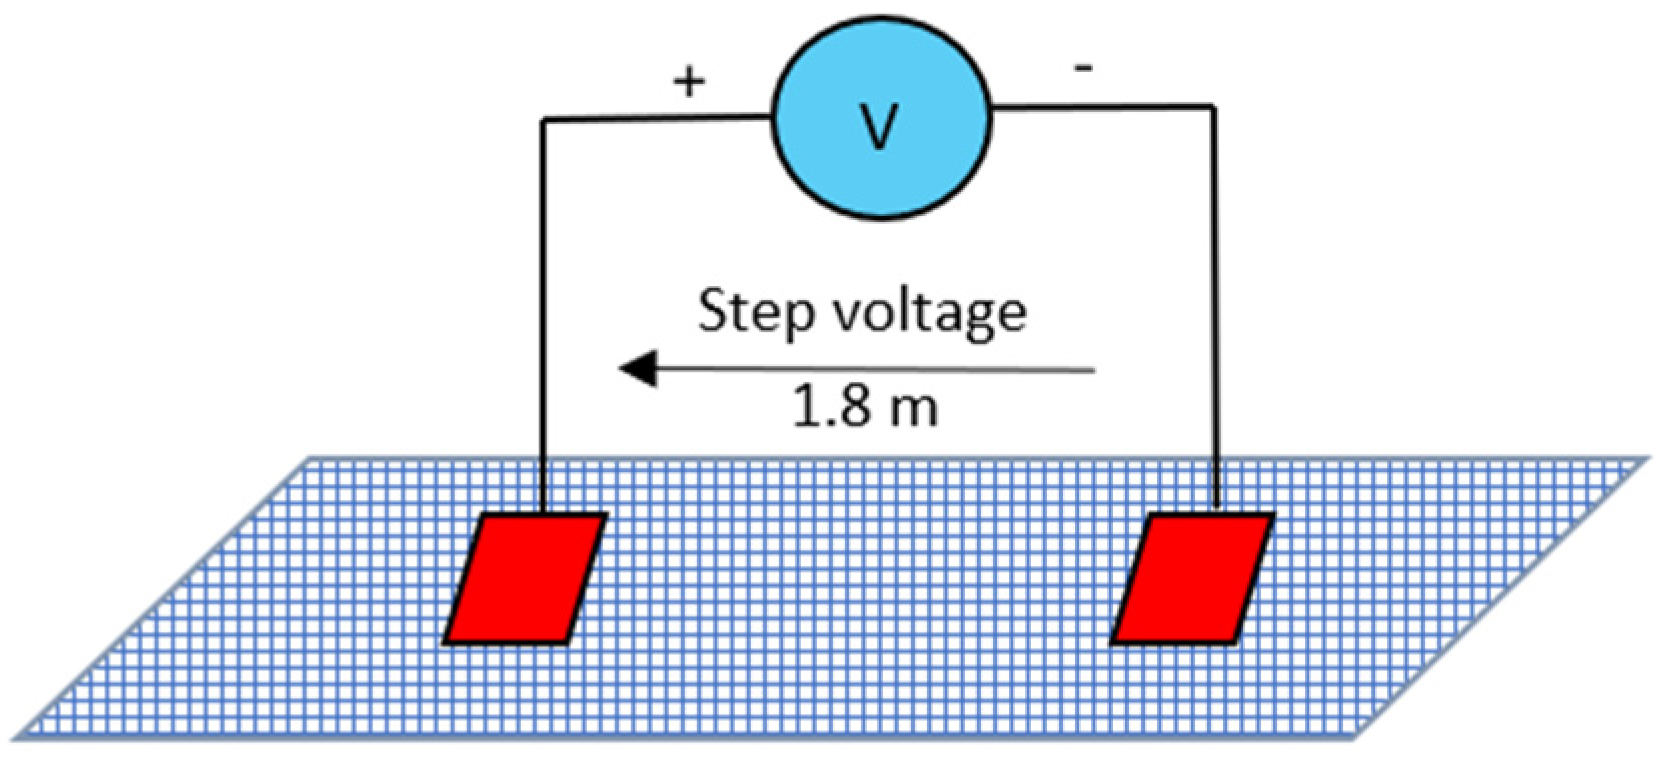
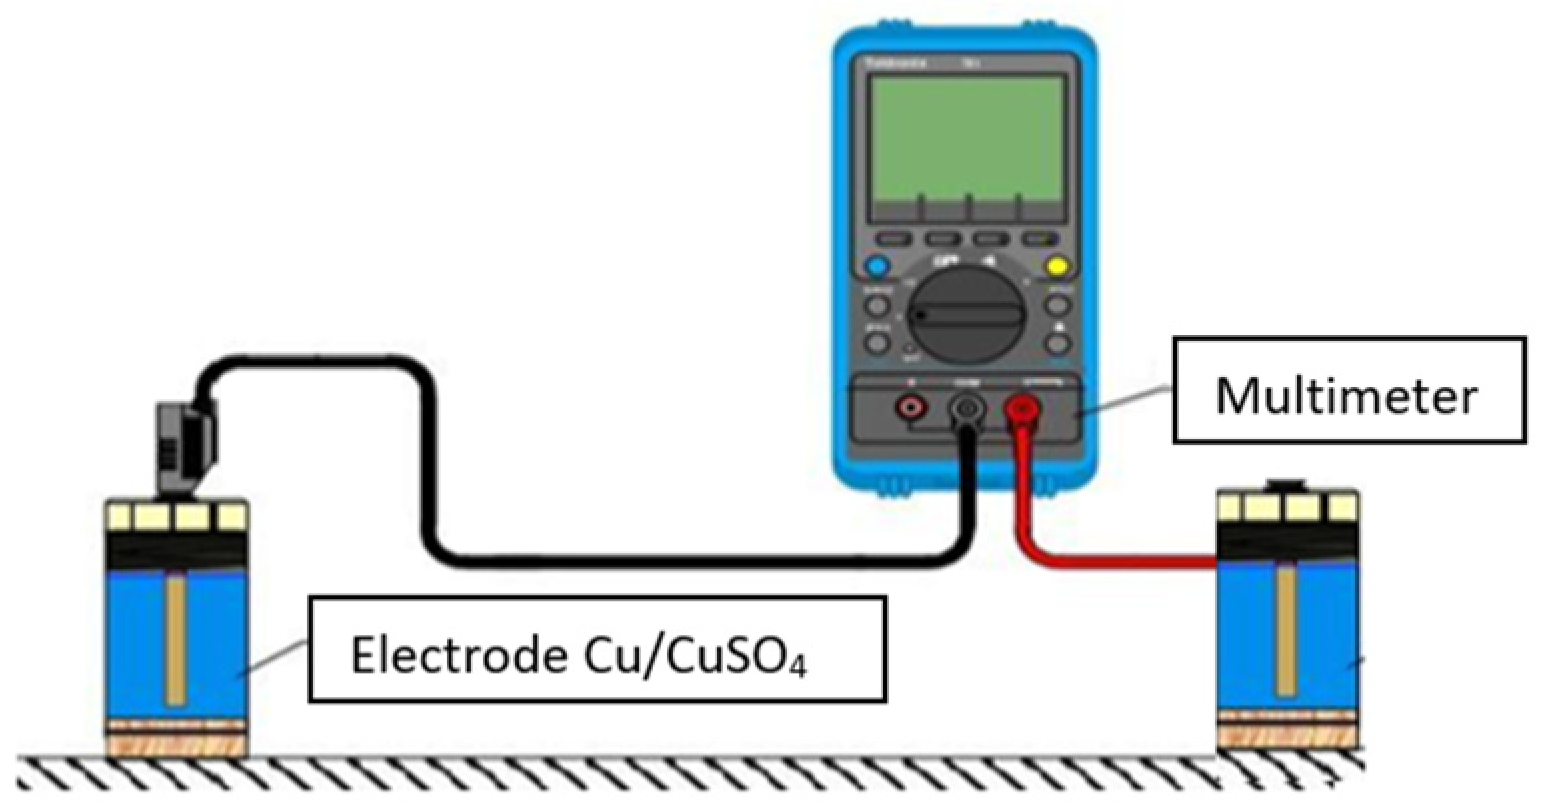
2.5. Measurement of Contact and Step Voltages

Contact voltages refer to the voltages between an object accessible to the animal and the ground, as well as between two accessible objects (Figure 7). These measurements were taken at different locations where cows could potentially be exposed to such voltages, whether they are AC or DC. For AC measurements, a multimeter was used in conjunction with a moistened metal plate to ensure better contact with the ground (Figure 8). On the other hand, for DC measurements, the use of a Cu/CuSO4 reference electrode was preferred (Figure 9).
As for step voltages, they correspond to the voltages between the front and rear legs of an animal (Figure 10). These measurements were taken at various strategic locations in the farms, taking into account the dimensions of a cow’s front and rear legs (approximately 1.8 m), with an emphasis on areas of ground discontinuity. For AC measurements, a multimeter and two moistened metal plates were used (Figure 11). For DC measurements, two Cu/CuSO4 reference electrodes were used (Figure 12).
These voltages (contact or step voltages) are not subject to specific standards. However, for AC voltages, it is advisable not to exceed 1 V, which corresponds to a current of 2 mA for a 500 Ω cow, as studies [24] have shown that this threshold does not have any detrimental effects on dairy cows (Figure 13). For DC voltages, fewer studies have been conducted [25], but considering the same threshold as for AC voltages seems to be appropriate.

3. Results and Discussion

3.1. Earth Resistance Measurement

The measurement of earth resistance on the 11 expert-reviewed farms is in compliance with the NF-C-15-100 standard [20] in 73% of the cases and does not exceed 100 Ω. However, it is observed that in some farms, even those considered healthy, defects are found (Table 2).

3.2. Insulation Resistance Measurement

For the insulation resistance measurement, out of 11 farms, only 4 were in compliance with the standard (Table 3). In the other farms, between one and five devices had at least one insulation resistance below 500 kΩ. In two cases, a safety hazard for people was identified.
The insulation of equipment corresponds to the parallel association of a resistance with capacitors. The measurement conducted only takes into account the resistive part of the insulation, providing information on the steady-state condition of the measurement and not the transient state. As a result, variations in the electrical cycle of the equipment are not considered, nor are rapid phenomena such as motor or compressor startup, devices with switching power supplies, or the inrush current during the lighting of a bulb.

3.3. Measurement of Continuity and Equipotential Bonding

Overall, 100% of the farms that underwent an assessment in the context of this study did not meet the standard for continuity (<2 Ω) (Table 4) and had unsatisfactory resistance for equipotential bonding (<0.2 Ω) (Table 5).
Regarding continuity, the number of non-compliant measurements (>2 Ω) was 167 out of a total of 396 measurements, which represents 42%.
For equipotential bonding, the number of non-compliant measurements (>0.2 Ω) was 87 out of a total of 96 measurements, which corresponds to 90%.
The non-compliances can be explained by the fact that no metal structure, metal barrier, feed barrier, etc., is interconnected to the general grounding system of the building and among themselves.

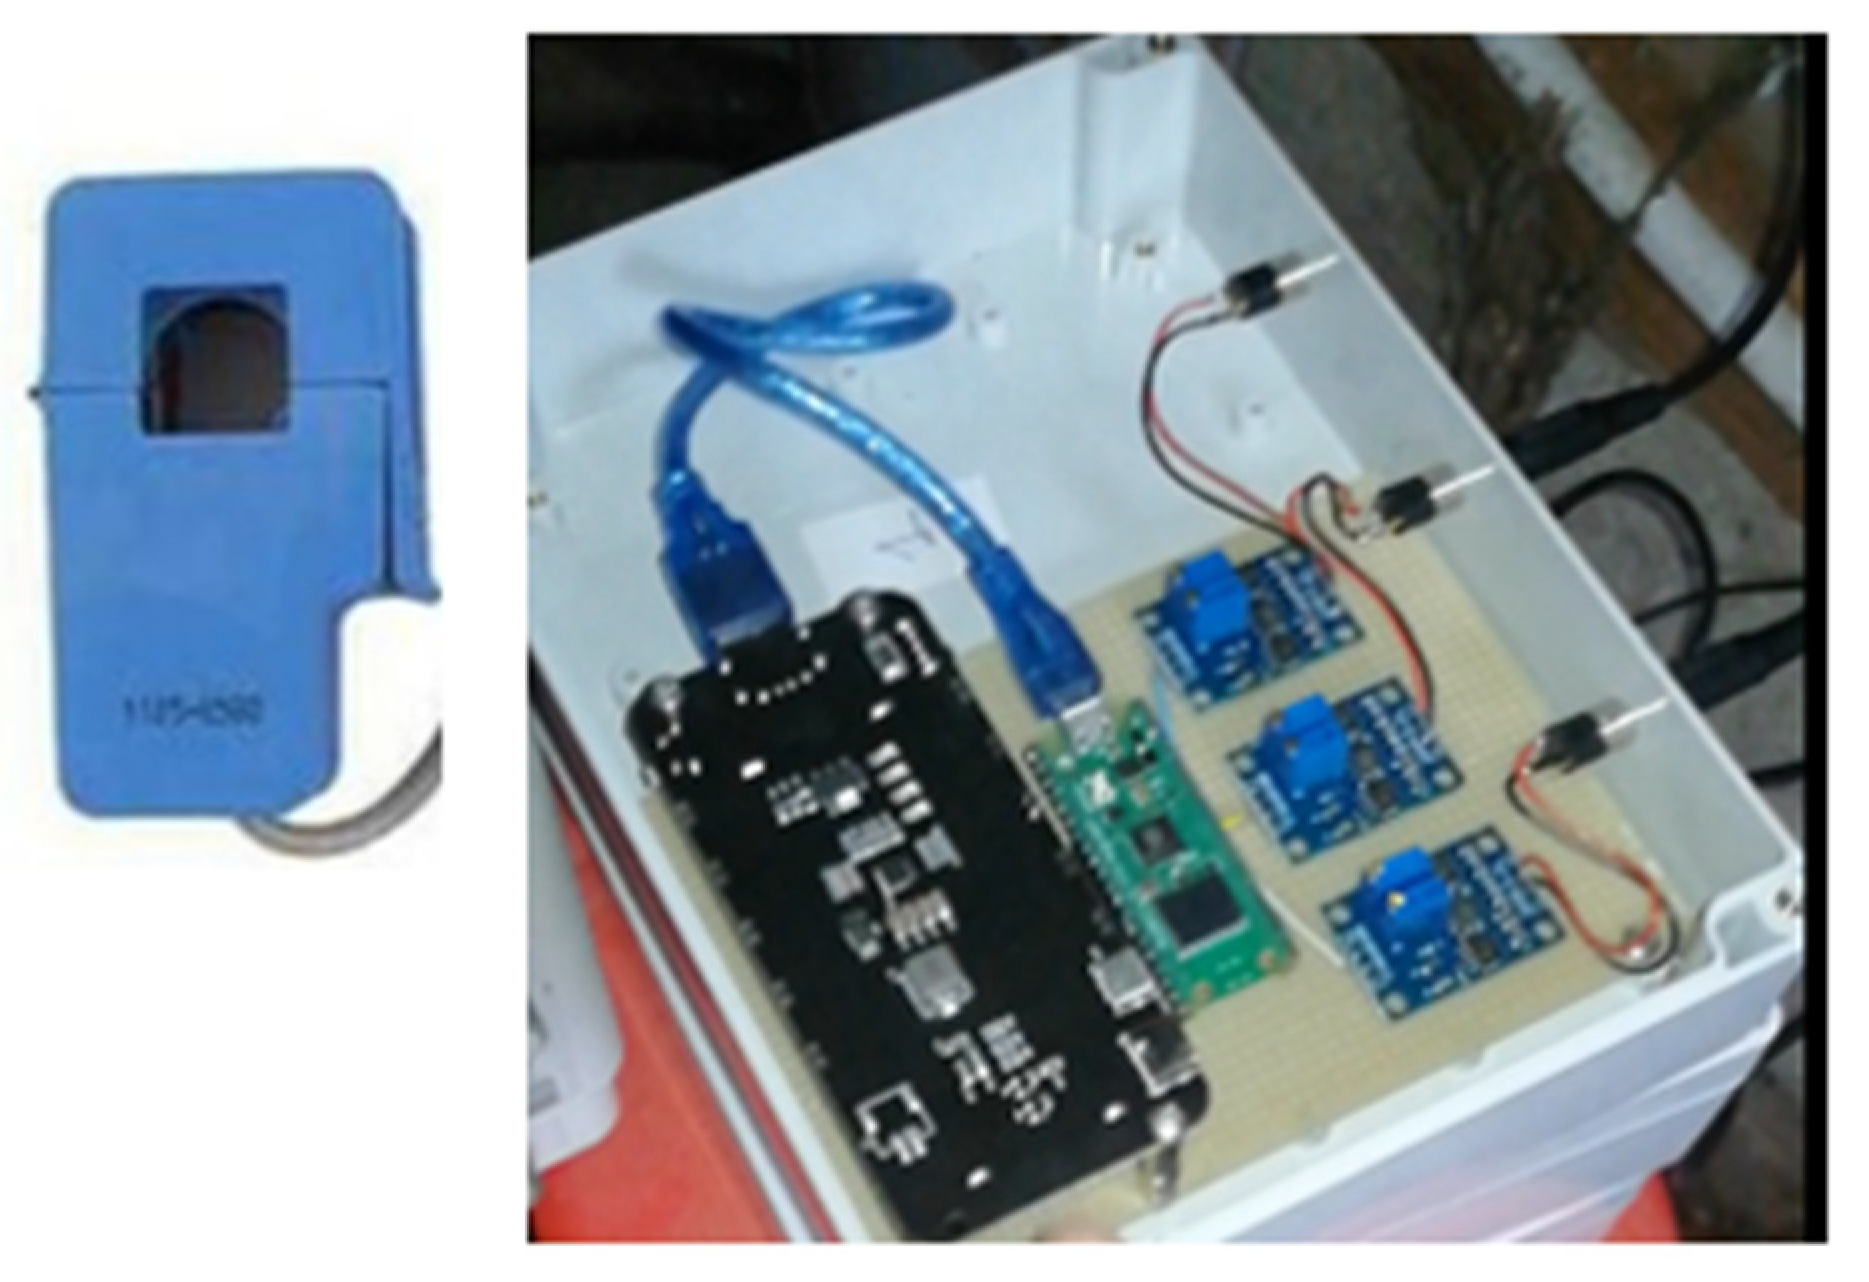
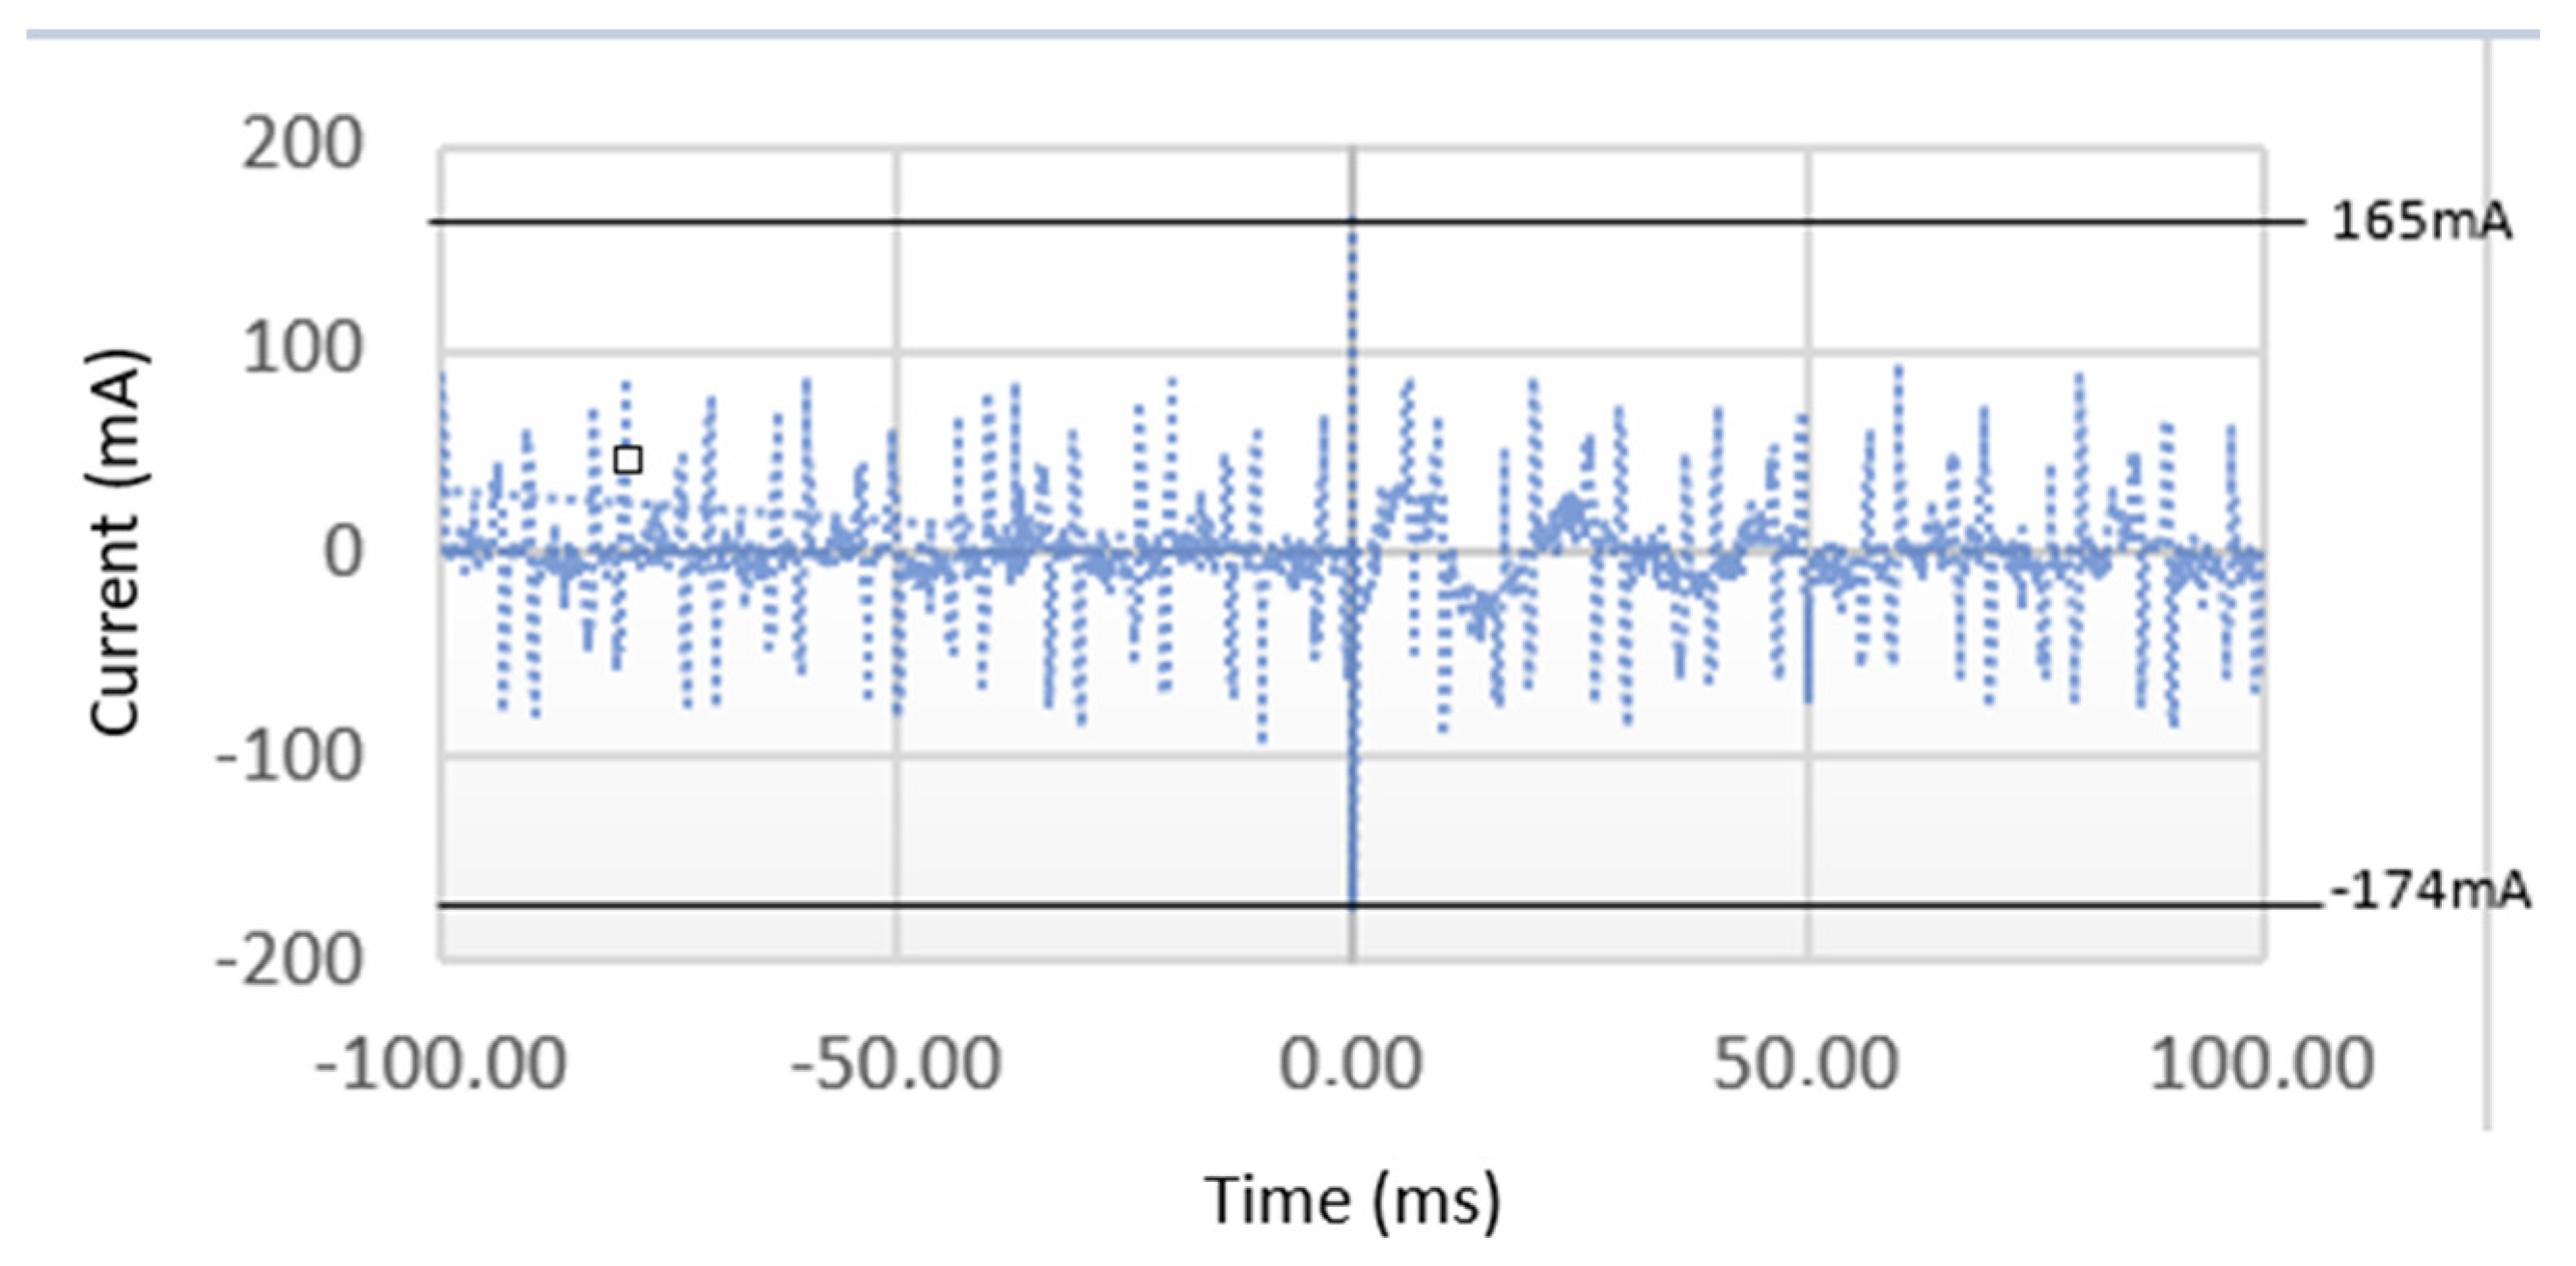
3.4. Measurement of Equipment Leakage Currents

The measurements of leakage currents are not governed by specific standards. They were carried out over a period of 12 to 24 h on various farm equipment, such as the milking robot, air compressor, milk tank, pressure washer, hot water tank, feeding screw, and the general earth connection of the farm’s barn (Farm 11).
This farm shows no non-compliance in terms of insulation resistance, which initially suggests that the leakage currents may be at low levels. Our device allows the measurement of currents ranging from 90 mA to −75 mA, for frequencies from 30 Hz to 2 kHz. Maximum, minimum, and TRMS current measurements are recorded every second (Figure 14).
For example, the milking robot mainly generates current pulses exceeding 90 mA, saturating our measurement device and preventing us from observing the actual pulse levels that this device can produce (Figure 15). As shown in Figure 16, which was obtained using an oscilloscope for a short duration of 200 ms, pulses up to 170 mA are produced by the milking robot.
All the measurements of leakage currents on various equipment revealed pulses exceeding 90 mA. These currents are normally discharged into the ground via the grounding system, becoming stray currents, some of which may pass through a cow.
However, it is important to note that the measurement clamps are sensitive to their environment and can be influenced by external electromagnetic fields. When leakage current measurements are taken in the electrical cabinet, these clamps may be disturbed by currents flowing through nearby phase and neutral cables. Consequently, it is highly likely that the measurements are overestimated due to these coupling issues.

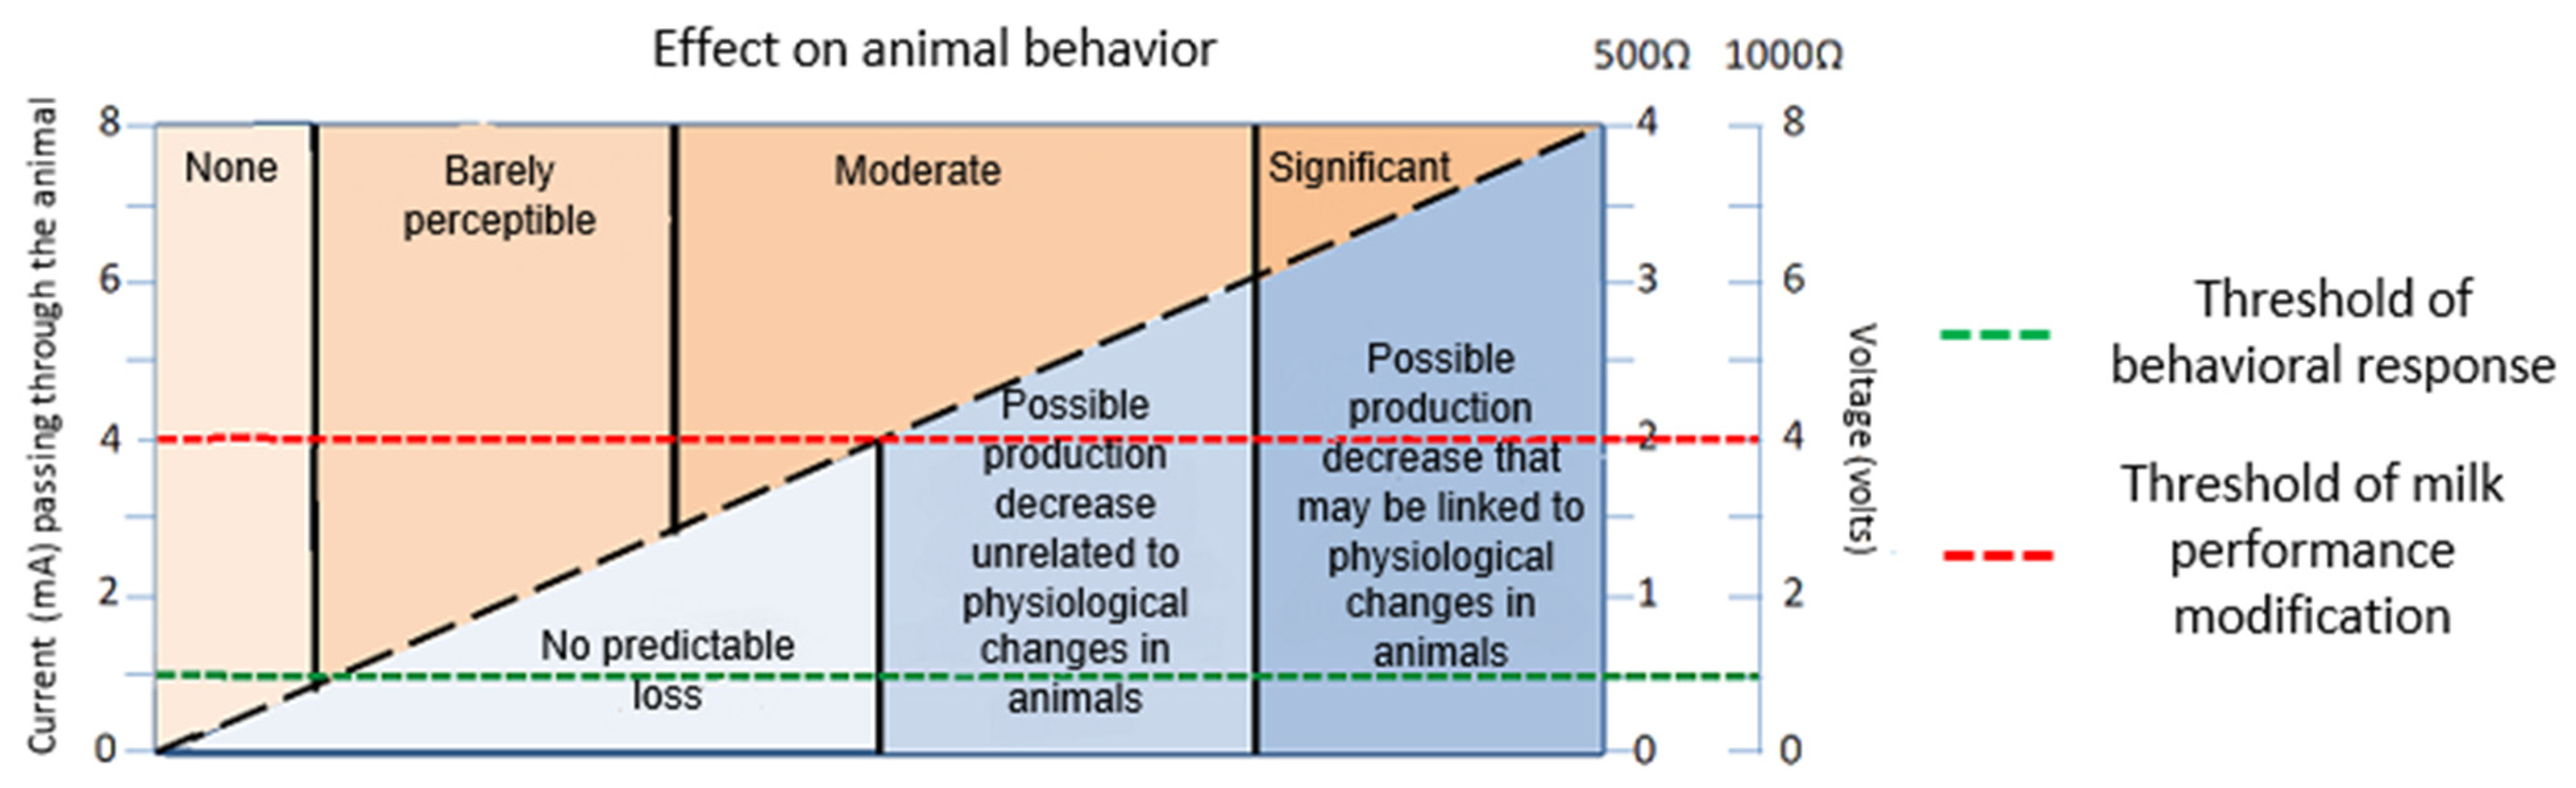
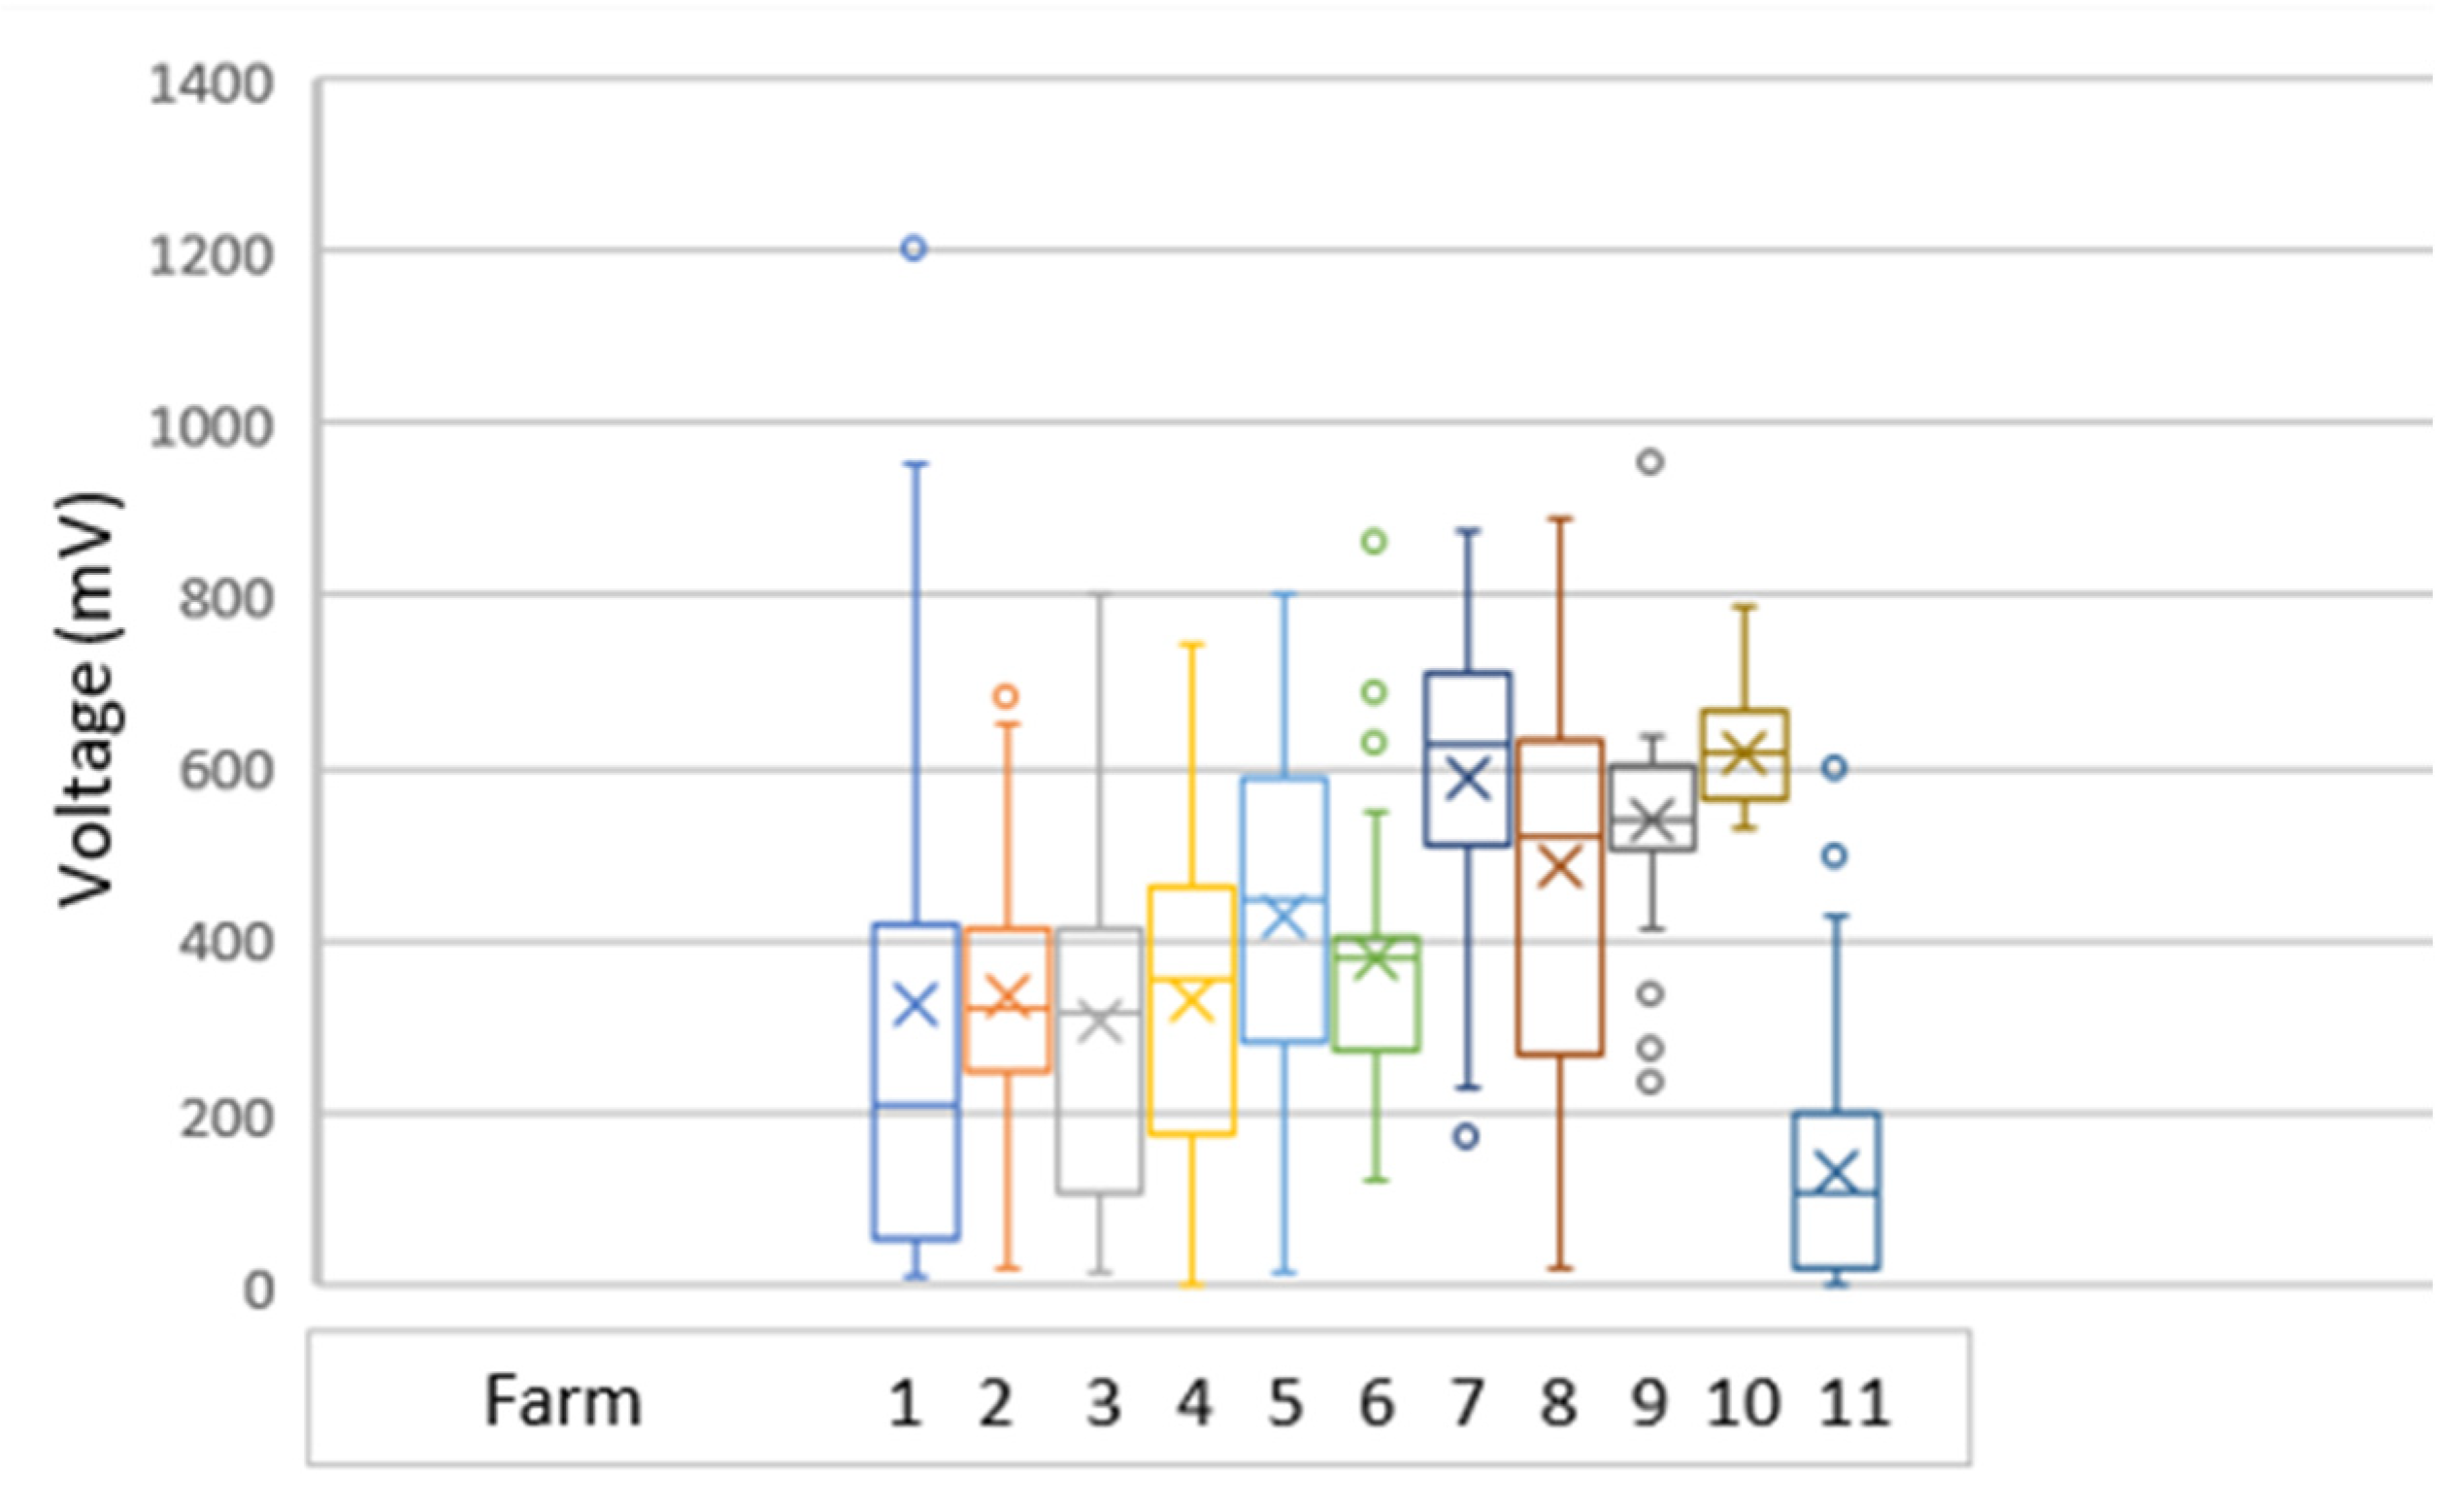
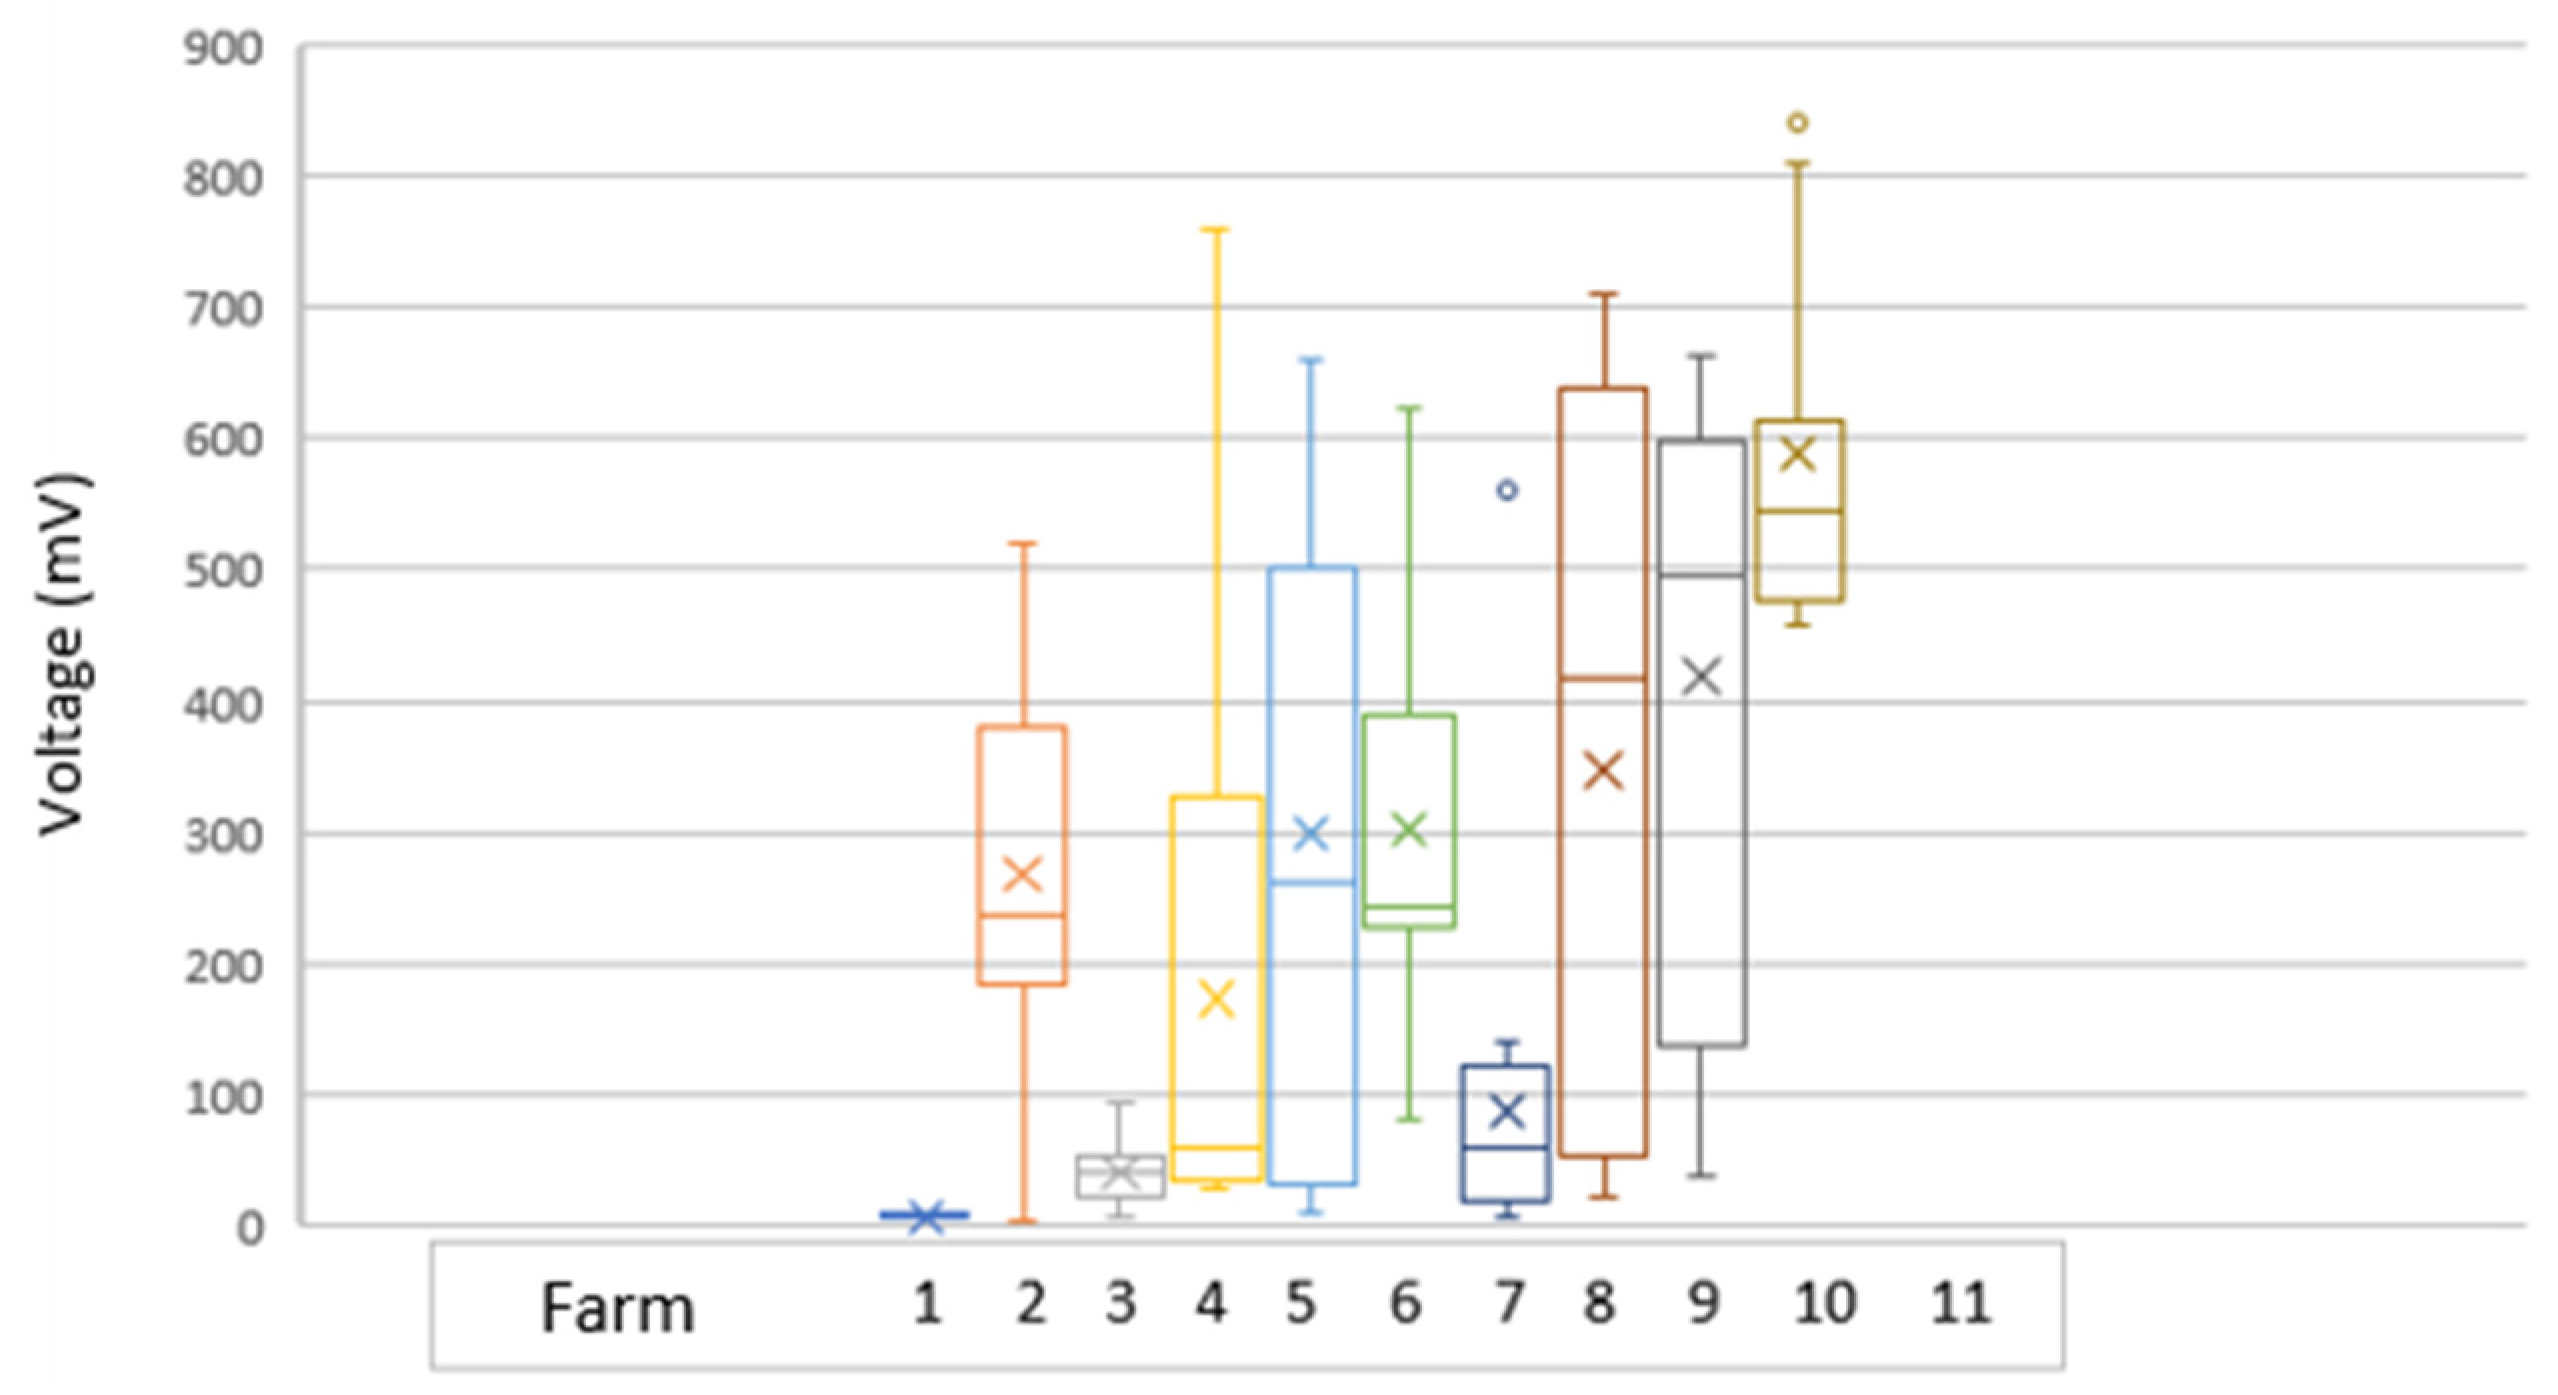
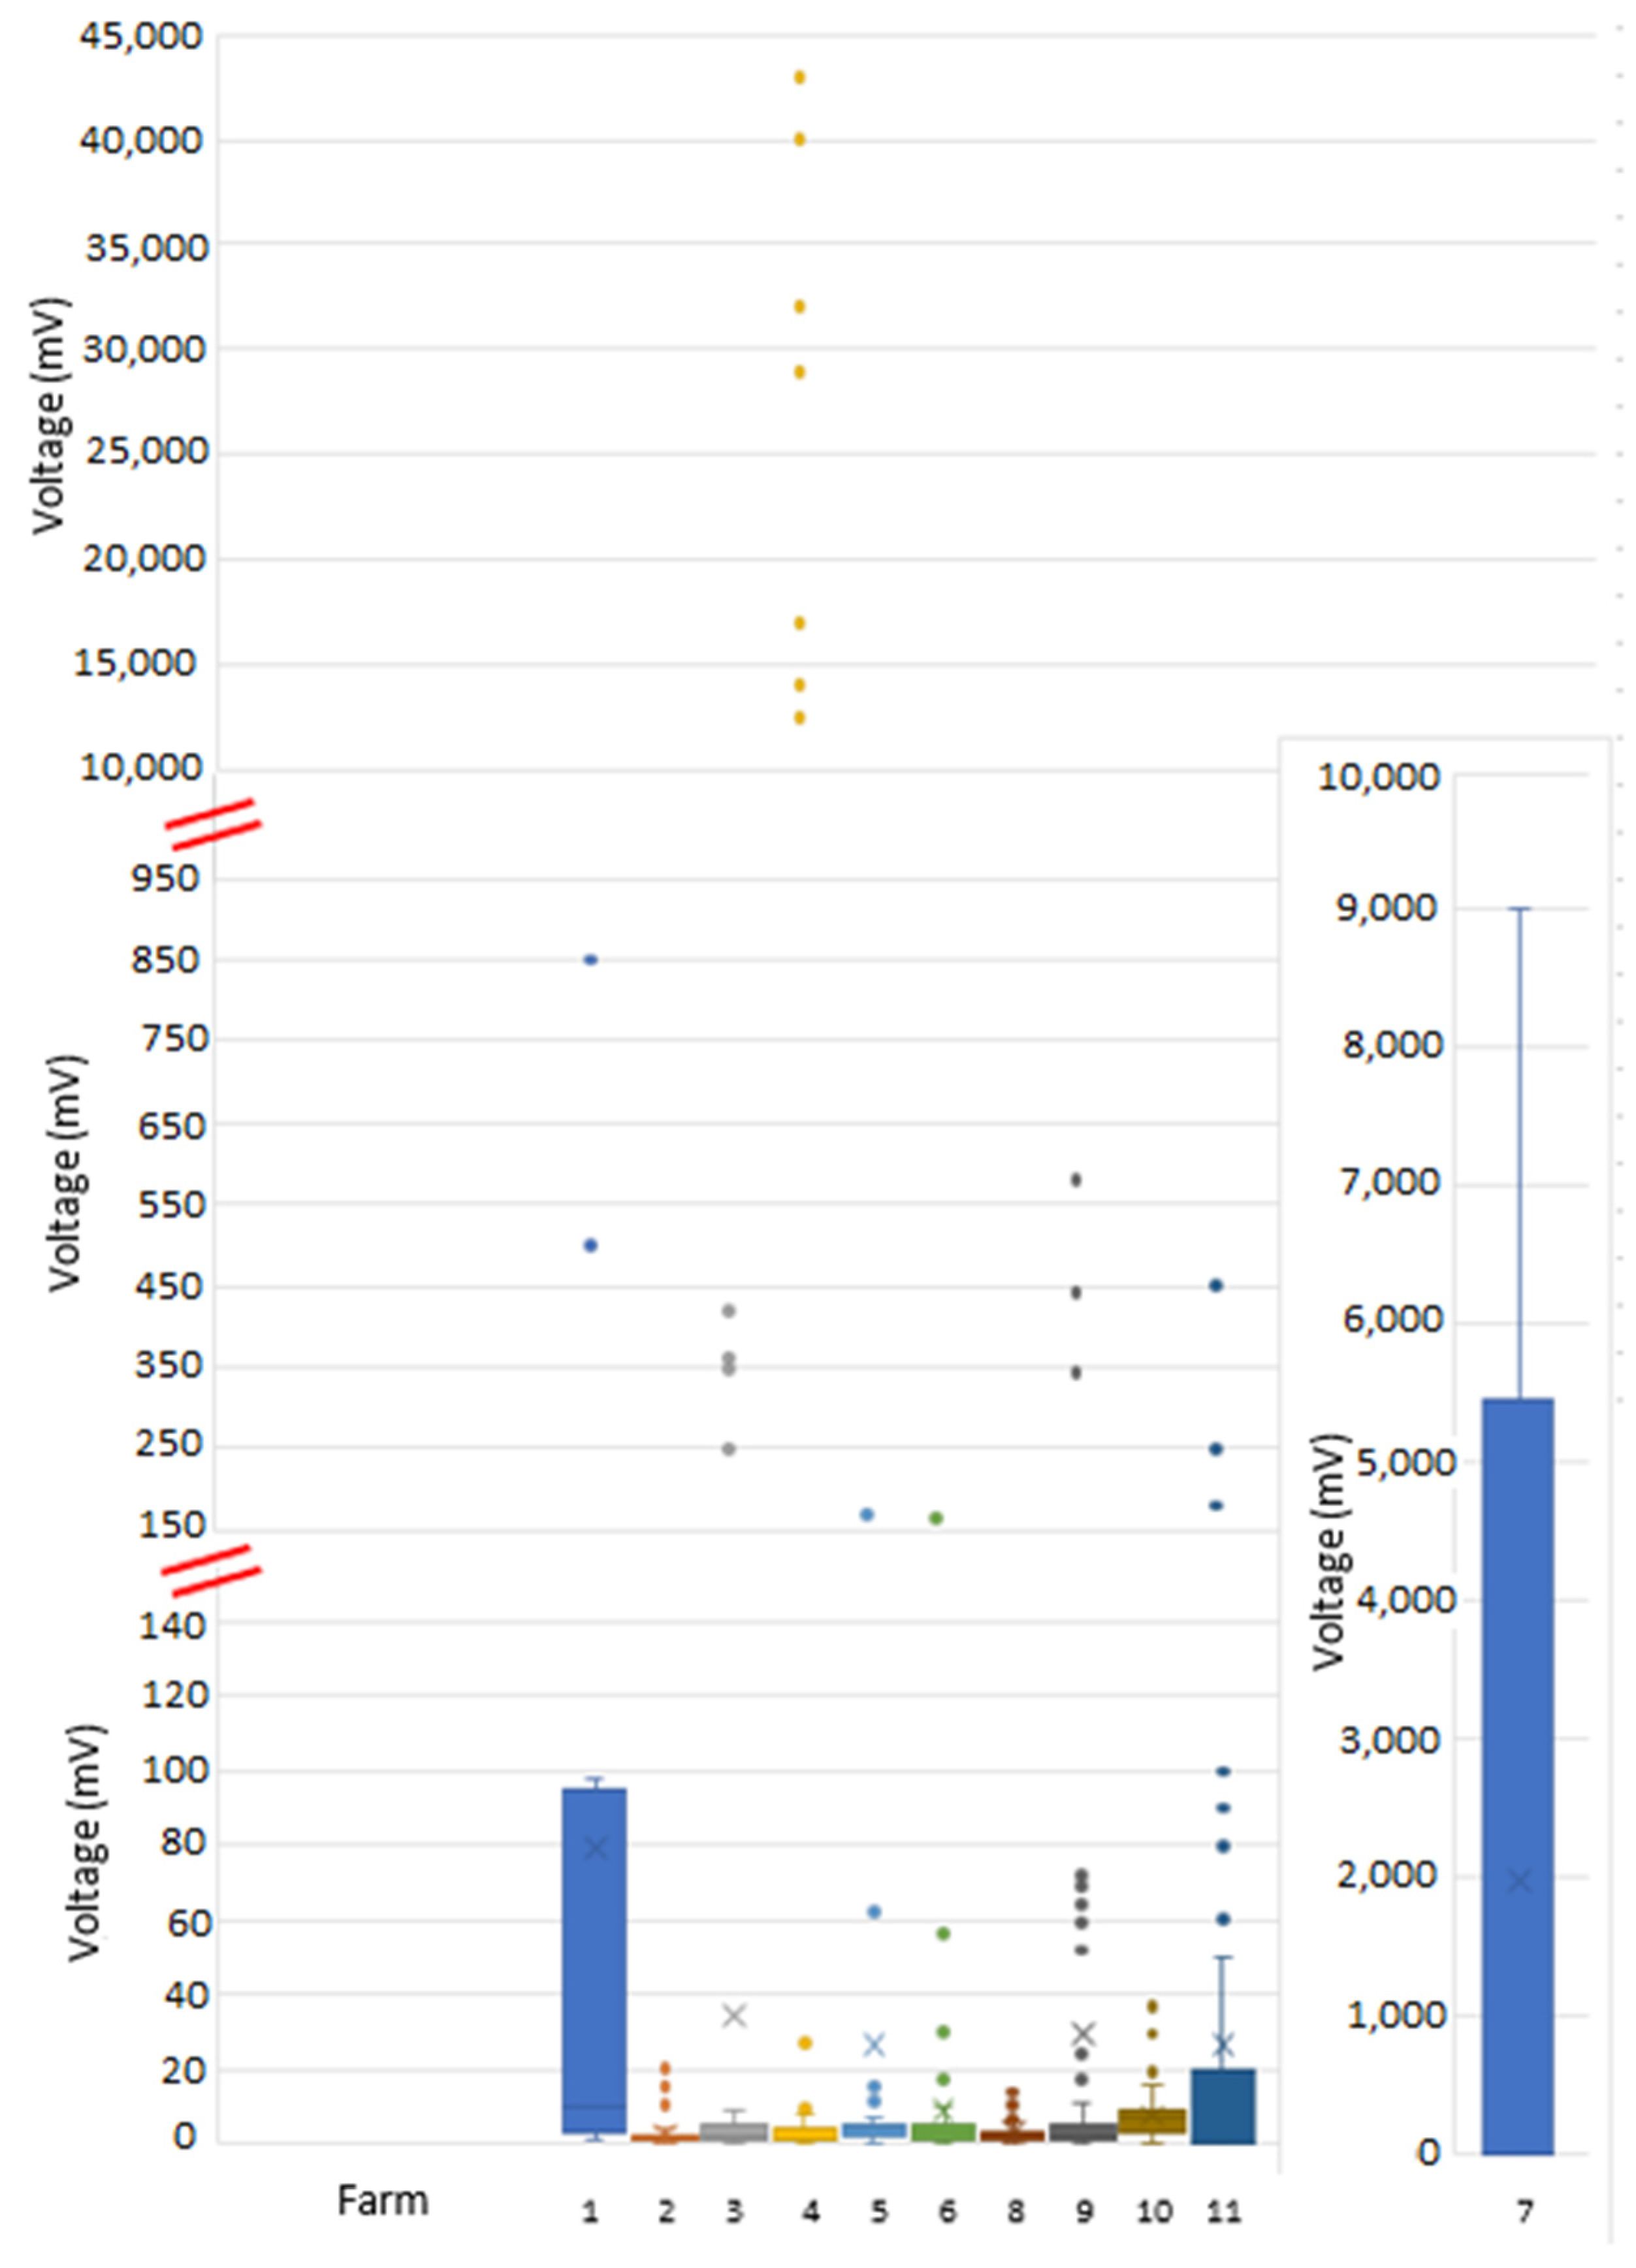
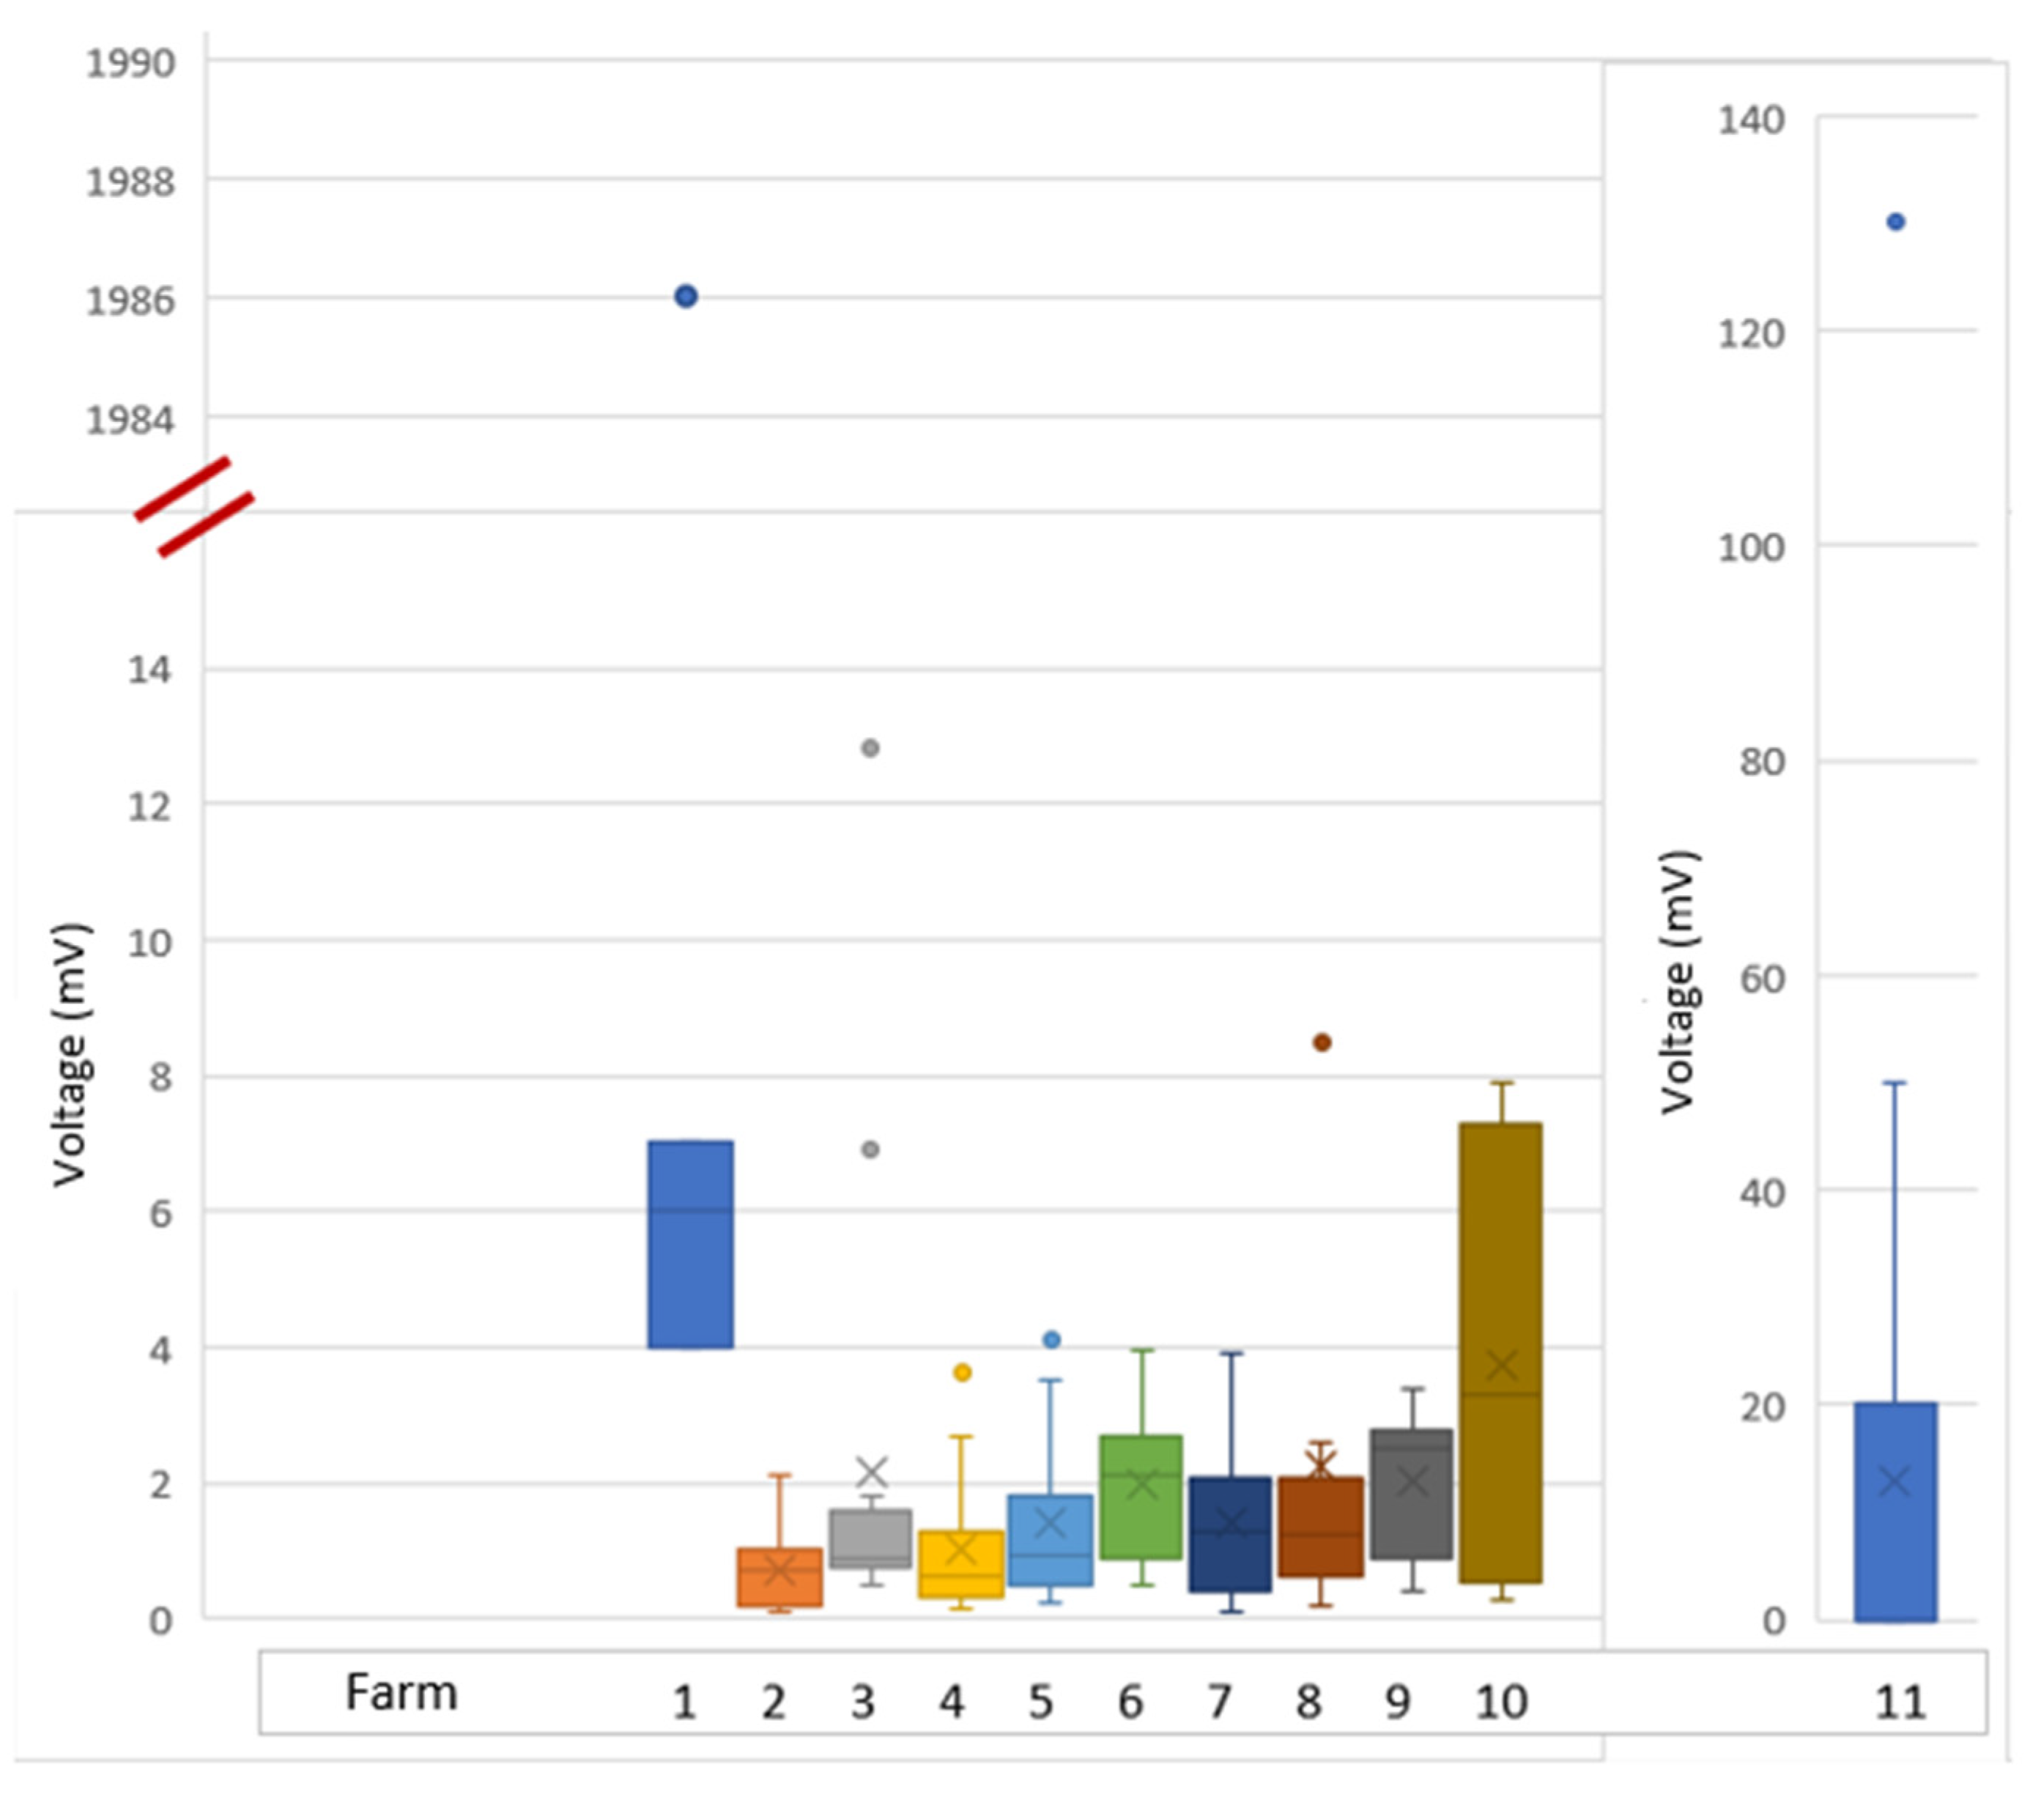
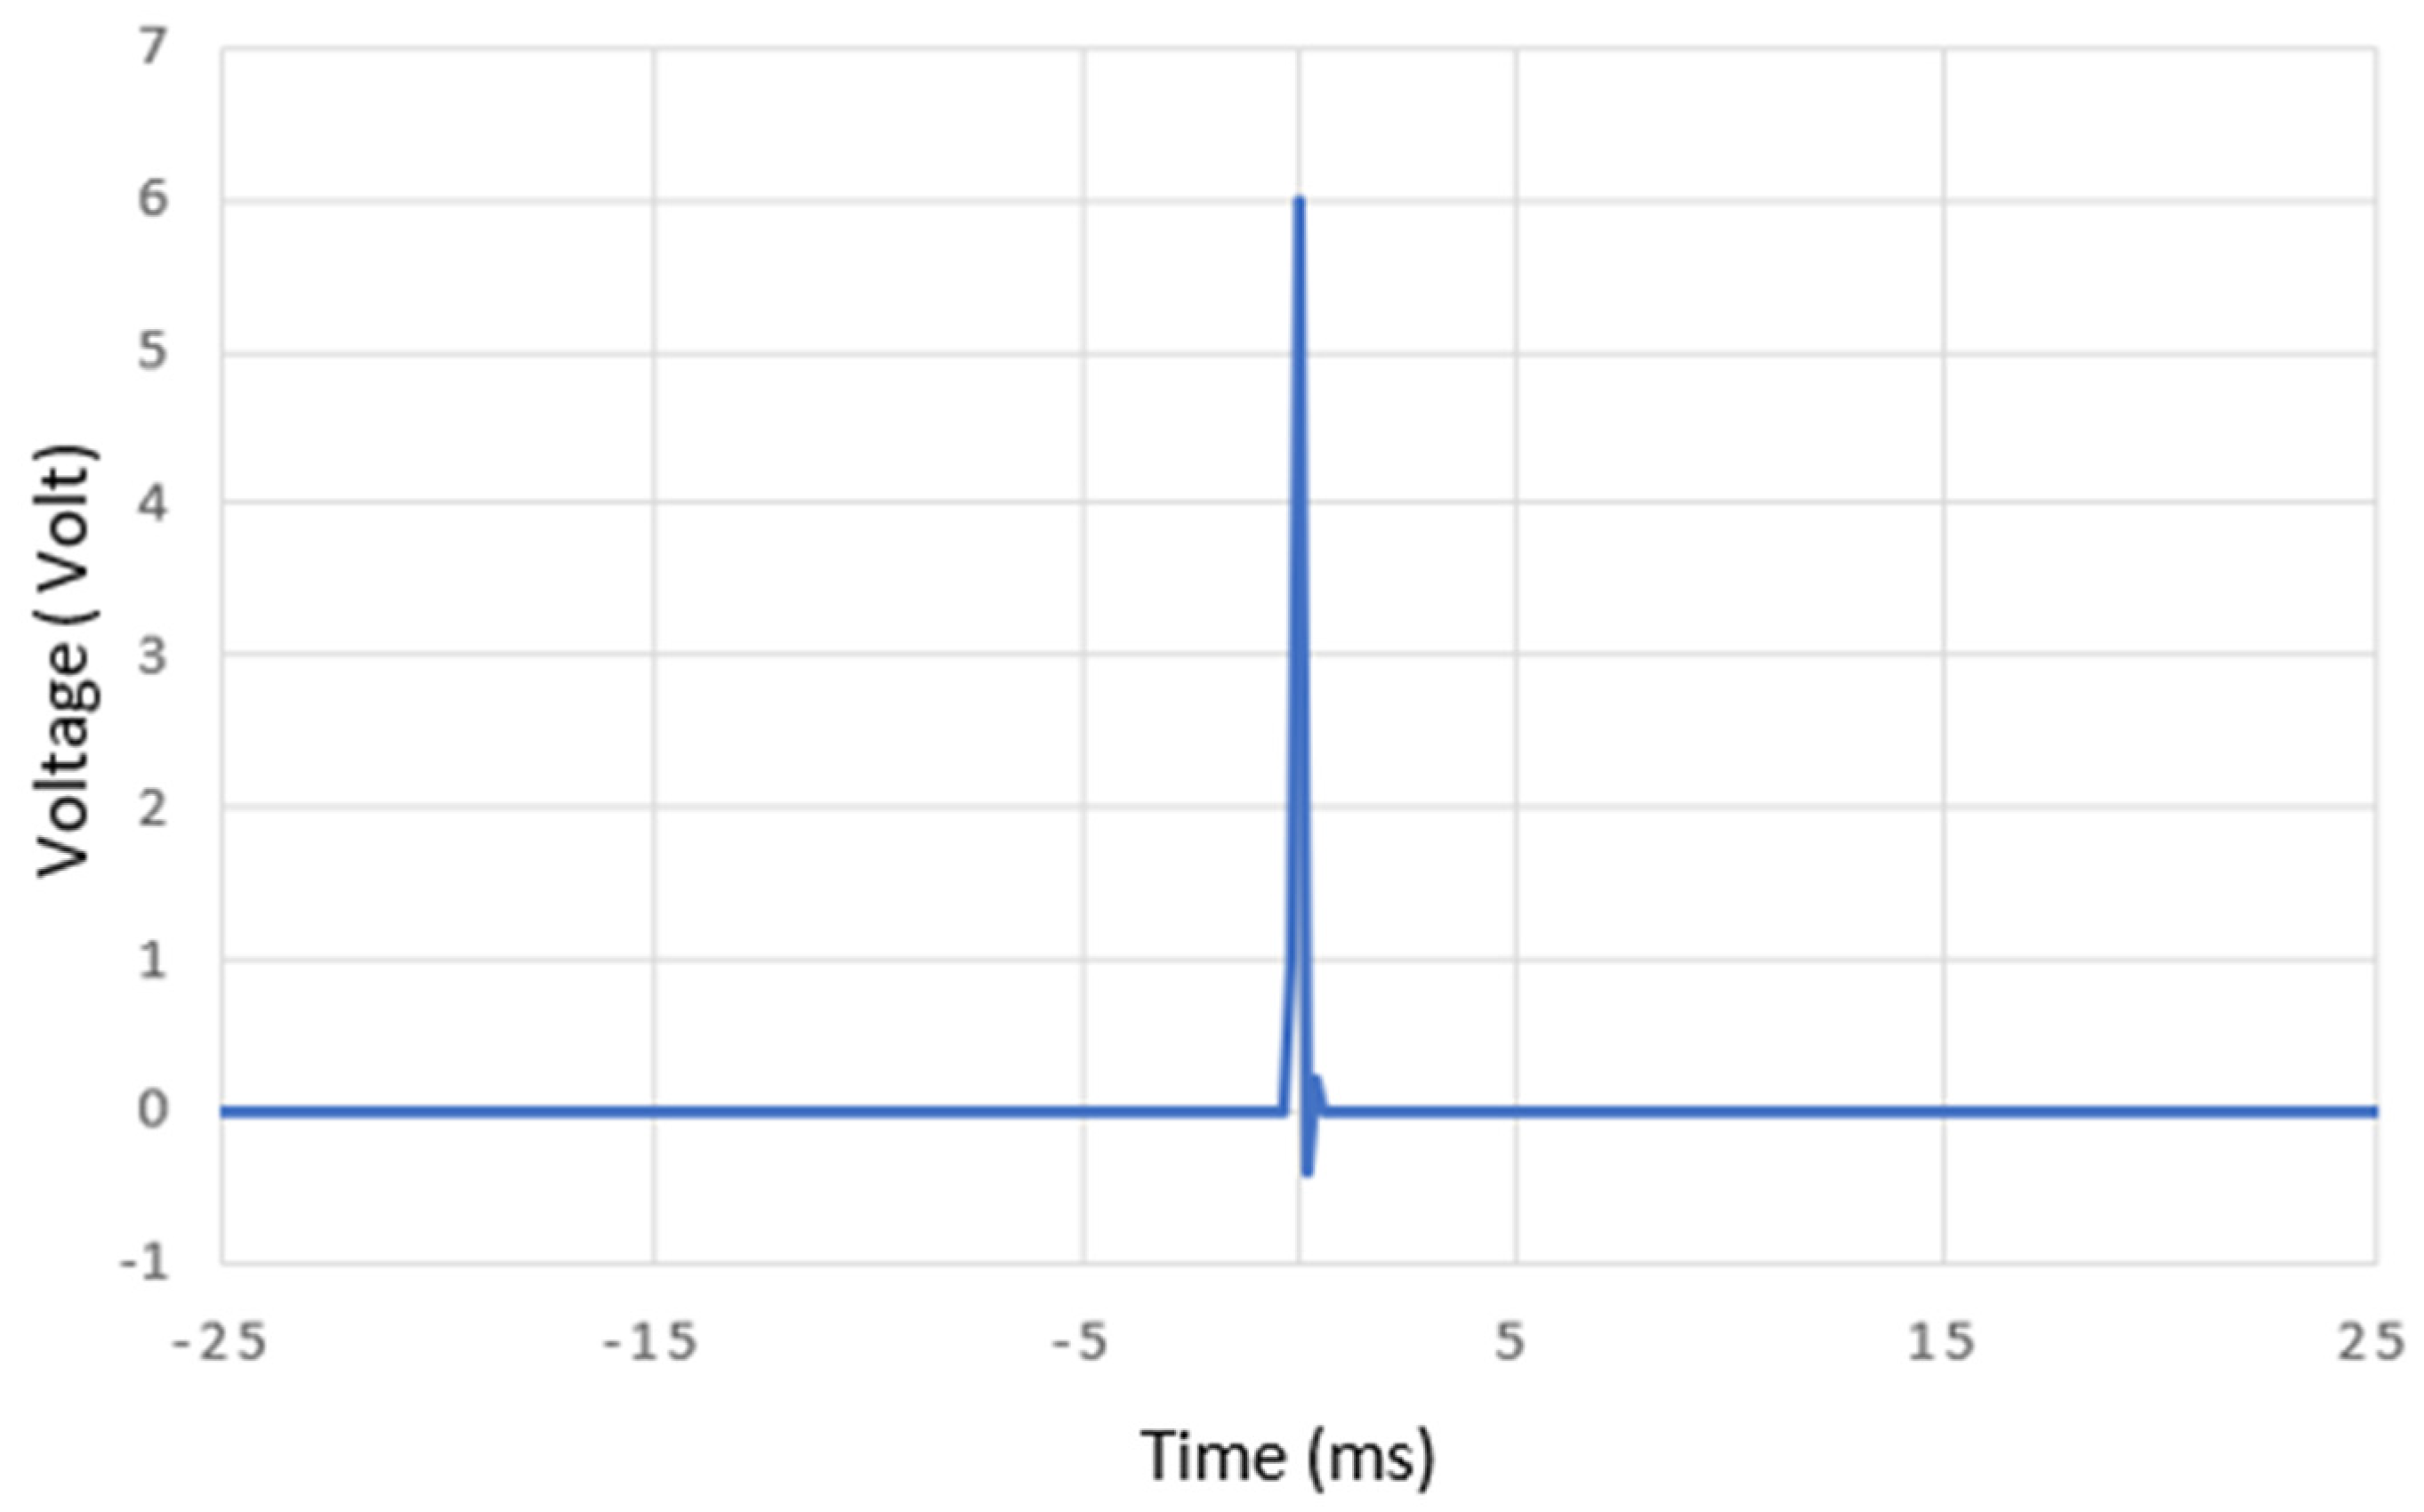
3.5. Measurement of Contact and Step Voltages

The measurements of contact and step voltages are conducted in both continuous and alternating modes.
For contact voltages (Table 6), only one farm slightly exceeds the value of 1 V in the continuous mode, but it is common to have voltages in the range of hundreds of mV and close to the limit (Figure 17). In contrast, in the alternating mode, three farms show higher contact voltages, with two of them having multiple elevated measurements (up to 43 V). Farm 4 exhibits eight out-of-range values, with measurements exceeding 10 volts, which can be attributed to the presence of a high-voltage power line (20 kV) just above the measurement points and the absence of equipotential bonding. The remaining six elevated values are found in the former heifer building, where the presence of insulation faults in the lighting points and the absence of equipotential bonding account for higher voltages.
Regarding Farm 7, numerous values exceed 1V (Figure 18) but all are concentrated in the calf-rearing building. These values can be attributed to the presence of heated water troughs. Indeed, when the power supply to the heated water troughs was cut off, no significant voltages were observed. The contact voltages measured in other buildings (milking parlor, calf nursery, dairy, and milking room) never exceeded 20 mV (Figure 19).
Regarding the step voltages (Table 7), only farm 1 exceeds the recommended threshold in the alternating mode for a single value. Additionally, as shown in Figure 20, except for one step voltage value in the alternating mode exceeding 1V, the step voltages are extremely low and do not exceed 14 mV, except for farm 11. Although farm 11 does not have any unsatisfactory values, its measurement range is more significant. This is due to the presence of impulses from electric fences, which do not appear in the other farms as they were measured with the fences disconnected.
In continuous mode, no value exceeds the recommendations, but as with continuous contact voltage measurements, it is common to have step voltages in the range of hundreds of mV and close to the limit.
Overall, for healthy farms, very few elevated values were observed in continuous mode. However, in alternating mode, two farms showed significant voltages that could lead to changes in behavior and/or pose a risk to the animals, even though these phenomena were not noticed by the farmers.
It is important to note that the voltage measurements taken with a multimeter do not detect voltage impulses, whether in contact or step voltages, but rather average these impulses over a defined period of time.
In order to observe these impulse phenomena, measurements were carried out on farm 11 using a portable oscilloscope (Figure 21). Pulse contact voltages of up to 6 V with a duration of 100 μs were recorded. These levels exceed what can be considered safe for the cattle.

4. Conclusions

This study addresses the complex issue of stray currents on cattle farms and their potential impact on animal health and productivity. Observations of changes in animal behavior and reduced performance have raised concerns among farmers, leading to suspicions regarding internal or external electrical installations on their farms. It became imperative to identify the source of these stray currents and resolve them effectively.
To achieve this objective, electrical diagnostics were conducted in eleven cattle farms considered “healthy,” meaning they showed no apparent signs of stress or declining animal productivity over time. This study aims to serve as a reference for identifying thresholds of resistance, current, and voltage that do not result in behavioral or milk quality changes.
The measurements encompassed various parameters. It was observed that the threshold value for earth resistance was not met in 27% of the farms, with the maximum level being 170 Ohms, which apparently did not have any observable effects on the animals. In 7% of cases, tested equipment exhibited defective insulation resistance, but in most situations, these devices were not in direct contact with the animals. Continuity and equipotential bonding measurements revealed non-conformities in 53% of cases. However, poor continuity alone does not necessarily lead to currents affecting the animals. To have a deleterious effect, it must be accompanied by a sufficiently high potential difference that cannot dissipate. Leakage currents have been rarely evaluated in previous research, and the measurements taken in this study can serve as a reference for establishing threshold levels that have no or minimal impact on animal well-being and milk production. They also provide indications of transient currents circulating in the ground. Nevertheless, the currents flowing through the animal will also depend on the electrical characteristics of the cow and the soil. Voltage measurements for step and contact are the best indicators for estimating the currents that can pass through the animals. However, their spatial and temporal variability does not allow for definitive conclusions. Nonetheless, values exceeding 1 V were detected in 2% of cases, a level that appears high considering the equivalent resistance of the cows but situated in less accessible areas for the animals.
Thus, the results of this study highlight the existence of complex and nuanced connections between the electrical systems of farms and the well-being of animals. They clearly indicate that even in farms that appear “healthy,” electrical problems can persist, potentially affecting the health and performance of animals, even if they are not visible to the farmer.
The main objective of this study is to contribute to a better understanding of the links between stray currents and animal well-being. The insights gained from this research will serve as a basis for future actions aimed at optimizing electrical installations on cattle farms. Additionally, a systematic comparison of the results obtained in “healthy” farms with those in farms where issues have been observed is planned for a subsequent publication. This comparative analysis will allow for a deeper exploration of the underlying causes of stray currents and the development of specific recommendations for farmers, veterinarians, and agricultural industry professionals to improve the health and productivity of livestock.

Author Contributions

Q.L.: conceptualization, methodology, software, formal analysis, investigation, writing—original draft, visualization. B.B.: conceptualization, methodology, validation, writing—review and editing, supervision, project administration. D.M.: writing—review and editing, investigation. S.M.: writing—review and editing. J.L.: writing—review and editing. All authors have read and agreed to the published version of the manuscript.

Funding

This research was funded by CNE (confederation Nationale de l’Elevage) and Idele (Institut de l’Elevage).

Data Availability Statement

The data supporting this study (location, name, and date of measurements of the farms) are not available due to confidentiality reasons.

Acknowledgments

Thank you to Idele, especially Philippe Roussel and Barthélemy Malgoyre, as well as RTE with François Deschamps for their assistance during this study. Thanks to all 11 farms for opening their doors to us, without which this study would not have been possible. Thanks to Bureau Veritas for providing some electrical diagnostic reports. Thanks to the students from ENSIL-ENSCI and IUT Limousin, Department of Physical Measurements, who participated in projects and internships, for their valuable contributions.

Conflicts of Interest

The authors declare no conflict of interest. The funders had no role in the design of the study; in the collection, analyses, or interpretation of data; in the writing of the manuscript; or in the decision to publish the results.

References

  1. Churchwood, R.E. A note on the occurrences of electric shocks and their possible effects on development of mastitis. Aust. Vet. J. 1948, 24, 150. [Google Scholar] [CrossRef]
  2. Phillips, D.S.M. Production of cows may be affected by small electrical shocks from milking plants. N. Z. J. Agric. 1962, 105, 221. [Google Scholar]
  3. Phillips, D.S.M. Small voltages on milking plants. In Proceedings of the Ruakura Farmers Conference Week; New Zealand Department of Agriculture: Hamilton, New Zealand, 1962; pp. 220–228. [Google Scholar]
  4. Craine, L.B.; Betts, A.L.; Greenfield, E.W. Electrical Ground Currents—Clark County; Wash. State Univ. Div. Ind. Res., Res. Rep. No. 69/16-5; Washington State University: Pullman, WA, USA, 1969. [Google Scholar]
  5. Feistman, F.J.; White, R.R. Tingle Voltages in Milking Parlors; Notes 324.5-1; British Columbia Dept. Agrie. Engineer: Canada, 29 May 1975; p. 324.5-1. [Google Scholar]
  6. Cloud, H.A.; Appleman, R.D.; Gustafson, R.J. Stray Voltage Problems with Dairy Cows; N. Central Reg. Publ. 125; University of Minnesota: St. Paul, MN, USA, 1980. [Google Scholar]
  7. CNIEL. Guide Diagnostic Électrique en Élevage Laitier. 2018. p. 33. Available online: https://presse.filiere-laitiere.fr/assets/cp-cniel-guide-courants-parasites-def-e4e2-ef05e.html?lang=fr (accessed on 7 April 2023).
  8. GPSE. Courants Électriques Parasites en Élevage: Connaître et Maîtriser. 2019. p. 56. Available online: https://www.gpse.fr/IMG/pdf/gpse_2019_courants_electriques_parasites_en_elevage-2.pdf (accessed on 10 April 2023).
  9. American National Standards Institute. National Electrical Safety Code (NESC) HVDC; Institute of Electrical & Electronics Engineers (IEEE): New York, NY, USA, 1996. [Google Scholar]
  10. Raoul, D. Les Lignes à Haute et Très Haute Tension: Quels Impacts sur la Santé et l’Environnement? Compte-Rendu de l’Audition Publique du 29 Janvier 2009. Available online: https://www.senat.fr/rap/r08-307/r08-307.html (accessed on 7 April 2023).
  11. Bhagat, S. Earthing, Bonding, and Stray Current. In Transportation Electrification: Breakthroughs in Electrified Vehicles, Aircraft, Rolling Stock, and Watercraft; Wiley: Hoboken, NJ, USA, 2022; pp. 325–341. [Google Scholar]
  12. Deruelle, F. The different sources of electromagnetic fields: Dangers are not limited to physical health. Electromagn. Biol. Med. 2020, 39, 166–175. [Google Scholar] [CrossRef] [PubMed]
  13. Logiciel D’analyse de Système de Mise à la Terre. Universite D’antsiranana Enset Departement GE. Available online: http://biblio.univ-antananarivo.mg/pdfs/mylimananaMilyH_ENSET_CPN_11.pdf (accessed on 13 May 2023).
  14. Miller, H.N. Insulation Resistance and High-Potential Testing: Advantages and Limitations. IEEE Trans. Ind. Gen. Appl. 1969, 3, 326–332. [Google Scholar] [CrossRef]
  15. Salaš, L.; Vučijak, N.; Vukadinović, N. Continuity testing of protective conductor and equipotential bonding conductors in practice. Teh.-Kval. Stand. I Metrol. 2003, 3, 9–14. [Google Scholar]
  16. Baldwin, T.; Renovich, F.; Saunders, L.F.; Lubkeman, D. Fault locating in ungrounded and high-resistance grounded systems. IEEE Trans. Ind. Appl. 2001, 37, 1152–1159. [Google Scholar] [CrossRef]
  17. Deschamps, F. La conformité réglementaire des installations électriques des élevages. Bull. l’Académie Vétérinaire Fr. 2010, 163, 235–241. [Google Scholar] [CrossRef]
  18. Erdreich, L.S.; Alexander, D.D.; Wagner, M.E.; Reinemann, D. Meta-analysis of stray voltage on dairy cattle. J. Dairy Sci. 2009, 92, 5951–5963. [Google Scholar] [CrossRef]
  19. Rigalma, K.; Duvaux-Ponter, C.; Oliveira, A.; Martin, O.; Louyot, T.; Deschamps, F.; Roussel, S. Determination of a stray voltage threshold in Holstein heifers, influence of predictability and past experience on behavioural and physiological responses. Anim. Welf. 2011, 20, 385–395. [Google Scholar] [CrossRef]
  20. NF-C-15-100; French Standard for Electrical Installations in Residential Buildings. 2015.
  21. Available online: https://www.chauvin-arnoux.com/sites/default/files/documents/catalogue_ca_2022-france-bassdef_0.pdf (accessed on 9 June 2023).
  22. IEC 60479-1; Effects of Current on Humans and Domestic Animals—General Aspect. International Electrotechnical Commission: geneva, Switzerland, 2005.
  23. Christophe, «Les Mesures», MyEleec: Site et Forum d’Entraide Scolaire en Électrotechnique. 2015. Available online: https://www.myeleec.fr/les-mesures/ (accessed on 9 June 2023).
  24. Lefcourt, A.M. Effects of Electrical Voltage/Current on Farm Animals: How to Detect and Remedy Problems; Agriculture Handbook; Agricultural Research Service: Albany, CA, USA, 1991.
  25. Gustafson, R.J.; Brennan, T.M.; Appleman, R.D. Behavioral studies of dairy cow sensitivity to AC and DC electric currents. Trans. ASAE 1985, 28, 1680–1685. [Google Scholar] [CrossRef]
  26. Mormède, P.; Bastian, S.; Bayourthe, C.; Bounouh, A.; Brunschwig, P.; Chartier, C.; Demarquoy, J.; Gidenne, T.; Kouba, M.; Meunier-Salaün, M.-C.; et al. Conséquences des Champs Électromagnétiques d’Extrêmement Basses Fréquences sur la Santé Animale et les Performances Zootechniques. Ph.D. Thesis, National Agency for Food, Environmental and Occupational Health and Safety, Paris, France, 2015. [Google Scholar]
Figure 1. Measurement of the earth resistance using the loop impedance method [21].
Agriculture 13 02010 g001
Figure 2. Measurement of the earth resistance using the auxiliary spike method [21].
Agriculture 13 02010 g002
Figure 3. Diagram representing the insulation resistance Ri of equipment in series with the human body resistance Rh estimated at 2200 Ω.
Agriculture 13 02010 g003
Figure 4. Insulation fault resistance measurement of the devices.
Agriculture 13 02010 g004
Figure 5. Continuity measurement [23].
Agriculture 13 02010 g005
Figure 6. Measurement of equipment leakage currents (TT earthing system).
Agriculture 13 02010 g006
Figure 7. Contact voltage [8].
Agriculture 13 02010 g007
Figure 8. Measurement of contact voltage in AC with a moistened metal plate and a voltmeter.
Agriculture 13 02010 g008
Figure 9. Measurement of contact voltage in DC with a reference electrode and a voltmeter.
Agriculture 13 02010 g009
Figure 10. Step voltage [8].
Agriculture 13 02010 g010
Figure 11. Measurement of step voltage in AC with a moistened metal plate and a voltmeter.
Agriculture 13 02010 g011
Figure 12. Measurement of step voltage in DC with a reference electrode and a voltmeter.
Agriculture 13 02010 g012
Figure 13. Effects of current levels on behavior and milk production at 50/60Hz [26].
Agriculture 13 02010 g013
Figure 14. Device for measuring parasitic currents. A 5A/1V current clamp, an operational amplifier (AOP) for 100x amplification, and a Raspberry Pi Pico are used to collect the data.
Agriculture 13 02010 g014
Figure 15. Measurement of leakage currents from the milking robot in farm 11, showing the maximum values (blue curve), minimum values (orange curve), and True Root Mean Square (TRMS) values (red curve) recorded every second over a 12 h period.
Agriculture 13 02010 g015
Figure 16. Measurement of leakage currents from the milking robot in farm 11 in real-time using an oscilloscope.
Agriculture 13 02010 g016
Figure 17. Statistical graph of continuous contact voltages measured in the 11 agricultural farms. It shows the medians (horizontal lines) and the averages (represented by crosses) as well as the out-of-range values (data points).
Agriculture 13 02010 g017
Figure 18. Statistical graph of continuous step voltages measured in 10 agricultural farms (No measurements in Farm 11). It shows the medians (horizontal lines) and the averages (represented by crosses) as well as the out-of-range values (data points).
Agriculture 13 02010 g018
Figure 19. Statistical graph of alternating contact voltages measured in the 11 agricultural farms. It shows the medians (horizontal lines) and the averages (represented by crosses) as well as the out-of-range values (data points). In order to improve readability, the scale has been adjusted (indicated by red lines), and the data for Farm 7 have been separated for clarity.
Agriculture 13 02010 g019
Figure 20. Statistical graph of alternating step voltages measured in 11 agricultural farms. It shows the medians (horizontal lines) and the averages (represented by crosses) as well as the out-of-range values (data points). The scale has been adjusted (red lines) and Farm 11 has been separated to ensure better readability.
Agriculture 13 02010 g020
Figure 21. Contact voltage measurement with an oscilloscope allows us to visualize impulses originating from electric fences.
Agriculture 13 02010 g021
Table 1. Farms where the assessments were conducted.
FarmBreed of the Herd
130 Prim’Holstein
230 Prim’Holstein
354 Prim’Holstein et Montbéliarde
455 Prim’Holstein
596 Prim’Holstein et Limousine
662 Prim’Holstein et Montbéliarde
784 Prim’Holstein
861 Prim’Holstein
9220 Limousine
10490 Limousine
1155 Prim’Holstein
Table 2. Results of the earth resistance measurements using two methods: auxiliary electrode method and loop impedance method. For each method, the number of measurements that do not comply with the NF-C-15-100 standard (<100 Ω) out of the total number of measurements performed is indicated, as well as the highest resistance value recorded among all the measurements conducted for each farm.
FarmBy the Auxiliary Spike MethodBy the Loop Impedance Method
Measurements Not Complying with the Standard/
Measurements Taken
Largest Measured ResistanceMeasurements Not Complying with the Standard/
Measurements Taken
Largest Measured Resistance
11 out of 3106 Ω1 out of 3116 Ω
20 out of 460 Ω1 out of 4104 Ω
30 out of 17 Ω0 out of 120 Ω
40 out of 36 Ω1 out of 3Out of range
50 out of 12 Ω0 out of 120 Ω
60 out of 1 0 out of 123 Ω
71 out of 3100 Ω1 out of 3101 Ω
80 out of 110 Ω0 out of 110 Ω
90 out of 162 Ω0 out of 166 Ω
103 out of 4160 Ω3 out of 4170 Ω
11 0 out of 327 Ω
Table 3. Results of insulation resistance measurements of the equipment. The number of measurements not complying with the NF-C-15-100 standard (<500 kΩ) is indicated out of the total number of measurements conducted.
FarmInsulation Resistance
Measurements Not Complying with the
Standard/Measurements Taken
The Lowest ValueDefective Appliances
1
21 out of 18440 ΩVacuum pump
30 out of 12
41 out of 3620 ΩLighting
55 out of 290 ΩElectrical panel
Lighting
Outlets
62 out of 15220 ΩElectrical panel
Lighting
74 out of 360 ΩElectrical panel
Water pump
Outlets
80 out of 19
91 out of 4120 ΩElectrical panel
100 out of 10
110 out of 30
Table 4. Results of the measurements of the continuity resistance of the protective conductor, with the number of measurements not complying with the NF-C-15-100 standard (>2 Ω) out of the total number of measurements conducted.
FarmPE Resistance
Measurements Not Complying with the
Standard/Measurements Taken
120 out of 34
211 out of 33
31 out of 25
415 out of 40
56 out of 49
61 out of 19
716 out of 48
83 out of 27
916 out of 16
108 out of 23
1173 out of 82
Table 5. Results of the measurements of the equipotential bonding with the number of measurements not satisfactory (>0.2 Ω) out of the total number of measurements conducted.
FarmPE Resistance
Measurements Not Complying with the
Standard/Measurements Taken
1
2
3
419 out of 21
519 out of 19
611 out of 12
720 out of 21
814 out of 19
93 out of 3
101 out of 1
11
Table 6. Results of continuous and alternating contact voltage measurements, with the number of measurements not meeting the requirement (>1 V) out of the total number of measurements, and the highest recorded voltage value for each farm.
FarmContinuous Contact VoltageAlternating Contact Voltage
Measurements Not
Complying with the
Standard/Measurements Taken
Largest Measured VoltageMeasurements Not
Complying with the Standard/
Measurements Taken
Largest Measured Voltage
11 out of 181.20 V0 out of 260.87 V
20 out of 300.68 V0 out of 3020 mV
30 out of 400.80 V0 out of 420.42 V
40 out of 770.74 V8 out of 7743 V
50 out of 550.80 V1 out of 561.1 V
60 out of 440.87 V0 out of 440.17 V
70 out of 690.87 V20 out of 699 V
80 out of 620.89 V0 out of 6214 mV
90 out of 610.96 V0 out of 610.58 V
100 out of 440.80 V0 out of 4437 mV
110 out of 640.60 V0 out of 670.45 V
Table 7. Results of continuous and alternating step voltage measurements, with the number of measurements not meeting the requirement (>1 V) out of the total number of measurements, and the highest recorded voltage value for each farm.
FarmContinuous Step VoltageAlternating Step Voltage
Measurements Not Complying with the Standard/
Measurements Taken
Largest Measured VoltageMeasurements Not
Complying with the Standard/Measurements Taken
Largest Measured Voltage
10 out of 610 mV1 out of 72 V
20 out of 130.5 V0 out of 132.1 mV
30 out of 140.1 V0 out of 1513 mV
40 out of 160.8 V0 out of 163.6 mV
50 out of 150.7 V0 out of 154.1 mV
60 out of 110.6 V0 out of 114.0 mV
70 out of 240.6 V0 out of 243.9 mV
80 out of 140.7 V0 out of 148.7 mV
90 out of 80.7 V0 out of 83.4 mV
100 out of 110.8 V0 out of 107.9 mV
11 0 out of 21130 mV
Disclaimer/Publisher’s Note: The statements, opinions and data contained in all publications are solely those of the individual author(s) and contributor(s) and not of MDPI and/or the editor(s). MDPI and/or the editor(s) disclaim responsibility for any injury to people or property resulting from any ideas, methods, instructions or products referred to in the content.

