Article

Development, Validation, and Evaluation of Partial PST Tractor Simulation Model for Different Engine Modes during Field Operations

1
Department of Agricultural Machinery Engineering, Chungnam National University, Daejeon 34134, Republic of Korea
2
Department of Smart Agriculture Systems, Chungnam National University, Daejeon 34134, Republic of Korea
3
Innovalley Substantiation Team, Korea Agriculture Technology Promotion Agency, Sangju 37127, Republic of Korea
*
Authors to whom correspondence should be addressed.
Agriculture 2023, 13(1), 44; https://doi.org/10.3390/agriculture13010044
Submission received: 24 November 2022 / Revised: 17 December 2022 / Accepted: 21 December 2022 / Published: 23 December 2022

Abstract

:
The objectives of this study are the development and verification of a simulation model of the partial PST (power-shift transmission) tractor based on actual field operations. The PST simulation model was verified for the asphalt driving condition, and performance was evaluated for asphalt driving, plow, and rotary tillage. In this study, the traditional, APS (Auto Power Shift) ECO, and APS power engine modes were used to analyze fuel consumption. The statistical analysis proved that the experimental and simulation results were in a linear relationship, with an accuracy of over 98%. Finally, the results suggested that users could utilize the 95-kW partial PST tractor in the APS ECO engine mode with higher fuel economy compared to the traditional and APS power modes.

1. Introduction

The agricultural tractor has to perform in various working environments and provide large amounts of traction force at low driving speed. Several new technologies in agricultural machinery, such as unmanned or autonomous vehicles and artificial intelligence, are implemented bearing in mind comfort for the driver, efficiency, and precision [1]. To ensure drivers’ flexibility, precise farm operation, and maximized power delivery in each working condition during field operations, academic researchers and manufacturers are continuously developing numerous powertrains for off-road vehicles. Among them, manual transmission (MT), automatic transmission (AT), dual-clutch transmission (DCT), continuously variable transmission (CVT), as well as power shift transmission (PST) are developed for the tractors [2,3,4].
PST is a precision technology that makes it easy and convenient for users to regulate and maintain the tractor during on-field operations. It can change the gear stages precisely during operation under the load conditions of the tractor [5]. The partial PST tractors deal with the two or more gear stages without using a clutch, although it must have clutched to shift gears. However, the users can shift all gears without using the clutch in the full PST tractors [6]. Neto et al. [7] conducted research on CVT with full powershift (FPS) to improve the efficiency of the agricultural tractor and reported that the FPS was more energy efficient. Therefore, a PST model was proposed considering its high efficiency, smoothness, and wide range of applications (small, medium, and large tractors). In PST, the hydraulic proportional valve is used to regulate and precisely control the hydraulic pressure. The proportional valve also utilizes an electric control signal to engage for delivering power, comfort during driving, and economic efficiency [8]. PST technology is configured with a varied range of speed without loss of power when it delivers from the engine to the driving axles [1,6,9]. Hence, PST technology can be applied in low- to high-power vehicles and is gaining popularity for being a precise technology.
PST technologies have been designed with at least two or more wet clutches, which are regulated by the pressure supplied from the hydraulic proportional valve through a hydraulic circuit [10,11,12]. For decades, researchers have mainly been focused on reducing energy losses during engagement or disengagement of the clutches and on smooth and fast clutch engagement for user comfort [13]. Research has been conducted to implement proportional control valves in the agricultural machinery field to enhance performance [14,15]. Raikwar [16] developed the power shuttle system for tractors to regulate the pressure using the proportional control valve to actuate the clutch. He stated that the proportional control valve can engage and disengage the clutch precisely. As there are various factors relevant to the design of the model of the PST, the scholars attempt to identify the factors that influence precise clutch engagement considering fast engagement, smooth shifting, friction, reasonable operating load, and flexible operations.
Li et al. [17] designed a novel power shift transmission to improve performance and minimize manufacturing cost. In this study, coordinated control strategies for the upshift and downshift processes of the multiple clutches during tractor field operation were developed. However, the control strategy was not verified by the field experiment. Yiwei et al. [18] also developed an architecture modeling and high-level architecture (HLA) of the PST. In this study, the dynamic principles of the PST mechanical, hydraulic, and control subsystems were established, where the maximum error between simulation and test was found to be approximately 7.89%. Yang et al. [19] proposed the full power shift method of the HMT, which is divided into five stages (current range, prior stable stage, power transition stage, post stable stage, and target range). Another investigation was conducted on the working principle of the hydraulic valve for PST and evaluated with a bench test [20,21]. Also, the shifting quality improvement of the PST tractor was conducted with a simulation and a control algorithm [22,23]. The wear failure of the gear for PST was also studied [24]. However, there was a lack of field experiments during major agricultural operations.
In addition, Siddique et al. [25] reported that the important factors for hydraulic clutches are, first: sliding velocity [26], second: inertia [27], and finally: heat generation [28]. They developed a simulation model of the hydraulic clutch pack and designed the critical factors for the PST tractor. Also, they evaluated these factors using the hydraulic test bench based on various hydraulic oils of VG 32, 46, and 68 at different temperature levels such as 25, 40, 60, 80, and 100 °C. Siddique et al. [29] studied the fuel efficiency of the PST tractor according to engine load conditions using the indoor test. PTO (power-take-off) dynamometer was used to measure the engine loads and the tractor’s fuel consumption was measured by REO-CFMT. However, real agricultural operations were not conducted to validate the tractor simulation model.
In our study, a partial PST tractor simulation model was developed and verified for actual field operations using a real agricultural tractor. In addition, this study was focused on verifying the PST simulation model of the tractor considering major agricultural operations and engine mode. Therefore, the specific goals of our study were as follows: (i) to develop a PST simulation model for a tractor; (ii) to analyze the experimental data for different engine modes; (iii) to validate the simulation model during asphalt driving operation; and (iv) to make a correlation between the simulation and experimental results for major agricultural operations.

2. Materials and Methods

2.1. Partial PST Tractor Specifications

A 95-kW partial PST tractor (T130, TYM Co., Ltd., Gongju, Korea) was the target tractor to evaluate the developed simulation model. The tractor’s dimension was 4490 (L) × 2360 (W) × 2940 (H) mm. The rated torque of engine is 415 Nm at 2200 rpm of rated speed. The PST for forward and reverse is combined of 18 × 18 gear stages. The tractor’s gross weight is 44,587 N with distribution ratios for front and rear axles of 40.3 and 59.7%, respectively. The tractor specifications were listed in Table 1.
The tractor powertrain is composed of 2 high and low (power shifts), 3 power-shift type main clutches, and 3 mechanical type range shifts. Engine power is generally transmitted to the main clutch which deals with the forward-reverse and high-low shifts. Sequentially, the driving shaft drives the rear PTO connecting with the driving shift gear, range shaft gear, and PTO shift gear. Since the tractor sub-shift is performed with a mechanical gear, it is called the partial PST. The block diagram of the tractor powertrain is shown in Figure 1.

2.2. Partial PST Tractor Simulation Model

The simulation model was developed using the commercial simulation software LMS AMESim (version 16, SIEMENS AG, Munich, Germany) based on the powertrain of the PST tractor. The entire PST tractor simulation model is shown in Figure 2. The simulation model consists of forward/reverse, Hi/Low, and 3 main clutch packs that are the same structure including several mechanical components. Each clutch pack has a proportional control valve to engage or disengage the clutch. All hydraulic clutch packs are operated by hydraulic pressure supplied from a proportional control valve. The sub-shifting including creep was constructed with mechanical gears. The PTO gear stages were divided in three (P1, P2, and P3).
In this model, the hydraulic clutch pack was specified by a previous study [25]. The target tractor is operated by a 95-kW engine. The total engine power is delivered to the main transmission and rear PTO. The main transmission power is delivered to the driving axle dealing with the high-low clutch, main hydraulic clutch pack, and mechanical sub-shifting including creep and range. The tractor model was designed using the tractor’s gross weight and tire specifications. In this study, the measured data and engine characteristics map were applied to conduct and verify the simulation model. The axle load, which was measured from real field experiments was also used as an input parameter to characterize field operations such as asphalt driving, plow tillage, and rotary tillage. The specifications of the hydraulic component of the simulation model are listed in Table 2.

2.3. Simulation Conditions

2.3.1. Component Design of the Model

The hydraulic pump was specified with a gear ratio of 0.83, where the displacement volume and rotational speed were 14 cc/rev and 2200 rpm, respectively. The cracking pressure of the relief valve was 200 bar. The gas pre-charge pressure and the accumulator volume were 15 bar and 0.32 L, respectively.
Figure 3a shows the tuning of the relief valve. It can be observed that the relief valve started to open at the cracking pressure and it fully opened when the system pressure was 212.85 bar. The pre-charge pressure of the internal gas and the hydraulic fluid pressure of the accumulator were the same due to the system pressure of the hydraulic system, accounting for almost 212.85 bar, shown in Figure 3b.

2.3.2. Engine Characteristic Map

The static torque of the engine is a function of the rotational speed and throttle opening of the engine [11]. The theoretical model of the engine static torque is in Equation (1).
T e = f n e , α ,
where Te is the torque of the engine (Nm); ne is the rotational speed of the engine (rpm); and α is the throttle opening of the engine (%).
The throttle level of the engine controls the engine power by regulating the amount of fuel that enters the engine. The throttle opening of the engine is subjected to the throttle angles [25,30]. The engine map was designed for 100% load condition and Equation (1) was used to calculate the engine torque at each throttle level. The maximum torque for 100% throttle opening was found to be at around 500 Nm at an engine speed of 1600 rpm. The developed engine map was applied to conduct the simulation, which is shown in Figure 4.

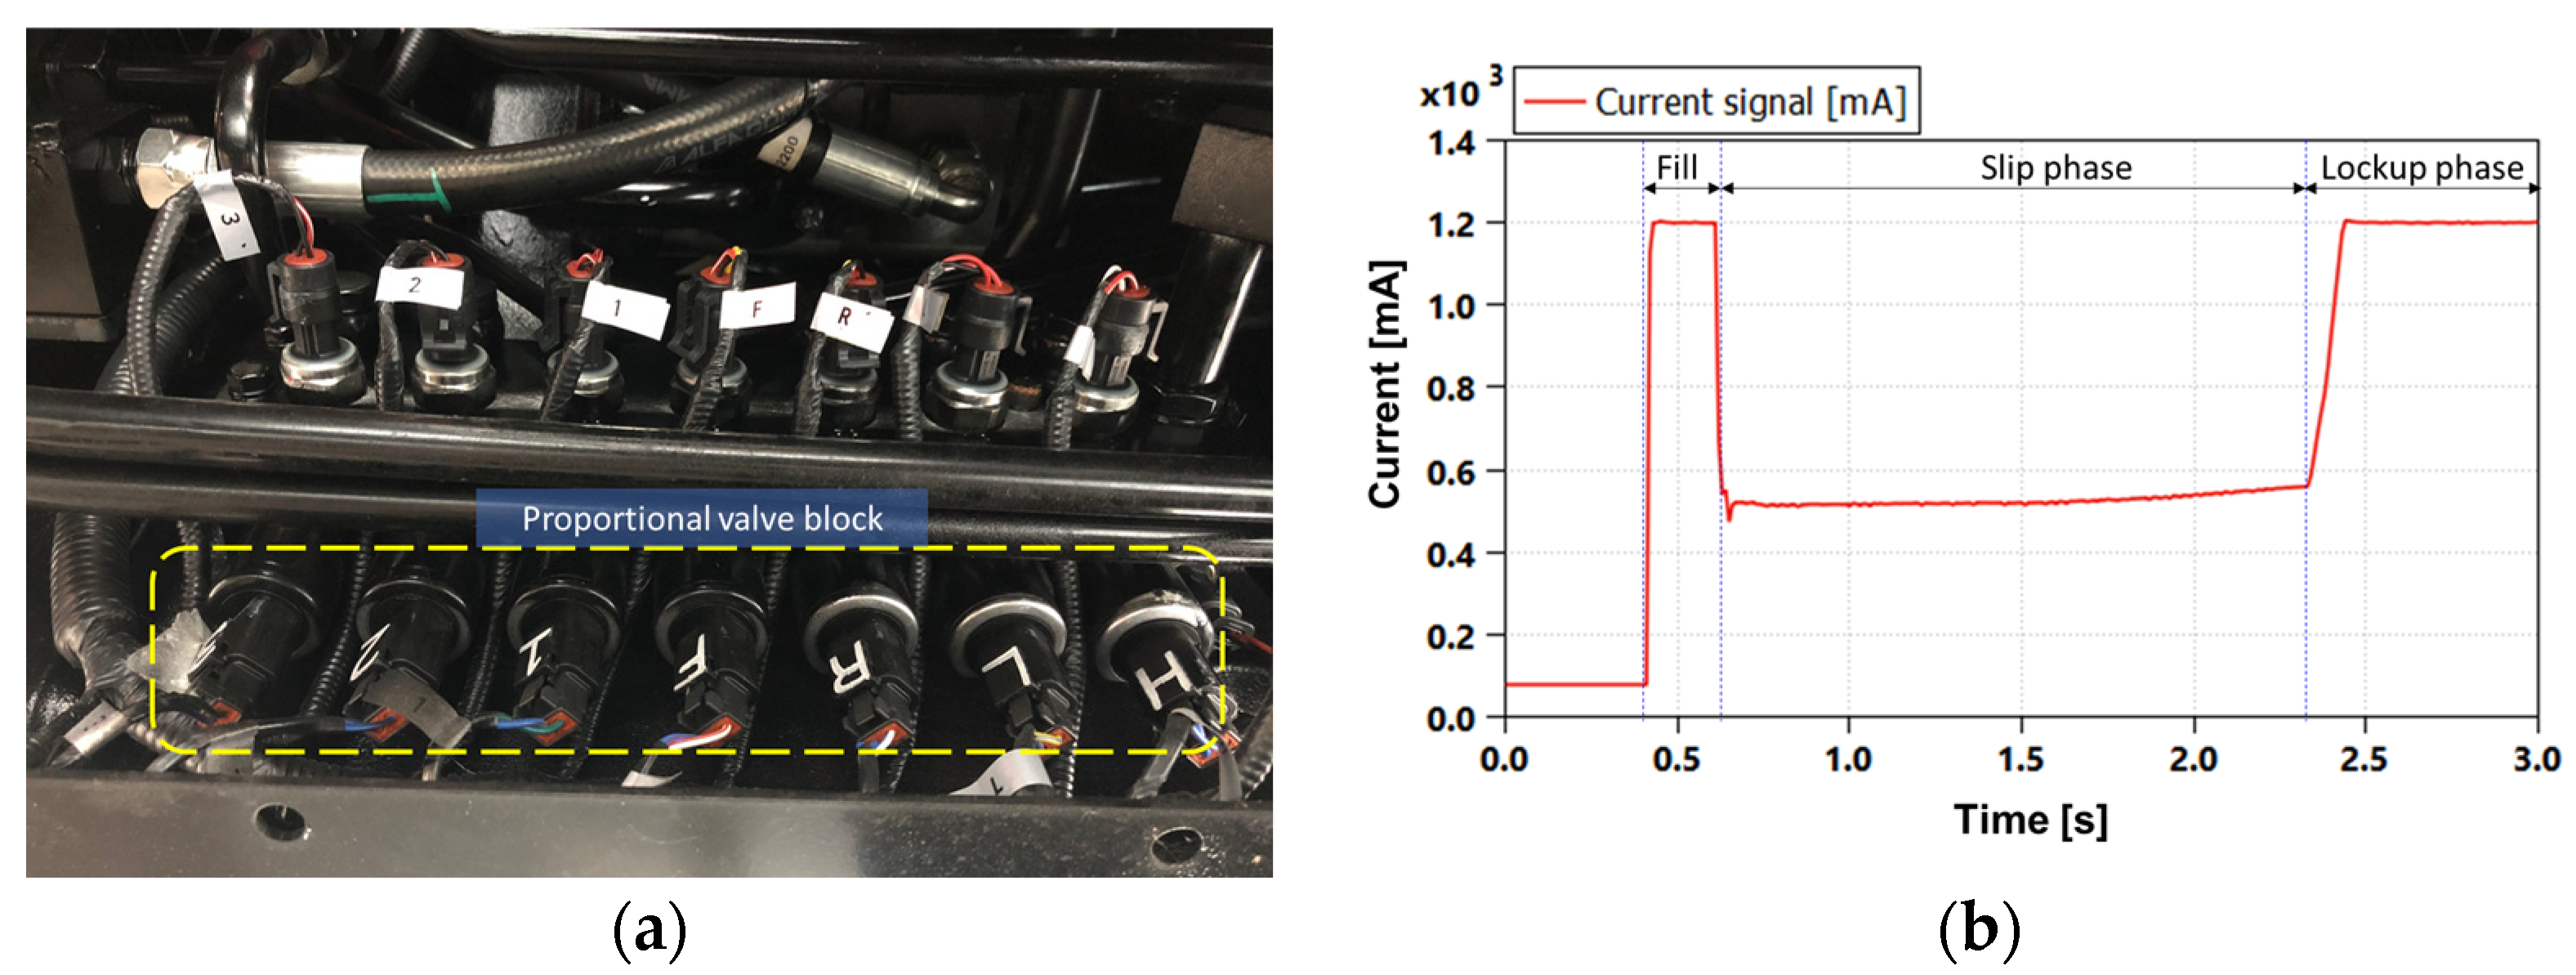
2.3.3. Command Current of Proportional Valve

The proportional valve is used for engaging or disengaging the forward and reverse, Hi and Low, and three main clutches. Therefore, a total of 7 proportional valves (Figure 5a) were used in this simulation model. The power was supplied to the TCU (tractor control unit). The TCU supplied current to the proportional valve in response to the command current signal profile. In the case of a real tractor, the tuned command current profile that is already set up in the tractor, can modify using sensor setting curve connecting the notebook with CAN bus. The command current profile is shown in Figure 5b. The command current has three phases: (i) Fill phase (fill current to fill the clutch’s internal empty volume); (ii) slip phase (slip current during slip between the friction and separate plates); and (iii) lockup phase (lockup current for the fully engaged clutch). The maximum command current was 1200 mA.

2.3.4. Axle Load Condition

The measured axle loads for asphalt driving, plow, and rotary tillage were used as input load profile to verify the model developed and make a realistic estimation with an actual tractor. Also, the axle load can differentiate each field’s operational condition in the simulation model. Figure 6 shows front left axle torque for asphalt driving, plow, and rotary tillage. During analysis, the fuel consumption during the operation period was considered. Therefore, the load profile was also considered only during the operation period.

2.4. Experimental Conditions

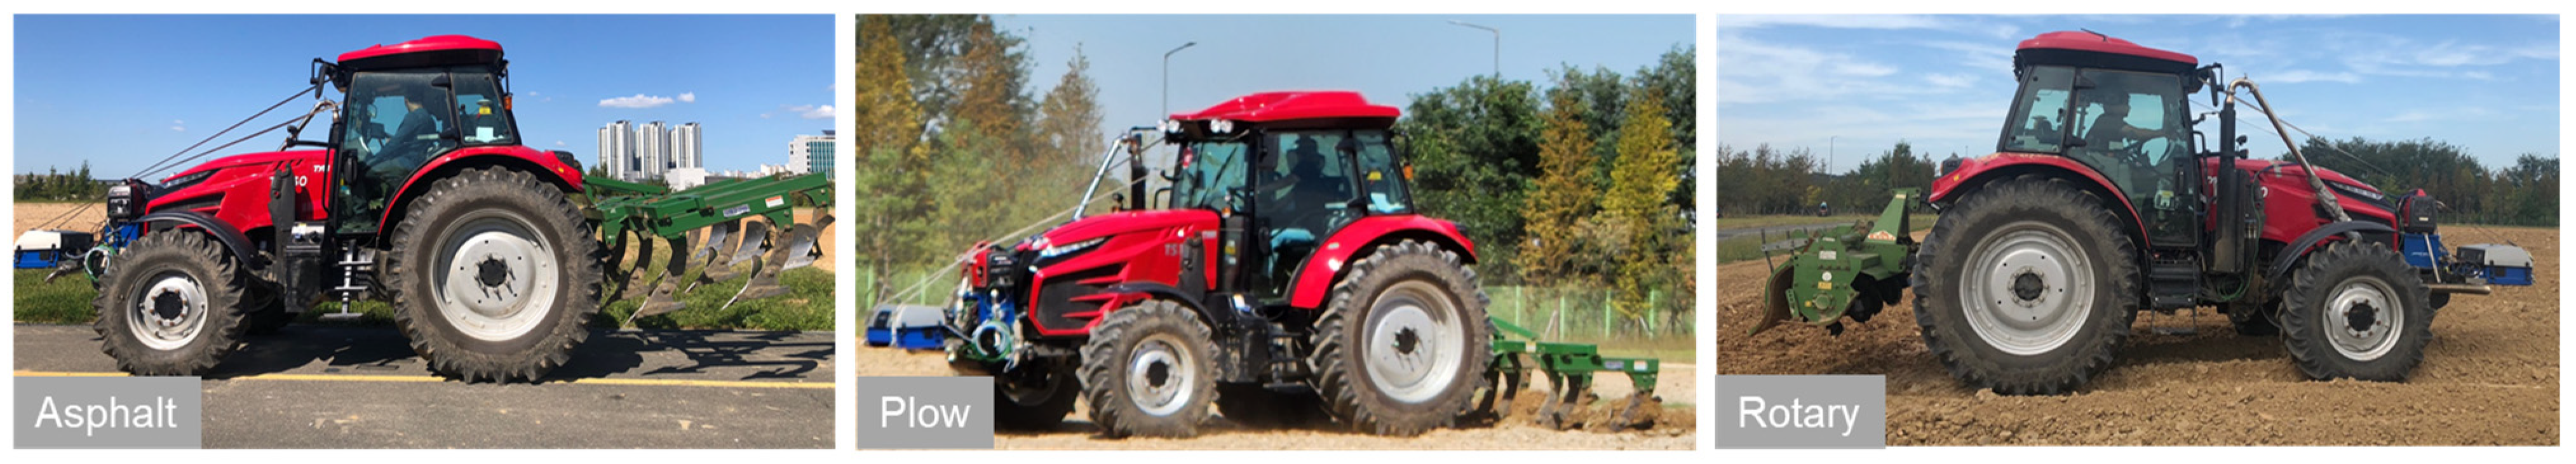
2.4.1. Operational Condition

The field experiment was conducted for the engine mode of traditional, APS (Auto Power Shift) ECO, and APS power mode for asphalt driving, plow, and rotary tillage. Each operation was replicated 3 times to compare the fuel economic mode of operation. The field experiments for asphalt, plow, and rotary are shown in Figure 7. The operations were conducted at a maximum rotational speed of 2300 rpm in the engine traditional mode. In case of the APS ECO mode, the engine speed was set to 1400 rpm, whereas 1800 rpm of engine rotational speed was set for APS power mode. The field operation conditions are listed in Table 3.

2.4.2. Experimental Site Condition

To test the field operation of the tractor, the experimental site Jeonju (RDA research field, Korea) was selected. Soil samples from the experimental site were collected and the soil texture was analyzed to determine the field condition using the USDA soil texture triangle, the hardness of the soil (Cone index, CI), and the electrical conductivity (EC). The soil samples were collected randomly at 5 points of each experimental site and physical and mechanical properties were measured. The soil analysis results for both fields are listed in Table 4.

2.5. Statistical Analysis

Fuel consumption rates of the tractor for various engine modes were statistically analyzed for asphalt driving, plow, and rotary tillage. The error and accuracy of the fuel consumption rate for various engine modes were analyzed for both simulation and experimental approaches by regression methods using IBM SPSS Statistics (SPSS 25, SPSS Inc., New York, NY, USA). The R-squared value was determined and values over 0.90 were considered reliable [31]. R-squared can be obtained using Equation (2).
R 2 = 1 i   y i y i ^ 2 i   y i y ´ 2 ,
where R 2 is the regression coefficient of the fuel consumption rate for both methods; y i is the ith measured fuel consumption rate (kg/h); y i ^ is the ith simulation fuel consumption rate (kg/h), and y ´ is the mean of the measured fuel consumption (kg/h).

3. Results

3.1. Fuel Consumption Analysis

3.1.1. Asphalt Driving Operations

Fuel consumption tests for asphalt driving at gear stage H3 (traditional), H5 (APS ECO), and H4 (APS power) were conducted. It was observed that the fuel consumption rate was the highest with the traditional engine mode at maximum rotational speed of 2300 rpm, accounting for averages of 10.86 and 11.12 kg/h for measured and simulation, respectively. The lowest fuel consumption rate was found at H5 (APS ECO engine mode) for 1350 rpm speed, where the measured and simulation average fuel consumptions were almost 6.00 and 6.67 kg/h, respectively. The fuel consumption rates at various engine modes were listed in Table 5.
In the comparison among engine modes, it was observed that the fuel consumption with the APS ECO mode for both measured and simulation were the most economic compared to traditional mode, accounting for around 44.73 and 40.05%, respectively. It was also observed that fuel consumption with APS power mode for both measured and simulation were almost 21.42 and 13.35%, respectively, which is more economic than the traditional mode. The statistical analysis shows that the simulation and measured fuel consumptions were linearly corelated, with an R2 of 0.9845. The statistical analysis results are shown in Figure 8.

3.1.2. Plow Tillage

Fuel consumption tests for plow tillage at gear stage M3 (traditional), M4 (APS ECO), and M4 (APS power) were conducted. The highest average fuel consumptions for the traditional mode were approximately 20.2 and 20.0 kg/h for measured and simulation, respectively. The lowest measured and simulation average fuel consumptions at M4 (APS ECO engine mode) for 1650 rpm speed were almost 14.9 and 15 kg/h, respectively. The fuel consumption rates at various engine modes were listed in Table 6.
In the comparison among engine modes, it was observed that the fuel consumption with the APS ECO mode for measured and simulation were the most economic compared to the traditional mode, accounting for around 25.89 and 25.17%, respectively. It was also observed that fuel consumption with APS power mode for both measured and simulation were almost 19.64 and 13.25%, respectively, which was more economic than the traditional mode. The statistical analysis shows that the simulation and measured fuel consumptions were linearly corelated, with an R2 of 0.992. The statistical analysis results are shown in Figure 9.

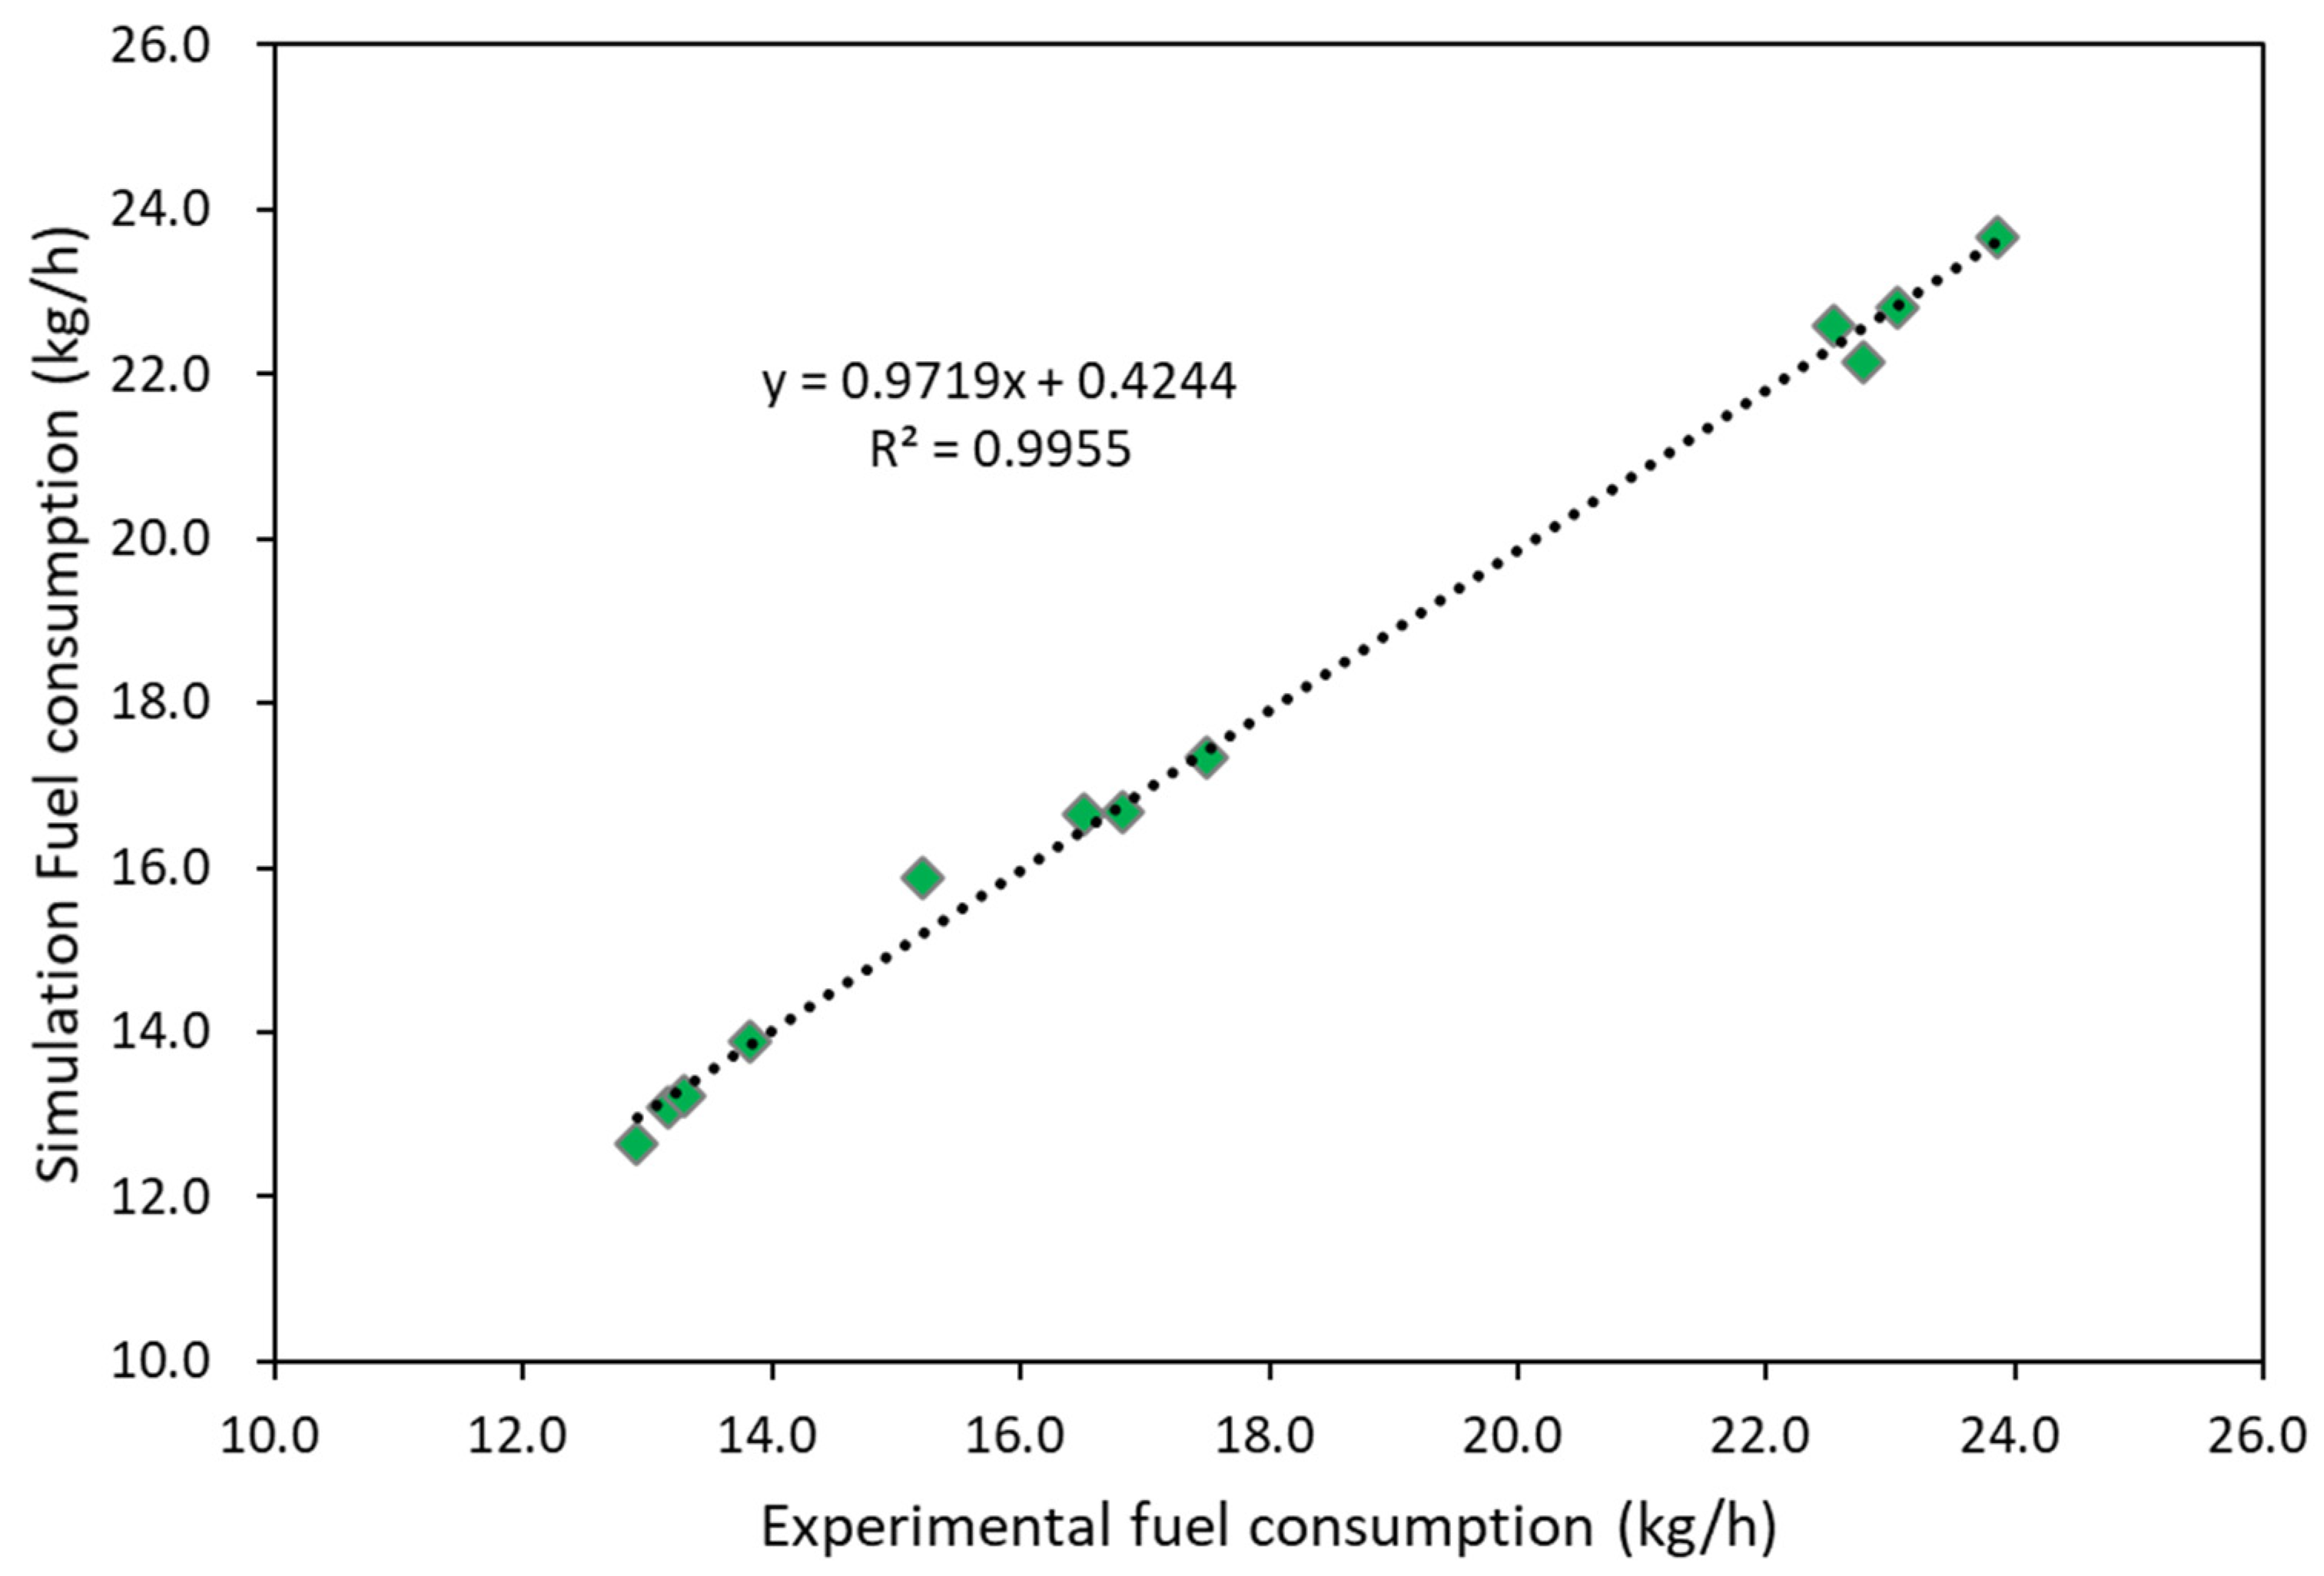
3.1.3. Rotary Tillage

Fuel consumption tests for rotary tillage at gear stage L3 (traditional), L4 (APS ECO), and L4 (APS power) were conducted. The highest fuel consumption was with the traditional mode of engine, accounting for averages of 23.1 and 22.8 kg/h for measured and simulation, respectively. The lowest fuel consumption rates were found to be almost 13.3 and 13.2 kg/h at L4 (APS ECO engine mode) for measured and simulation, respectively. The fuel consumption rates at various engine modes were listed in Table 7.
In the comparison among engine modes, it was observed that fuel consumption with the APS ECO mode for both measured and simulation were more economic compared to the traditional mode, accounting for around 42.35 and 42.06%, respectively. It was also observed that fuel consumption with the APS power mode for both measured and simulation were almost 28.41 and 27.04%, respectively, which was more economic than the traditional mode. The statistical analysis shows that the simulation and measured fuel consumptions were linearly corelated, with an R2 of 0.9955. The statistical analysis results are shown in Figure 10.

3.2. Performance Evaluation

To generalize our model for actual operations, it is necessary to consider low fuel consumption rate and high torque. Therefore, the experimental load generated during asphalt driving, plow, and rotary tillage at various engine modes were plotted in the performance curve, which is shown Figure 11. Fuel consumption was gradually increased after an engine speed of 1500 rpm. This indicates that the engine should run at a low speed to minimize fuel consumption. However, tractor working efficiency would be decreased at a low speed. It may unexpectedly be turned off the engine due to the load variation. For this reason, the engine speed should remain under the ungoverned region. The efficiency was comparatively high but the fuel consumption was relatively lower.
It is clearly observed that the engine loads remain in the ungoverned zone for the APS ECO and APS power modes at all gear stages for asphalt driving, plow, and rotary tillage. However, APS power mode consumes higher fuel compared to APS ECO. Therefore, it is suggested to the users to operate the tractor in the APS ECO mode for high fuel economy and reasonable working loads.

4. Conclusions

This study focused on the verification and performance evaluation of the simulation model of a partial PST tractor for various engine modes during field operations. A 95-kW partial PST tractor was used to evaluate the simulation model and perform the field experiment. The simulation model was verified using the asphalt driving condition and evaluated the performance for plow and rotary tillage at different engine modes. Finally, the most suitable and economic gear stages or engine modes were suggested to users for field operations. The overall findings of the study are listed below:
  • Fuel consumption in the APS ECO engine mode for both measured and simulation were highly economic in comparison with the traditional engine mode, which were accounting for approximately 44.73 and 40.05%, respectively. Between the APS ECO and APS power modes, APS ECO was also more economic compared to APS power, accounting for around 21.42 and 13.35% for measured and simulation, respectively. The statistical analysis showed that both experimental and simulation results were linearly corelated, with an R2 of 0.9845.
  • In the plow tillage case, it was found that fuel consumption for the APS ECO engine mode was the most economic compared to traditional and APS power engine modes. The fuel consumption in the APS ECO mode for measured and simulation were around 25.89 and 25.17%, respectively compared to the traditional mode; in APS power mode, measured and simulation were almost 19.64 and 13.25%, respectively compared to the traditional mode. The statistical analysis shows that the simulation and measured fuel consumptions were in linear relation, with an R2 of 0.992.
  • In the comparison among engine modes during rotary tillage, it was observed that the fuel consumption in the APS ECO mode for both measured and simulation were the most economic compared to the traditional mode, accounting for around 42.35 and 42.06%, respectively. It was also observed that fuel consumption in the APS power mode for measured and simulation were almost 28.41 and 27.04%, respectively, which was also economic than the traditional mode. The statistical analysis shows that the simulation and measured fuel consumptions were in linear relation, with an R2 of 0.9955.
  • It is clearly observed that the engine loads remain in the ungoverned zone for the APS ECO and APS power modes at all gear stages for asphalt driving, plow, and rotary tillage. However, the APS power mode consumes more fuel compared to APS ECO. Therefore, it is suggested to users to operate the tractor in APS ECO mode for high fuel economy and reasonable working loads.
In summary, according to the statistical analysis, the simulation model was verified in the asphalt driving condition and the model was performed with accuracy as the experimental and simulation results were in a linear relationship with accuracy of over 98%. It was observed that the APS ECO engine mode is highly fuel economic compared to the traditional and APS power modes. Therefore, it could be suggested that users should perform the operations using the partial PST tractor in the APS ECO engine mode to improve fuel consumption.

Author Contributions

Conceptualization, M.A.A.S., R.-G.L. and Y.-J.K.; methodology, M.A.A.S., S.-M.B. and S.-Y.B.; software, M.A.A.S.; validation, M.A.A.S., S.-Y.B. and S.-M.B.; formal analysis, M.A.A.S.; investigation, R.-G.L. and Y.-J.K.; writing—original draft preparation, M.A.A.S.; writing—review and editing, M.A.A.S.; visualization, M.A.A.S., R.-G.L. and Y.-J.K.; supervision, Y.-J.K. and R.-G.L.; project administration, Y.-J.K.; funding acquisition, Y.-J.K. All authors have read and agreed to the published version of the manuscript.

Funding

This work was supported by the Korea Institute of Planning and Evaluation for Technology in Food, Agriculture and Forestry (IPET) through the Advanced Production Technology Development Program, funded by the Ministry of Agriculture, Food and Rural Affairs (MAFRA) (320080-3). It was also supported by the Korea Institute of Planning and Evaluation for Technology in Food, Agriculture and Forestry (IPET) thorough Technology Commercialization Support Program, funded by Ministry of Agriculture, Food and Rural Affairs (MAFRA) (821014-03).

Institutional Review Board Statement

Not applicable.

Informed Consent Statement

Not applicable.

Data Availability Statement

Data are presented in this article in the form of figures and tables.

Conflicts of Interest

The authors declare no conflict of interest.

References

  1. Tanelli, M.; Panzani, G.; Savaresi, S.M.; Pirola, C. Transmission Control for Power-Shift Agricultural Tractors: Design and End-of-Line Automatic Tuning. Mechatronics 2011, 21, 285–297. [Google Scholar] [CrossRef]
  2. Baek, S.M.; Kim, W.S.; Kim, Y.S.; Baek, S.Y.; Kim, Y.J. Development of a Simulation Model for HMT of a 50 kW Class Agricultural Tractor. Appl. Sci. 2020, 10, 4064. [Google Scholar] [CrossRef]
  3. Kim, W.S.; Kim, Y.J.; Kim, Y.S.; Baek, S.Y.; Baek, S.M.; Lee, D.H.; Nam, K.C.; Kim, T.B.; Lee, H.J. Development of Control System for Automated Manual Transmission of 45-kW Agricultural Tractor. Appl. Sci. 2020, 10, 2930. [Google Scholar] [CrossRef] [Green Version]
  4. Liyou, X.; Yihao, Z.; Jinzhong, S.; Xianghai, Y. Optimization of Power Shift Tractor Clutch Based on Ahp and Improved Genetic Algorithm. Acta Tech. 2017, 62, 373–384. [Google Scholar]
  5. Liang, J.; Yang, H.; Wu, J.; Zhang, N.; Walker, P.D. Power-on Shifting in Dual Input Clutchless Power-Shifting Transmission for Electric Vehicles. Mech. Mach. Theory 2018, 121, 487–501. [Google Scholar] [CrossRef]
  6. Siddique, M.A.A.; Kim, T.J.; Kim, Y.J. Technical Trend of the Power Shift Transmission (PST) of Agricultural Tractor. J. Drive Control 2020, 17, 68–75. [Google Scholar]
  7. Neto, L.S.; Zimmermann, G.G.; Jasper, S.P.; Savi, D.; Sobenko, L.R. Energy Efficiency of Agricultural Tractors Equipped with Continuously Variable and Full Powershift Transmission Systems. Eng. Agric. 2022, 42, e20210052. [Google Scholar] [CrossRef]
  8. Li, C.; Ke, M.; Wu, Y. Research and Implementation of Tractor Power Shift Clutch Control System. MATEC Web Conf. 2018, 153, 04003. [Google Scholar] [CrossRef] [Green Version]
  9. Ngo, D.V.; Hofman, T.; Steinbuch, M.; Serrarens, A.; Merkx, L. Improvement of Fuel Economy in Power-Shift Automated Manual Transmission through Shift Strategy Optimization-An Experimental Study. In Proceedings of the 2010 IEEE Vehicle Power and Propulsion Conference, Lille, France, 1–3 September 2010; IEEE: Piscataway, NJ, USA, 2010; pp. 1–5. [Google Scholar] [CrossRef]
  10. Molari, G.; Sedoni, E. Experimental Evaluation of Power Losses in a Power-Shift Agricultural Tractor Transmission. Biosyst. Eng. 2008, 100, 177–183. [Google Scholar] [CrossRef]
  11. Li, B.; Sun, D.; Hu, M.; Liu, J. Research on Economic Comprehensive Control Strategies of Tractor-Planter Combinations in Planting, Including Gear-Shift and Cruise Control. Energies 2018, 11, 686. [Google Scholar] [CrossRef] [Green Version]
  12. Li, B.; Sun, D.; Hu, M.; Liu, J. Automatic Starting Control of Tractor with a Novel Power-Shift Transmission. Mech. Mach. Theory 2019, 131, 75–91. [Google Scholar] [CrossRef]
  13. Holgerson, M. Influence of Operating Conditions on Friction and Temperature Characteristics of a Wet Clutch Engagement. Tribo Test 2000, 7, 99–114. [Google Scholar] [CrossRef]
  14. Siddique, M.A.A.; Kim, W.S.; Kim, Y.S.; Kim, T.J.; Choi, C.H.; Lee, H.J.; Chung, S.O.; Kim, Y.J. Effects of Temperatures and Viscosity of the Hydraulic Oils on the Proportional Valve for a Rice Transplanter Based on PID Control Algorithm. Agriculture 2020, 10, 73. [Google Scholar] [CrossRef] [Green Version]
  15. Siddique, M.A.A.; Kim, W.S.; Baek, S.Y.; Kim, Y.J.; Park, S.U.; Choi, C.H.; Choi, Y.S. Analysis of the Axle Load of a Rice Transplanter According to Gear Selection. J. Drive Control 2020, 17, 125–132. [Google Scholar] [CrossRef]
  16. Raikwar, S.; Tewari, V.K.; Mukhopadhyay, S.; Verma, C.R.B.; Sreenivasulu Rao, M. Simulation of Components of a Power Shuttle Transmission System for an Agricultural Tractor. Comput. Electron. Agric. 2015, 114, 114–124. [Google Scholar] [CrossRef]
  17. Li, B.; Sun, D.; Hu, M.; Zhou, X.; Liu, J.; Wang, D. Coordinated Control of Gear Shifting Process with Multiple Clutches for Power-Shift Transmission. Mech. Mach. Theory 2019, 140, 274–291. [Google Scholar] [CrossRef]
  18. Yiwei, W.; Xianghai, Y.; Zhili, Z. Architecture Modeling and Test of Tractor Power Shift Transmission. IEEE Access 2021, 9, 3517–3525. [Google Scholar] [CrossRef]
  19. Yang, S.; Bao, Y.; Fan, C. Study on Characteristics of Hydro-Mechanical Transmission in Full Power Shift. Adv. Mech. Eng. 2018, 10, 1687814018790668. [Google Scholar] [CrossRef]
  20. Wang, F.; Wang, Y.; Han, J.H.; Yao, J. Experimental and Simulated Studies on Hydraulic Buffering Valve for ZF-4WG308 Power-Shift Transmission. J. Cent. South Univ. 2017, 24, 1801–1807. [Google Scholar] [CrossRef]
  21. Wu, Y.; Mao, Y.; Xu, L. FMI-Based Co-Simulation Method and Test Verification for Tractor Power-Shift Transmission. PLoS ONE 2022, 17, e0263838. [Google Scholar] [CrossRef]
  22. Song, L.; Xu, L.; Liu, M. Research on the Law of Dynamic Shifting and Coordinated Section Shifting of Tractor Full-Power Shift Transmission. J. Phys. Conf. Ser. 2022, 2343, 012021. [Google Scholar] [CrossRef]
  23. Xia, G.; Chen, J.; Tang, X.; Zhao, L.; Sun, B. Shift Quality Optimization Control of Power Shift Transmission Based on Particle Swarm Optimization–Genetic Algorithm. J. Automob. Eng. 2021, 236, 872–892. [Google Scholar] [CrossRef]
  24. Wang, H.; Ma, B.; Niu, L.; Zheng, C. The Wear Characteristics of Thrust Washer in Conflux Planetary Gear Train of Power Shift Transmission. Eng. Fail. Anal. 2013, 28, 318–327. [Google Scholar] [CrossRef]
  25. Siddique, M.A.A.; Kim, W.S.; Kim, Y.S.; Baek, S.Y.; Baek, S.M.; Kim, Y.J.; Park, S.U.; Choi, C.H. Simulation of Design Factors of a Clutch Pack for Power-Shift Transmission for an Agricultural Tractor. Sensors 2020, 20, 7293. [Google Scholar] [CrossRef]
  26. Yamaguchi, T.; Ando, J.; Tsuda, T.; Takahashi, N.; Tohyama, M.; Murase, A.; Ohmori, T.; Hokkirigawa, K. Sliding Velocity Dependency of the Friction Coefficient of Si-Containing Diamond-like Carbon Film under Oil Lubricated Condition. Tribol. Int. 2011, 44, 1296–1303. [Google Scholar] [CrossRef]
  27. Fatima, N.; Marklund, P.; Larsson, R. Influence of Clutch Output Shaft Inertia and Stiffness on the Performance of the Wet Clutch. Tribol. Trans. 2013, 56, 310–319. [Google Scholar] [CrossRef]
  28. Abdullah, O.I.; Schlattmann, J. The Effect of Disc Radius on Heat Flux and Temperature Distribution in Friction Clutches. Adv. Mat. Res. 2012, 505, 154–164. [Google Scholar] [CrossRef]
  29. Siddique, M.A.A.; Baek, S.M.; Baek, S.Y.; Kim, W.S.; Kim, Y.S.; Kim, Y.J.; Lee, D.H.; Lee, K.H.; Hwang, J.Y. Simulation of Fuel Consumption Based on Engine Load Level of a 95 kW Partial Power-Shift Transmission Tractor. Agriculture 2021, 11, 276. [Google Scholar] [CrossRef]
  30. Bera, P. Torque Characteristic of SI Engine in Dynamic Operating States. Combust. Engines 2017, 171, 175–180. [Google Scholar] [CrossRef]
  31. Shafaei, S.M.; Kamgar, S. A Comprehensive Investigation on Static and Dynamic Friction Coefficients of Wheat Grain with the Adoption of Statistical Analysis. J. Adv. Res. 2017, 8, 351–361. [Google Scholar] [CrossRef]
Figure 1. The block diagram of a 95-kW partial PST tractor transmission.
Agriculture 13 00044 g001
Figure 2. The simulation model of a 95-kW partial PST tractor.
Agriculture 13 00044 g002
Figure 3. The hydraulic component design for the partial PST tractor. (a) Relief valve, (b) accumulator.
Agriculture 13 00044 g003
Figure 4. The 95-kW engine characteristics map used in this study.
Agriculture 13 00044 g004
Figure 5. Proportional valves assembly with command current signal. (a) Proportional valve block of T130, (b) command signal of proportional valve.
Agriculture 13 00044 g005
Figure 6. Axle loads of the target partial PST tractor during operations. (a) Asphalt driving, (b) plow tillage, (c) rotary tillage.
Agriculture 13 00044 g006
Figure 7. The experiment using a 95-kW partial PST tractor.
Agriculture 13 00044 g007
Figure 8. Regression analysis of fuel consumption during asphalt operation.
Agriculture 13 00044 g008
Figure 9. Regression analysis of fuel consumption during plow tillage.
Agriculture 13 00044 g009
Figure 10. Regression analysis of fuel consumption during rotary tillage.
Agriculture 13 00044 g010
Figure 11. Performance evaluation of a partial PST tractor during asphalt, plow, and rotary tillage.
Agriculture 13 00044 g011
Table 1. The specifications of the partial power-shift transmission (PST) tractor used in this study.
ParametersSpecifications
ModelT130, TYM, Korea
Weight (N)Gross weight (N)44,587
Weight distribution (%)40.3 and 59.7
EngineTypeTier 4
Rated power (kW)95
Rated torque (Nm)415
Rated speed (rpm)2200
Shifting methodPower-shift
TransmissionMain clutch3
Sub-shifting stages3 (L, M, H)
Combinations (forward × reverse)18 × 18
TireModel (front and rear)380/85R24 and 460/85R38
Diameter (front and rear) (mm)1256 and 1770
Table 2. The hydraulic component specifications of the simulation model.
ParametersSpecifications
Gear pumpGear ratio0.83
Displacement (cc/rev)14
Rotational speed (rpm)1826
Relief valveCracking pressure (bar)200
AccumulatorTypeMembrane type
Precharge gasNitrogen (N2)
Volume (cc)320
Precharge pressure (bar)15
Proportional valveMax. current (mA)1200
Current signalUser command
Table 3. The experimental operation conditions of a partial PST tractor.
OperationsEngine ModeGear Stages (Speed)
AsphaltTraditionalH3 (2300)
APS ECOH5 (1400)
APS PowerH4 (1800)
Plow tillageTraditionalM3 (2300)
APS ECOH5 (1400)
APS PowerH4 (1800)
Rotary tillageTraditionalL3 (2300)
APS ECOH5 (1400)
APS PowerH4 (1800)
Table 4. Soil analysis of the experimental site.
ParameterSandSiltClay
Soil component (%)622216
Soil textureSandy loam
Electric conductivity (dS/m)0.46
Cone index (kPa)3306.8
Table 5. Fuel consumption analysis during asphalt driving.
Gear Stages
(Mode)
Setting SpeedReplicationsFuel Consumption
(rpm)Measured (kg/h)Simulation (kg/h)
H3
(Traditional)
2300111.0311.25
210.8511.17
310.7210.93
Average10.8611.12
H5
(APS ECO)
135016.007.86
26.006.18
36.025.96
Average6.006.67
H4
(APS Power)
175017.627.74
27.677.60
37.637.74
Average7.647.69
Traditional vs APS ECO (%)44.7340.05
Traditional vs APS power (%)21.4213.35
Table 6. Fuel consumption analysis during plow tillage.
Gear Stage
(Mode)
Setting SpeedReplicationsFuel Consumption
(rpm)Measured (kg/h)Simulation (kg/h)
M3
(Traditional)
2300119.819.3
221.421.2
319.319.5
Average20.220.0
M4
(APS ECO)
1650115.415.5
215.515.8
313.913.7
Average14.915.0
M4
(APS Power)
1800118.018.1
217.617.4
317.517.6
416.416.3
Average17.417.4
Traditional vs APS ECO (%)25.8925.17
Traditional vs APS power (%)19.6413.25
Table 7. Fuel consumption analysis during rotary tillage.
Gear Stage
(Mode)
Setting SpeedReplicationsFuel Consumption
(rpm)Measured (kg/h)Simulation (kg/h)
L3
(Traditional)
2300122.822.2
223.923.7
322.522.6
Average23.122.8
L4
(APS ECO)
1650113.213.1
212.912.7
313.813.9
Average13.313.2
L4
(APS Power)
1800117.517.4
215.215.9
316.816.7
Average16.516.6
Traditional vs APS ECO (%)42.3542.06
Traditional vs APS power (%)28.4127.04
Disclaimer/Publisher’s Note: The statements, opinions and data contained in all publications are solely those of the individual author(s) and contributor(s) and not of MDPI and/or the editor(s). MDPI and/or the editor(s) disclaim responsibility for any injury to people or property resulting from any ideas, methods, instructions or products referred to in the content.

