Abstract
A new non-destructive index of absorbance difference (IAD), calculated with different wavelengths as references, near the chlorophyll absorbance peak or that for anthocyanin, has been used to determine the fruit ripening of several fruit species using portable devices such as Standard DA-Meter® and Kiwi-Meter®. In this study, for the first time, the application of the IAD was evaluated on single, intact olives of the Leccino cultivar, as a single non-destructive maturity index to follow ripening in the field, directly on the tree. The IAD determined by both devices was found to be useful for monitoring the olive ripening, however, better performance was achieved with the Kiwi-Meter®. In fact, the IAD determined by this device was more effective at measuring all the studied olive ripening parameters in the calibration and validation datasets with acceptable accuracy. Specifically, better performance of the IDA by Kiwi-Meter® was observed in estimation of the color index (R2 = 0.817, DRMSEC = 0.404 and RPIQ = 3.863 for calibration and R2 = 0.752, DRMSECV = 0.574 and RPIQ = 3.244 for validation), confirming its potential for evaluating the degree of olive ripeness. This novel index has significant applicative possibilities, since it would allow rapid, on-site screening of the best harvesting time to improve the olive production in terms of both yield and quality.
1. Introduction
The quality of extra virgin olive oil mainly depends on its composition in terms of fatty acids and antioxidative and volatile compounds. Such composition is generally the result of a complex combination of cultivar, environment, fruit ripening, harvesting system, extraction system and storage conditions [1,2,3]. Among these factors fruit ripening is one of the most important, since harvesting time affects the physical, chemical and organoleptic characteristics of the oil, as well as the yield [3,4]. Indeed, monitoring olive ripening in order to determine the best harvesting period is a critical step in the extra virgin olive oil production chain. After fruit set, olives grow according to a double sigmoidal curve [4]. After 12–16 weeks of fruit growth, olive ripening begins [5,6,7,8]. During ripening, the fruit continues to grow, and the chlorophyll content declines and is replaced by anthocyanins, which contribute to olive color and oxidative stability [9,10]. Moreover, changes in the cell wall structure and composition lead to modification of the fruit texture. Specifically, a progressive loss of firmness due to enzymatic activities involved in the degradation of cell wall polysaccharides has been observed [11]. Water and oil contents, which are the major components of the mesocarp (pulp) and exocarp (skin), also vary during the fruit ripening process [12,13]. Oil increases in the olive pulp from the end of stone hardening and accumulates during ripening. In the Northern Hemisphere, at the end of summer–beginning of autumn (September and October), oil accumulates rapidly [5,14,15]. Thereafter, the rate of accumulation in most cultivars gradually decreases and then ceases between mid-November and mid-December. At the same time, fruit drop occurs. Almost all of the oil accumulates in the pulp and only a small amount in the seed (2–4%) [4,5,16,17,18]. During ripening, the amount of oil that can be obtained varies as a result of a combination of fruit growth, oil accumulation in the pulp and fruit drop. Usually, when the drop exceeds 10% of the total fruits, there is a decrease in the quantity of oil obtainable from each tree [4,19]. As olives ripen, the quality of the oil extracted also changes. As ripening proceeds, chlorophylls and carotenoids decrease, oleic acid increases and palmitic acid decreases [19]. At the beginning of ripening, volatile compounds, such as aldehydes, especially trans-2-hexenal (responsible for the “herbaceous” scent), saturated and unsaturated alcohols at C5 and C6 and esters, and phenolic substances, with nutraceutical value and responsible for the bitter and pungent sensations of the oil, are at the highest levels and then decline, more or less rapidly depending on the cultivar and seasonal pattern [14,19].
Therefore, the decision of harvesting time is very important because it can significantly affect both the quantity and quality of oil produced in the olive orchard. For this reason, ripening indices have been developed to indicate harvesting time. The most common is the color assessment method, known as the Jaén index or maturity index (MI), which indicates the degree of fruit ripening on a scale of fruit pigmentation ranging from zero (green) to seven (pigmentation of the whole epicarp and mesocarp) [4,19,20,21,22,23,24,25,26]. However, fruit color-based MI does not always evolve linearly over time, and is affected by the cultivar and environmental factors [13,27,28,29]. Nevertheless, this index is the most used worldwide because it has proved to be a useful reference for both the quantitative and qualitative purposes of harvesting. In fact, expressing the oil content as a percentage of dry weight, the maximum values are reached in most cultivars when the MI approaches four and the quality of the oil tends to reduce from this value upward [4,5,19,22]. This is why harvesting is generally executed when the MI is lower than four. Other indices have also been tested and, according to some authors, in the early ripening stages, pulp firmness gives a better indication of the degree of maturation than color assessment [30,31,32]. Indices based on the determination of oil and sugar content have also been developed, but they require laboratory analyses [33].
All of the indices mentioned are destructive, require lab equipment and chemicals and are time consuming. Therefore, research is focusing on developing indices that consider several variables and are rapidly measurable with non-destructive techniques.
Vis/NIR (visible and near-infrared) spectroscopy is a proven measurement technology that has been implemented for the non-invasive analysis and identification of important structures and functional groups of organic substances [34].
Advances in Vis/NIR technology have resulted in the development of portable field instruments that enable spectral information to be obtained directly on the fruit on the tree [35], allowing more rapid and efficient analysis to determine the stage of fruit ripening [36,37,38,39,40].
Recently, at the University of Bologna, fast and non-destructive devices have been developed that are able to measure a new parameter, the Index of Absorbance Difference (IAD), which is helpful in determining the fruit ripening of several pome and stone fruits and kiwifruit [41]. This IAD can be determined by using the following devices: Standard DA-Meter® (patent number MO 2005000211) and Kiwi-Meter® (patent number PD 2009A00081). These devices can be used to assess harvest time, since they allow the ripening stage evolution of fruit to be followed “on the tree” [41]. Costa et al. [41] found that the IAD correlated with the traditional fruit quality traits, such as soluble solid content, flesh firmness and titratable acidity, as well as with important parameters which modify with fruit ripening, such ethylene production, climacteric stage and flesh firmness, which are difficult to determine with non-destructive devices.
In particular, the Standard DA-Meter® is based on IAD calculated as the difference between absorbance values at 670 nm and 720 nm, near the chlorophyll absorbance peak [41,42], and between 670 nm and 970 nm for determining the water content [43]. The two wavelengths (670 and 720 nm) were chosen since they are close to the absorbance peak of chlorophyll-a [44,45]. Several authors found that the index of the absorption difference between 670 and 720 nm was strongly related to the chlorophyll content of apple fruit when it is close to its state of ripeness [46]. Other authors tested the use of the DA-Meter to define the different ripening stages of peaches while they were still attached to the tree [44,47,48].
The Kiwi-Meter® was developed specifically for kiwifruit, and it differs from the Standard DA-Meter® by the wavelengths used. The Kiwi-Meter® uses 545 to 640 nm, wavelengths for anthocyanin, with 750 nm as the reference point [41].
In this study, olive fruits of Leccino, which is an Italian cultivar known worldwide, were used. The olives were collected at different ripening stages and were characterized in terms of color index, pulp firmness and oil and water content. In addition, spectrometric measurements were performed on intact olives using both the Standard DA-Meter® and the Kiwi-Meter® in order to determine the IAD at each olive ripening stage.
The objective of this study was to evaluate, for the first time, the possible use of the IAD as a single non-destructive maturity index of olive directly in the field, using Standard DA-Meter® and Kiwi-Meter® devices, instead of using several ripening indices, such as Jaén index, pulp firmness, or fruit oil content, which are destructive, require lab equipment and chemicals, and are time consuming. This innovative index could emerge as a rapid tool to assess olive ripening directly in the field and, thus, be useful in determining the best harvesting time as well as the best olive milling and olive oil extraction technique, in order to replace traditional ripening indexes with a view of future fully automated applications [8,48].
2. Materials and Methods
2.1. Sampling
During olive ripening, periodically, eight hundred intact and healthy olives were randomly hand-picked from four trees (two hundred olives from each tree) of the cultivar Leccino that had a similar olive load. The olive trees have grown in an intensive 10-year-old orchard located near Perugia, Region of Umbria, central Italy (43°05′31.2″N, 12°19′47.6″E). The Leccino cultivar was chosen because it is widespread in Italy and it is also known worldwide [21,49]. The samples were collected from September to November 2020, every 7–10 days (4000 olives collected). The sampling days of year (DOY) are reported in Table 1. After the collection, fifty fruits from each tree on each sampling date (1000 olives in total) were used to perform the spectrometric measurements. The fruits were individually placed in an alveolus box before the analysis (Photo 1a). The samples of 50 fruits each were divided into two subsamples (25 fruits each) to estimate the mean value in terms of IAD and fruit ripeness characteristics, obtaining eight averaged values (repetitions) from each sampling DOY (40 in total).

Table 1.
Minimum, maximum, mean and standard deviation (SD) of the different measured parameters of olive samples at different degrees of ripeness.
2.2. Fruit Characteristics
For each of the 50 olives placed in the alveolus box, fresh weight was determined by using a digital balance with precision up to the fourth decimal place (OHAUS Corporation, Parsippany, New Jersey, USA). The pigmentation and the pulp firmness have been determined on each individual olive. Pigmentation was determined using the MI, ranging from 0 to 7, with 0 for green olives and 7 for olives with pigmentation up to 100% of the epicarp and 100% of the mesocarp [20]. Pulp (epicarp + mesocarp) firmness was measured using a hand-held dynamometer with a 1 mm plunger made of steel (Effegi, Ravenna, Italy). Firmness was expressed in Newton (N); the reading was detected as soon as the plunger penetrated the fruit. Oil and water contents on fresh weight (percent) were determined using an Infra Analyzer apparatus (Spectra Analyzer Zeutec, Rendsburg, Germany) on the whole olive harvest sample per tree and per each sampling DOY (200 fruits). Oil and water content are expressed as g olive−1, for each single fruit. Ten fruits of each sample and per sampling date were de–pulped to determine the pulp/stone ratio, the pulp percentage of each fruit and the oil content of the pulp of each olive (expressed as g pulp−1).
2.3. Spectrometric Measurements
Spectrometric measurements were performed using both the Standard DA-Meter® and the Kiwi-Meter® portable devices. Spectrometric measurements were performed on 50 fruits from each tree and sampling date with each device.
The Standard DA-Meter® is a portable instrument which allows measuring the content of chlorophyll present inside a fruit. It uses the IAD calculated as the difference between absorbance values at 670 nm, near the maximum chlorophyll absorbance peak [41,42], and 720 nm reference point and 970 nm for determining the water content [43].
The Kiwi-Meter® has the same operating principle as the Standard DA-Meter® and it measures the ripening stage of fruits belonging to the Actinidia species in both the yellow and green varieties [48]. The substances detected are anthocyanins, responsible for the color of the fruit. It differs from the DA-Meter® for the wavelengths used 540, 640 and 750 [48]. Each device is equipped with six LED diodes positioned around the detector. A set of two dyads emit the wavelengths indicated above. The fruit is illuminated alternatively with two monochromatic sources and for each the quantity of light re-emitted is measured. Light is measured by a centrally positioned photodiode and is converted into a digital signal. Successively, the data is displayed on a digital display, identified by the initials that were placed in the setting phase of the tool. The reading takes place by means of a LED placed in the upper part of the instrument, which has an oval-shaped recess, where the fruit is placed and irradiated by the ray.
Each devise took double spectrometric measurements, taken on opposite sides of each numbered olive, in order to assess, for each fruit, a representative IAD (Scheme 1A,B).
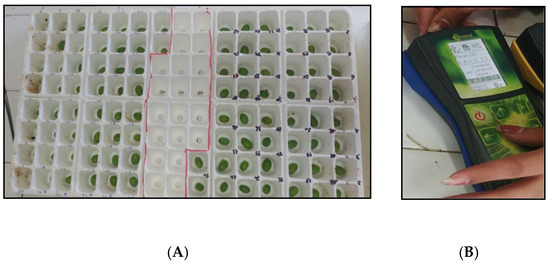
Scheme 1.
(A) Sample box with olive samples and numbered alveolus. (B) Kiwi-Meter® devise during measurement.
Twenty-five olive spectra, representing each experimental sample, were averaged to obtain the single mean spectrum of each repetition, in accordance with Giovenzana et al. [32].
2.4. Statistical Analysis
The fruit characteristics (color index, pulp firmness, fruit/pulp oil content and fruit water content) are presented as minimum, maximum, mean and standard deviation (SD) at different olive ripening degrees.
The analysis of variance (ANOVA) and post hoc Duncan’s test, at a 0.05 significance level, was used to test the influence of DOY on fruit ripeness indexes. The Pearson coefficient (r) was computed to check for correlation between the olive ripeness indexes. The linear regression between each fruit ripeness index, as color index, fruit and pulp oil content, pulp firmness and fruit water content, and IAD was evaluated by linear regression analysis.
To assess the quality of the linear regression models, cross-validation was applied using standard approaches. The dataset, described at Section 2.1, was divided into a calibration set (28 samples) and a cross validation set (12 samples) five times, selecting each time different sets of samples, with all the samples acting as the test items in turn [32]. Then, the calibration and validation results were averaged over the rounds to estimate the final model.
The resulting models were scrutinized by R2 and by the dimensionless root mean square error of calibration (DRMSEC) and cross validation (DRMSECV) calculated on standardized variables. They permit comparison of the performance of models, being better as DRMSE approaches zero [49,50]. Finally, the performance across the regression models was also compared using the “ratio of performance to interquartile range” (RPIQ) as suggested by Hernández-Sánchez and Gómez-Del-Campo [51].
All the statistical analyses were performed at the 95% confidence level (p < 0.05).
The data were statistically evaluated using Statistica 8 (StatSoft Italia s.r.l, Padova, Italy) and R statistical environment (MetStaT, v1.0, 2013, R Development Core Team, Vienna, Austria).
3. Results
3.1. Physical and Chemical Parameter Variations of Olive Fruits
A significant variation was observed in the mean, maximum and minimum values of each parameter at different stages of olive ripening (Table 1). The analysis of variance (ANOVA) was carried out to test the influence of DOY on the studied parameters. With the progress of olive ripening, the color index of the fruit, the accumulation of oil and the weight of the fruit increase, while the firmness of the pulp gradually decreases.
The weight of the olives varied from 1.72 g, at the end of September (273 DOY), to 2.14 g at the end of the trial (301 DOY) (Figure S1 and Table 1). The pulp weight increased from 1.21 g at 273 DOY to 1.65 g at 301 DOY (Figure S1).
The color index of the olives varied from 1.0, yellowish color, to 2.76, with fruits largely pigmented externally (Figures S2 and S3 and Table 1).
The pulp oil content increased from 0.10 g olive-1 to 0.21 g olive-1 (Figure S2 and Table 1). The total olive oil content increased from 0.13 g per fruit to 0.27 g per fruit (Figure S3 and Table 1). Pulp firmness decreased during olive ripening from 3.92 N to 2.96 N (Figures S2 and S3 and Table 1). Fruit water content increased from 1.1 g olive−1 to 1.38 g olive−1 (Figures S2 and S3 and Table 1).
The IDA measured with the Kiwi-Meter® device varied from 1.89 to 3.00 during olive ripening and its trend for each parameter is reported in the Supplementary Material (Figure S2).
The IDA measured with the Standard DA-Meter® device varied from 0.10 to 2.70 during olive ripening and its trend for each parameter is reported in the Supplementary Material (Figure S3).
3.2. Correlations among Variables
Correlation analysis was performed to examine the relationships among olive ripening indexes. The results are shown in Table 2. All studied parameters were highly significantly correlated to each other, except the water content of the fruit with the firmness of the pulp, which showed a lower but significant correlation (r = 0.61) (Table 2).
Table 2.
Correlation matrix (r, Pearson coefficient; p, significance) among the fruit ripening variables.
3.3. Relationships between IAD by Kiwi-Meter® Device and the Olive Ripeness Indexes
The results of regression analysis between IAD measured by Kiwi-Meter® and the olive ripening parameters are reported in Figure 1, with the prediction intervals, represented by the upper and lower lines, and the regression line reported in black.
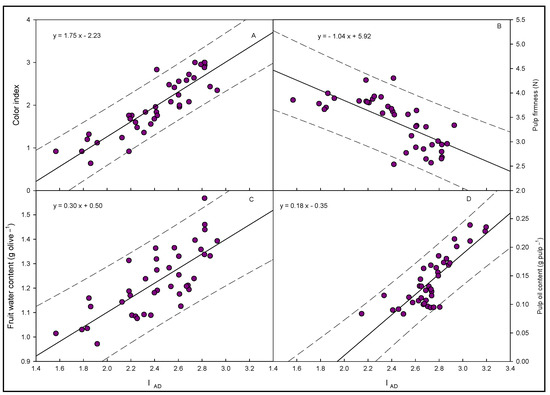
Figure 1.
(A) Relationship between IAD and color index. (B) Relationship between IAD and pulp firmness. (C) Relationship between IAD and fruit water content. (D) Relationship between IAD and pulp oil content by Kiwi-Meter® device. The solid black line represents the regression line and the upper and the lower lines represent the prediction intervals. Regression equation is reported on the top of each graph.
A highly significant correlation (r = 0.88) was found between IAD and color index of olives. IAD ranged from about 1.6 to 3.0 and increased linearly with the pigmentation of the epicarp tissue of the drupes (Figure 1A).
Pulp firmness declined progressively with olive ripening and was negatively correlated to IAD, which varied from 1.72 to 2.90 (r = 0.77) (Figure 1B).
A good and significant relationship (r = 0.81) was also found between fruit water content and IAD that ranged from about 1.7 to 2.9 (Figure 1C).
A highly significant positive correlation (r = 0.85) was also found between pulp oil content and IAD. In fact, IAD increased linearly with increasing oil accumulation in the pulp (Figure 1D).
The relationship between fruit oil content and IAD was lower but significant (r = 0.80) (data not shown).
3.4. Relationships between IAD by Standard DA-Meter® and Olive Ripeness Indices
The results of regression analysis between IAD measured by Standard DA-Meter® and the olive ripening parameters are reported in Figure 2, with the prediction intervals represented by the upper and lower lines and the regression line in black.
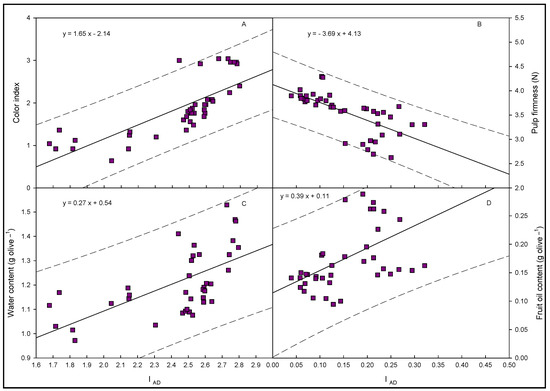
Figure 2.
(A) Relationship between color index and IAD. (B) Relationship between pulp oil content and IAD. (C) Relationship of fruit water content and IAD. (D) Relationship between pulp firmness and IAD by Standard DA-Meter® device. The solid black line represents the regression line and the upper and the lower lines represent the prediction intervals. Regression equation is reported on the top of each graph.
With this device, a highly significant relationship (r = 0.85) between fruit Color Index and IAD was also found. The IAD ranged from 1.7 to 2.8 (Figure 2A).
A highly significant negative relationship (r = 0.80) was observed between pulp firmness and IAD. Pulp firmness declined progressively with olive ripening. The pulp firmness decreased, while IAD increased from 0.04 to 0.25 (Figure 2B).
A lower but significant relationship (r = 0.71) was found between fruit water content and IAD that ranged from about 1.7 to 2.8 (Figure 2C).
IAD, which ranged from 0.05 to 0.32, was significantly (r = 0.75) related to fruit oil content (Figure 2D).
The relationship between pulp oil content and IAD was lower but still significant (r = 0.70) (data not shown).
3.5. Linear Regression Models and Statistical Evaluation
The obtained models have been cross-validated. The dataset was divided into a calibration set (28 samples) and a cross validation set (12 samples) five times, selecting each time different sets of samples, with all the samples acting as the test items in turn. The validation procedure was undertaken with the whole dataset used for the calibration, from which one-third of the samples have been removed five times, selecting each time different sets of samples, with all the samples acting as the test items in turn. Then, the calibration and validation results were averaged over the rounds to estimate the final model. The results achieved for the found models in terms of R2, DRMSEC, DRMSECV, RPIQ are presented in Table 3.
Table 3.
Calibration and validation indexes of the linear regression model.
Models with higher accuracy were obtained with the Kiwi-Meter® device. In fact, the respective predictive power of the obtained regression models was characterized by higher values of R2 and lower values of DRMSEC and DRMSECV, and higher values of RPIQ, both for calibration and validation datasets. Specifically, the better performance of the Kiwi-Meter® was observed in the estimation of the color index (R2 = 0.817, DRMSEC = 0.404 and RPIQ = 3.863 for calibration and R2 = 0.752, DRMSECV = 0.574 and RPIQ = 3.244 for validation) confirming its potential for evaluating the degree of olive ripeness.
4. Discussion
The progression of olive ripening from the cultivar Leccino was evaluated in terms of fruit pigmentation, oil and water accumulation, and pulp firmness with respect to the single IAD. The significant relationships found between IAD and these main olive characteristics confirmed the reliability of the IAD as a new, single and non-destructive index for monitoring olive ripening, instead of using conventional indexes, that are destructive, require lab equipment and are time consuming.
The new proposed methodology has great importance at the industrial level since these spectrophotometric measurements can be performed on the same olives several times during the harvesting season, allowing the evolution of the ripening to be followed directly in the orchard so the best harvesting time can be chosen to obtain both the best extra virgin olive oils (EVOOs) and the highest yield [3]. In comparison, the traditional olive ripening indexes require that the fruits be collected and later destroyed in the lab to determine color index, pulp firmness and fruit oil content.
The relationship between IAD and the olive color index was particularly high. The fruit of the cultivar Leccino is characterized by early and intense coloration due the accumulation of anthocyanins, which are responsible for their purple color [11,52]. Therefore, it can be assumed that IAD measurements can be used even more easily in olive varieties with less rapid and dark pigmentation.
Both devices were used to evaluate pigmentation of the epicarp but not the mesocarp, because the best combination between quantity and quality of the oil is usually obtained with values of MI between zero and four (that is, pigmentation regards only the epicarp) [4].
The Kiwi-Meter® was more effective than the Standard DA-Meter® in monitoring the degree of olive ripeness. The correlation coefficient between IAD and color index (determined with Kiwi-Meter® ), was similar to that obtained in Actinidia chinensis, where the coefficient of correlation between IAD and flesh color was equal to 0.82 [53]. In particular, the Kiwi-Meter® showed a better performance than the Standard DA-Meter® in the estimation of the color index, in terms of DMRSEC, DRMSECV and RPIQ. The goodness of the new index results about the estimation of the color index was similar to that reported by other authors [51], whereas it was slightly lower than those obtained for oil and water content in another investigation [50].
The significant relationships between IAD from both devices and olive firmness during ripening are in agreement with results from Infante [54] and Kavdir et al. [55]. They were higher than values for peach reported by Almeida et al. [56] and slightly lower than those found by Infante [54] in stone fruits. Moreover, the results agree with Giovenzana et al. [31], who used similar wavelengths in evaluating olives of the cultivars Moraiolo and Frantoio.
Olive and pulp oil content were predicted quite well by IAD, with wavelengths from 545 to 640 nm, with 750 nm as the reference point, using the Kiwi-Meter®. Other authors achieved good results at 1710 nm and 2307 nm, but not for intact olive fruits [55,57,58,59]. The IAD was robust in predicting oil content with respect to olive fresh weight. This is in contrast to the results of Cayuela et al. (2010) [36], who suggested that prediction of olive oil content with respect to dry matter provided better results as compared to the oil content with respect to fresh weight.
The variability of the water content as the fruit matures is not uncommon considering that water content varies greatly throughout ripening. In fact, olives tend to absorb more moisture when it is abundant, and release water when it is drier [37]. As also observed by Salguero-Chaparro et al. (2013) [43], this behavior can explain the lower correlation coefficients found between the IAD and olive water content, which could have been influenced by rainy and dry periods, which occurred during sampling. The simultaneous increase in fruit oil accumulation and pigmentation in Leccino could affect the robustness of IAD in predicting fruit water content, as observed by Giovenzana et al. [32]. In fact, the progressive accumulation of anthocyanins leads to a decrease in reflectance in the visible band associated with the anthocyanin absorption peak. Conversely, the spectra of the olives with higher water content showed slightly higher values of reflectance, that affects the IAD [32]. Moreover, other authors have pointed out that the use of NIR spectrometry has a greater ability to predict fat content than water content, and this is in agreement with our results [37].
Additionally, relative to other methods based on vis/NIR spectroscopy, IAD is easier to use, since it requires only establishing the cultivar-specific relationships between IAD and ripening-related changes [44].
As far as the application and perspective of IAD are concerned, its use will enable farmers to monitor the progress of olive ripening directly in the field, determining a single index and using a portable device, and then to plan the harvest of each olive cultivar according to its ripening stage. Likewise, the olive miller will be able to know the amount of oil and water in the olives and their stage of maturation, aiding in regulating the olive oil extraction process.
Each olive cultivar and fruit have specific IAD values according to the different phases of maturation. Hence, a full set of reference indices will need to be developed for each cultivar to make this application useful.
The increase in the combination of data sets in different years and in olive cultivars could provide a useful tool for the characterization of olive ripening. Both portable devices will open interesting perspectives for their future application in the olive milling industry, since they are rapid, economical, non-destructive, user-friendly, and require no sample preparation and a small sample size.
In perspective, the two devices could be merged into a more powerful one to increase the reliability of the IAD.
5. Conclusions
In this work, a new single index (IAD) was used to assess the best harvest time, since it allows monitoring of the olive ripening stage. Two fast and non-destructive portable devices based on NIR technology and on IAD were tested, for the first time, to monitor the ripening process of olive fruit. Both devices provided reliable results for assessing olive ripening, however the Kiwi-Meter® showed better performance than the Standard DA-Meter®.
With respect to the traditional methods used for evaluating fruit ripeness, the IAD may find useful applications in the olive production chain and may be used as a decision support tool to determine the best olive harvesting time.
This experiment was carried out on olives of a single variety, characterized by rapid pigmentation of the epicarp, so further studies are necessary to validate the use of IAD in other olive varieties, with different ripening patterns, and in different seasonal patterns. Moreover, these instruments could be used to directly estimate some fruit components that may significantly affect the oil quality, such as phenolic compounds.
Supplementary Materials
The following supporting information can be downloaded at: https://www.mdpi.com/article/10.3390/agriculture13010194/s1, Figure S1: Variations of fruit and pulp fresh weight during sampling (each point represents mean value of 200 fruits ± s.e); Figure S2: Variations of IAD and of the ripening indexes along the ripening stages of olive, detected with Kiwi-Meter ® device (each point represents mean value of 50 fruits tree−1 ± s.e.); Figure S3: Variations of IAD and of the ripening indexes along the ripening stages of olive, detected with Standard DA-Meter ® (each point represents mean value of 50 fruits tree−1 ± s.e.).
Author Contributions
Conceptualization, N.C., F.F., S.P. and D.F.; methodology, N.C., F.F., D.F., S.P. and F.V.; software, A.G., S.P.; validation, N.C., D.F. and A.G.; formal analysis, D.F.; investigation, N.C., L.A., A.B., M.T., P.P., F.V. and D.F.; resources, D.F., F.F., and F.V.; data curation, N.C., D.F., A.B., S.P. and L.A.; writing—original draft preparation, N.C., S.P. and D.F.; writing—review and editing, N.C., D.F., S.P. and F.F.; visualization, D.F.; supervision, F.F. and D.F.; project administration, D.F.; funding acquisition, D.F., F.V. and F.F. All authors have read and agreed to the published version of the manuscript.
Funding
This research was partially funded by “Sintelia srl” Italy; by “University of Perugia, Visiting Research 2019” Italy; by “Coordenação de Aperfeiçoamento de Pessoal de Nível Superior—CAPES”, Brazil; (F.F.) by Agritech National Research Center—Italy, which received funding from the European Union Next-Generation EU (PIANO NAZIONALE DI RIPRESA E RESILIENZA (PNRR)—MISSIONE 4 COMPONENTE 2, INVESTIMENTO 1.4—D.D. 1032 17/06/2022, CN00000022)—this manuscript reflects only the authors’ views and opinions, neither the European Union nor the European Commission can be considered responsible for them.
Data Availability Statement
Not applicable.
Conflicts of Interest
The authors declare no conflict of interest.
References
- Beltrán, G.; Aguilera, M.P.; Del Rio, C.; Sanchez, S.; Martinez, L. Influence of fruit ripening process on the natural antioxidant content of Hojiblanca virgin olive oils. Food Chem. 2005, 89, 207–215. [Google Scholar] [CrossRef]
- Portarena, S.; Leonardi, L.; Scartazza, A.; Lauteri, M.; Baldacchini, C.; Farinelli, D.; Famiani, F.; Ciolfi, M.; Brugnoli, E. Combining analysis of fatty acid composition and δ13C in extra-virgin olive oils as affected by harvest period and cultivar: Possible use in traceability studies. Food Control. 2019, 105, 151–158. [Google Scholar] [CrossRef]
- Famiani, F.; Farinelli, D.; Urbani, S.; Al Hariri, R.; Paoletti, A.; Rosati, A.; Esposto, S.; Selvaggini, R.; Taticchi, A.; Servili, M. Harvesting system and fruit storage affect basic quality parameters and phenolic and volatile compounds of oils from intensive and super-intensive olive orchards. Sci. Hortic. 2020, 263, 109045. [Google Scholar] [CrossRef]
- Famiani, F.; Gucci, R. La raccolta delle olive. In Edagricole; Edizioni Agricole di New Business Media: Bologna, Italy, 2022; p. 240. [Google Scholar]
- Farinelli, D.; Boco, M.; Tombesi, A. Intensity and growth period of the fruit components of olive varieties. Acta Hortic. 2002, 586, 607–610. [Google Scholar] [CrossRef]
- Bellincontro, A.; Taticchi, A.; Servili, M.; Esposto, S.; Farinelli, D.; Mencarelli, F. Feasible Application of a Portable NIR-AOTF Tool for On-Field Prediction of Phenolic Compounds during the Ripening of Olives for Oil Production. J. Agric. Food Chem. 2012, 60, 2665–2673. [Google Scholar] [CrossRef]
- Fernández-Espinosa, A.J. Combining PLS regression with portable NIR spectroscopy to on-line monitor quality parameters in intact olives for determining optimal harvesting time. Talanta 2016, 148, 216–228. [Google Scholar] [CrossRef] [PubMed]
- Tugnolo, A.; Giovenzana, V.; Beghi, R.; Grassi, S.; Alamprese, C.; Casson, A.; Casiraghi, E.; Guidetti, R. A diagnostic visible/near infrared tool for a fully automated olive ripeness evaluation in a view of a simplified optical system. Comput. Electron. Agric. 2021, 180, 105887. [Google Scholar] [CrossRef]
- Moyano, M.; Meléndez-Martínez, A.J.; Alba, J.; Heredia, F.J. A comprehensive study on the colour of virgin olive oils and its relationship with their chlorophylls and carotenoids indexes (I): CIEXYZ non-uniform colour space. Food Res. Int. 2008, 41, 505–512. [Google Scholar] [CrossRef]
- Aparicio-Ruiz, R.; Aparicio, R. 1—Olive oil. In Gourmet and Health-Promoting Specialty Oils; Moreau, R.A., Kamal-Eldin, A., Eds.; AOCS Press: Urbana, IL, USA, 2009; pp. 33–72. ISBN 978-1-893997-97-4. [Google Scholar]
- Jiménez, A.; Rodríguez, R.; Fernández-Caro, I.; Guillén, R.; Fernández-Bolaños, J.; Heredia, A. Olive Fruit Cell Wall: Degradation of Pectic Polysaccharides during Ripening. J. Agric. Food Chem. 2000, 49, 409–415. [Google Scholar] [CrossRef]
- Portarena, S.; Farinelli, D.; Lauteri, M.; Famiani, F.; Esti, M.; Brugnoli, E. Stable isotope and fatty acid compositions of monovarietal olive oils: Implications of ripening stage and climate effects as determinants in traceability studies. Food Control. 2015, 57, 129–135. [Google Scholar] [CrossRef]
- Farinelli, D.; Tombesi, S. Performance and oil quality of ‘Arbequina’ and four Italian olive cultivars under super high density hedgerow planting system cultivated in central Italy. Sci. Hortic. 2015, 192, 97–107. [Google Scholar] [CrossRef]
- Yousfi, K.; Cert, R.M.; García, J.M. Changes in quality and phenolic compounds of virgin olive oils during objectively described fruit maturation. Eur. Food Res. Technol. 2006, 223, 117–124. [Google Scholar] [CrossRef]
- Camposeo, S.; Vivaldi, G.A.; Gattullo, C.E. Ripening indices and harvesting times of different olive cultivars for continuous harvest. Sci. Hortic. 2013, 151, 1–10. [Google Scholar] [CrossRef]
- Famiani, F.; Alfei, B.; D’Ambrosio, A.; Rosati, S.; Pannelli, G. Biologia fiorale e di fruttificazione delle principali varietà locali di olivo in Umbria. In Proceedings of the V Convegno Nazionale “Biodiversità: Biodiversità e Sistemi Ecocompatibili”, Caserta, Italia, 9–10 September 1999; pp. 204–213. [Google Scholar]
- Famiani, F.; Proietti, P.; Farinelli, D.; Tombesi, A. Oil quality in relation to olive ripening. Acta Hortic. 2002, 586, 671–674. [Google Scholar] [CrossRef]
- Beltran, G.; Uceda, M.; Hermoso, M.; Frias, L. Maduracion. In El Cultivo del Olivo, 7th ed.; Mundi-Prensa: Madrid, Spain, 2017; pp. 187–212. [Google Scholar]
- Inglese, P.; Famiani, F.; Galvano, F.; Servili, M.; Esposto, S.; Urbani, S. 3 factors affecting extra-virgin olive oil composition. Hortic. Rev. 2011, 38, 83. [Google Scholar]
- Uceda, M.; Hermoso, M. La calidad del aceite de oliva. In El Cultivo Olivo; Barranco, D., Fernàndez-Escobar, R., Rallo, L., Eds.; Junta de Andalucìa Ediciones, Mundi-Prensa: Madrid, Spain, 1998; pp. 547–572. [Google Scholar]
- Beltrán, G.; Del Río, C.; Sánchez, S.; Martínez, L. Seasonal changes in olive fruit characteristics and oil accumulation during ripening process. J. Sci. Food Agric. 2004, 84, 1783–1790. [Google Scholar] [CrossRef]
- Beltrán, G.; Jiménez, A.; del Rio, C.; Sánchez, S.; Martínez, L.; Uceda, M.; Aguilera, M.P. Variability of vitamin E in virgin olive oil by agronomical and genetic factors. J. Food Compos. Anal. 2010, 23, 633–639. [Google Scholar] [CrossRef]
- Farinelli, D.; Ruffolo, M.; Boco, M.; Tombesi, A. Yield efficiency and mechanical harvesting with trunk shaker of some international olive cultivars. Acta Hortic. 2012, 949, 379–384. [Google Scholar] [CrossRef]
- Gamlı, F.; Eker, T. Determination of harvest time of Gemlik olive cultivars by using physical and chemical properties. J. Food Meas. Charact. 2017, 11, 2022–2030. [Google Scholar] [CrossRef]
- Romero-Trigueros, C.; Vivaldi, G.A.; Nicolás, E.N.; Paduano, A.; Salcedo, F.P.; Camposeo, S. Ripening Indices, Olive Yield and Oil Quality in Response to Irrigation with Saline Reclaimed Water and Deficit Strategies. Front. Plant Sci. 2019, 10, 1243. [Google Scholar] [CrossRef]
- Di Vaio, C.; Graziani, G.; Gaspari, A.; De Luca, L.; Aiello, A.; Cirillo, A.; Bruno, A.; Romano, R.; Ritieni, A. Drupe Characters, Fatty Acids, Polyphenolic and Aromatic Profile of Olive Oil Obtained from “Oliva Bianca”, Minor Autochthonous Cultivar of Campania. Plants 2021, 10, 1119. [Google Scholar] [CrossRef] [PubMed]
- Mínguez-Mosquera, I.; Gallardo-Guerrero, L. Disappearance of chlorophylls and carotenoids during the ripening of the olive. J. Sci. Food Agric. 1995, 69, 1–6. [Google Scholar] [CrossRef]
- Cirilli, M.; Bellincontro, A.; Urbani, S.; Servili, M.; Esposto, S.; Mencarelli, F.; Muleo, R. On-field monitoring of fruit ripening evolution and quality parameters in olive mutants using a portable NIR-AOTF device. Food Chem. 2016, 199, 96–104. [Google Scholar] [CrossRef]
- Emmanouilidou, M.G.; Koukourikou-Petridou, M.; Gerasopoulos, D.; Kyriacou, M.C. Evolution of physicochemical constitution and cultivar-differential maturity configuration in olive (Olea europaea L.) fruit. Sci. Hortic. 2020, 272, 109516. [Google Scholar] [CrossRef]
- García, J.M.; Seller, S.; Pérez-Camino, M.C. Influence of Fruit Ripening on Olive Oil Quality. J. Agric. Food Chem. 1996, 44, 3516–3520. [Google Scholar] [CrossRef]
- Giovenzana, V.; Beghi, R.; Civelli, R.; Marai, S.; Guidetti, R. Postharvest characterization of olive oil fruits texture by nir and vis/nir spectroscopy. Chem. Eng Trans. 2015, 44, 61–66. [Google Scholar] [CrossRef]
- Giovenzana, V.; Beghi, R.; Civelli, R.; Trapani, S.; Migliorini, M.; Cini, E.; Zanoni, B.; Guidetti, R. Rapid Determination of crucial parameters for the optimization of milling process by using visible/near infrared spectroscopy on intact olives and olive paste. Ital. J. Food Sci. 2017, 29, 357–369. [Google Scholar]
- Farinelli, D.; Portarena, S.; da Silva, D.F.; Traini, C.; da Silva, G.M.; da Silva, E.C.; da Veiga, J.F.; Pollegioni, P.; Villa, F. Variability of Fruit Quality among 103 Acerola (Malpighia emarginata D. C.) Phenotypes from the Subtropical Region of Brazil. Agriculture 2021, 11, 1078. [Google Scholar] [CrossRef]
- Galal, H.; Elsayed, S.; Allam, A.; Farouk, M. Indirect Quantitative Analysis of Biochemical Parameters in Banana Using Spectral Reflectance Indices Combined with Machine Learning Modeling. Horticulturae 2022, 8, 438. [Google Scholar] [CrossRef]
- Galal, H.; Elsayed, S.; Elsherbiny, O.; Allam, A.; Farouk, M. Using RGB Imaging, Optimized Three-Band Spectral Indices, and a Decision Tree Model to Assess Orange Fruit Quality. Agriculture 2022, 12, 1558. [Google Scholar] [CrossRef]
- Cayuela, J.A.; Camino, M.D.C.P. Prediction of quality of intact olives by near infrared spectroscopy. Eur. J. Lipid Sci. Technol. 2010, 112, 1209–1217. [Google Scholar] [CrossRef]
- Lee, C.; Polari, J.J.; Kramer, K.E.; Wang, S.C. Near-Infrared (NIR) Spectrometry as a Fast and Reliable Tool for Fat and Moisture Analyses in Olives. ACS Omega 2018, 3, 16081–16088. [Google Scholar] [CrossRef] [PubMed]
- Ruggiero, L.; Amalfitano, C.; Di Vaio, C.; Adamo, P. Use of near-infrared spectroscopy combined with chemometrics for authentication and traceability of intact lemon fruits. Food Chem. 2022, 375, 131822. [Google Scholar] [CrossRef] [PubMed]
- Leon, L.; Gracia, A. Non-destructive assessment of olive fruit ripening by portable near infrared spectroscopy. Grasas Aceites 2011, 62, 268–274. [Google Scholar] [CrossRef]
- Salguero-Chaparro, L.; Baeten, V.; Abbas, O.; Peña-Rodríguez, F. On-line analysis of intact olive fruits by vis–NIR spectroscopy: Optimisation of the acquisition parameters. J. Food Eng. 2012, 112, 152–157. [Google Scholar] [CrossRef]
- Costa, G.; Noferini, M.; Fiori, G.; Torrigiani, P. Use of VIS/NIR spectroscopy to assess fruit ripening stage and improve management in post-harvest chain. Fresh Prod. 2009, 1, 35–41. [Google Scholar]
- Costa, G.; Rocchi, L.; Farneti, B.; Busatto, N.; Spinelli, F.; Vidoni, S. Use of Nondestructive Devices to Support Pre- and Postharvest Fruit Management. Horticulturae 2017, 3, 12. [Google Scholar] [CrossRef]
- Salguero-Chaparro, L.; Baeten, V.; Fernández-Pierna, J.A.; Peña-Rodríguez, F. Near infrared spectroscopy (NIRS) for on-line determination of quality parameters in intact olives. Food Chem. 2013, 139, 1121–1126. [Google Scholar] [CrossRef]
- Ziosi, V.; Noferini, M.; Fiori, G.; Tadiello, A.; Trainotti, L.; Casadoro, G.; Costa, G. A new index based on vis spectroscopy to characterize the progression of ripening in peach fruit. Postharvest Biol. Technol. 2008, 49, 319–329. [Google Scholar] [CrossRef]
- Noferini, M.; Fiori, G.; Cious, V.; Gottardi, F.; Brasina, M.; Mazzini, C.; Costa, G. DA-Meter. Easier Control of Fruit Quality from Farm to Distribution. J. Fruit Hortic. 2009, 71, 74–80. [Google Scholar]
- Knutsen, I.; Vangdal, E.; Børve, J. Effect of different maturity (measured as iad index) on storability of apples in cabags. Acta Hortic. 2015, 1071, 647–650. [Google Scholar] [CrossRef]
- Costa, G.; Vidoni, S.; Rocchi, L.; Cellini, A.; Buriani, G.; Donati, I.; Spinelli, F. Innovative non-destructive device for fruit quality assessment and early disease diagnosis. Acta Hortic. 2015, 1096, 69–78. [Google Scholar] [CrossRef]
- Costa, G.; Bonora, E.; Fiori, G.; Noferini, M. Innovative non-destructive device for fruit quality assessment. Acta Hortic. 2011, 913, 575–581. [Google Scholar] [CrossRef]
- Portarena, S.; Anselmi, C.; Zadra, C.; Farinelli, D.; Famiani, F.; Baldacchini, C.; Brugnoli, E. Cultivar discrimination, fatty acid profile and carotenoid characterization of monovarietal olive oils by Raman spectroscopy at a single glance. Food Control. 2019, 96, 137–145. [Google Scholar] [CrossRef]
- Ortega, J.B.; Gila, D.M.M.; Puerto, D.A.; García, J.G.; Ortega, J.G. Novel technologies for monitoring the in-line quality of virgin olive oil during manufacturing and storage. J. Sci. Food Agric. 2016, 96, 4644–4662. [Google Scholar] [CrossRef]
- Hernández-Sánchez, N.; Gómez-Del-Campo, M. From NIR spectra to singular wavelengths for the estimation of the oil and water contents in olive fruits. Grasas Aceites 2018, 69, 278. [Google Scholar] [CrossRef]
- Ivancic, T.; Jakopic, J.; Veberic, R.; Vesel, V.; Hudina, M. Effect of Ripening on the Phenolic and Sugar Contents in the Meso- and Epicarp of Olive Fruits (Olea europaea L.) Cultivar ‘Leccino’. Agriculture 2022, 12, 1347. [Google Scholar] [CrossRef]
- Rocchi, L.; Vidoni, S.; Ceccarelli, A.; Fiori, G.; Costa, G. Use of the DAindexTM for monitoring fruit ripening evolution in A. chinensis to precisely assess harvesting time “in planta”. J. Berry Res. 2016, 6, 373–379. [Google Scholar] [CrossRef]
- Infante, R. Harvest maturity indicators in the stone fruit industry. Stewart Postharvest Rev. 2012, 8, 1–6. [Google Scholar] [CrossRef]
- Kavdir, I.; Buyukcan, M.B.; Lu, R.; Kocabiyik, H.; Seker, M. Prediction of olive quality using FT-NIR spectroscopy in reflectance and transmittance modes. Biosyst. Eng. 2009, 103, 304–312. [Google Scholar] [CrossRef]
- Almeida, D.; Gonçalves, R.; Couto, J. Relationship between the index of absorbance difference (IAD) and firmness in peach and nectarine cultivars: Implications for harvest date decisions. Acta Hortic. 2018, 1194, 1093–1098. [Google Scholar] [CrossRef]
- Beghi, R.; Giovenzana, V.; Civelli, R.; Cini, E.; Guidetti, R. Characterization of olive fruit for the milling process by using visible/near infrared spectroscopy. J. Agric. Eng. 2013, 44, 56–61. [Google Scholar] [CrossRef]
- Kashiwagi, A.; Kominami, R.; Nakayama, S.; Kishimoto, N. Nondestructive Prediction of Oil Yield through Direct Near Infrared Spectroscopy Measurements of Fresh Olives. In Proceedings of the 2019 IEEE International Symposium on Olfaction and Electronic Nose (ISOEN), Fukouka, Japan, 26–29 May 2019; pp. 1–3. [Google Scholar] [CrossRef]
- Fredes, C.; Valero, C.; Diezma, B.; Mora, M.; Naranjo-Torres, J.; Wilson, M.; Delgadillo, G. A Model Based on Clusters of Similar Color and NIR to Estimate Oil Content of Single Olives. Foods 2021, 10, 609. [Google Scholar] [CrossRef] [PubMed]
Disclaimer/Publisher’s Note: The statements, opinions and data contained in all publications are solely those of the individual author(s) and contributor(s) and not of MDPI and/or the editor(s). MDPI and/or the editor(s) disclaim responsibility for any injury to people or property resulting from any ideas, methods, instructions or products referred to in the content. |
© 2023 by the authors. Licensee MDPI, Basel, Switzerland. This article is an open access article distributed under the terms and conditions of the Creative Commons Attribution (CC BY) license (https://creativecommons.org/licenses/by/4.0/).