
Automatic Tandem Dual BlendMask Networks for Severity Assessment of Wheat Fusarium Head Blight


Abstract
1. Introduction
2. Materials and Methods
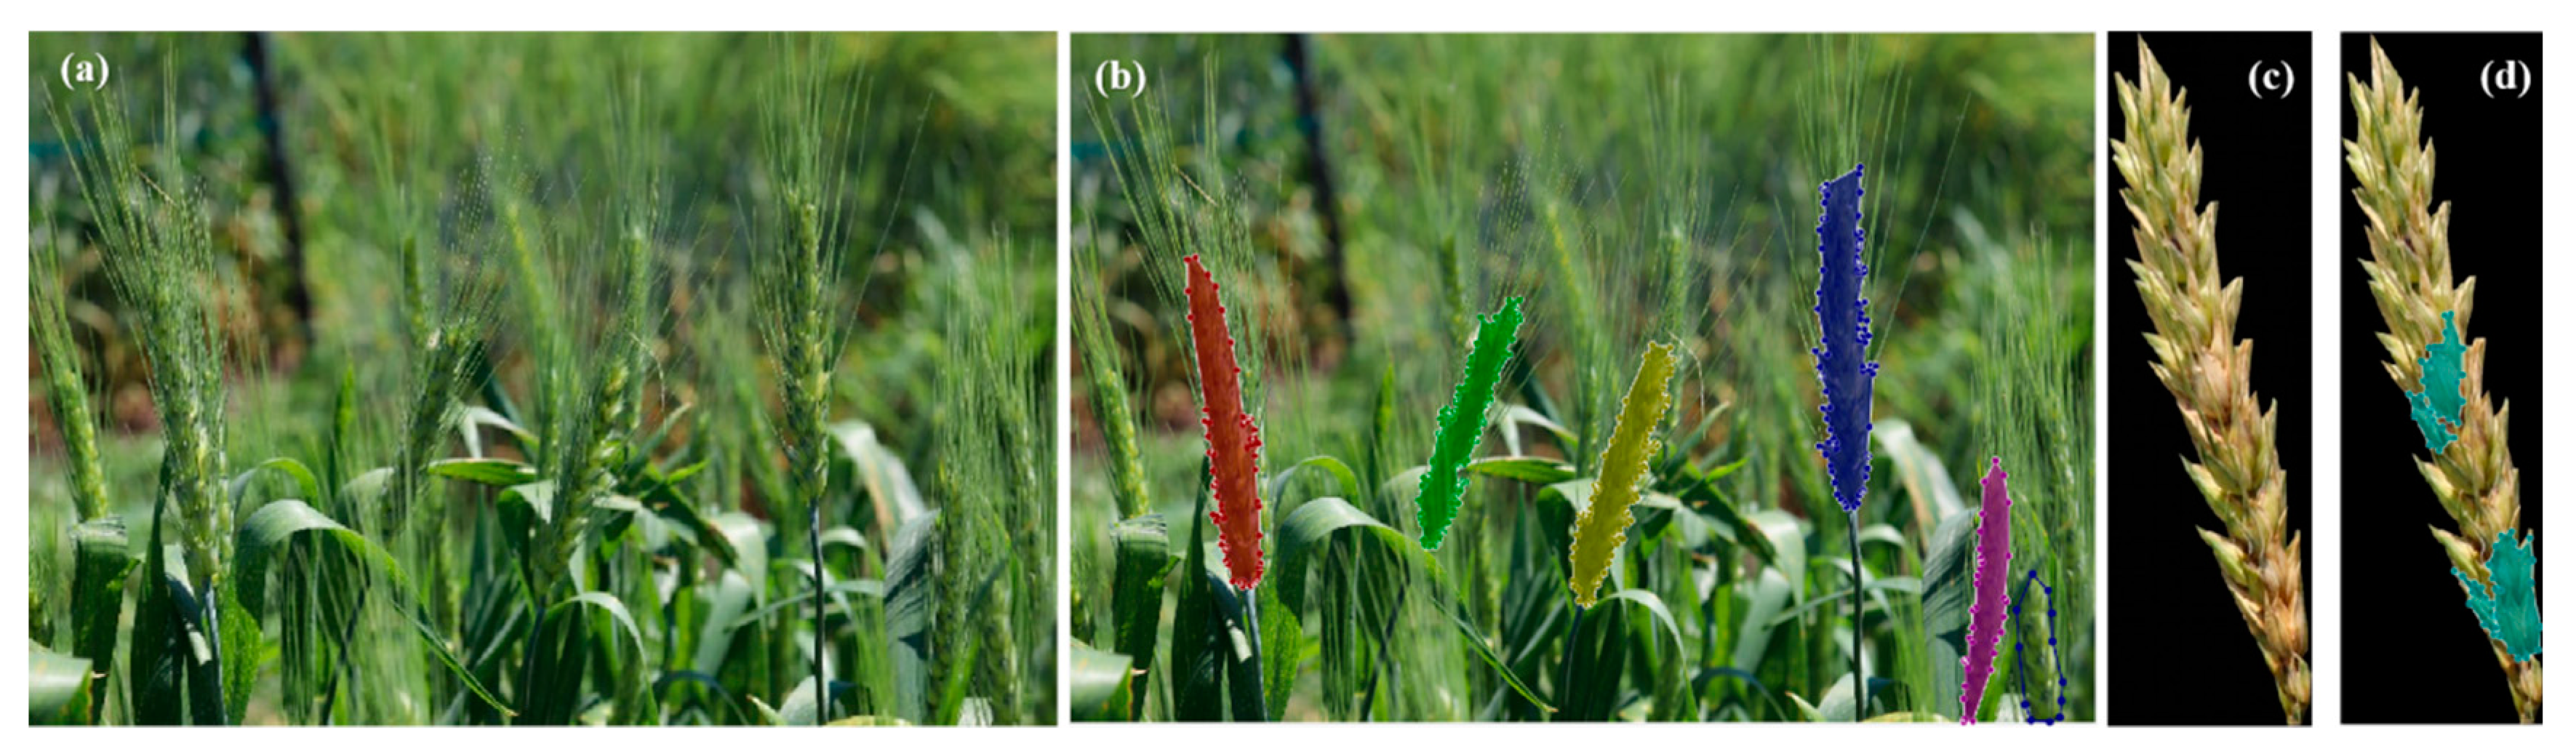
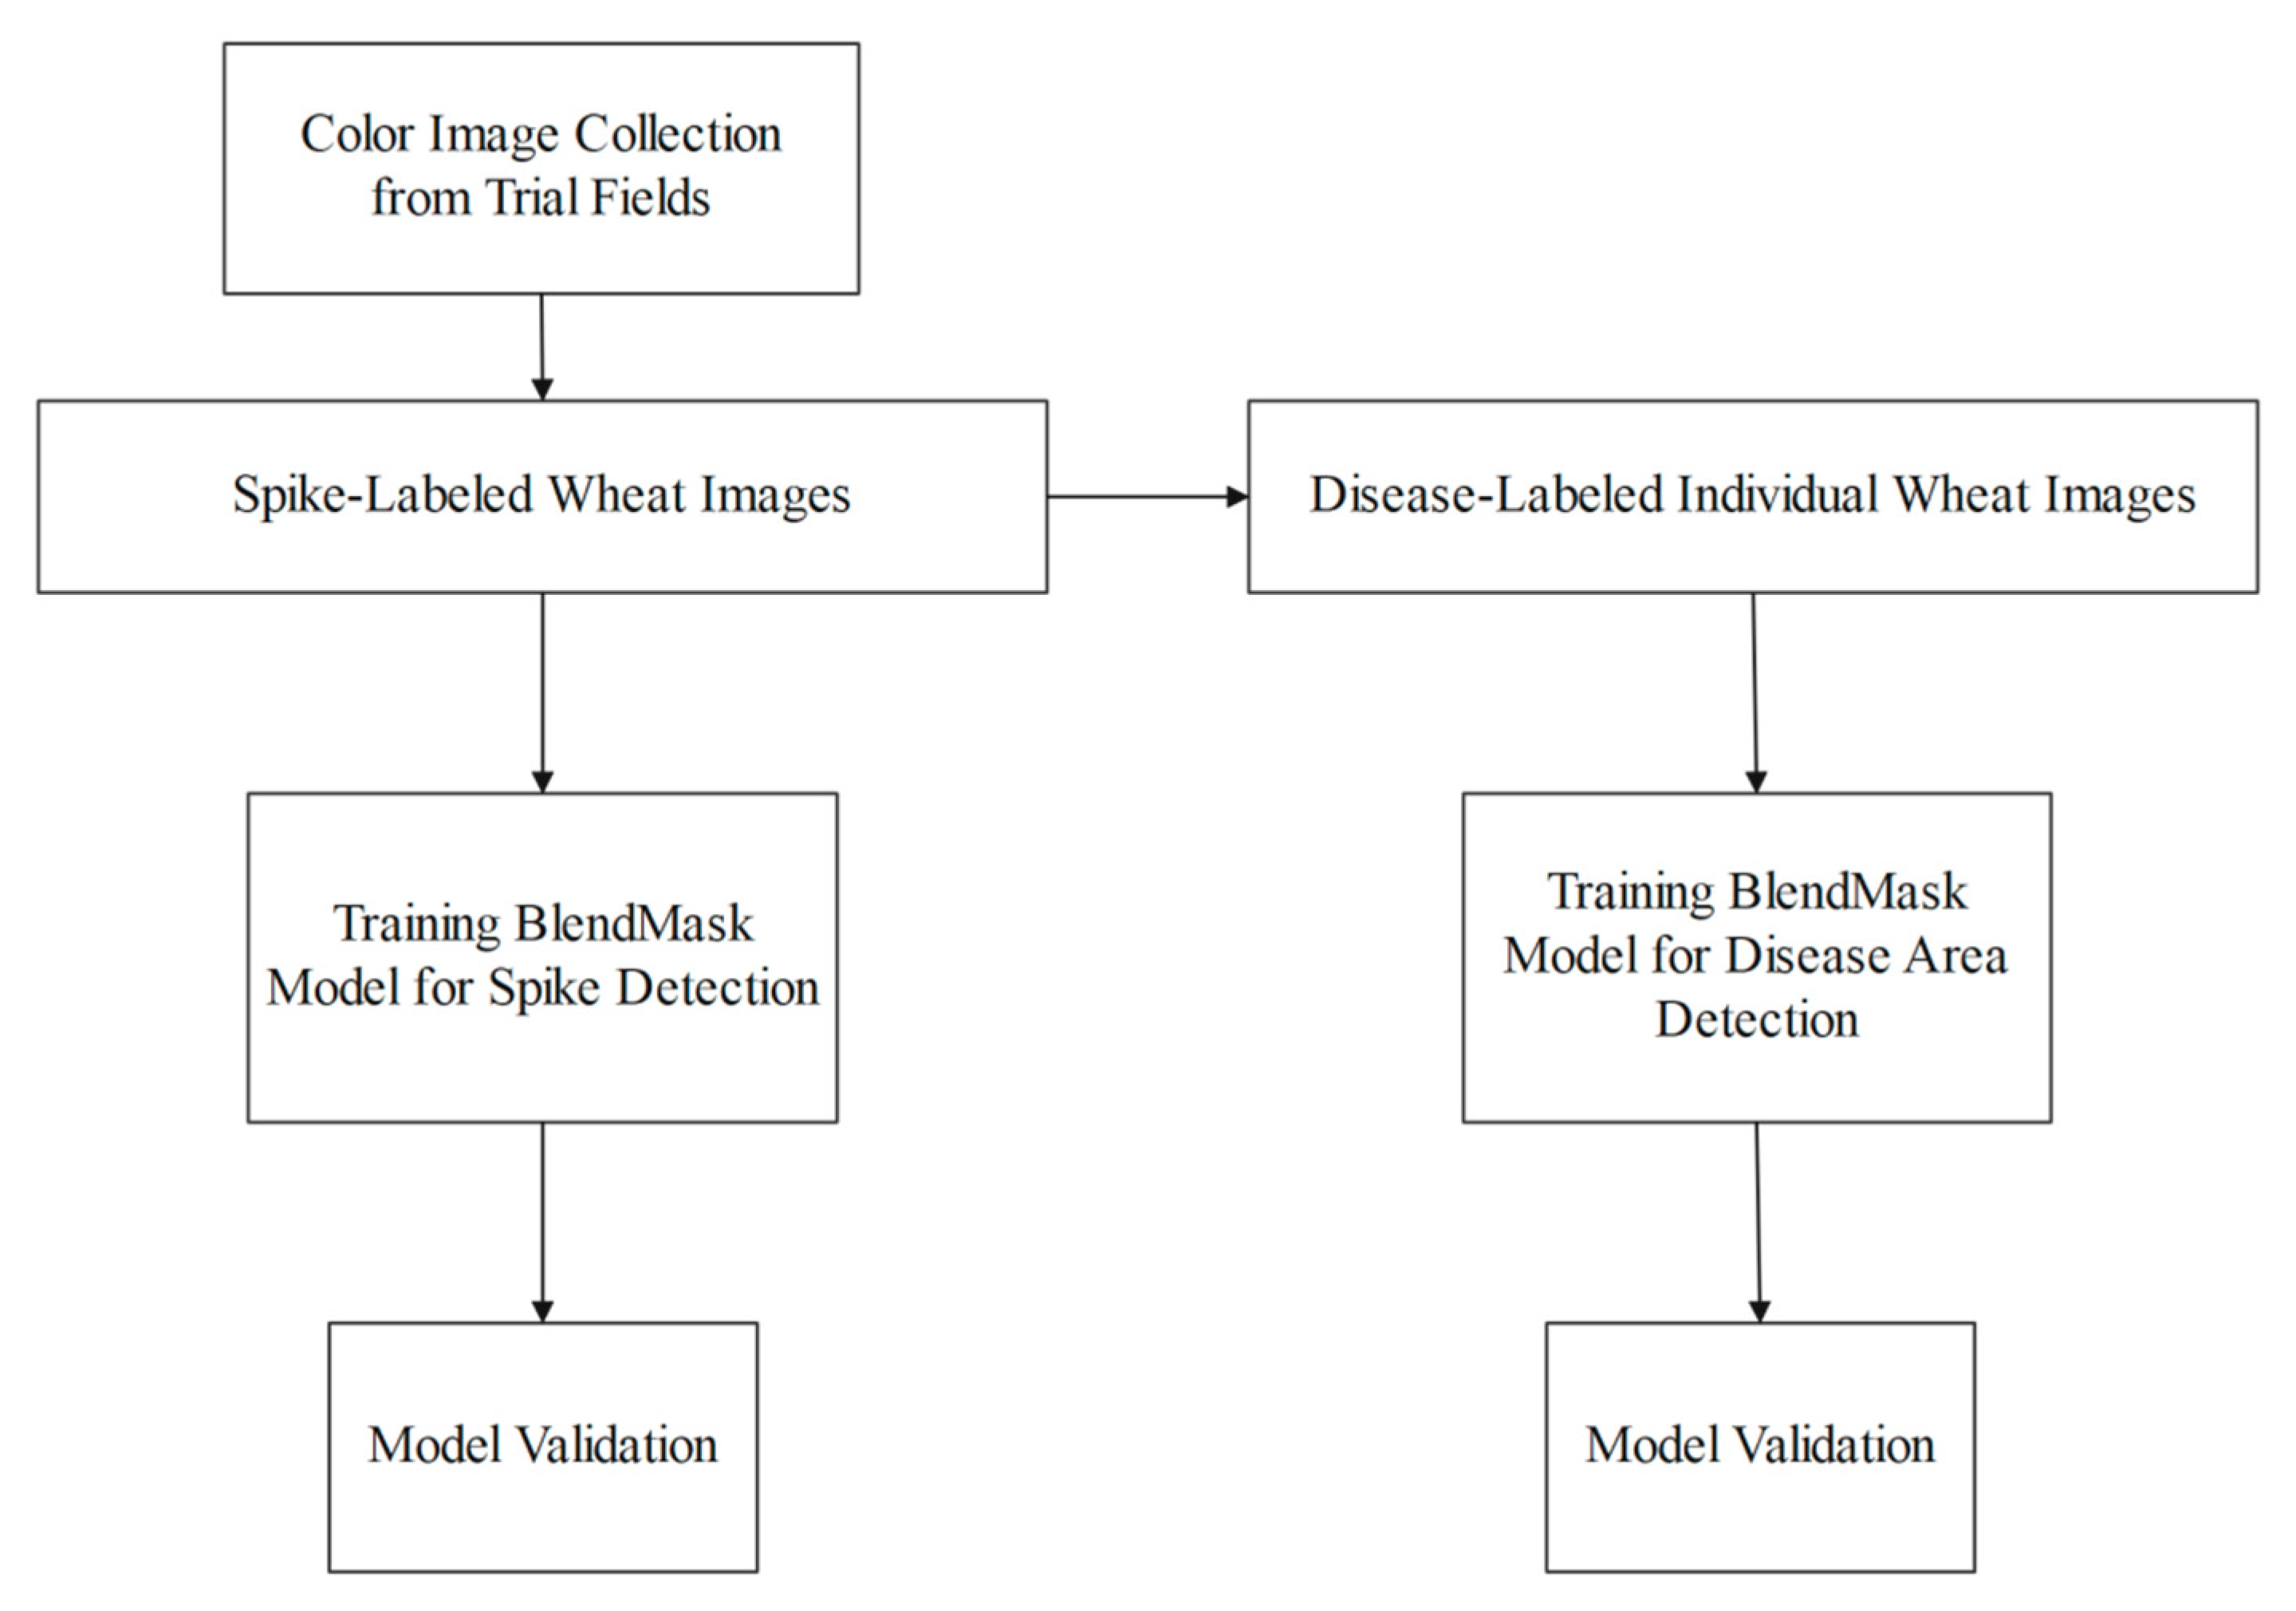
2.1. Data Collection and Annotation
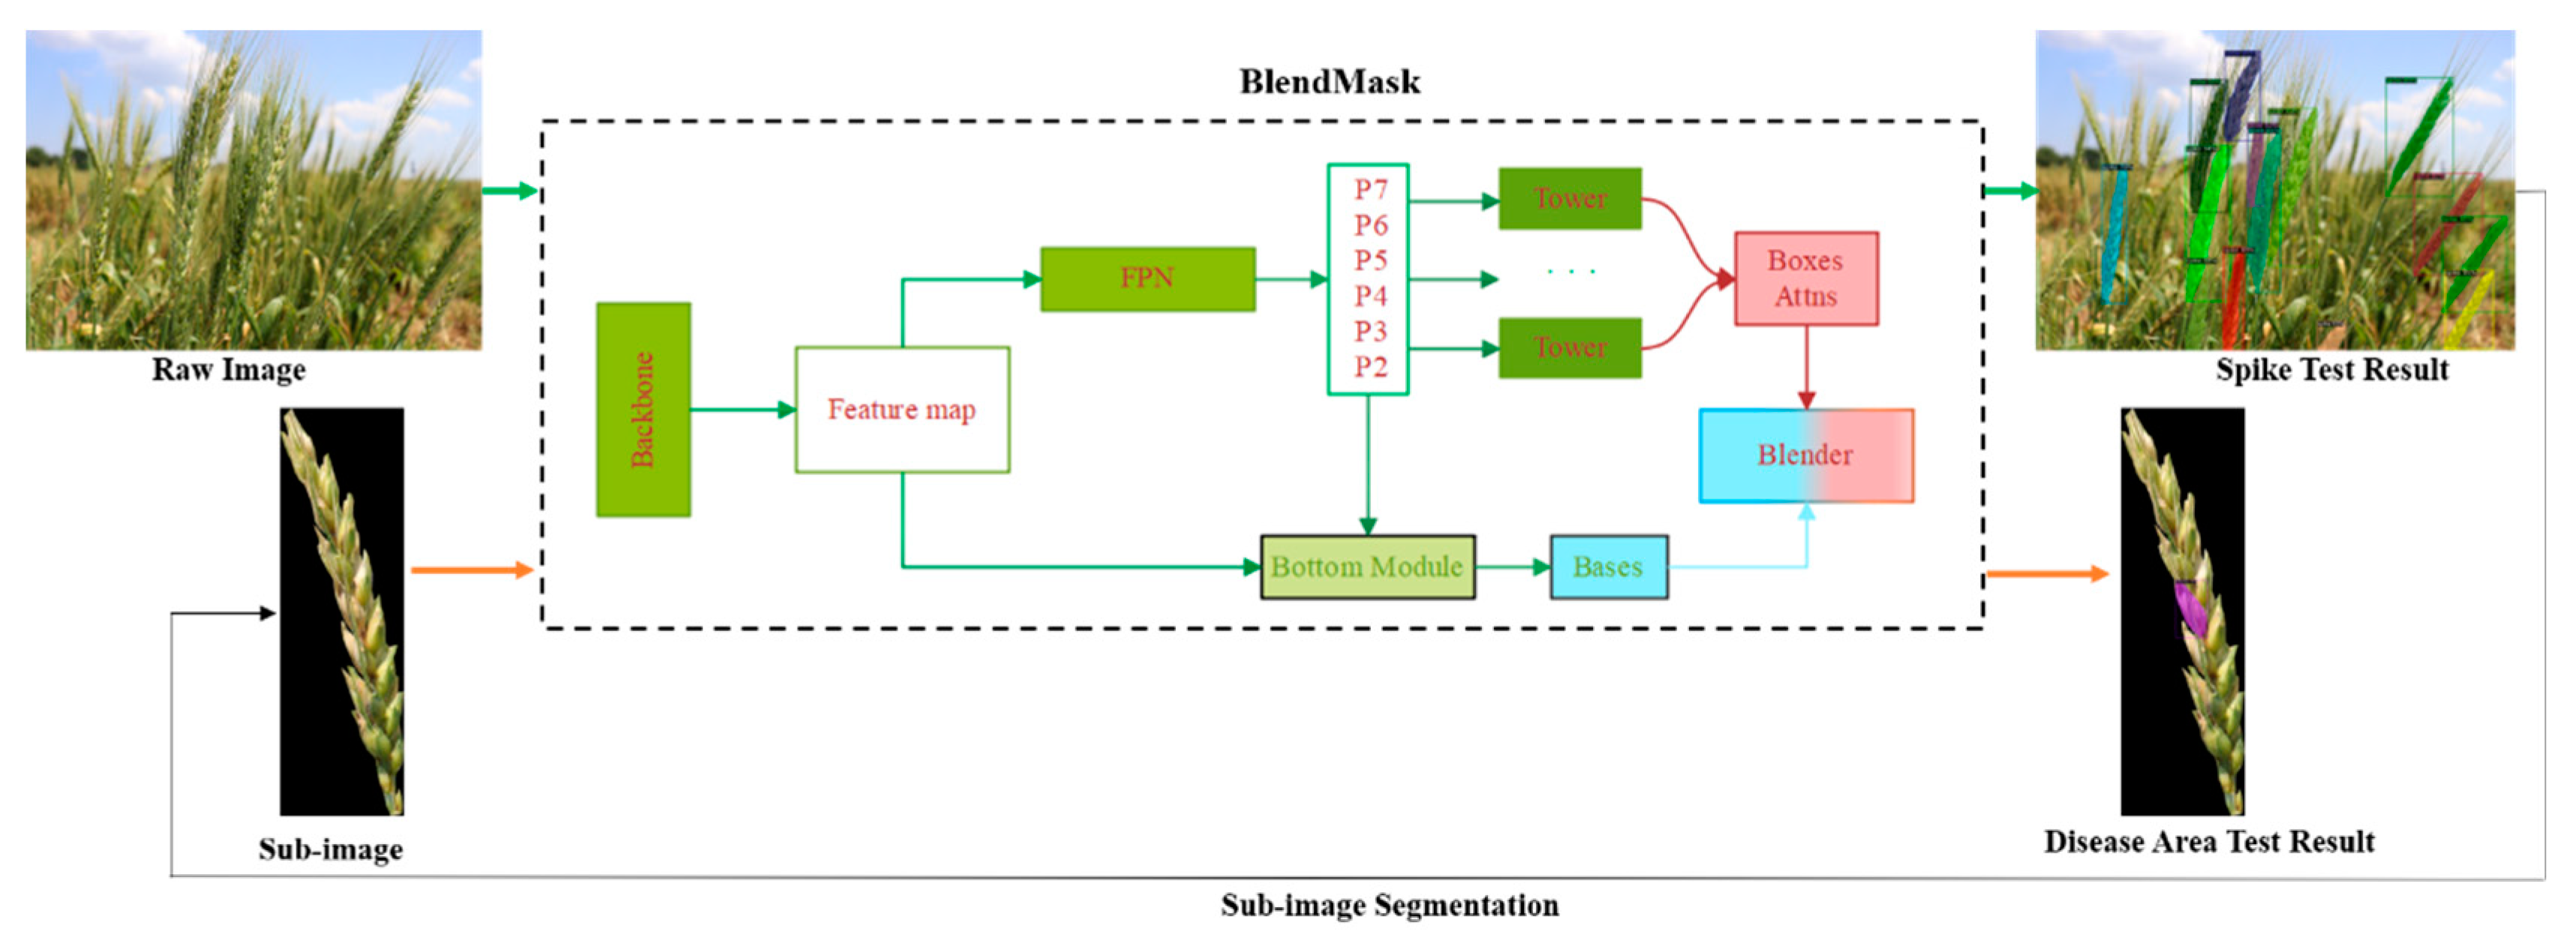
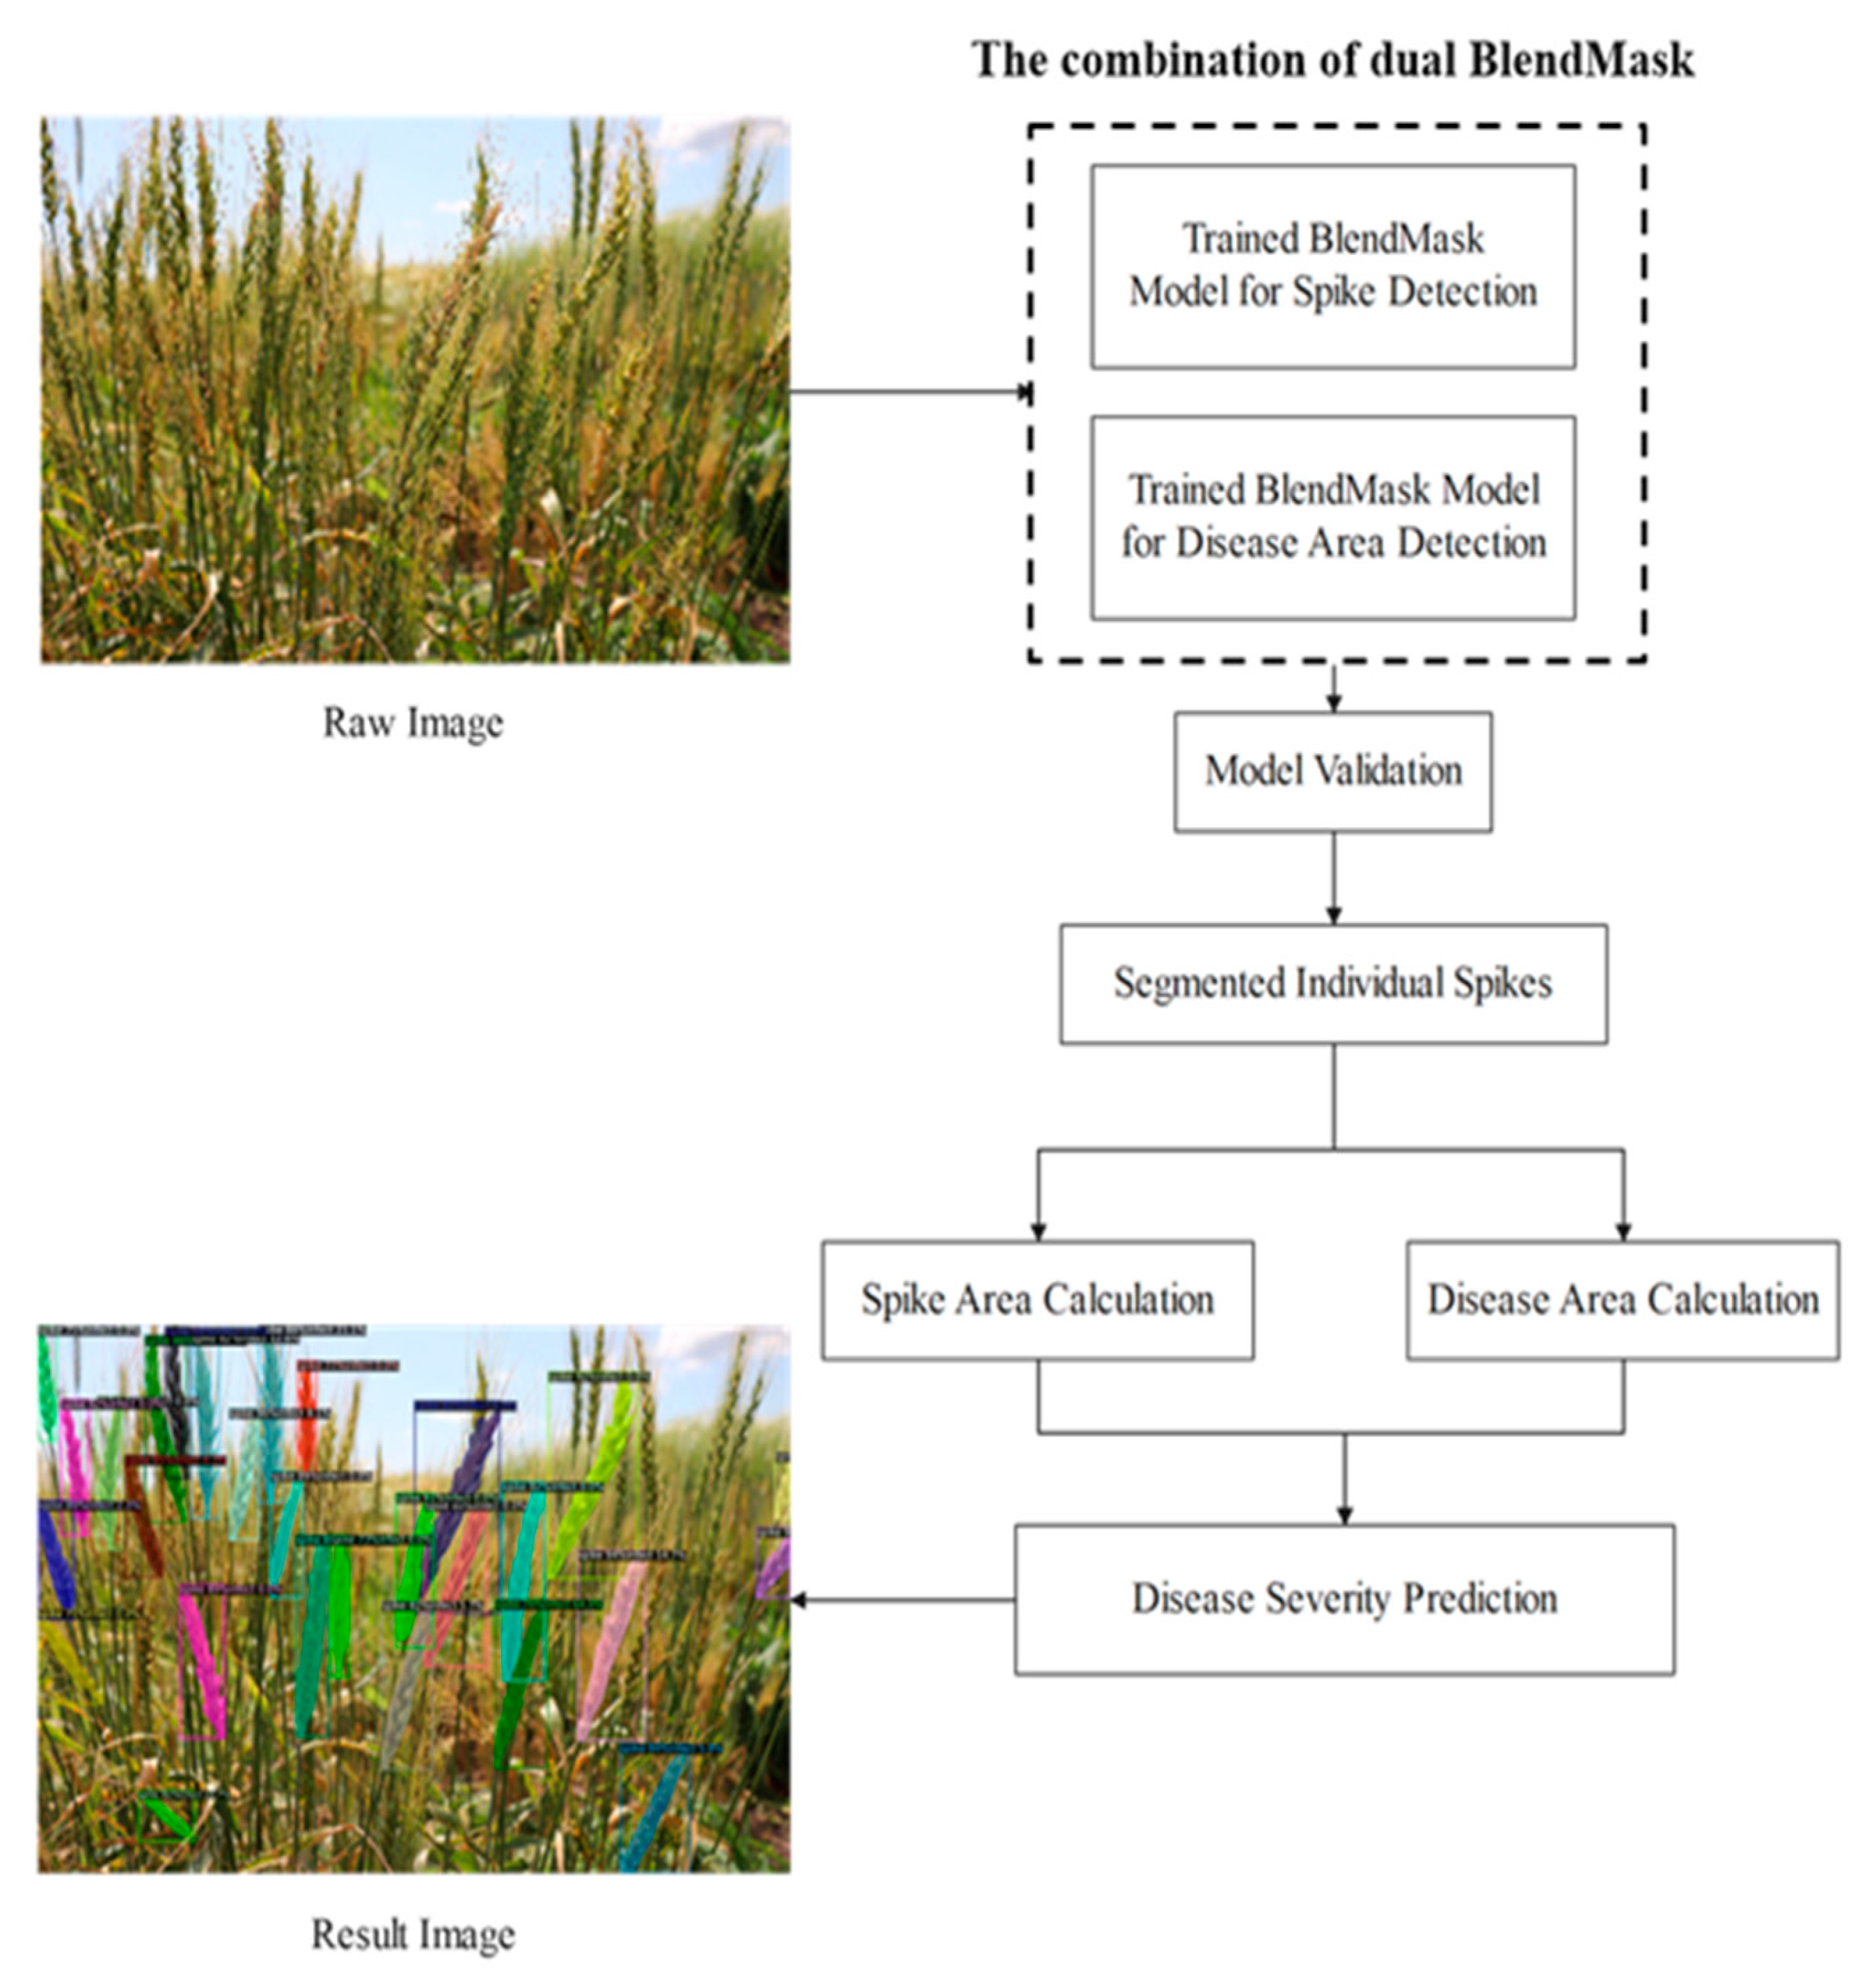
2.2. BlendMask
2.3. Evaluation Metrics
2.4. Equipment
3. Results
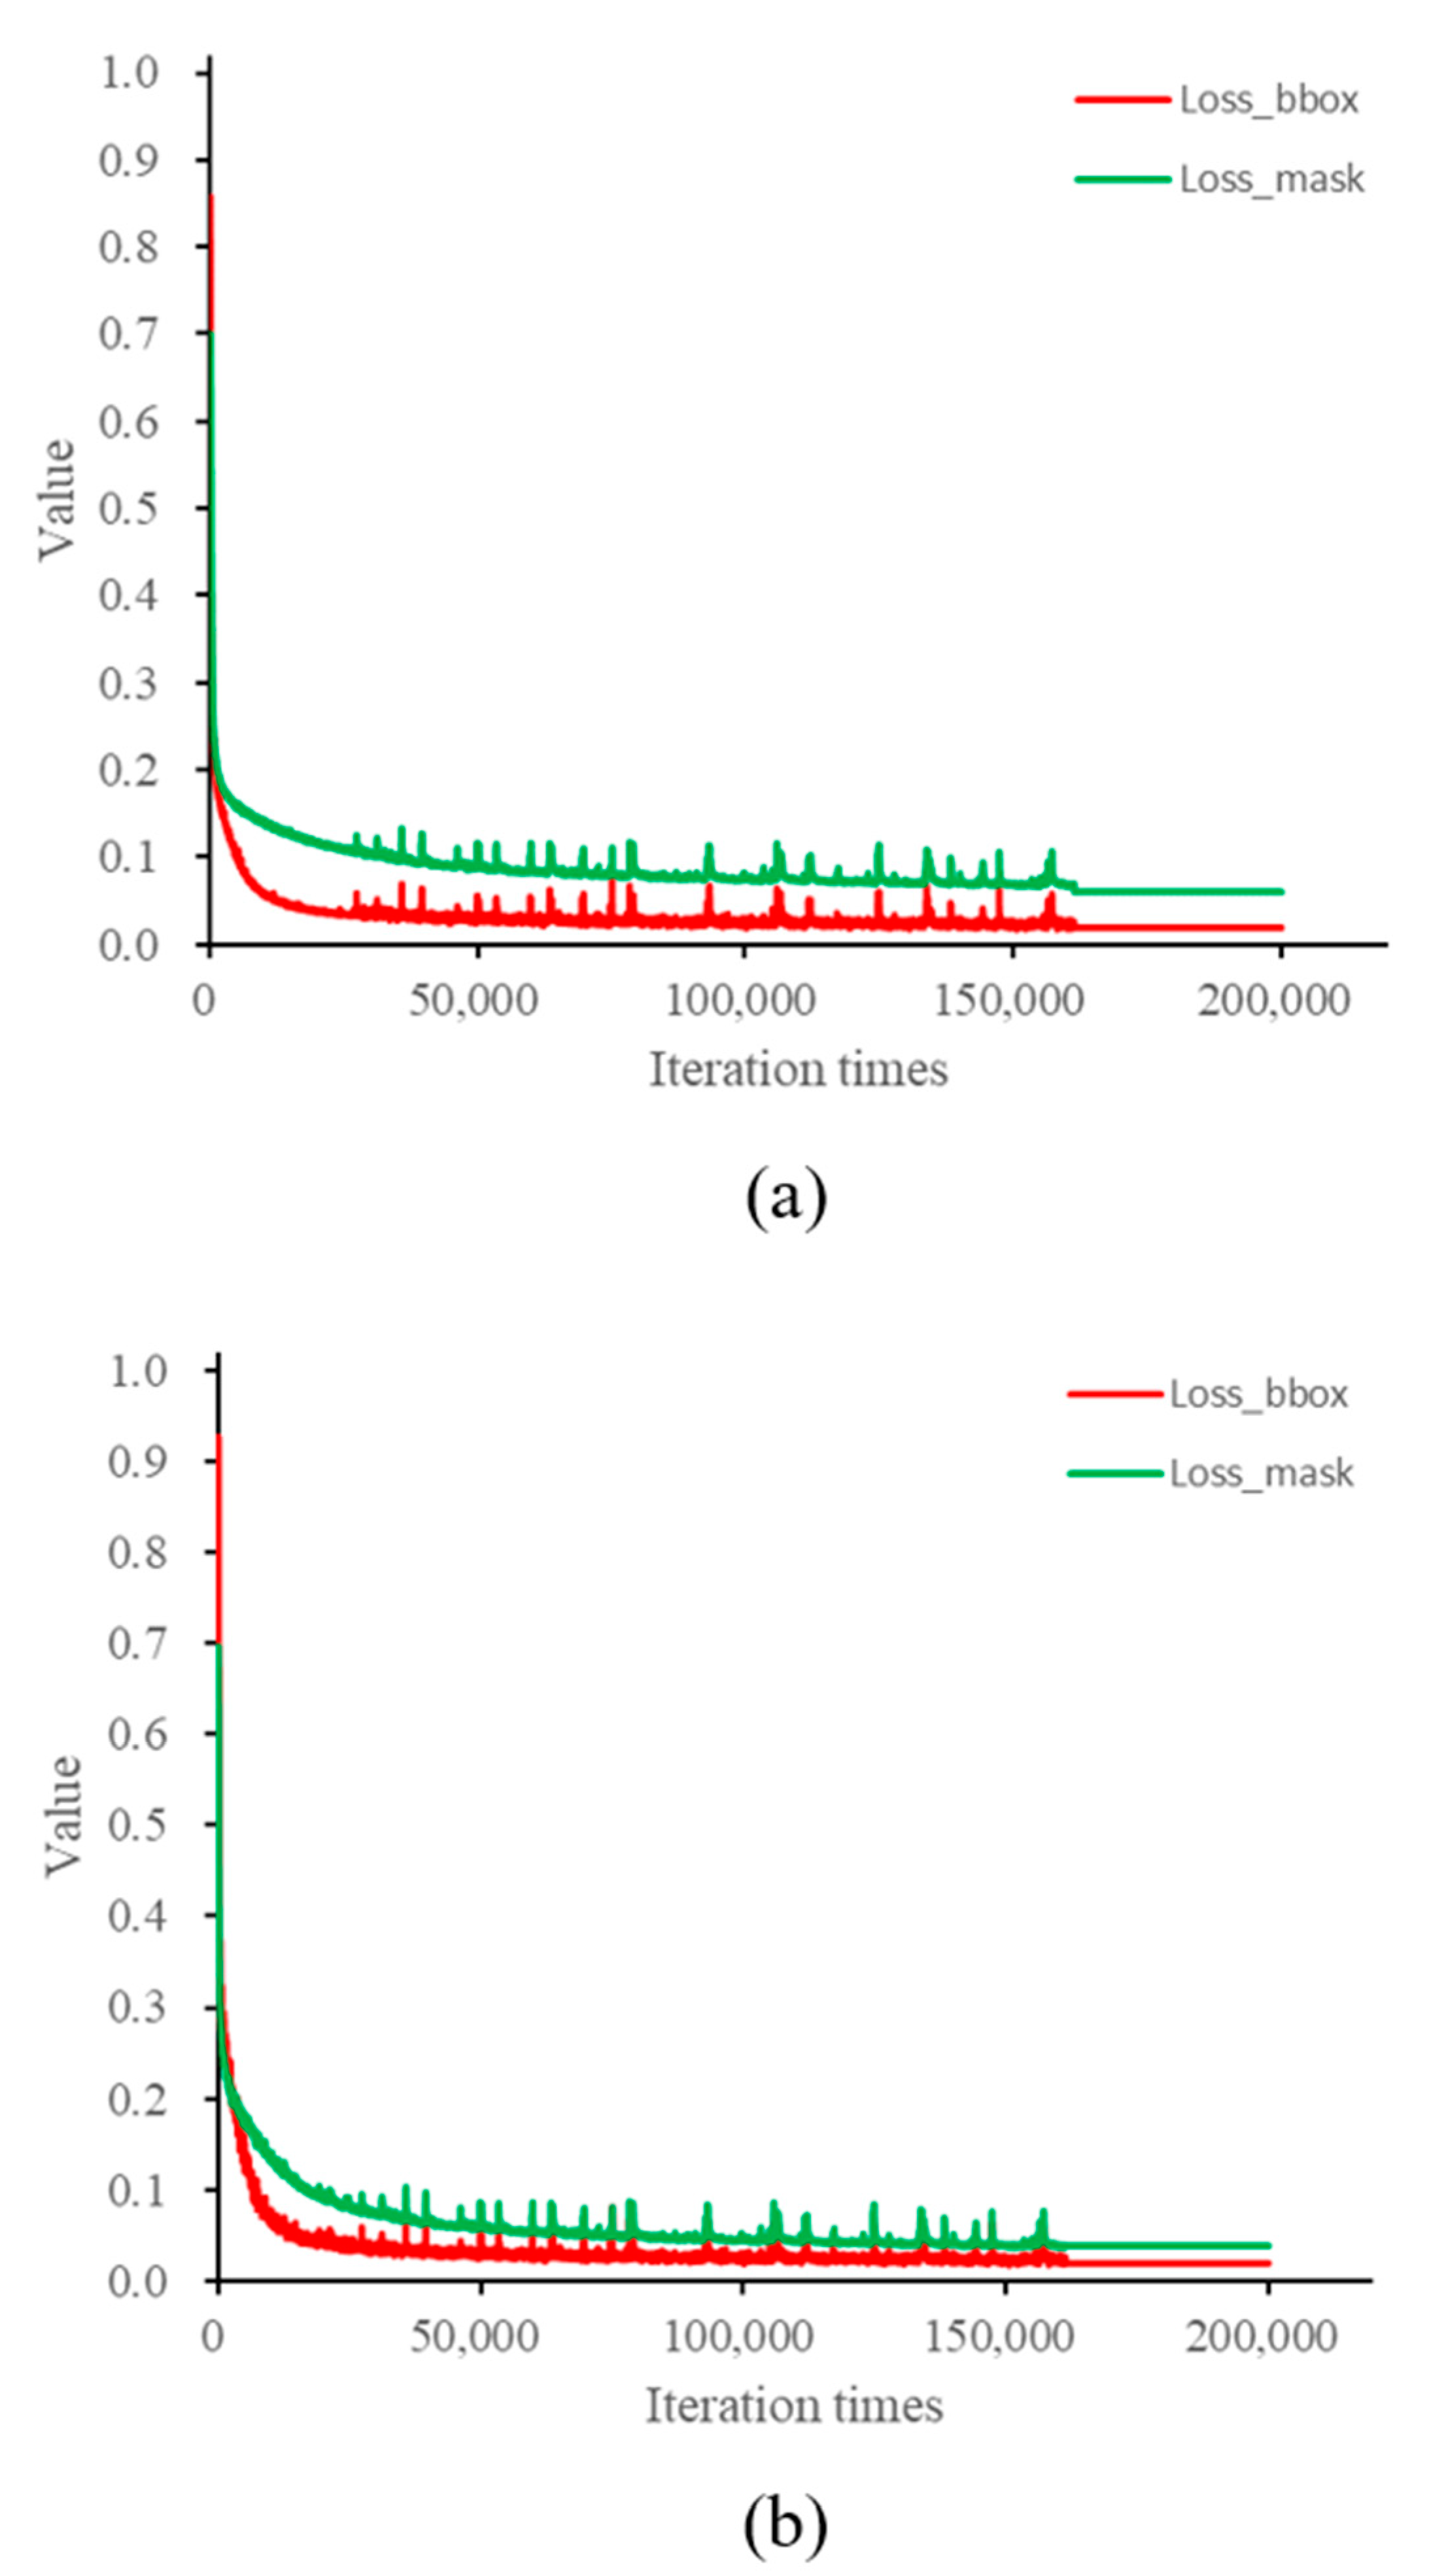
3.1. Model Training
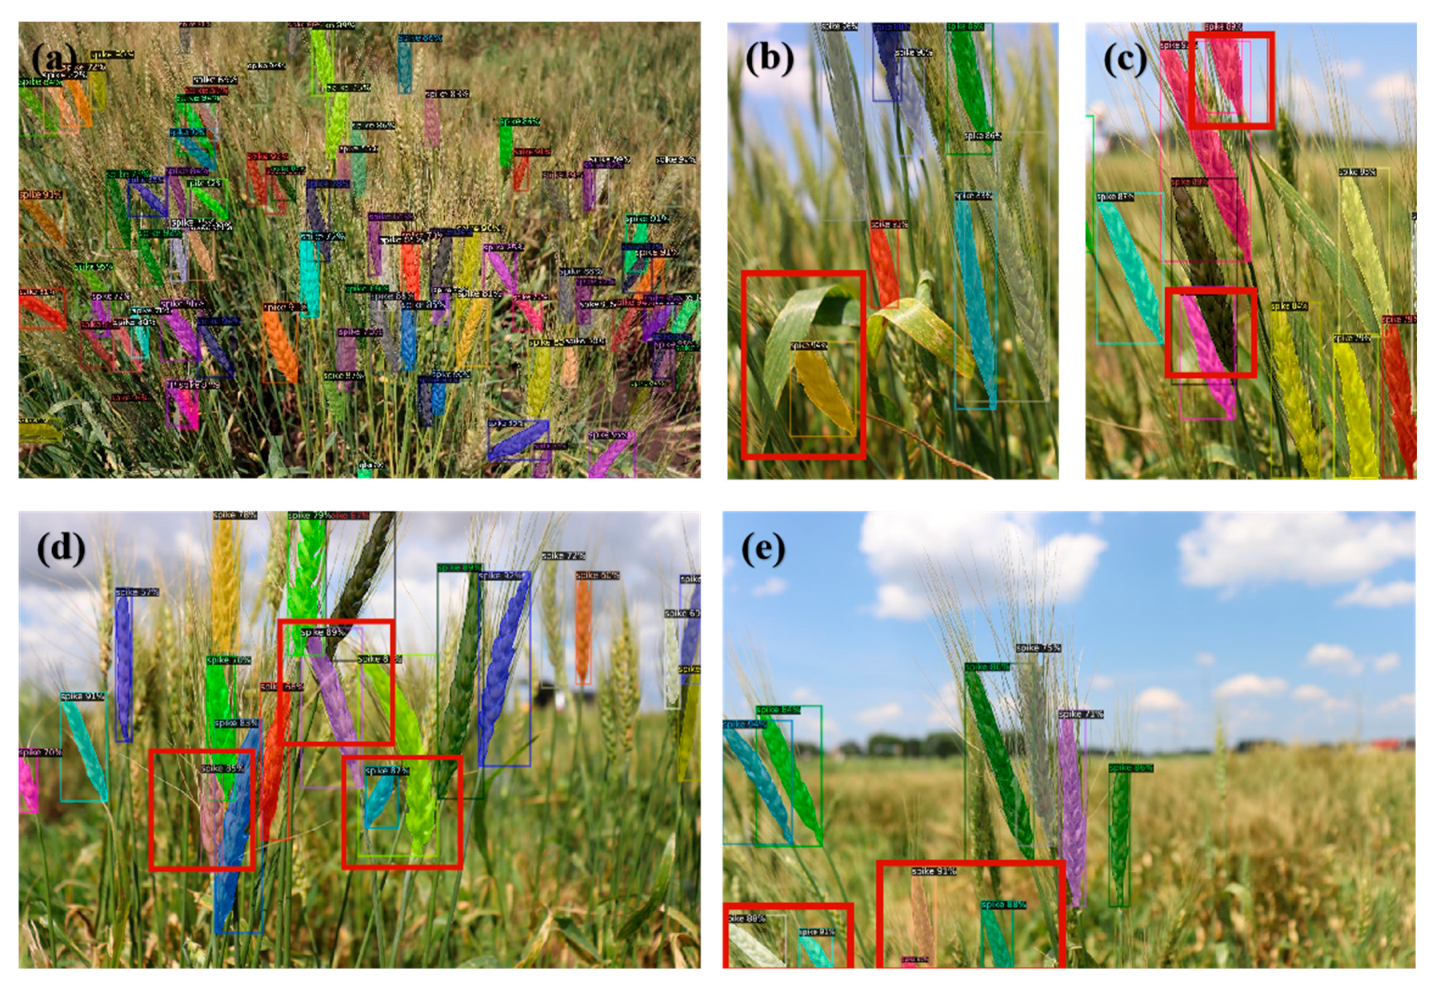
3.2. Wheat Spike Identification
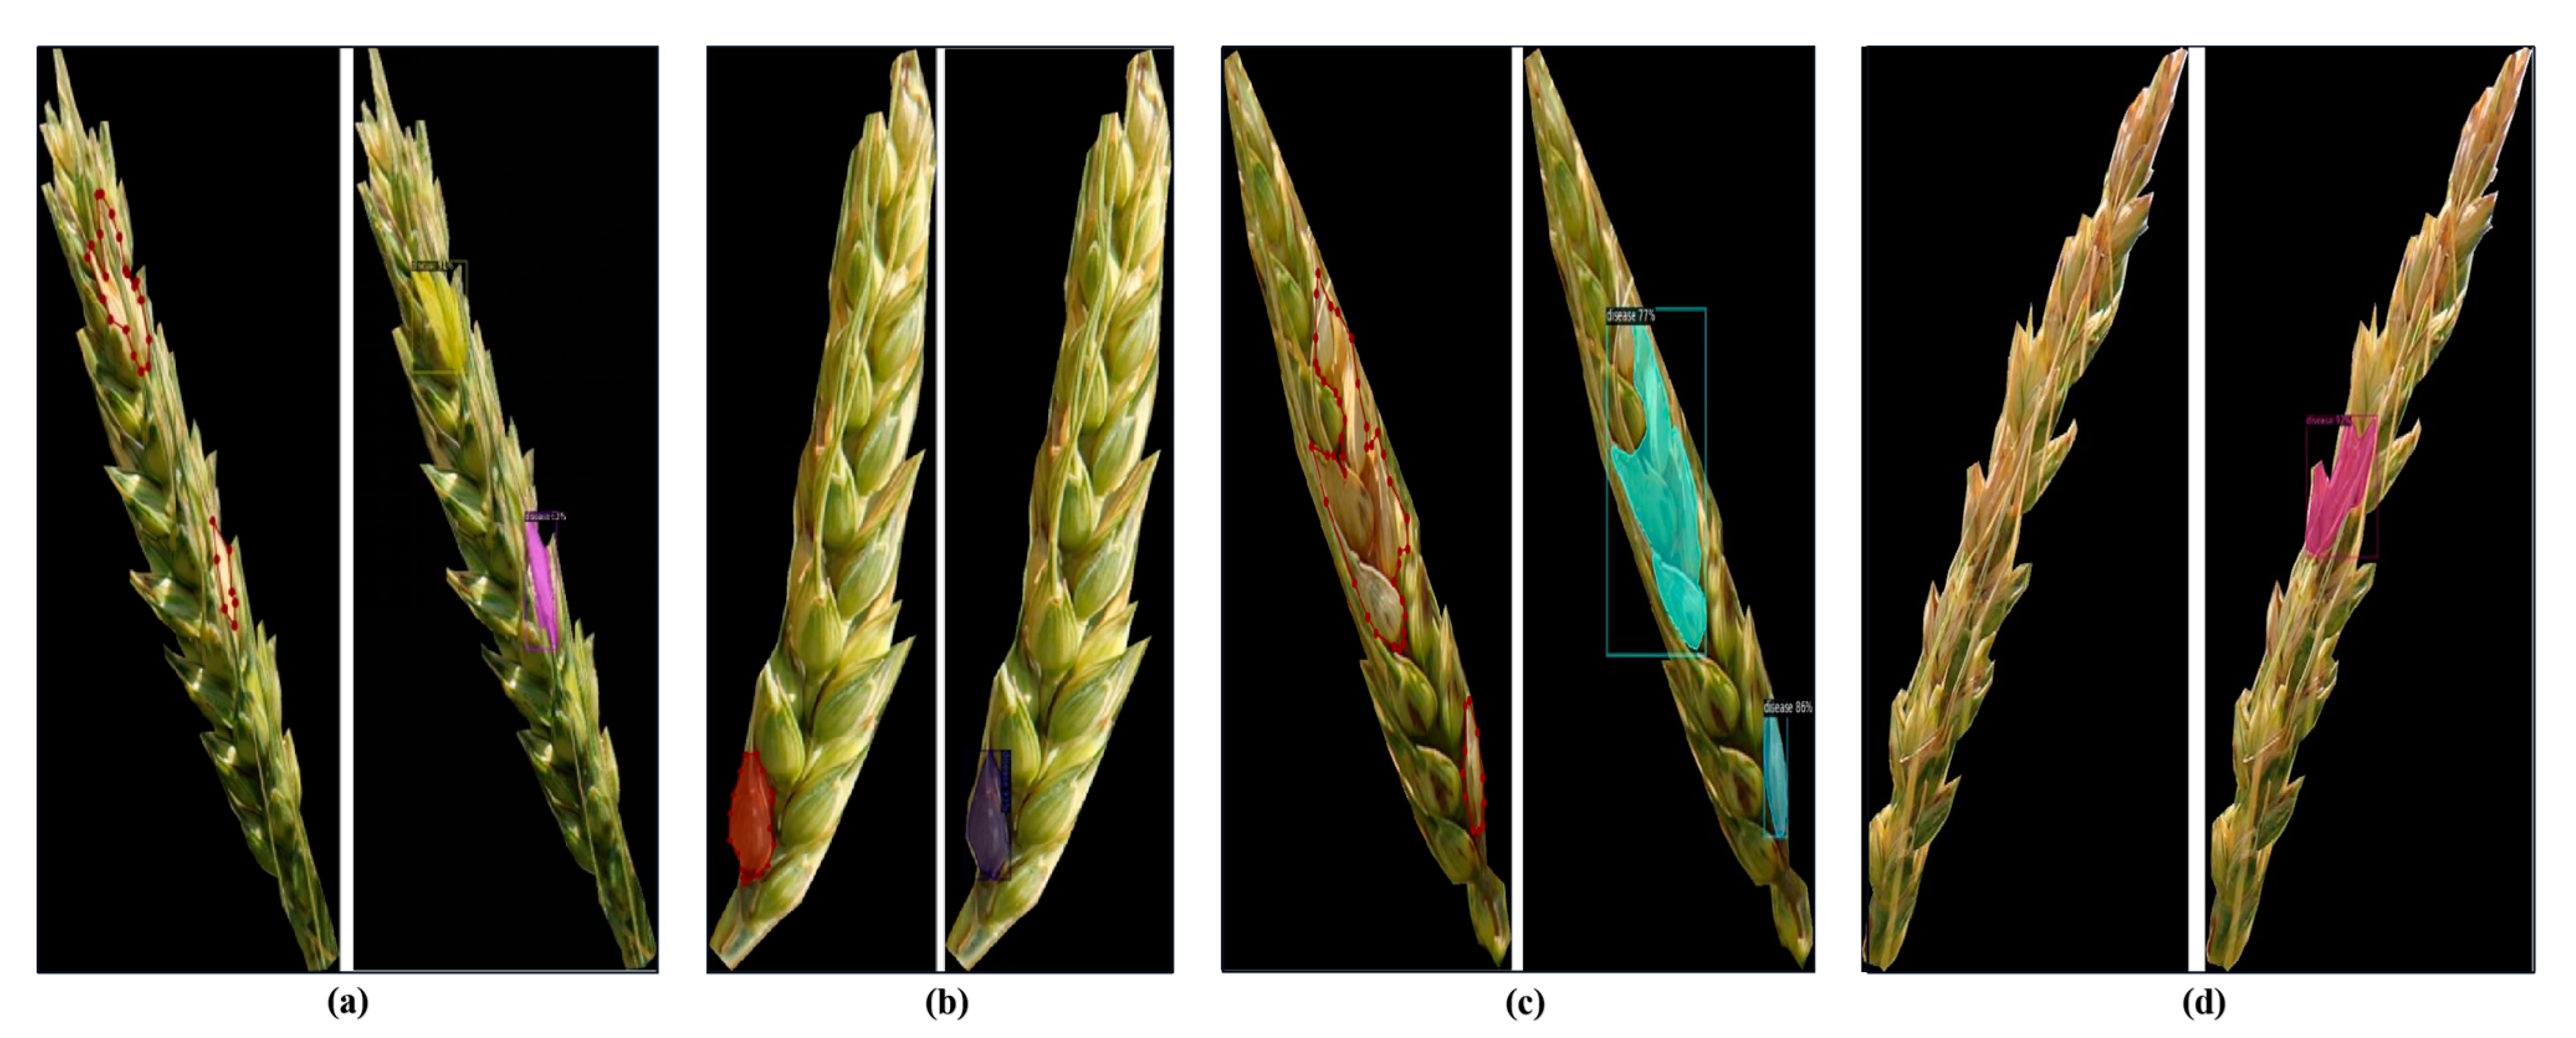
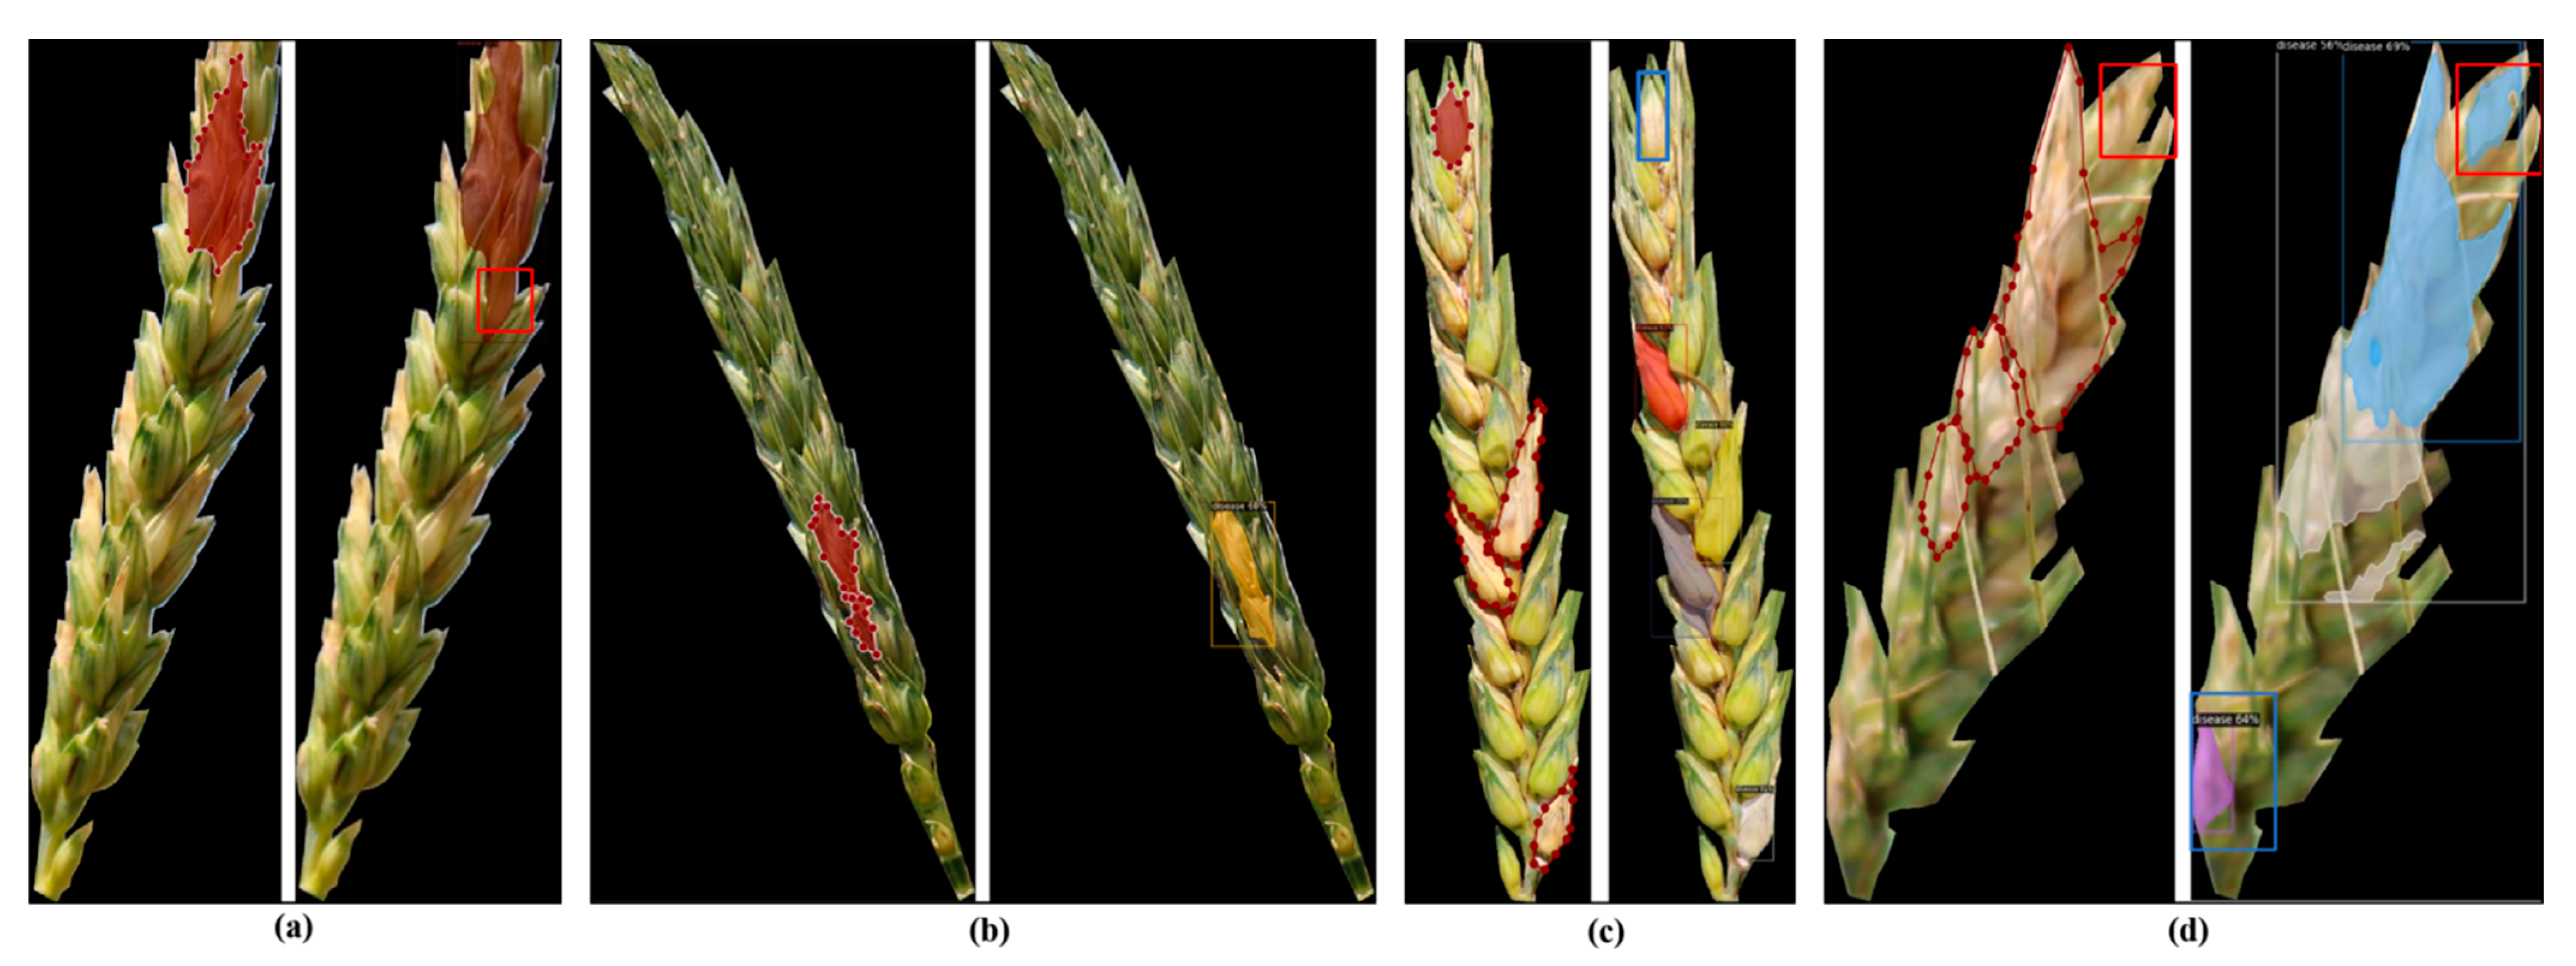
3.3. FHB Disease Evaluation
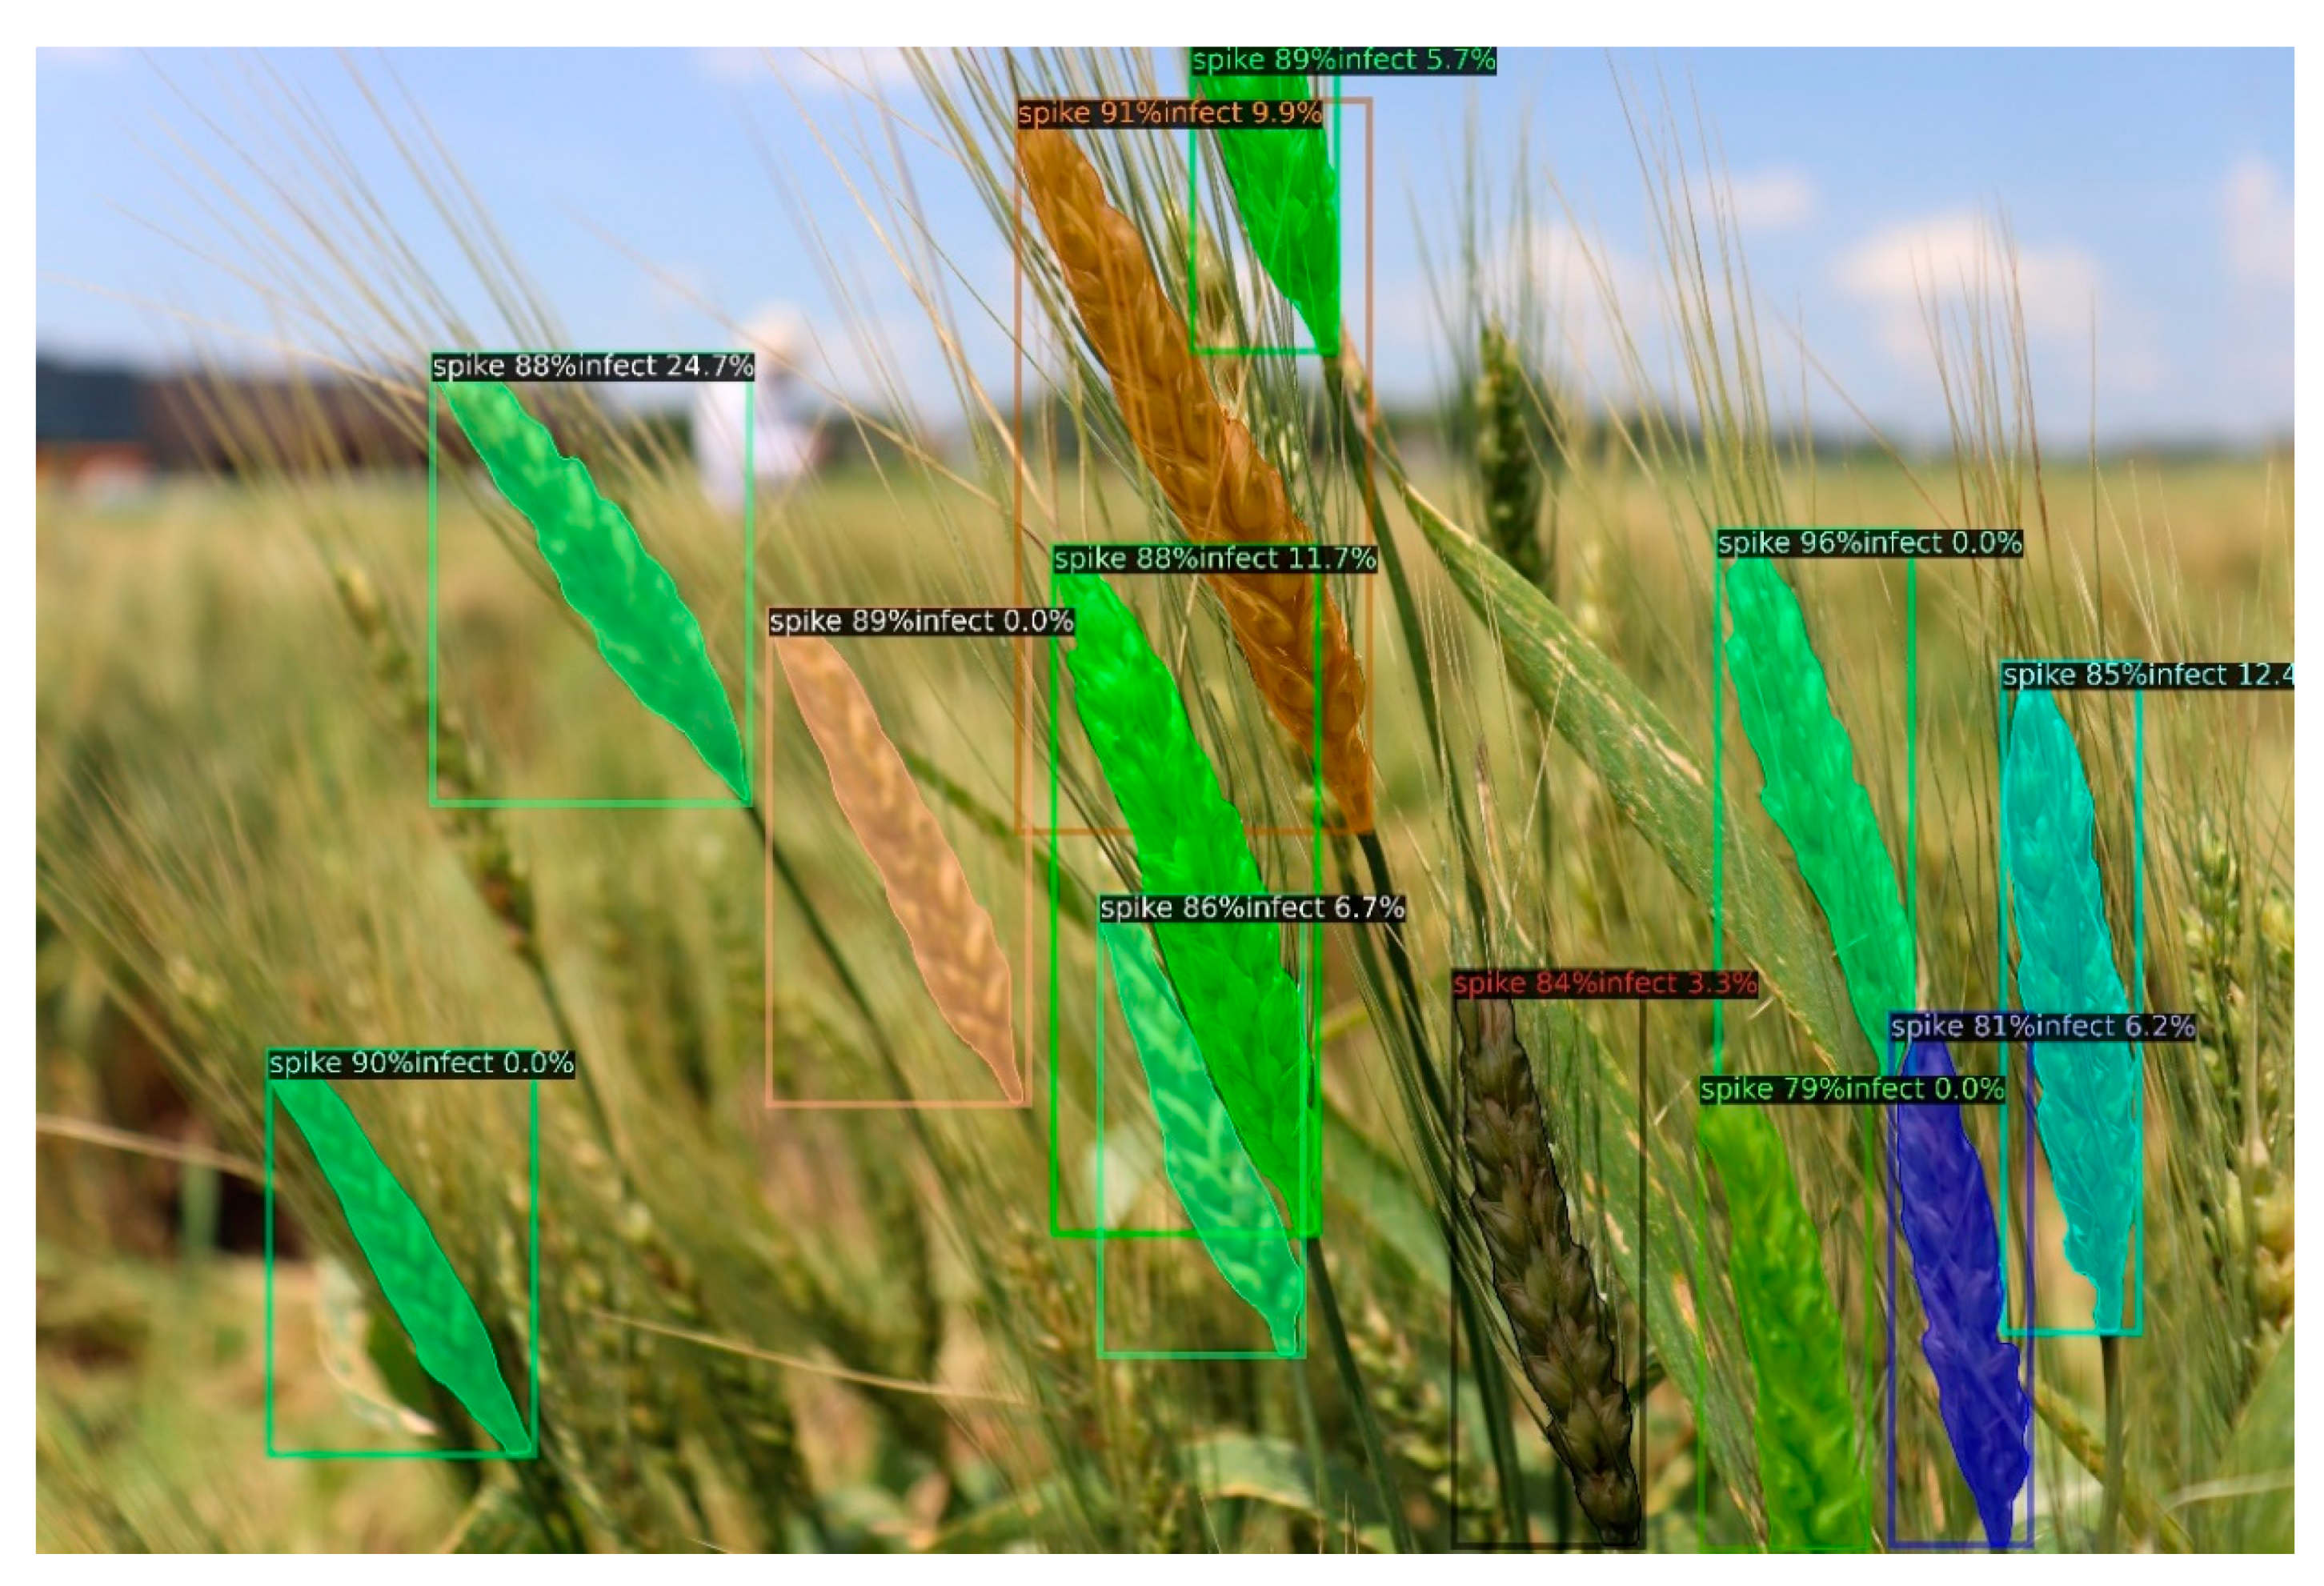
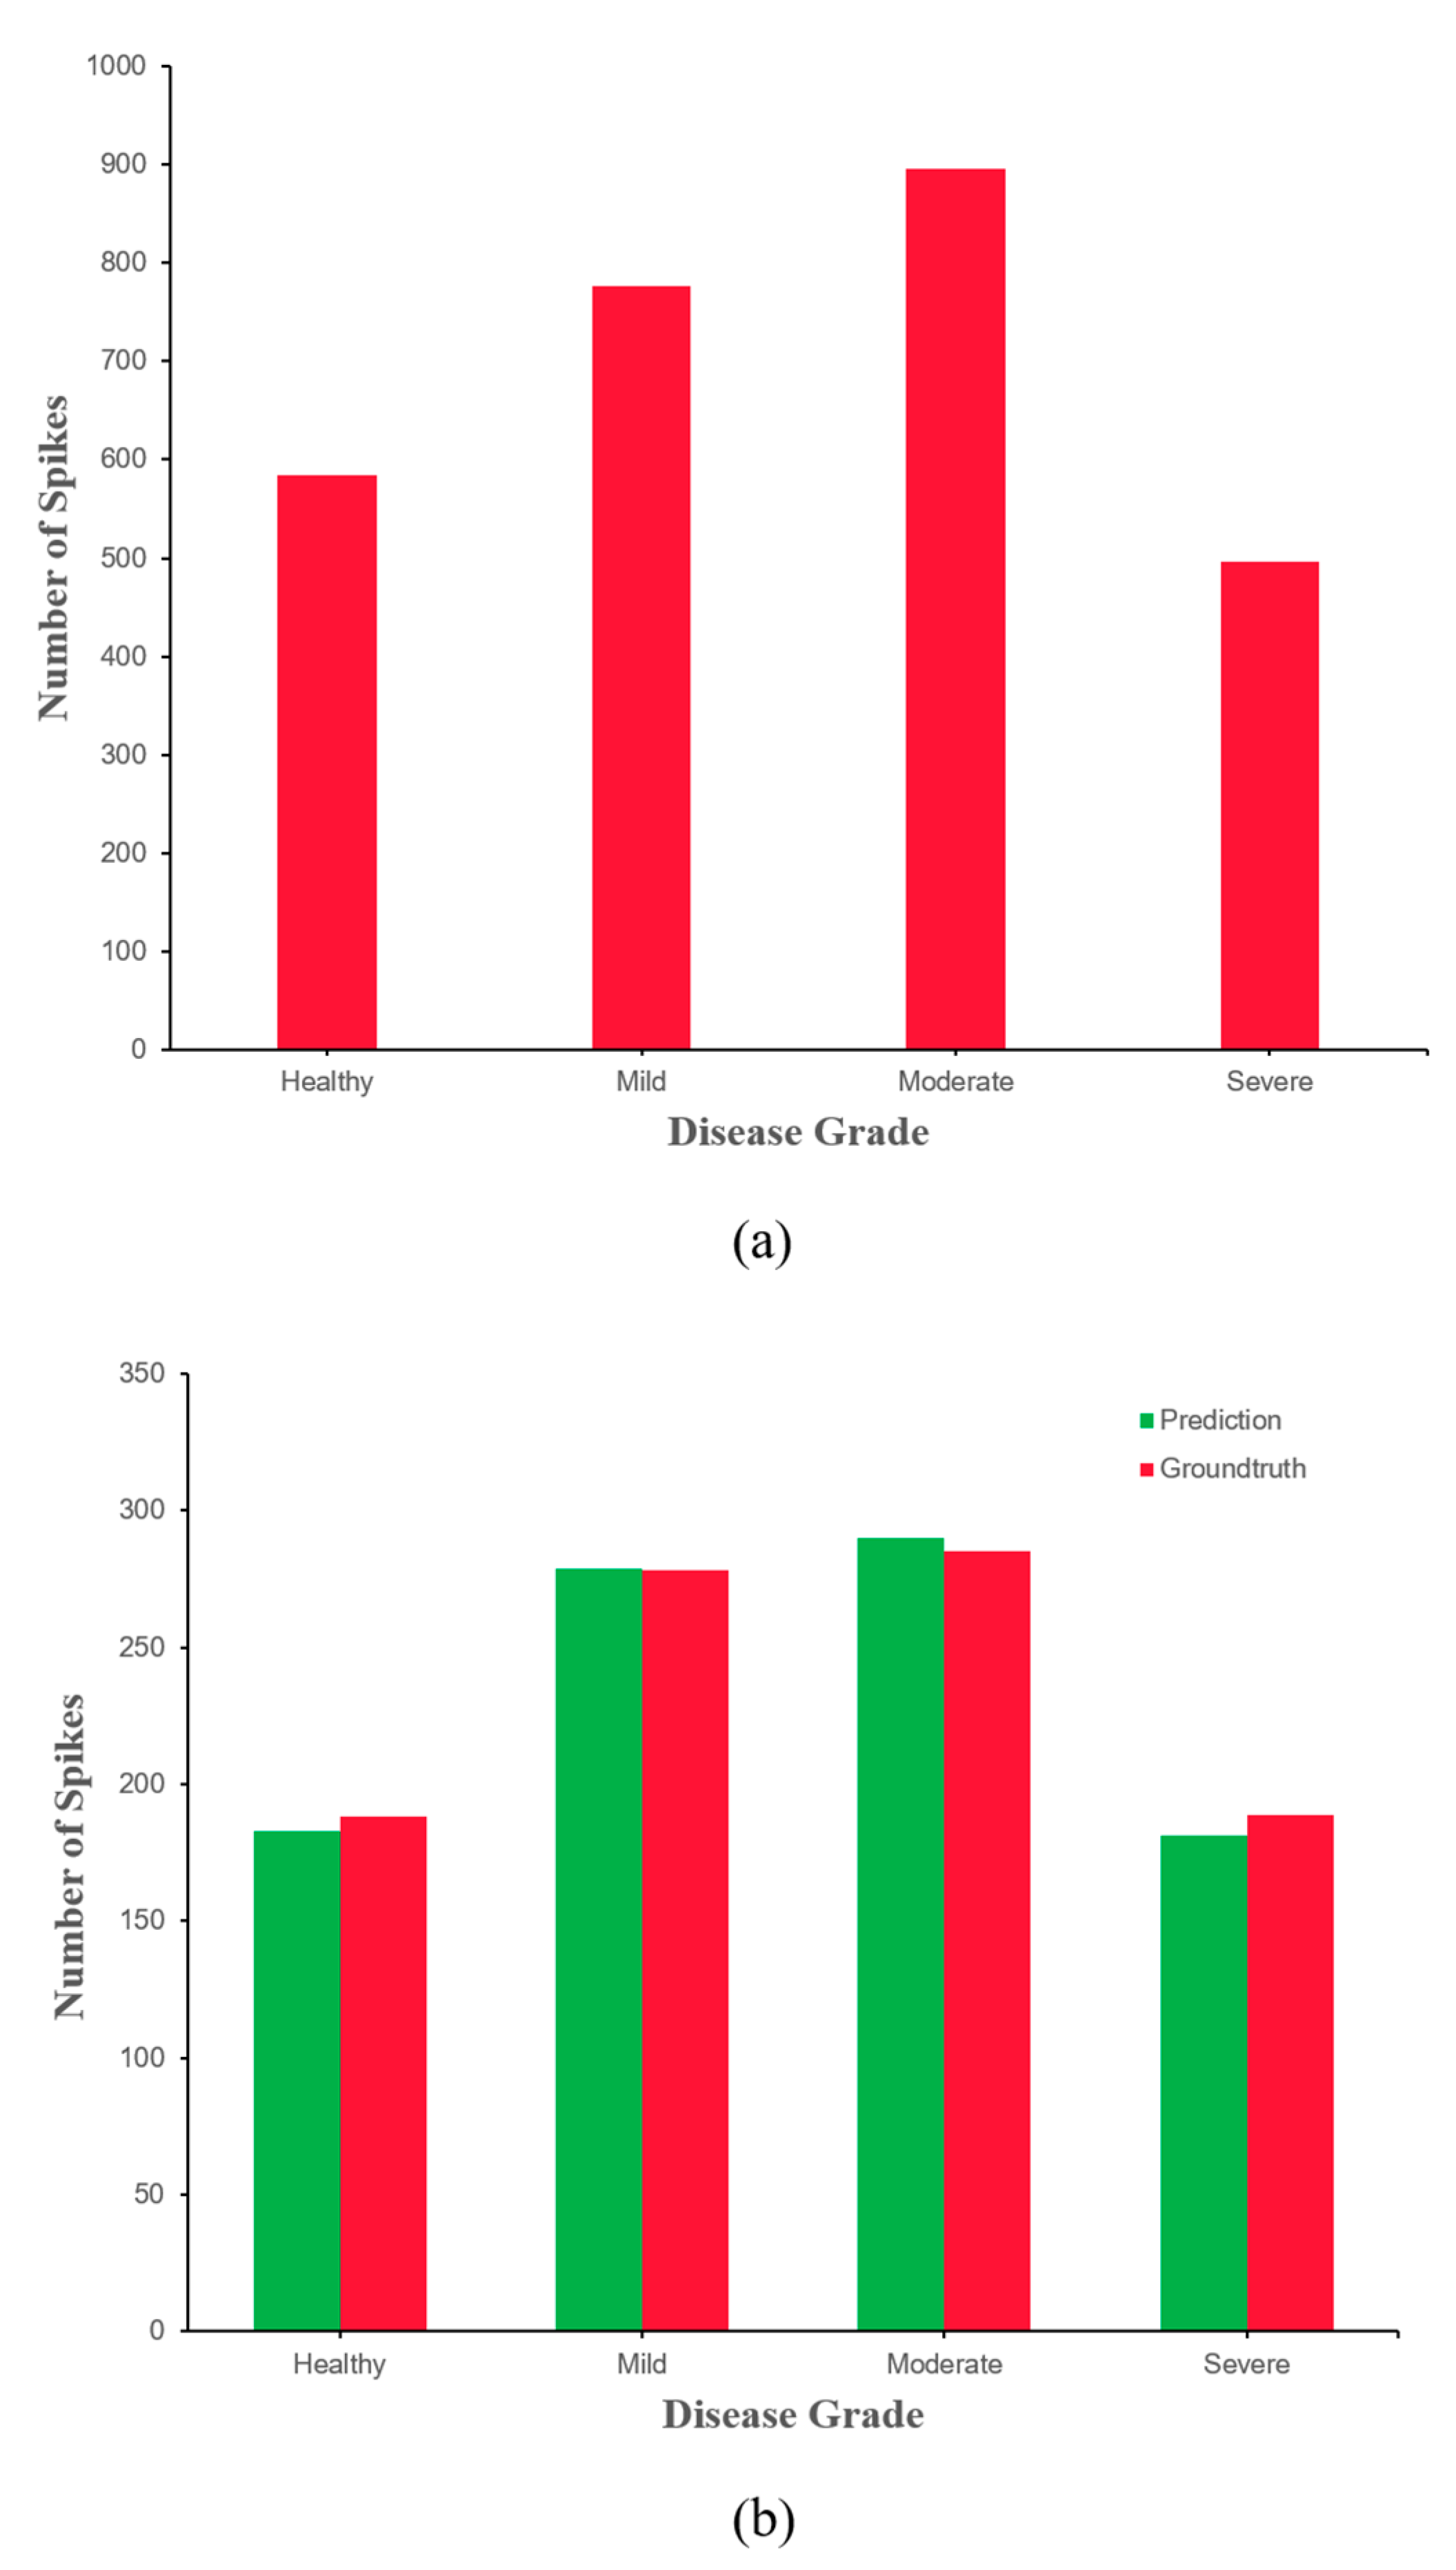
4. Classification of Wheat FHB Severity Grades
5. Discussion
6. Conclusions
Author Contributions
Funding
Data Availability Statement
Conflicts of Interest
References
- Shiferaw, B.; Smale, M.; Braun, H.-J.; Duveiller, E.; Reynolds, M.; Muricho, G. Crops that feed the world 10. Past successes and future challenges to the role played by wheat in global food security. Food Secur. 2013, 5, 291–317. [Google Scholar] [CrossRef]
- Figueroa, M.; Hammond-Kosack, K.E.; Solomon, P.S. A review of wheat diseases—A field perspective. Mol. Plant Pathol. 2018, 19, 1523–1536. [Google Scholar] [CrossRef]
- O’Donnell, K.; Ward, T.J.; Geiser, D.M.; Kistler, H.; Aoki, T. Genealogical concordance between the mating type locus and seven other nuclear genes supports formal recognition of nine phylogenetically distinct species within the Fusarium graminearum clade. Fungal Genet. Biol. 2004, 41, 600–623. [Google Scholar] [CrossRef] [PubMed]
- Femenias, A.; Gatius, F.; Ramos, A.J.; Sanchis, V.; Marín, S. Use of hyperspectral imaging as a tool for Fusarium and deoxynivalenol risk management in cereals: A review. Food Control 2019, 108, 106819. [Google Scholar] [CrossRef]
- Stack, R.W.; McMullen, M.P. A visual scale to estimate severity of Fusarium head blight in wheat. 1998. Available online: https://library.ndsu.edu/ir/bitstream/handle/10365/9187/PP1095_1998.pdf?sequence=1 (accessed on 13 September 2022).
- Barbedo, J.; Tibola, C.S.; Lima, M.I.P. Deoxynivalenol screening in wheat kernels using hyperspectral imaging. Biosyst. Eng. 2017, 155, 24–32. [Google Scholar] [CrossRef]
- Su, W.-H.; Yang, C.; Dong, Y.; Johnson, R.; Page, R.; Szinyei, T.; Hirsch, C.D.; Steffenson, B.J. Hyperspectral imaging and improved feature variable selection for automated determination of deoxynivalenol in various genetic lines of barley kernels for resistance screening. Food Chem. 2020, 343, 128507. [Google Scholar] [CrossRef]
- Su, W.-H.; Xue, H. Imaging Spectroscopy and Machine Learning for Intelligent Determination of Potato and Sweet Potato Quality. Foods 2021, 10, 2146. [Google Scholar] [CrossRef]
- Su, W.-H.; Sun, D.-W.; He, J.-G.; Zhang, L.-B. Variation analysis in spectral indices of volatile chlorpyrifos and non-volatile imidacloprid in jujube (Ziziphus jujuba Mill.) using near-infrared hyperspectral imaging (NIR-HSI) and gas chromatograph-mass spectrometry (GC–MS). Comput. Electron. Agric. 2017, 139, 41–55. [Google Scholar] [CrossRef]
- Su, W.-H.; Sun, D.-W. Rapid determination of starch content of potato and sweet potato by using NIR hyperspectral imaging. Hortscience 2019, 54, S38. [Google Scholar]
- Su, W.-H.; Sun, D.-W. Advanced Analysis of Roots and Tubers by Hyperspectral Techniques. In Advances in Food and Nutrition Research; Elsevier BV: Amsterdam, The Netherlands, 2019; Volume 87, pp. 255–303. [Google Scholar]
- Su, W.-H.; Sun, D.-W. Potential of hyperspectral imaging for visual authentication of sliced organic potatoes from potato and sweet potato tubers and rapid grading of the tubers according to moisture proportion. Comput. Electron. Agric. 2016, 125, 113–124. [Google Scholar] [CrossRef]
- Su, W.-H.; He, H.-J.; Sun, D.-W. Non-Destructive and rapid evaluation of staple foods quality by using spectroscopic techniques: A review. Crit. Rev. Food Sci. Nutr. 2016, 57, 1039–1051. [Google Scholar] [CrossRef]
- Su, W.-H.; Sun, D.-W. Fourier Transform Infrared and Raman and Hyperspectral Imaging Techniques for Quality Determinations of Powdery Foods: A Review. Compr. Rev. Food Sci. Food Saf. 2017, 17, 104–122. [Google Scholar] [CrossRef] [PubMed]
- Su, W.-H. Advanced Machine Learning in Point Spectroscopy, RGB-and hyperspectral-imaging for automatic discriminations of crops and weeds: A review. Smart Cities 2020, 3, 39. [Google Scholar] [CrossRef]
- Nagasubramanian, K.; Jones, S.; Singh, A.K.; Sarkar, S.; Singh, A.; Ganapathysubramanian, B. Plant disease identification using explainable 3D deep learning on hyperspectral images. Plant Methods 2019, 15, 98. [Google Scholar] [CrossRef] [PubMed]
- Raghavendra, A.; Guru, D.; Rao, M.K. Mango internal defect detection based on optimal wavelength selection method using NIR spectroscopy. Artif. Intell. Agric. 2021, 5, 43–51. [Google Scholar] [CrossRef]
- Peiris, K.H.S.; Pumphrey, M.O.; Dong, Y.; Maghirang, E.B.; Berzonsky, W.; Dowell, F.E. Near-Infrared Spectroscopic Method for Identification of Fusarium Head Blight Damage and Prediction of Deoxynivalenol in Single Wheat Kernels. Cereal Chem. 2010, 87, 511–517. [Google Scholar] [CrossRef]
- Femenias, A.; Gatius, F.; Ramos, A.J.; Teixido-Orries, I.; Marín, S. Hyperspectral imaging for the classification of individual cereal kernels according to fungal and mycotoxins contamination: A review. Food Res. Int. 2022, 155, 111102. [Google Scholar] [CrossRef] [PubMed]
- Lu, J.; Hu, J.; Zhao, G.; Mei, F.; Zhang, C. An in-field automatic wheat disease diagnosis system. Comput. Electron. Agric. 2017, 142, 369–379. [Google Scholar] [CrossRef]
- Weng, S.; Tang, P.; Yuan, H.; Guo, B.; Yu, S.; Huang, L.; Xu, C. Hyperspectral imaging for accurate determination of rice variety using a deep learning network with multi-feature fusion. Spectrochim. Acta Part A Mol. Biomol. Spectrosc. 2020, 234, 118237. [Google Scholar] [CrossRef]
- Ahmad, A.; Saraswat, D.; El Gamal, A. A survey on using deep learning techniques for plant disease diagnosis and recommendations for development of appropriate tools. Smart Agric. Technol. 2023, 3, 100083. [Google Scholar] [CrossRef]
- Lecun, Y.; Bottou, L.; Bengio, Y.; Haffner, P. Gradient-based learning applied to document recognition. Proc. IEEE 1998, 86, 2278–2324. [Google Scholar] [CrossRef]
- Krizhevsky, A.; Sutskever, I.; Hinton, G.E. Imagenet classification with deep convolutional neural networks. NIPS 2012, 60, 84–90. [Google Scholar] [CrossRef]
- He, K.; Zhang, X.; Ren, S.; Sun, J. Deep residual learning for image recognition. In Proceedings of the IEEE conference on computer vision and pattern recognition, Las Vegas, NV, USA, 27–30 June 2016; pp. 770–778. [Google Scholar]
- Simonyan, K.; Zisserman, A. Very deep convolutional networks for large-scale image recognition. arXiv preprint 2014, arXiv:1409.1556. [Google Scholar]
- Dong, M.; Mu, S.; Shi, A.; Mu, W.; Sun, W. Novel method for identifying wheat leaf disease images based on differential amplification convolutional neural network. Int. J. Agric. Biol. Eng. 2020, 13, 205–210. [Google Scholar] [CrossRef]
- Wagle, S.A.; R, H. Comparison of Plant Leaf Classification Using Modified AlexNet and Support Vector Machine. Trait. Signal 2021, 38, 79–87. [Google Scholar] [CrossRef]
- Hassan, S.M.; Jasinski, M.; Leonowicz, Z.; Jasinska, E.; Maji, A.K. Plant Disease Identification Using Shallow Convolutional Neural Network. Agronomy 2021, 11, 2388. [Google Scholar] [CrossRef]
- Hassan, S.M.; Maji, A.K. Plant Disease Identification Using a Novel Convolutional Neural Network. IEEE Access 2022, 10, 5390–5401. [Google Scholar] [CrossRef]
- Fenu, G.; Malloci, F.M. Using Multioutput Learning to Diagnose Plant Disease and Stress Severity. Complexity 2021, 2021, 6663442. [Google Scholar] [CrossRef]
- Girshick, R.; Donahue, J.; Darrell, T.; Malik, J. Rich Feature Hierarchies for Accurate Object Detection and Semantic Segmentation. In Proceedings of the IEEE Conference on Computer Vision and Pattern Recognition, Columbus, OH, USA, 23–28 June 2014; pp. 580–587. [Google Scholar] [CrossRef]
- Girshick, R. Fast r-cnn. In Proceedings of the IEEE international conference on computer vision, Santiago, Chile, 7–13 December 2015; pp. 1440–1448. [Google Scholar]
- Ren, S.; He, K.; Girshick, R.; Sun, J. Faster R-CNN: Towards Real-Time Object Detection with Region Proposal Networks. IEEE Trans. Pattern Anal. Mach. Intell. 2016, 39, 1137–1149. [Google Scholar] [CrossRef]
- Hasan, M.M.; Chopin, J.P.; Laga, H.; Miklavcic, S.J. Detection and analysis of wheat spikes using convolutional neural networks. Plant Methods 2018, 14, 1–13. [Google Scholar] [CrossRef]
- Zhang, D.; Wang, D.; Gu, C.; Jin, N.; Zhao, H.; Chen, G.; Liang, H.; Liang, D. Using Neural Network to Identify the Severity of Wheat Fusarium Head Blight in the Field Environment. Remote Sens. 2019, 11, 2375. [Google Scholar] [CrossRef]
- Kukreja, V.; Kumar, D. Automatic Classification of Wheat Rust Diseases Using Deep Convolutional Neural Networks. In Proceedings of the 2021 9th International Conference on Reliability, Infocom Technologies and Optimization (Trends and Future Directions) (ICRITO), Noida, India, 3–4 September 2021; pp. 1–6. [Google Scholar] [CrossRef]
- He, K.; Gkioxari, G.; Dollár, P.; Girshick, R. Mask r-cnn. In Proceedings of the IEEE International Conference on Computer Vision, Venice, Italy, 22–29 October 2017; pp. 2961–2969. [Google Scholar]
- Kumar, D.; Kukreja, V. Quantifying the Severity of Loose Smut in Wheat Using MRCNN. In Proceedings of the 2022 International Conference on Decision Aid Sciences and Applications (DASA), Chiangrai, Thailand, 23–25 March 2022; pp. 630–634. [Google Scholar]
- Kumar, D.; Kukreja, V. An Instance Segmentation Approach for Wheat Yellow Rust Disease Recognition. In Proceedings of the 2021 International Conference on Decision Aid Sciences and Application (DASA), Online, 7–8 December 2021; pp. 926–931. [Google Scholar]
- Yang, K.; Zhong, W.; Li, F. Leaf Segmentation and Classification with a Complicated Background Using Deep Learning. Agronomy 2020, 10, 1721. [Google Scholar] [CrossRef]
- Su, W.-H.; Zhang, J.; Yang, C.; Page, R.; Szinyei, T.; Hirsch, C.; Steffenson, B. Automatic Evaluation of Wheat Resistance to Fusarium Head Blight Using Dual Mask-RCNN Deep Learning Frameworks in Computer Vision. Remote Sens. 2020, 13, 26. [Google Scholar] [CrossRef]
- Chen, H.; Sun, K.; Tian, Z.; Shen, C.; Huang, Y.; Yan, Y. Blendmask: Top-down meets bottom-up for instance segmentation. In Proceedings of the IEEE/CVF Conference on Computer Vision and Pattern Recognition, Seattle, WA, USA, 13–19 June 2020; pp. 8573–8581. [Google Scholar]
- Xi, X.; Xia, K.; Yang, Y.; Du, X.; Feng, H. Evaluation of dimensionality reduction methods for individual tree crown delineation using instance segmentation network and UAV multispectral imagery in urban forest. Comput. Electron. Agric. 2021, 191, 106506. [Google Scholar] [CrossRef]
- Esgario, J.G.; Krohling, R.A.; Ventura, J.A. Deep learning for classification and severity estimation of coffee leaf biotic stress. Comput. Electron. Agric. 2020, 169, 105162. [Google Scholar] [CrossRef]
- Pan, J.; Xia, L.; Wu, Q.; Guo, Y.; Chen, Y.; Tian, X. Automatic strawberry leaf scorch severity estimation via faster R-CNN and few-shot learning. Ecol. Informatics 2022, 70, 101706. [Google Scholar] [CrossRef]
- Joshi, R.C.; Kaushik, M.; Dutta, M.K.; Srivastava, A.; Choudhary, N. VirLeafNet: Automatic analysis and viral disease diagnosis using deep-learning in Vigna mungo plant. Ecol. Informatics 2020, 61, 101197. [Google Scholar] [CrossRef]
- Zhang, D.-Y.; Luo, H.-S.; Wang, D.-Y.; Zhou, X.-G.; Li, W.-F.; Gu, C.-Y.; Zhang, G.; He, F.-M. Assessment of the levels of damage caused by Fusarium head blight in wheat using an improved YoloV5 method. Comput. Electron. Agric. 2022, 198, 107086. [Google Scholar] [CrossRef]
- Ji, M.; Wu, Z. Automatic detection and severity analysis of grape black measles disease based on deep learning and fuzzy logic. Comput. Electron. Agric. 2022, 193, 106718. [Google Scholar] [CrossRef]
- Wu, Q.; Ji, M.; Deng, Z. Automatic Detection and Severity Assessment of Pepper Bacterial Spot Disease via MultiModels Based on Convolutional Neural Networks. Int. J. Agric. Environ. Inf. Syst. 2020, 11, 29–43. [Google Scholar] [CrossRef]
- Liu, B.-Y.; Fan, K.-J.; Su, W.-H.; Peng, Y. Two-Stage Convolutional Neural Networks for Diagnosing the Severity of Alternaria Leaf Blotch Disease of the Apple Tree. Remote Sens. 2022, 14, 2519. [Google Scholar] [CrossRef]
- Thakur, P.S.; Khanna, P.; Sheorey, T.; Ojha, A. Trends in vision-based machine learning techniques for plant disease identification: A systematic review. Expert Syst. Appl. 2022, 208, 118117. [Google Scholar] [CrossRef]
- Hochreiter, S. The Vanishing Gradient Problem During Learning Recurrent Neural Nets and Problem Solutions. Int. J. Uncertain. Fuzziness Knowl. Based Syst. 1998, 6, 107–116. [Google Scholar] [CrossRef]
- Wu, Z.; Shen, C.; Van Den Hengel, A. Wider or deeper: Revisiting the resnet model for visual recognition. Pattern Recog. 2019, 90, 119–133. [Google Scholar] [CrossRef]
- Lin, T.-Y.; Dollár, P.; Girshick, R.; He, K.; Hariharan, B.; Belongie, S. Feature pyramid networks for object detection. In Proceedings of the IEEE Conference on Computer Vision and Pattern Recognition, Honolulu, HI, USA, 21–26 July 2017; pp. 2117–2125. [Google Scholar]
- Powers, D.M. Evaluation: From precision, recall and F-measure to ROC, informedness, markedness and correlation. arXiv preprint 2020, arXiv:2010.16061. [Google Scholar]
- Zhang, X.; Graepel, T.; Herbrich, R. Bayesian online learning for multi-label and multi-variate performance measures. In Proceedings of the Thirteenth International Conference on Artificial Intelligence and Statistics, Chia Laguna Resort, Sardinia, Italy, 13–15 May 2010; pp. 956–963. [Google Scholar]
- Garcia-Garcia, A.; Orts-Escolano, S.; Oprea, S.; Villena-Martinez, V.; Garcia-Rodriguez, J. A review on deep learning techniques applied to semantic segmentation. arXiv preprint 2017, arXiv:1704.06857. [Google Scholar]
- Li, Q.; Arnab, A.; Torr, P.H. Weakly-and semi-supervised panoptic segmentation. In Proceedings of the European Conference on Computer Vision (ECCV), Online, 8–14 September 2018; pp. 102–118. [Google Scholar]
- Fang, H.-S.; Sun, J.; Wang, R.; Gou, M.; Li, Y.-L.; Lu, C. Instaboost: Boosting instance segmentation via probability map guided copy-pasting. In Proceedings of the IEEE/CVF International Conference on Computer Vision, Seoul, Korea, 27 October–2 November 2019; pp. 682–691. [Google Scholar] [CrossRef]
- Qiongyan, L.; Cai, J.; Berger, B.; Okamoto, M.; Miklavcic, S.J. Detecting spikes of wheat plants using neural networks with Laws texture energy. Plant Methods 2017, 13, 83. [Google Scholar] [CrossRef]
- Misra, T.; Arora, A.; Marwaha, S.; Chinnusamy, V.; Rao, A.R.; Jain, R.; Sahoo, R.N.; Ray, M.; Kumar, S.; Raju, D.; et al. SpikeSegNet-a deep learning approach utilizing encoder-decoder network with hourglass for spike segmentation and counting in wheat plant from visual imaging. Plant Methods 2020, 16, 40. [Google Scholar] [CrossRef]
- Dosovitskiy, A.; Beyer, L.; Kolesnikov, A.; Weissenborn, D.; Zhai, X.; Unterthiner, T.; Dehghani, M.; Minderer, M.; Heigold, G.; Gelly, S. An image is worth 16x16 words: Transformers for image recognition at scale. arXiv preprint 2020, arXiv:2010.11929. [Google Scholar]
- Liu, Z.; Lin, Y.; Cao, Y.; Hu, H.; Wei, Y.; Zhang, Z.; Lin, S.; Guo, B. Swin transformer: Hierarchical vision transformer using shifted windows. In Proceedings of the IEEE/CVF International Conference on Computer Vision, Online, 11–17 October 2021; pp. 9992–10002. [Google Scholar] [CrossRef]


| References | Model | Crop | Severity Levels | Accuracy (%) |
|---|---|---|---|---|
| Esgario et al. [45] | AlexNet, GoogleNet, VGGNet, ResNet, MobileNet | Coffee | Healthy, low, very low, high, very high | 84.13 |
| Pan et al. [46] | Faster R-CNN (VGG16) | Strawberry | Healthy, general, serious | 88.3 |
| Joshi et al. [47] | VirLeafNet | Vigna mungo | Healthy, mild, severe | 91.5 |
| Zhang et al. [48] | Improved YoLo V5 | Wheat | Minor, light, medium, heavy, major | 91.0 |
| Ji et al. [49] | DeeplabV3+ | Grape | Healthy, mild, medium, severe | 97.75 |
| Wu et al. [50] | MultiModel_VGR | Pepper | Healthy, general, serious | 95.34 |
| Liu et al. [51] | DeeplabV3+, PSPNet, UNet | Apple | Healthy, early, mild, moderate, severe | 96.41 |
| Hyperparameter | Values |
|---|---|
| Backbone | Resnet-50 |
| Batch size | 16 |
| Base learning rate | 0.01 |
| Attention size | 14 |
| Max iteration | 1,700,000 |
| Bottom resolution | 56 |
| Number of classes | 2 |
| Application | Training Time | Validation Time |
|---|---|---|
| Wheat spike identification | 72 h 45 min 28 s | 14 min 36 s |
| FHB disease detection | 46 h 25 min 43 s | 2 min 30 s |
| Type | Precision (%) | Recall (%) | F1-score (%) | IoU (%) | Ap of Mask (%) | MIoU (%) |
|---|---|---|---|---|---|---|
| Wheat spike | 85.36 | 75.58 | 80.17 | 48.23 | 59.28 | 56.21 |
| FHB disease | 78.16 | 79.46 | 78.89 | 52.41 | 66.74 | 55.34 |
| Grade | Type | Severity (%) | ||
|---|---|---|---|---|
| Means ± SD | Max | Min | ||
| Healthy | Ground truth | 2.8 ± 1.1 | 5.0 | 0.0 |
| Prediction | 2.9 ± 0.8 | 4.9 | 0.0 | |
| Mild | Ground truth | 7.4 ± 2.1 | 10.0 | 5.1 |
| Prediction | 6.9 ± 1.4 | 9.8 | 5.0 | |
| Moderate | Ground truth | 15.5 ± 2.3 | 20.0 | 10.3 |
| Prediction | 14.4 ± 2.1 | 18.9 | 10.1 | |
| Severe | Ground truth | 38.6 ± 4.6 | 49.8 | 21.2 |
| Prediction | 36.4 ± 4.1 | 48.7 | 20.8 | |
| Grade | Precision (%) | Sensitivity (%) | F1-score (%) |
|---|---|---|---|
| Healthy | 93.6 | 88.9 | 91.1 |
| Mild | 93.7 | 90.9 | 91.7 |
| Moderate | 92.6 | 92.8 | 92.9 |
| Severe | 94.8 | 93.1 | 93.2 |
Publisher’s Note: MDPI stays neutral with regard to jurisdictional claims in published maps and institutional affiliations. |
© 2022 by the authors. Licensee MDPI, Basel, Switzerland. This article is an open access article distributed under the terms and conditions of the Creative Commons Attribution (CC BY) license (https://creativecommons.org/licenses/by/4.0/).
Share and Cite
Gao, Y.; Wang, H.; Li, M.; Su, W.-H. Automatic Tandem Dual BlendMask Networks for Severity Assessment of Wheat Fusarium Head Blight. Agriculture 2022, 12, 1493. https://doi.org/10.3390/agriculture12091493
Gao Y, Wang H, Li M, Su W-H. Automatic Tandem Dual BlendMask Networks for Severity Assessment of Wheat Fusarium Head Blight. Agriculture. 2022; 12(9):1493. https://doi.org/10.3390/agriculture12091493
Chicago/Turabian StyleGao, Yichao, Hetong Wang, Man Li, and Wen-Hao Su. 2022. "Automatic Tandem Dual BlendMask Networks for Severity Assessment of Wheat Fusarium Head Blight" Agriculture 12, no. 9: 1493. https://doi.org/10.3390/agriculture12091493
APA StyleGao, Y., Wang, H., Li, M., & Su, W.-H. (2022). Automatic Tandem Dual BlendMask Networks for Severity Assessment of Wheat Fusarium Head Blight. Agriculture, 12(9), 1493. https://doi.org/10.3390/agriculture12091493