
A Modified Location-Weighted Landscape Index to Evaluate Nutrient Retention in Agricultural Wetlands: A Case Study of the Honghe Hani Rice Terraces World Heritage Site


Abstract
:1. Introduction
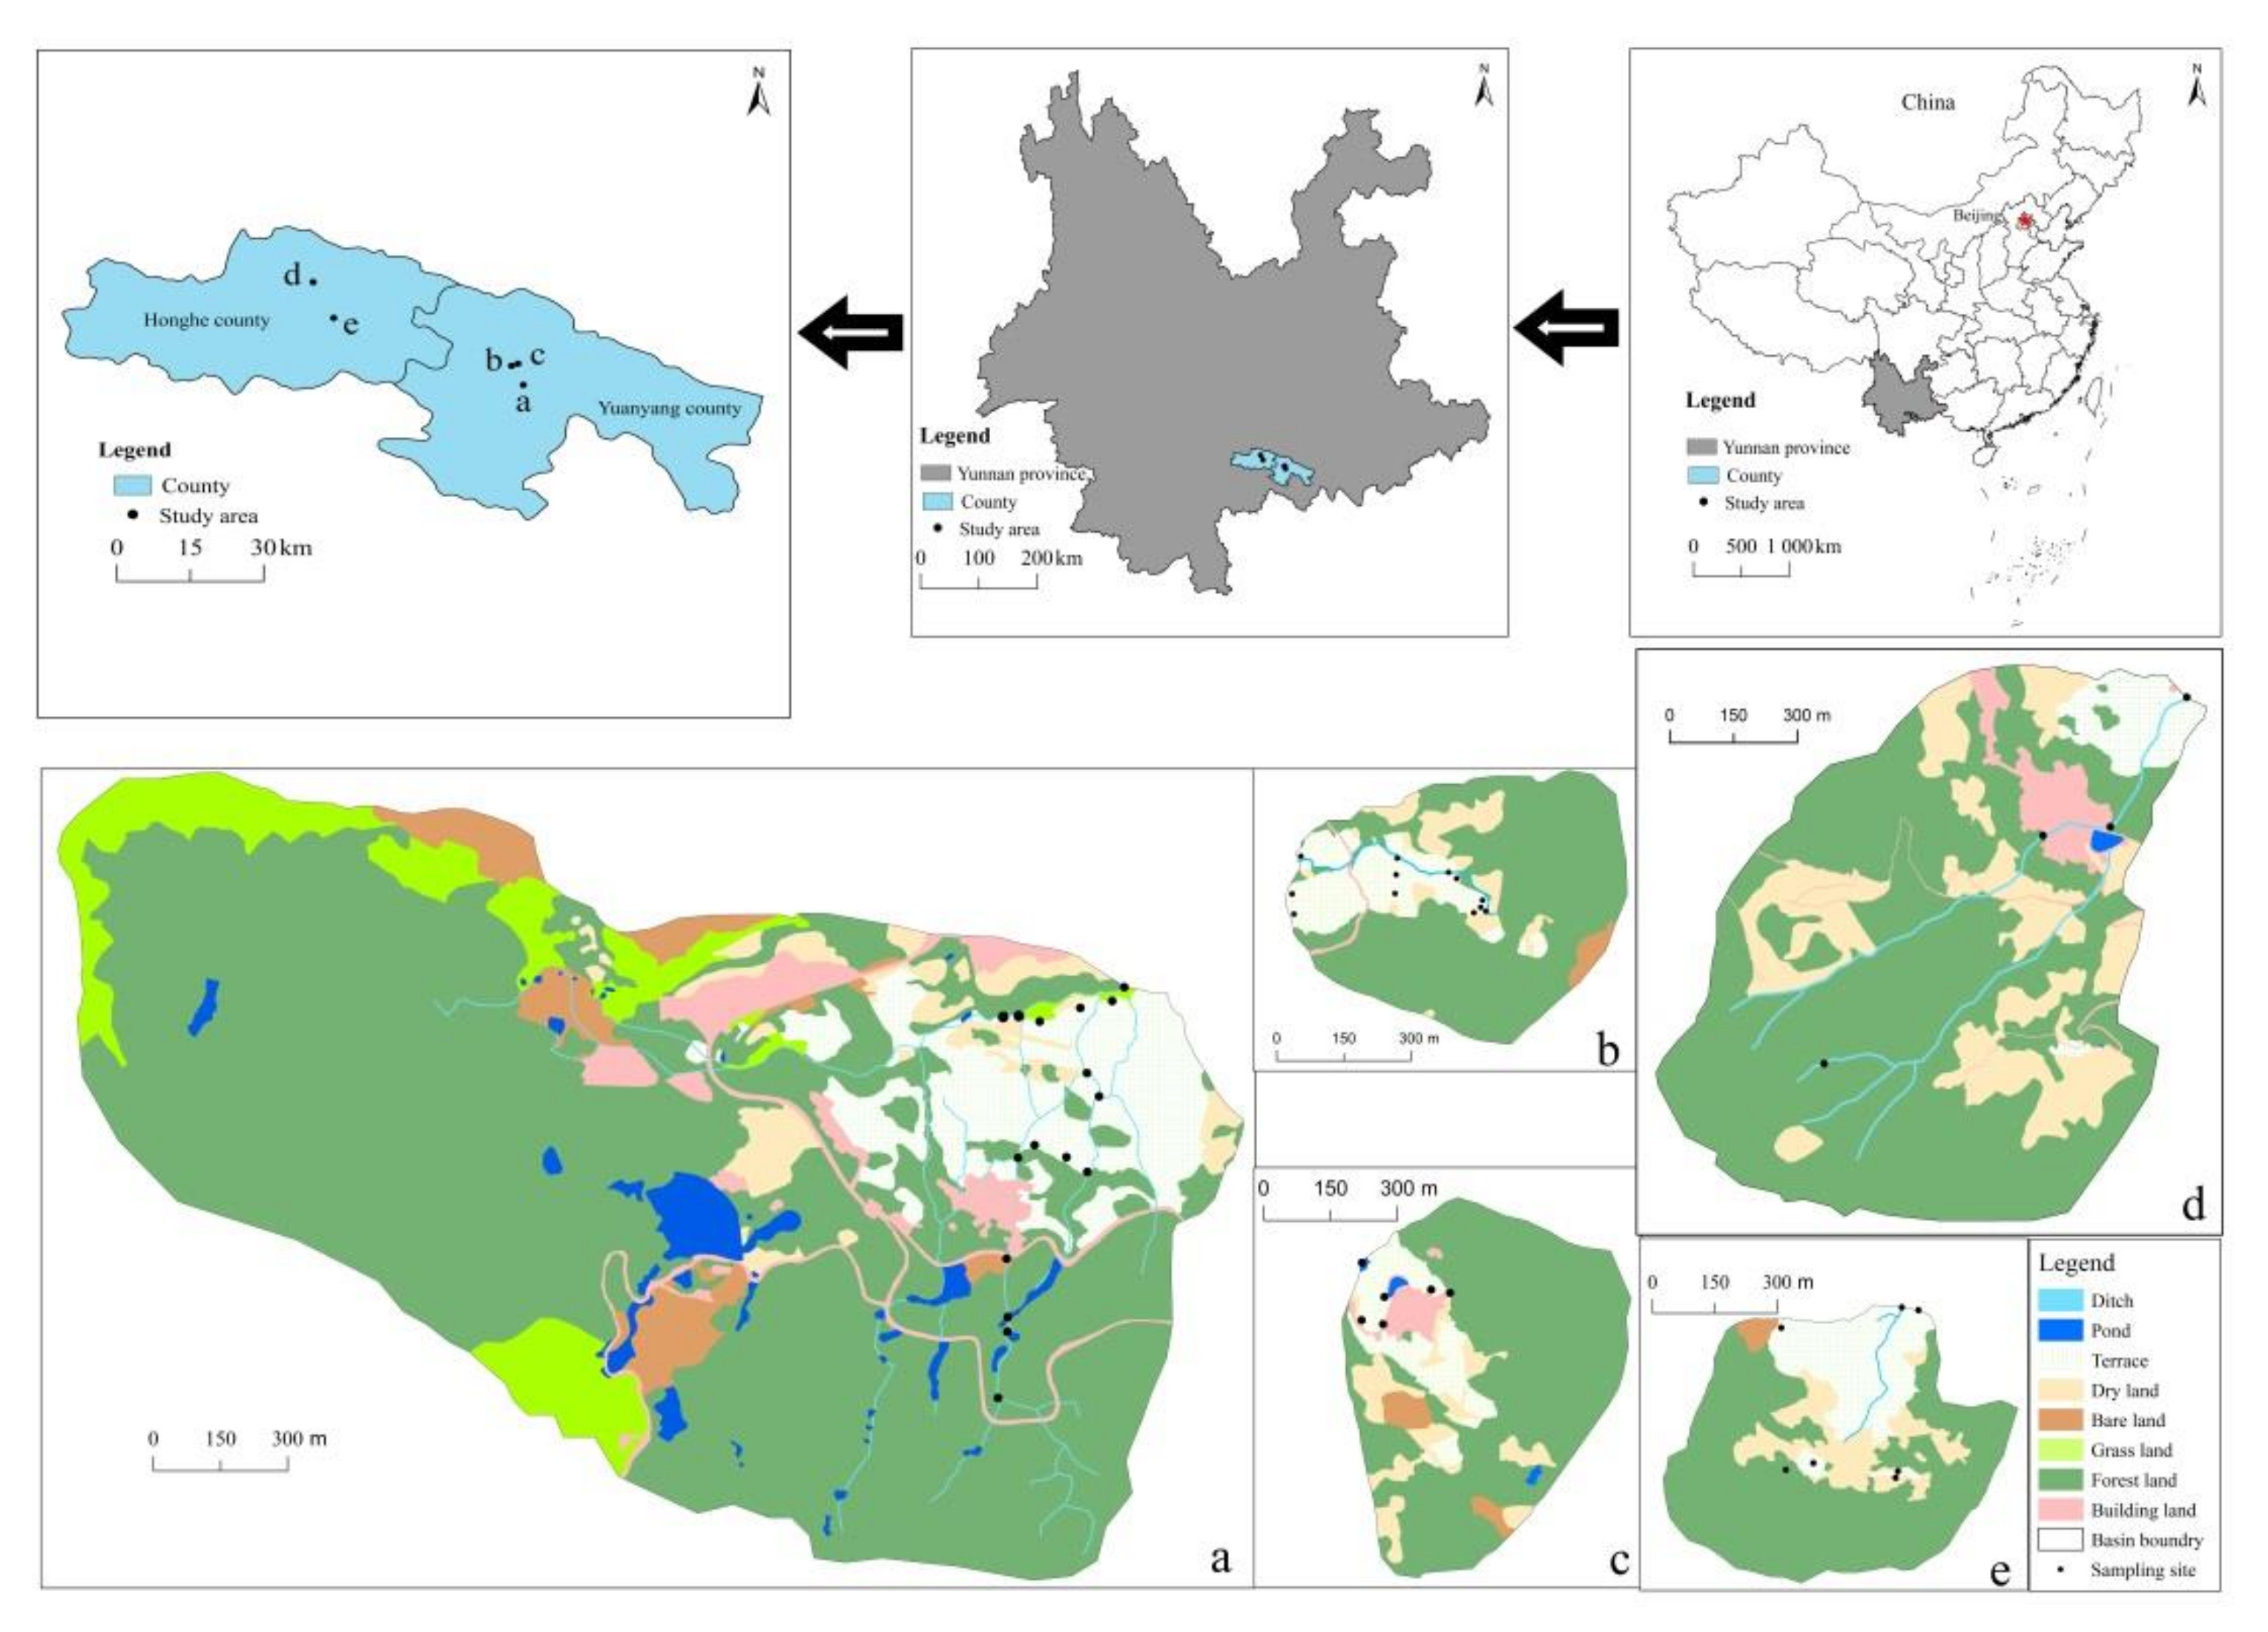
2. Study Area
3. Data and Methods
3.1. Water Sampling and Experimental Analysis
3.2. Classification of Source and Sink Landscapes
3.3. Weight of Source and Sink Landscapes by Nutrient Retention Rate
3.4. Normalization of the Three Factors and Construction of Lorenz Curves of Source and Sink Landscapes
3.5. Modification and Calculation of the Sink Location-Weighted Landscape Index
4. Results and Analysis
4.1. Area Characteristics of Source and Sink Landscapes
4.2. Spatial Distribution Characteristics of Source and Sink Landscapes Related to Relative Distance, Relative Elevation and Slope Gradient
4.3. Nutrient Retention Function of Sink Landscapes in the Five Watersheds Analyzed Based on the Sink Location-Weighted Landscape Index
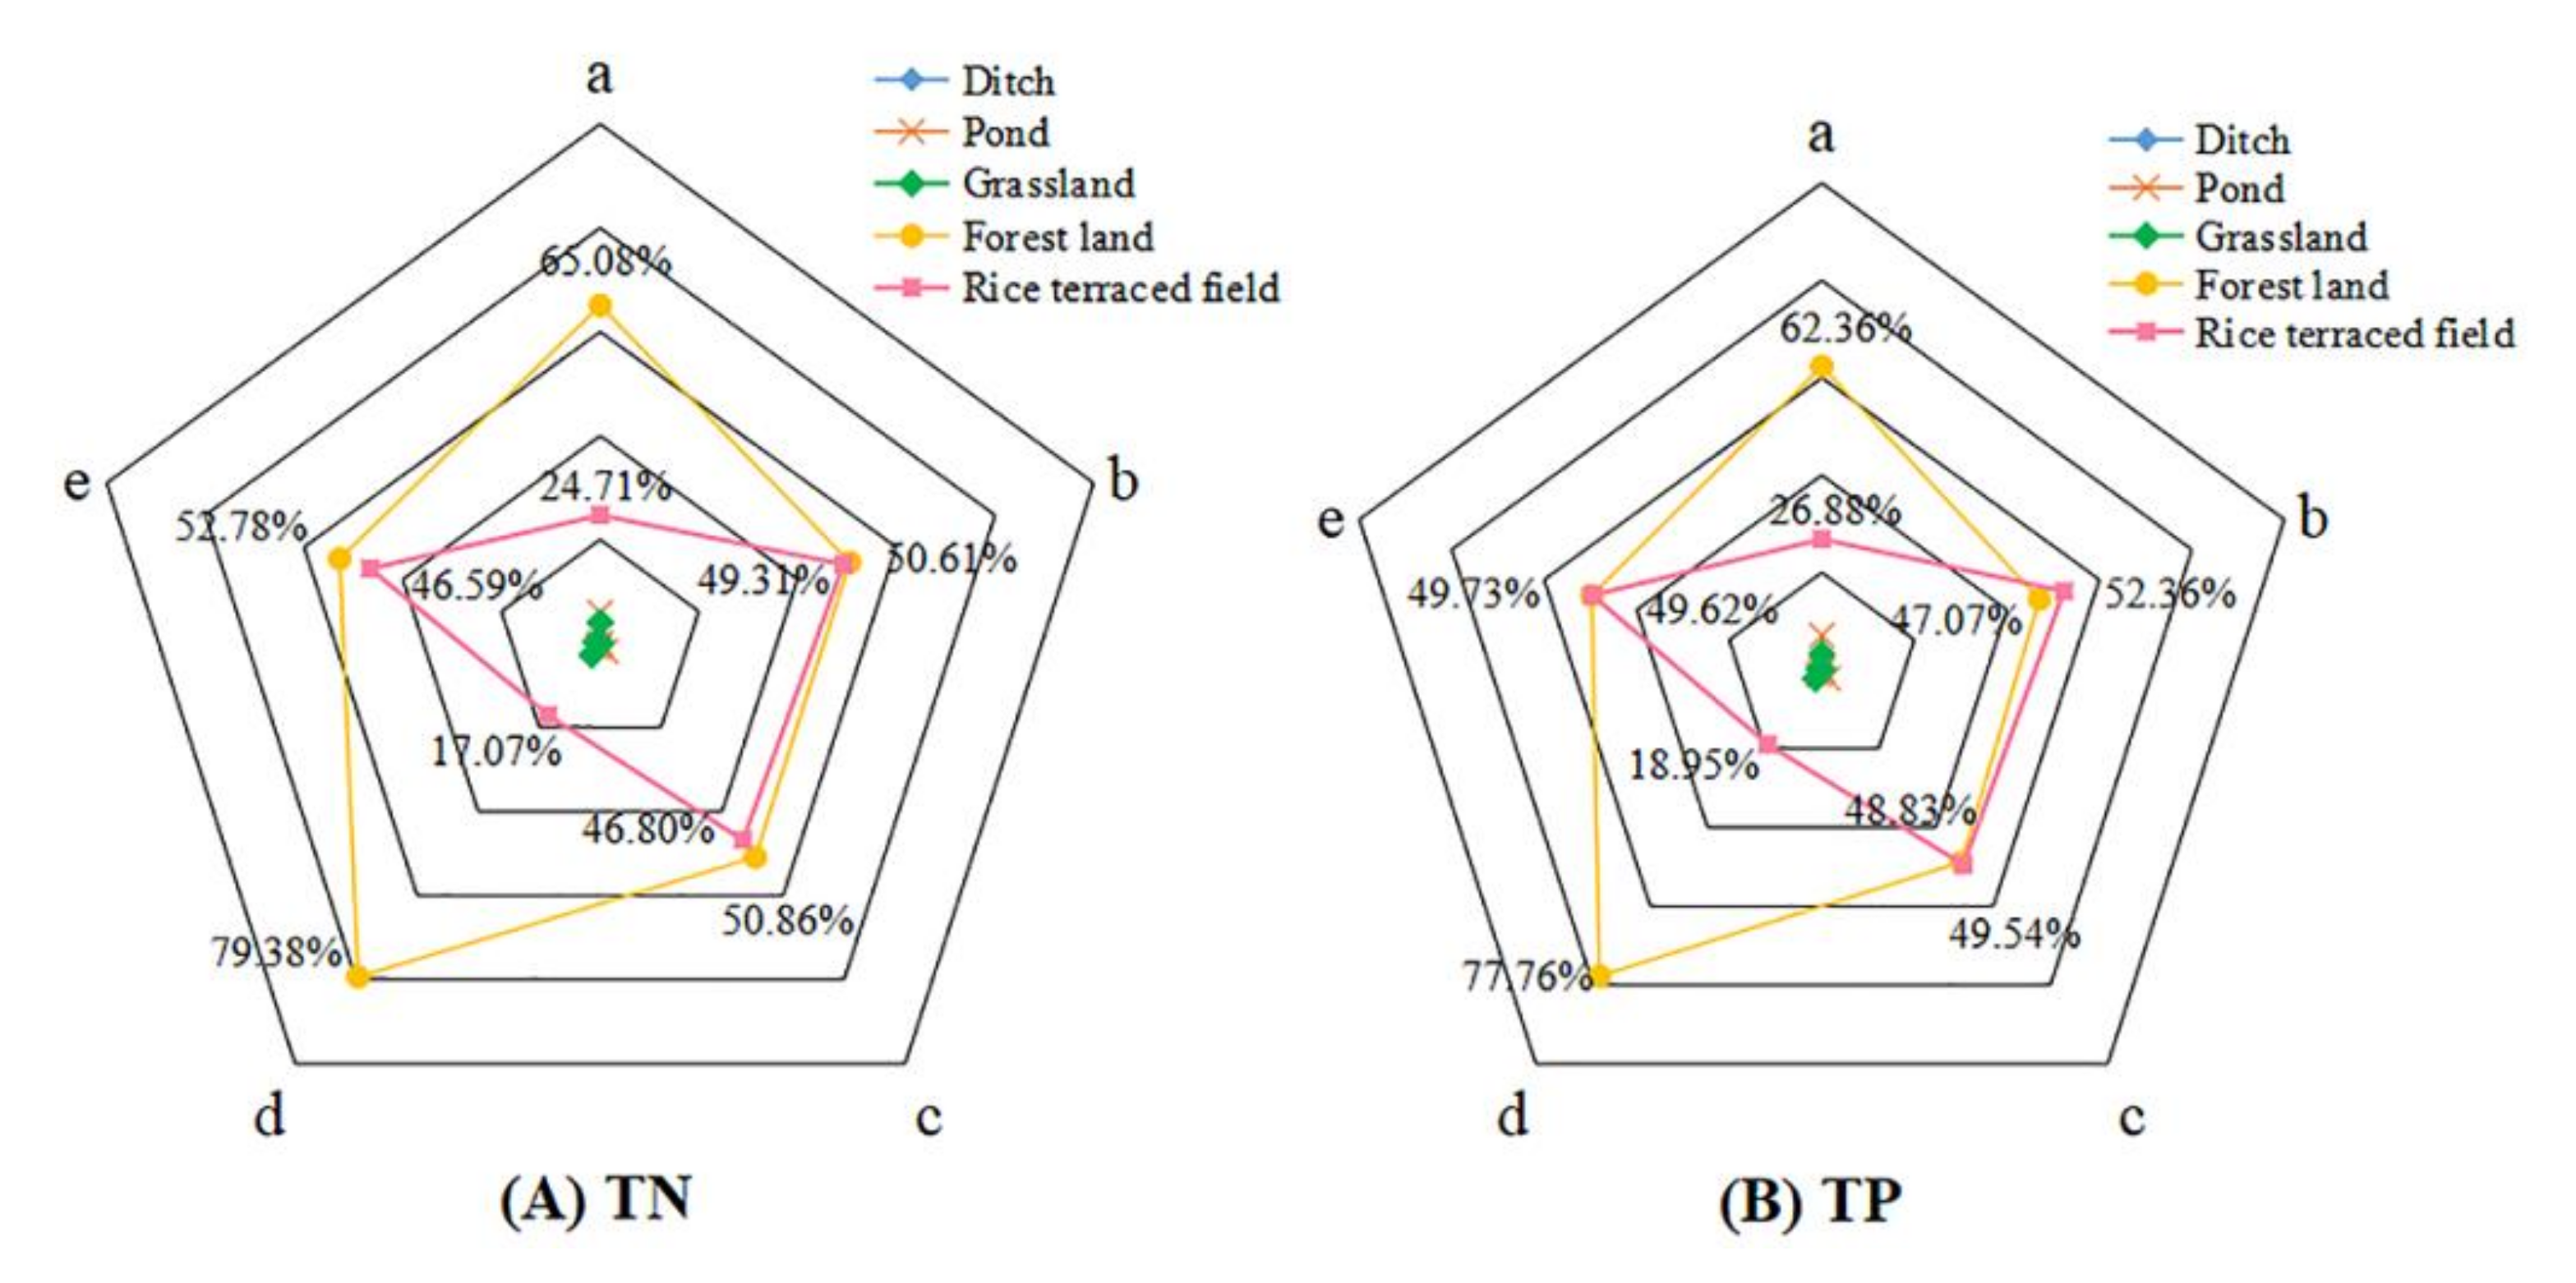
4.4. Contribution Rate of Different Sink Landscapes to Nutrient Retention
5. Discussion
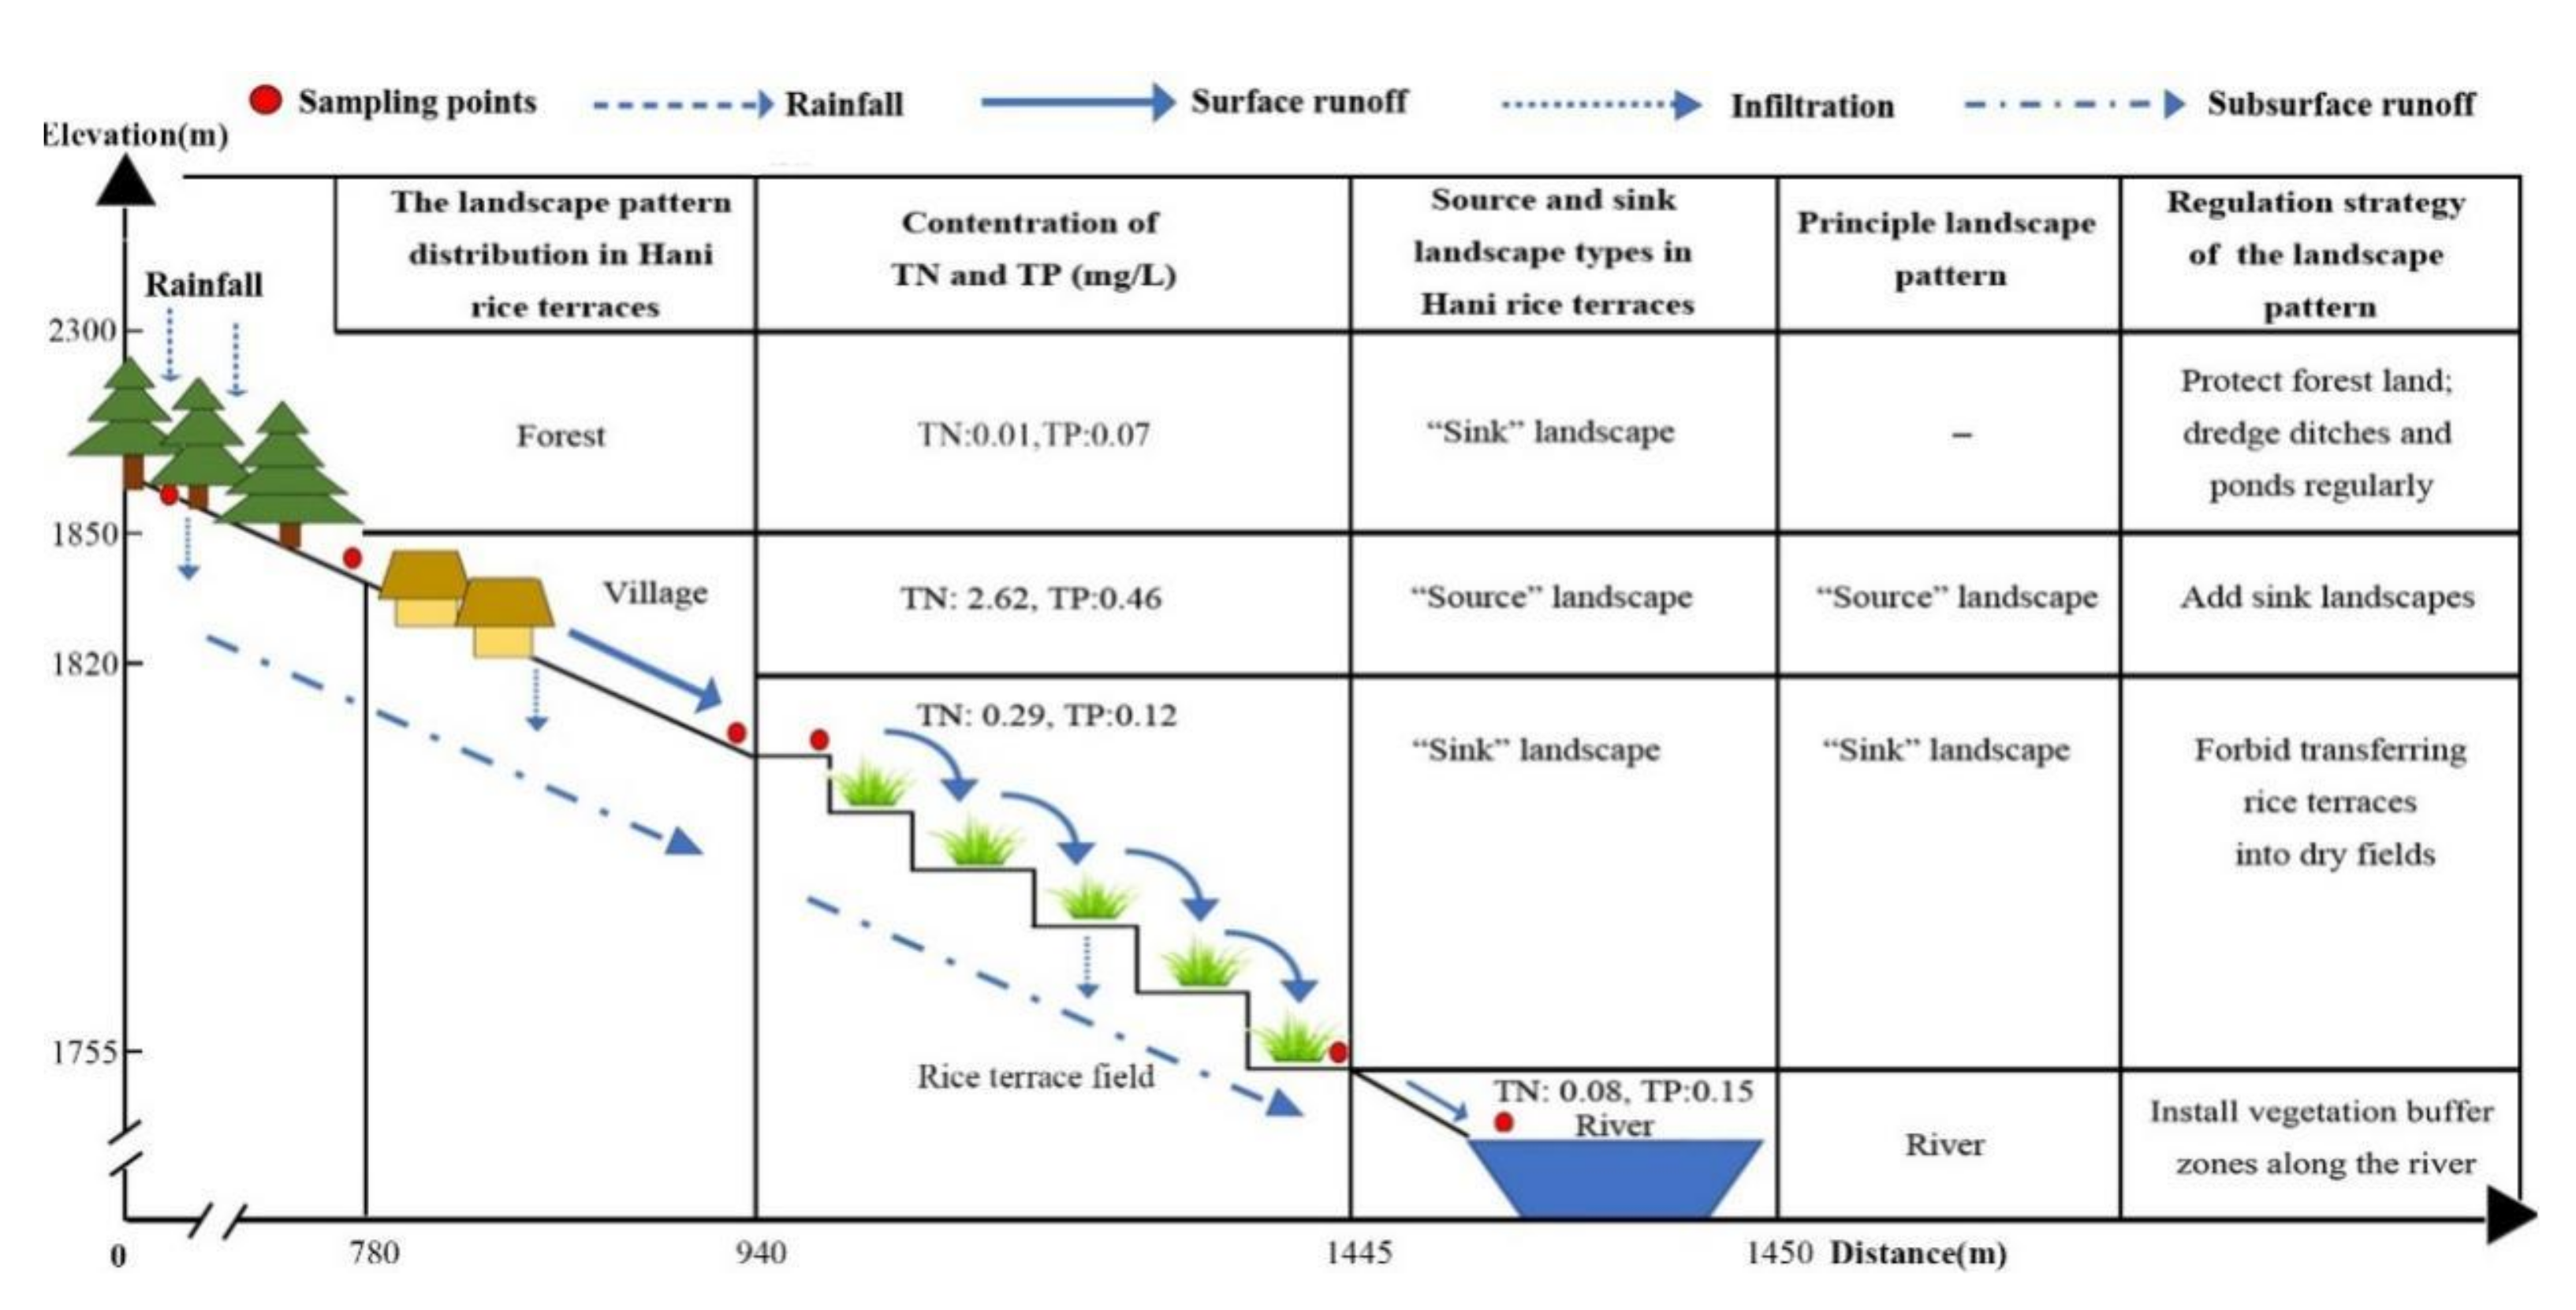
5.1. Effect of Vertical Landscape Patterns on Nutrient Transport and Optimization in the Hani Rice Terraces
5.2. Comparison of the Modified and Original Location-Weighted Landscape Index
5.3. Innovation, Limitations and Future Directions
6. Conclusions
Author Contributions
Funding
Institutional Review Board Statement
Data Availability Statement
Acknowledgments
Conflicts of Interest
References
- Xie, H.; Ringler, C. Agricultural nutrient loadings to the freshwater environment: The role of climate change and socioeconomic change. Environ. Res. Lett. 2017, 12, 104008. [Google Scholar]
- Exner-Kittridge, M.; Strauss, P.; Blöschl, G.; Eder, A.; Saracevic, E.; Zessner, M. The seasonal dynamics of the stream sources and input flow paths of water and nitrogen of an Austrian headwater agricultural catchment. Sci. Total Environ. 2016, 542, 935–945. [Google Scholar]
- Milledge, D.; Heathwaite, A.L.; Reaney, S.; Lane, S.N. SCIMAP: Modelling Diffuse Pollution in Large River Basins. In AGU Fall Meeting Abstracts; American Geophysical Union: Washington, DC, USA, 2009. [Google Scholar]
- Li, X.Z.; Mander, Ü.; Ma, Z.; Jia, Y. Water quality problems and potential for wetlands as treatment systems in the Yangtze River Delta, China. Wetlands 2009, 29, 1125–1132. [Google Scholar]
- Kroeze, C.; Gabbert, S.; Hofstra, N.; Koelmans, A.A.; Li, A.; Lohr, A.; Ludwig, F.; Strokal, M.; Verburg, C.; Vermeulen, L.; et al. Global modelling of surface water quality: A multi-pollutant approach. Curr. Opin. Environ. Sustain. 2016, 23, 35–45. [Google Scholar]
- Van Vliet MT, H.; Flörke, M.; Wada, Y. Quality matters for water scarcity. Nat. Geosci. 2017, 10, 800–802. [Google Scholar]
- Kronvang, B.; Græsbøll, P.; Larsen, S.E.; Svendsen, L.M.; Andersen, H.E. Diffuse nutrient losses in Denmark. Water Sci. Technol. 1996, 33, 81–88. [Google Scholar]
- Corwin, D.L.; Vaughan, P.J.; Loague, K. Modelling non-point source pollutants in the vadose zone using GIS. Environ. Sci. Technol. 1997, 31, 2157–2175. [Google Scholar]
- He, C.; Fu, B. Non-point source pollution control and management. Chin. J. Environ. Sci. 1998, 19, 87–91. [Google Scholar]
- Chen, L.D.; Tian, H.Y.; Fu, B.J.; Zhao, X.F. Development of a new index for integrating landscape patterns with ecological processes at watershed scale. Chin. Geogr. Sci. 2009, 19, 37–45. [Google Scholar]
- Huang, N.; Wang, H.Y.; Lin, T.; Liu, Q.M.; Huang, Y.F.; Li, J.X. Regulation framework of watershed landscape pattern for non-point source pollution control based on ‘source-sink’ theory: A case study in the watershed of Maluan Bay, Xiamen City, China. Chin. J. Appl. Ecol. 2016, 27, 3325–3334. (In Chinese) [Google Scholar]
- Cloern, J.E.; Foster, S.Q.; Kleckner, A.E. Phytoplankton primary production in the world’s estuarine-coastal ecosystems. Biogeosciences 2014, 11, 2477–2501. [Google Scholar]
- Mateo Sagasta, J.; Zadeh, S.M.; Turral, H. (Eds.) More People, More Food, Worse Water? A Global Review of Water Pollution from Agriculture; The Food and Agriculture Organization of the United Nations: Rome, Italy; International Water Management Institute on behalf of the Water Land and Ecosystems research program of the CGIAR: Colombo, Sri Lanka, 2018. [Google Scholar]
- Pérez-Gutiérrez, J.D.; Paz, J.O.; Tagert, M.L.M. Seasonal water quality changes in on-farm water storage systems in a south-central U.S. agricultural watershed. Agric. Water Manag. 2017, 187, 131–139. [Google Scholar]
- Mekonnen, M.; Lutter, S.; Martinez, A. Anthropogenic Nitrogen and Phosphorus Emissions and Related Grey Water Footprints Caused by EU-27′s Crop Production and Consumption. Water 2016, 8, 30. [Google Scholar]
- Stryjecki, R.; Zawal, A.; Stępień, E.; Buczyńska, E.; Buczyński, P.; Czachorowski, S.; Szenejko, M.; Śmietana, P. Water mites (Acari, Hydrachnidia) of water bodies of the Krąpiel River valley: Interactions in the spatial arrangement of a river valley. Limnology 2016, 17, 247–261. [Google Scholar]
- Zampella, R.A.; Procopio, N.A.; Lathrop, R.G.; Dow, C.L. Relationship of Land-Use/Land-Cover Patterns and Surface-Water Quality in The Mullica River Basin. JAWRA J. Am. Water Resour. Assoc. 2007, 43, 594–604. [Google Scholar]
- Valle Junior, R.F.; Varandas, S.G.P.; Fernandes, L.S.; Pacheco, F.A.L. Groundwater quality in rural watersheds with environmental Land-use conflicts. Sci. Total Environ. 2014, 493, 812–827. [Google Scholar]
- Pacheco, F.A.L.; Sanches Fernandes, L.F. Environmental land use conflicts in catchments: A major cause of amplified nitrate in river water. Sci. Total Environ. 2016, 548, 173–188. [Google Scholar]
- Shen, Z.; Hou, X.; Li, W.; Aini, G.; Chen, L.; Gong, Y. Impact of landscape pattern at multiple spatial scales on water quality: A case study in a typical urbanised watershed in China. Ecol. Indic. 2015, 48, 417–427. [Google Scholar]
- Zhou, T.; Wu, J.; Peng, S. Assessing the effects of landscape pattern on river water quality at multiple scales: A case study of the Dongjiang River watershed, China. Ecol. Indic. 2012, 23, 166–175. [Google Scholar]
- Shi, P.; Zhang, Y.; Li, Z.; Li, P.; Xu, G. Influence of land use and land cover patterns on seasonal water quality at multi-spatial scales. Catena 2017, 151, 182–190. [Google Scholar]
- Li, K.; Chi, G.; Wang, L.; Xie, Y.; Wang, X.; Fan, Z. Identifying the critical riparian buffer zone with the strongest linkage between landscape characteristics and surface water quality. Ecol. Indic. 2018, 93, 741–752. [Google Scholar]
- Xu, G.; Li, P.; Lu, K.; Tantai, Z.; Zhang, J.; Ren, Z.; Wang, X.; Yu, K.; Shi, P.; Cheng, Y. Seasonal changes in water quality and its main influencing factors in the Dan River basin. Catena 2019, 173, 131–140. [Google Scholar]
- De Mello, K.; Randhir, T.O.; Valente, R.A.; Vettorazzi, C.A. Riparian restoration for protecting water quality in tropical agricultural watersheds. Ecol. Eng. 2017, 108, 514–524. [Google Scholar]
- Ouyang, W.; Skidmore, A.K.; Toxopeus, A.G.; Hao, F.H. Long-term vegetation landscape pattern with non-point source nutrient pollution in upper stream of Yellow River basin. J. Hydrol. 2010, 389, 373–380. [Google Scholar]
- Li, H.; Wu, J. Use and misuse of landscape indices. Landsc. Ecol. 2004, 19, 389–399. [Google Scholar]
- O’Neill, R.V.; Krummel, J.R.; Gardner, R.E.A.; Sugihara, G.; Jackson, B.; DeAngelis, D.L.; Milne, B.T.; Turner, M.G.; Zygmunt, B.; Christensen, S.W.; et al. Indices of landscape pattern. Landsc. Ecol. 1988, 1, 153–162. [Google Scholar]
- Turner, M.G. Landscape Ecology: The Effect of Pattern on Process. Annu. Rev. Ecol. Evol. Syst. 1989, 20, 171–197. [Google Scholar]
- Ji, D.Q.; Wen, Y.; Wei, J.B.; Wu, Z.F.; Liu, Q.; Cheng, J. Relationships between landscape spatial characteristics and surface water quality in the Liu Xi river watershed. Acta Ecol. Sin. 2015, 35, 246–253. (In Chinese) [Google Scholar]
- Sawyer, J.A.; Stewart, P.M.; Mullen, M.M.; Simon, T.P.; Bennett, H.H. Influence of habitat, water quality, and land use on macro-invertebrate and fish assemblages of a southeastern coastal plain watershed, usa. Aquat. Ecosyst. Health Manag. 2004, 7, 85–99. [Google Scholar]
- Teixeira, Z.; Marques, J.C. Relating landscape to stream nitrate-N levels in a coastal eastern-Atlantic watershed (Portugal). Ecol. Indic. 2016, 61, 693–706. [Google Scholar]
- Wang, Y.; Chen, L.; Gao, Y.; Chen, S.; Chen, W.; Hao, Z.; Jia, J.; Han, N. Geochemical isotopic composition in the Loess Plateau and corresponding source analyses: A case study of China’s Yangjuangou catchment. Sci. Total Environ. 2017, 581–582, 794–800. [Google Scholar]
- McGarigal, K.; Cushman, S.; Ene, E. FRAGSTATS v4: Spatial Pattern Analysis Program for Categorical and Continuous Maps; University of Massachusetts: Amherst, MA, USA, 2012. [Google Scholar]
- Cushman, S.A.; McGarigal, K.; Neel, M.C. Parsimony in landscape metrics: Strength, universality, and consistency. Ecol. Indic. 2008, 8, 691–703. [Google Scholar]
- Kupfer, J.A. Landscape ecology and biogeography Rethinking landscape metrics in apost-FRAGSTATS landscape. Prog. Phys. Geogr. 2012, 36, 400–420. [Google Scholar]
- Sun, R.; Xie, W.; Chen, L. A landscape connectivity model to quantify contributions of heat sources and sinks in urban regions. Landsc. Urban Plan. 2018, 178, 43–50. [Google Scholar]
- Chen, L.D.; Sun, R.H.; Lu, Y.H. A conceptual model for a process-oriented landscape pattern analysis. Sci. China: Earth Sci. 2019, 62, 2050–2057. [Google Scholar] [CrossRef]
- Cheng, H.F.; Hu, Y.A.; Zhao, J.F. Meeting China’s water shortage crisis: Current practices and challenges. Environ. Sci. Technol. 2009, 43, 240–244. [Google Scholar]
- Hu, L.; Monaghan, A.; Voogt, J.A.; Barlage, M. A first satellite-based observational assessment of urban thermal anisotropy. Remote Sens. Environ. 2016, 181, 111–121. [Google Scholar]
- Chen, A.; Zhao, X.; Yao, L.; Chen, L. Application of a new integrated landscape index to predict potential urban heat islands. Ecol. Indic. 2016, 69, 828–835. [Google Scholar]
- Wu, Z.; Lin, C.; Su, Z.; Zhou, S.; Zhou, H. Multiple landscape “source–sink” structures for the monitoring and management of non-point source organic carbon loss in a peri-urban watershed. Catena 2016, 145, 15–29. [Google Scholar]
- Hansen, A.J. Contribution of source-sink theory to protected area science. In Sources, Sinks, and Sustainability across Landscapes; Lui, J., Hull, V., Morzillo, A., Wiens, J.J., Eds.; Cambridge University Press: New York, NY, USA, 2011. [Google Scholar]
- Yang, M.; Li, X.; Hu, Y.; He, X. Assessing effects of landscape pattern on sediment yield using sediment delivery distributed model and a landscape indicator. Ecol. Indic. 2012, 22, 38–52. [Google Scholar]
- Edwards, E.C.; Null, S.E. The cost of addressing saline lake level decline and the potential for water conservation markets. Sci. Total Environ. 2019, 651, 435–442. [Google Scholar]
- Li, H.F.; Wei, W.; Chen, J.; Li, X.C.; Zhang, B.L. Research on soil erosion based on Location-weighted landscape index (LWLI) in Guanchuanhe River basin, Dingxi, Gansu Province. Chin. J. Acta Ecol. Sin. 2013, 33, 4460–4467. (In Chinese) [Google Scholar]
- Zhou, Z.X.; Li, J. The correlation analysis on the landscape pattern index and hydrological processes in the Yanhe watershed, China. J. Hydrol. 2015, 524, 417–426. [Google Scholar]
- Chen, L.D. Source-Sink Landscape Pattern Analysis and Its Application. Science Press: Beijing, China, 2016; pp. 15–25. (In Chinese) [Google Scholar]
- Jiao, Y.M.; Zhang, G.; Wang, Y. The temporal-spatial changes of nutrients in surface water of the Hani rice terraces landscape. Chin. J. Ecol. 2009, 29, 1787–1793. (In Chinese) [Google Scholar]
- Zha, Z.Q.; Jiao, Y.M.; Liu, Z.L.; Liu, C.J.; Gao, X.; Ding, Y.P.; Zhao, D.M. Evaluation on water eutrophication and retention effect in wetland landscape of Hani Rice Terraces. Chin. J. Ecol. 2018, 37, 3413–3421. [Google Scholar] [CrossRef]
- Chen, L.D.; Fu, B.J.; Xu, J.; Gong, J. Location-weighted landscape contrast index: A scale independent approach for landscape pattern evaluation based on source-sink ecological processes. Acta Ecol. Sin. 2003, 23, 2406–2413. (In Chinese) [Google Scholar]
- Chen, L.D.; Fu, B.; Zhao, W. Source sink landscape theory and its ecological significance. Front. Biol. China 2008, 3, 131–136. [Google Scholar]
- Yao, M.; Cui, B.S. The vertical characteristics of ecosystem of Hani’ s terrace paddyfield in Yunnan, China. Acta Eco-Log. Sin. 2006, 26, 2115–2124. (In Chinese) [Google Scholar]
- Wang, X.; Qiao, B.; Li, S.; Li, J.; Ren, B. Studies on the interception effects of ecological ditch on nitrogen and phosphorus in the rainfall runoff of different rice growth period. Shuili Xuebao 2015, 46, 1406–1413. (In Chinese) [Google Scholar]
- Wang, X.; Li, J.; Li, S.; Zheng, X.; Zhang, F. Study on the interception effects of ecological pond on Nitrogen and Phosphorus in the rainfall runoff of rice field. Shuili Xuebao 2017, 48, 291–298. (In Chinese) [Google Scholar]
- Yang, Y.; Chen, Y.; Zhang, X.; Ongley, E.; Zhao, L. Methodology for agricultural and rural NPS pollution in a typical county of the North China Plain. Environ. Pollut. 2012, 168, 170–176. [Google Scholar]
- Jiang, M.; Chen, H.; Chen, Q. A method to analyze “source–sink” structure of non-point source pollution based on remote sensing technology. Environ. Pollut. 2013, 182, 135–140. [Google Scholar]
- Wang, Y.; Yang, J.; Liang, J.; Qiang, Y.; Fang, S.; Gao, M.; Fan, X.; Yang, G.; Zhang, B.; Feng, Y. Analysis of the environmental behavior of farmers for non-point source pollution control and management in a water source protection area in China. Sci. Total Environ. 2018, 633, 1126–1135. [Google Scholar]
- Wang, J.; Shao, J.A.; Wang, D.; Ni, J.; Xie, D. Identification of the “source” and “sink” patterns influencing non-point source pollution in the Three Gorges Reservoir Area. J. Geogr. Sci. 2016, 26, 1431–1448. [Google Scholar]
- Wu, J.; Zeng, H.; Yu, H.; Ma, L.; Xu, L.; Qin, B. Water and Sediment Quality in Lakes along the Middle and Lower Reaches of the Yangtze River, China. Water Resour. Manag. 2012, 26, 3601–3618. [Google Scholar]


| Watersheds | Area/km2 | Elevation/m | Slope | Number of Sample Sites | Landscape Components |
|---|---|---|---|---|---|
| a | 2.95 | 1740–2028 | 0.0–45.4 | 16 | Forest-village-terraces-river |
| b | 0.34 | 1624–1864 | 0.0–52.1 | 12 | Forest-terraces-river |
| c | 0.39 | 1667–1880 | 0.0–56.2 | 6 | Forest-village-terraces-river |
| d | 1.11 | 1763–2375 | 0.5–59.2 | 4 | Forest-village-terraces-river |
| e | 0.39 | 1810–2010 | 0.9–35.9 | 7 | Forest-terraces-river |
| Landscape Type | Land Use Type | Weight of TN | Weight of TP | Reference |
|---|---|---|---|---|
| Source landscape | Rural residential land | 1.00 | 1.00 | [10] |
| Bare land | 0.50 | 0.40 | [48] | |
| Dry land | 0.40 | 0.30 | ||
| Terraced rice field | 0.10 | 0.18 | This work, retention rate | |
| Sink landscape | Terraced rice field | 0.90 | 0.82 | This work, retention rate |
| Ditch | 1.00 | 1.00 | ||
| Pond | 1.00 | 0.81 | ||
| Grassland | 0.30 | 0.20 | ||
| Forest land | 0.50 | 0.40 |
| Factor | 0 | 0.5 | 1 |
|---|---|---|---|
| Relative distance | Close | Middle | Far |
| Relative elevation | Low | Middle | High |
| Slope gradient | Shallow | Middle | Steep |
| Source or Sink Landscape | Land-Use Types | Watershed | ||||
|---|---|---|---|---|---|---|
| a | b | c | d | e | ||
| Source | Rural residential land | 4.74 | 0.84 | 3.61 | 5.11 | - |
| Bare land | 4.02 | 1.77 | 2.87 | - | - | |
| Dry land | 3.61 | 9.21 | 10.84 | 15.62 | 13.74 | |
| SUM | 12.37 | 11.82 | 17.32 | 20.73 | 13.74 | |
| Sink | Pond | 2.57 | - | 0.60 | 0.23 | - |
| Ditch | 0.29 | 0.10 | - | 0.18 | 0.07 | |
| Forest land | 67.47 | 69.73 | 69.58 | 69.24 | 64.59 | |
| Grassland | 8.35 | - | - | 4.80 | 1.32 | |
| SUM | 78.68 | 69.83 | 70.18 | 74.44 | 65.98 | |
| Source–sink integrated landscape | Terraced rice field | 8.95 | 18.35 | 12.50 | 4.82 | 20.28 |
| Land Use Types | Landscape Factors | ||
|---|---|---|---|
| Relative Distance (Min–Max) Mean | Relative Elevation (Min–Max) Mean | Slope Gradient (Min–Max) Mean | |
| Rural residential land | (64.40–80.55) 71.41 | (67.71–81.97) 77.28 | (54.48–93.66) 78.28 |
| Bare land | (6.59–49.34) 30.56 | (6.59–60.61) 37.11 | (72.16–81.60) 77.31 |
| Dry land | (42.57–77.73) 56.13 | (51.00–71.63) 59.04 | (49.98–78.27) 66.72 |
| Rice terraced field | (76.61–91.42) 82.94 | (73.19–91.36) 79.71 | (60.61–81.05) 68.40 |
| Ditch | (45.89–77.43) 65.60 | (53.24–87.59) 68.47 | (57.64–81.63) 70.39 |
| Pond | (60.19–92.88) 68.22 | (46.89–92.31) 69.53 | (81.06–85.14) 83.74 |
| Grassland | (30.30–49.67) 38.13 | (26.29–49.67) 40.30 | (56.09–88.06) 74.14 |
| Forest land | (37.24–43.61) 39.33 | (25.92–46.92) 37.40 | (54.37–83.27) 70.33 |
| LWLI Value Range: [0, 1] | SLWLI Value Range: [0, 1] | |||||
|---|---|---|---|---|---|---|
| Range | >0.5 | <0.5 | =0.5 | >0.5 | <0.5 | =0.5 |
| The dominant landscape | Source landscape | Sink landscape | Source–sink is balanced | Sink landscape | Source landscape | Source–sink is balanced |
| Environment effect | Pollution | Interception effect | Balanced | Interception effect | Pollution | Balanced |
| Applicability | Evaluate the landscape pattern and the contribution of source landscape load | Evaluate the landscape pattern and the nutrient interception function of sink landscapes | ||||
| Landscape Type | Land Use Type | Chen | Zhou | Wang | Li | Sun | Jiang | |
|---|---|---|---|---|---|---|---|---|
| N | P | |||||||
| Source | Dry field | 0.8 | - | 0.6 | 0.3 | 0.6 | 0.09 | 0.06 |
| Paddy field | 0.8 | - | 0.8 | 0.8 | 0.14 | 0.09 | ||
| Rural residential area | 1 | 1 | 0.4 | 0.2 | 1 | 0.64 | 0.32 | |
| Sink | Woodland | 0.8 | 0.8 | - | 0.05 | 0.8 | 0.38 | 0.22 |
| Grassland | 0.5 | 0.6 | - | 0.15 | 0.6 | 0.31 | 0.18 | |
| Water or river | - | - | 0.4 | 0 | - | 0.08 | 0.13 | |
Publisher’s Note: MDPI stays neutral with regard to jurisdictional claims in published maps and institutional affiliations. |
© 2022 by the authors. Licensee MDPI, Basel, Switzerland. This article is an open access article distributed under the terms and conditions of the Creative Commons Attribution (CC BY) license (https://creativecommons.org/licenses/by/4.0/).
Share and Cite
Jiao, Y.; Zha, Z.; Xu, Q. A Modified Location-Weighted Landscape Index to Evaluate Nutrient Retention in Agricultural Wetlands: A Case Study of the Honghe Hani Rice Terraces World Heritage Site. Agriculture 2022, 12, 1480. https://doi.org/10.3390/agriculture12091480
Jiao Y, Zha Z, Xu Q. A Modified Location-Weighted Landscape Index to Evaluate Nutrient Retention in Agricultural Wetlands: A Case Study of the Honghe Hani Rice Terraces World Heritage Site. Agriculture. 2022; 12(9):1480. https://doi.org/10.3390/agriculture12091480
Chicago/Turabian StyleJiao, Yuanmei, Zhiqin Zha, and Qiue Xu. 2022. "A Modified Location-Weighted Landscape Index to Evaluate Nutrient Retention in Agricultural Wetlands: A Case Study of the Honghe Hani Rice Terraces World Heritage Site" Agriculture 12, no. 9: 1480. https://doi.org/10.3390/agriculture12091480
APA StyleJiao, Y., Zha, Z., & Xu, Q. (2022). A Modified Location-Weighted Landscape Index to Evaluate Nutrient Retention in Agricultural Wetlands: A Case Study of the Honghe Hani Rice Terraces World Heritage Site. Agriculture, 12(9), 1480. https://doi.org/10.3390/agriculture12091480