Article

GIS-Based Evaluation of Soil Suitability for Optimized Production on U.S. Tribal Lands

by
Harrison W. Smith
1,
Amanda J. Ashworth
2,* and
Phillip R. Owens
3
1
Environmental Dynamics Program, University of Arkansas, Fayetteville, AR 72701, USA
2
Poultry Production and Product Safety Research Unit, USDA-ARS, 1260 W. Maple St., Fayetteville, AR 72701, USA
3
Dale Bumpers Small Farms Research Center, USDA-ARS, 6883 S. Hwy 23, Booneville, AR 72927, USA
*
Author to whom correspondence should be addressed.
Agriculture 2022, 12(9), 1307; https://doi.org/10.3390/agriculture12091307
Submission received: 2 August 2022 / Revised: 20 August 2022 / Accepted: 21 August 2022 / Published: 25 August 2022
(This article belongs to the Special Issue Agriculture: 10th Anniversary)

Abstract

:
Optimizing soil—crop—landscape occurrence is essential for sustainable intensification and food security, but little work has been done to evaluate these parameters on Tribal lands. The objective of this study was to develop first ever high-resolution crop suitability maps and compare two established crop suitability models for their ability to optimize soil resource management of the Quapaw Tribal lands. We built on previously developed continuous soil properties maps for 22,880 ha of Quapaw Tribal lands that used a digital elevation model and a fuzzy-logic based data mining approach to calculate and evaluate the Dideriksen and Storie crop suitability indices. Suitability index results were evaluated against observed yield (n ≥ 130,000) within the study area. Results showed that the observed yield was positively correlated with the Storie suitability index (Spearman rho = 0.16, p < 0.01), but not the Dideriksen index, suggesting the Storie index is more appropriate than the Dideriksen for modeling crop suitability in this area. Additionally, very little (<13%) of the highly suitable soils in the Quapaw Tribal lands are currently used for crop production, suggesting potential yield gaps from the underutilization of highly suitable soils. Future research could improve estimates through the development of novel suitability indices for closing yield gaps and further improved sustainable intensification.

Graphical Abstract

1. Introduction

Crop suitability indices are novel management tools for identifying the optimum agricultural production areas at the farm, Tribal, or regional levels, and are an important step for sustainable intensification. However, little work has been done to develop crop suitability indices via high-resolution digital soil mapping approaches, particularly for Tribal nations. Such landscape-specific crop suitability indexing would facilitate sustainable land use [1], aid in matching crops with soils [2], and identify areas in landscapes in need of soil conservation [3]. Current numerical methods of determining land suitability are inaccurate because of their inability to identify interactions among landscape attributes [2], although integration of GIS tools with multicriteria evaluations may help improve decision making. Further, Tribal reservations have basic soil information and limited access to conservation programs provided to other producers in the U.S. [4]. High-resolution maps in these areas can provide timely soil information that will help optimize soil resource management for sustainable intensification, soil conservation, and climate change adaptation.
In this study, we applied two well-established parametric crop suitability models, the Dideriksen [5] and Storie [6] suitability indices, using geographic information system (GIS)-based soil-mapping procedures. The main goal of this study is to assess the utility of these off-the-shelf crop suitability indices for enhancing agricultural management on Quapaw Tribal lands. The Dideriksen index was originally developed for corn (Zea mays L.) yield estimation in Indiana and was later used by the state of Indiana to account for soil variation in a soil-based differential tax assessment system [7]. The Storie index was developed for rating soils based on the characteristics that govern the productive capacity, and was originally developed for California soils, but has been widely replicated in many parts of the world for soil suitability assessments [8,9,10]. These models are particularly useful for this area because they can be calculated using both publicly available and site-specific spatial soil data.
An array of multivariate and GIS-based crop suitability approaches has been conducted to try to close yield gaps. Previous work was performed using a GIS-based framework for the zoning of land suitability for grassland conservation in the Central Valleys of Chihuahua, México, and found that the integration of GIS with multicriteria evaluation techniques with weighted overlay was useful for the evaluation of crop suitability and targeted conservation [3]. Other studies [11] brought in socio-economic factors in analytical hierarchy processes to assign weights for each criterion to develop the overall suitability for each crop in the region. From this work, authors revealed that most of the existing crops in the Bundelkhand region of India were either moderately or marginally suitable for cultivation. Such work is the basis for the optimum utilization of available resources and for sustainable agricultural production [12].
To date, no work has been done to assess soil suitability or to match crops and soils across the agro-landscapes on the Quapaw Tribal lands. Recently, researchers used fuzzy-logic based digital soil-mapping approaches to develop the first ever high-resolution spatial soil information of the Quapaw Tribal lands [4]. However, there remains a need for the development of interpretations of this new soil data to enable it to be used for land planning and management. Parametric suitability models such as Storie and Dideriksen are a widely used and straightforward way to apply spatial soil information for agricultural planning. Consequently, these models represent an ideal starting point from which to translate newly developed spatial soil information into a useable product for farmers and land managers. The objectives of this study are, therefore, to (i) integrate continuous soil properties maps generated using a digital soil-mapping approach with established soil suitability models, and (ii) to compare results from the suitability models to observed yields to identify potential yield gaps and model appropriateness.

2. Materials and Methods

2.1. Study Area

Quapaw Tribal lands are located in northeast Ottawa County, Oklahoma and consist of 22,880 ha, of which, approximately 24% is cropland. The remaining 76% is forest, grassland, wetland, or urban areas [13]. The Quapaw Nation is the only U.S. tribe responsible for the cleanup of a Superfund site, with 4 M tonnes out of the 75 M (~6%) source materials removed to date. Spatial soil information for the Quapaw Tribal lands is currently very limited through the soil survey geographic database (SSURGO), with only 3 of the 25 mapped soil series covering 56% of the study area. No pedons have been sampled by the U.S. Soil Survey within the reservation’s 22,880 ha boundary [14].

2.2. Continuous Soil Map Development on Tribal Lands

A stepwise process occurred to develop continuous soil property maps [4,15]. Briefly, (1) gridded SSURGO data was disaggregated to develop a parent material (PM) map; (2) then, a 3-m resolution light detection and ranging (LiDAR)-based digital elevation model (DEM) was developed to determine terrain attributes; (3) followed by k-means clustering to develop generic soil classes developed within each PM; and, (4) fuzzy logic was then carried out to develop unique property predictions for each pixel within the area.
Novel continuous soil property data generated as inputs for this study included PM, base saturation, organic matter content, slope, and soil texture. Since not all soil properties needed as inputs for the Storie and Dideriksen models could be generated using the methods described above, the remaining soil input values necessary for suitability modeling (i.e., soil depth, soil drainage, erosion, and fragipans) were derived from SSURGO. Continuous soil properties and suitability indices were not calculated for approximately 34 km2 (14%) of the study area, due to the presence of mining wastes. The two crop suitability models (Dideriksen and Storie) are next described in detail.

2.3. Crop Suitability Modeling

2.3.1. Dideriksen Model

There are 14 soil characteristics included in the Dideriksen model that are considered to have either beneficial or detrimental effects on yield (Supplemental Table S1). If the effects are beneficial, then yield is added, and if the effects are detrimental, yields are reduced. In the original implementation of the model, the modeled effects of the soil characteristics on corn yield are summed and divided by 9101 kg·ha−1, which represents the modeled yield for the Miami soil mapping unit, which is considered to be the average corn producing soil for the state of Indiana. Since this study was carried out in Oklahoma, we instead divided the summed values by 8122 kg ha−1, which represents the 5-year average of Oklahoma corn yields from 2015 to 2019 [16].

2.3.2. Storie Model

The Storie index rates soils based on soil profile, surface texture, slope, drainage, alkali content, nutrient levels, erosion, and microrelief characteristics. Each factor is rated on a percent basis, with 100% representing the most favorable condition for a given soil factor. All percentage values for the factors are then multiplied in order to calculate the Storie index value for a given area of soil [6].

2.4. Crop Suitability Model Assessment

To assess the accuracy of the modeled index results, the results from each index were compared with the observed yields and with broad landscape patterns. Though model inputs were different, it was still possible to compare these methods based on the final outputs and their association with the observed patterns in yield [17]. Histograms of the index values were plotted from each model to understand the distribution of the index values found for the Quapaw Tribe. Next, the effect of each factor on the modeled results was assessed for significance (alpha = 0.05) and relative importance using squared semi-partial correlation, calculated using the “ppcor” package in R [18]. The squared semi-partial correlation can be understood as the proportion of shared variance between the dependent variable and an independent variable after controlling for all other covariates. Soil factor values from 10,000 randomly generated points in the study area were extracted and the squared semi-partial correlation was calculated for each suitability index.

2.5. Observed Yield Data

Yield monitor data for corn harvests were collected within the study area from 2013 to 2020. Yield monitor data were cleaned by removing values that fell outside the farm boundary and applying a filter to remove yield values that were more than ±3 standard deviations from the mean [19], resulting in a final dataset of >130,000 yield observations. Next, the yield values were interpolated using ordinary kriging with a spherical semivariogram model. Yield values were then averaged across years to calculate mean observed corn yield. Average corn yields were correlated with modeled suitability values from the Dideriksen and Storie suitability indices using Spearman rank correlation in order to validate model results.

2.6. Land Use and Crop Suitability

Finally, modeled suitability values were compared with current land use patterns according to the 2020 Cropland Data Layer (CDL) [13]. Landcover classes from the CDL were categorized into five categories: forest/shrubland, grassland/pasture, agriculture, developed/barren, and water/wetlands. Landcover with suitability index values for each landcover type was compared to assess how well current patterns of agricultural land use aligned with the modeled suitability values.

3. Results

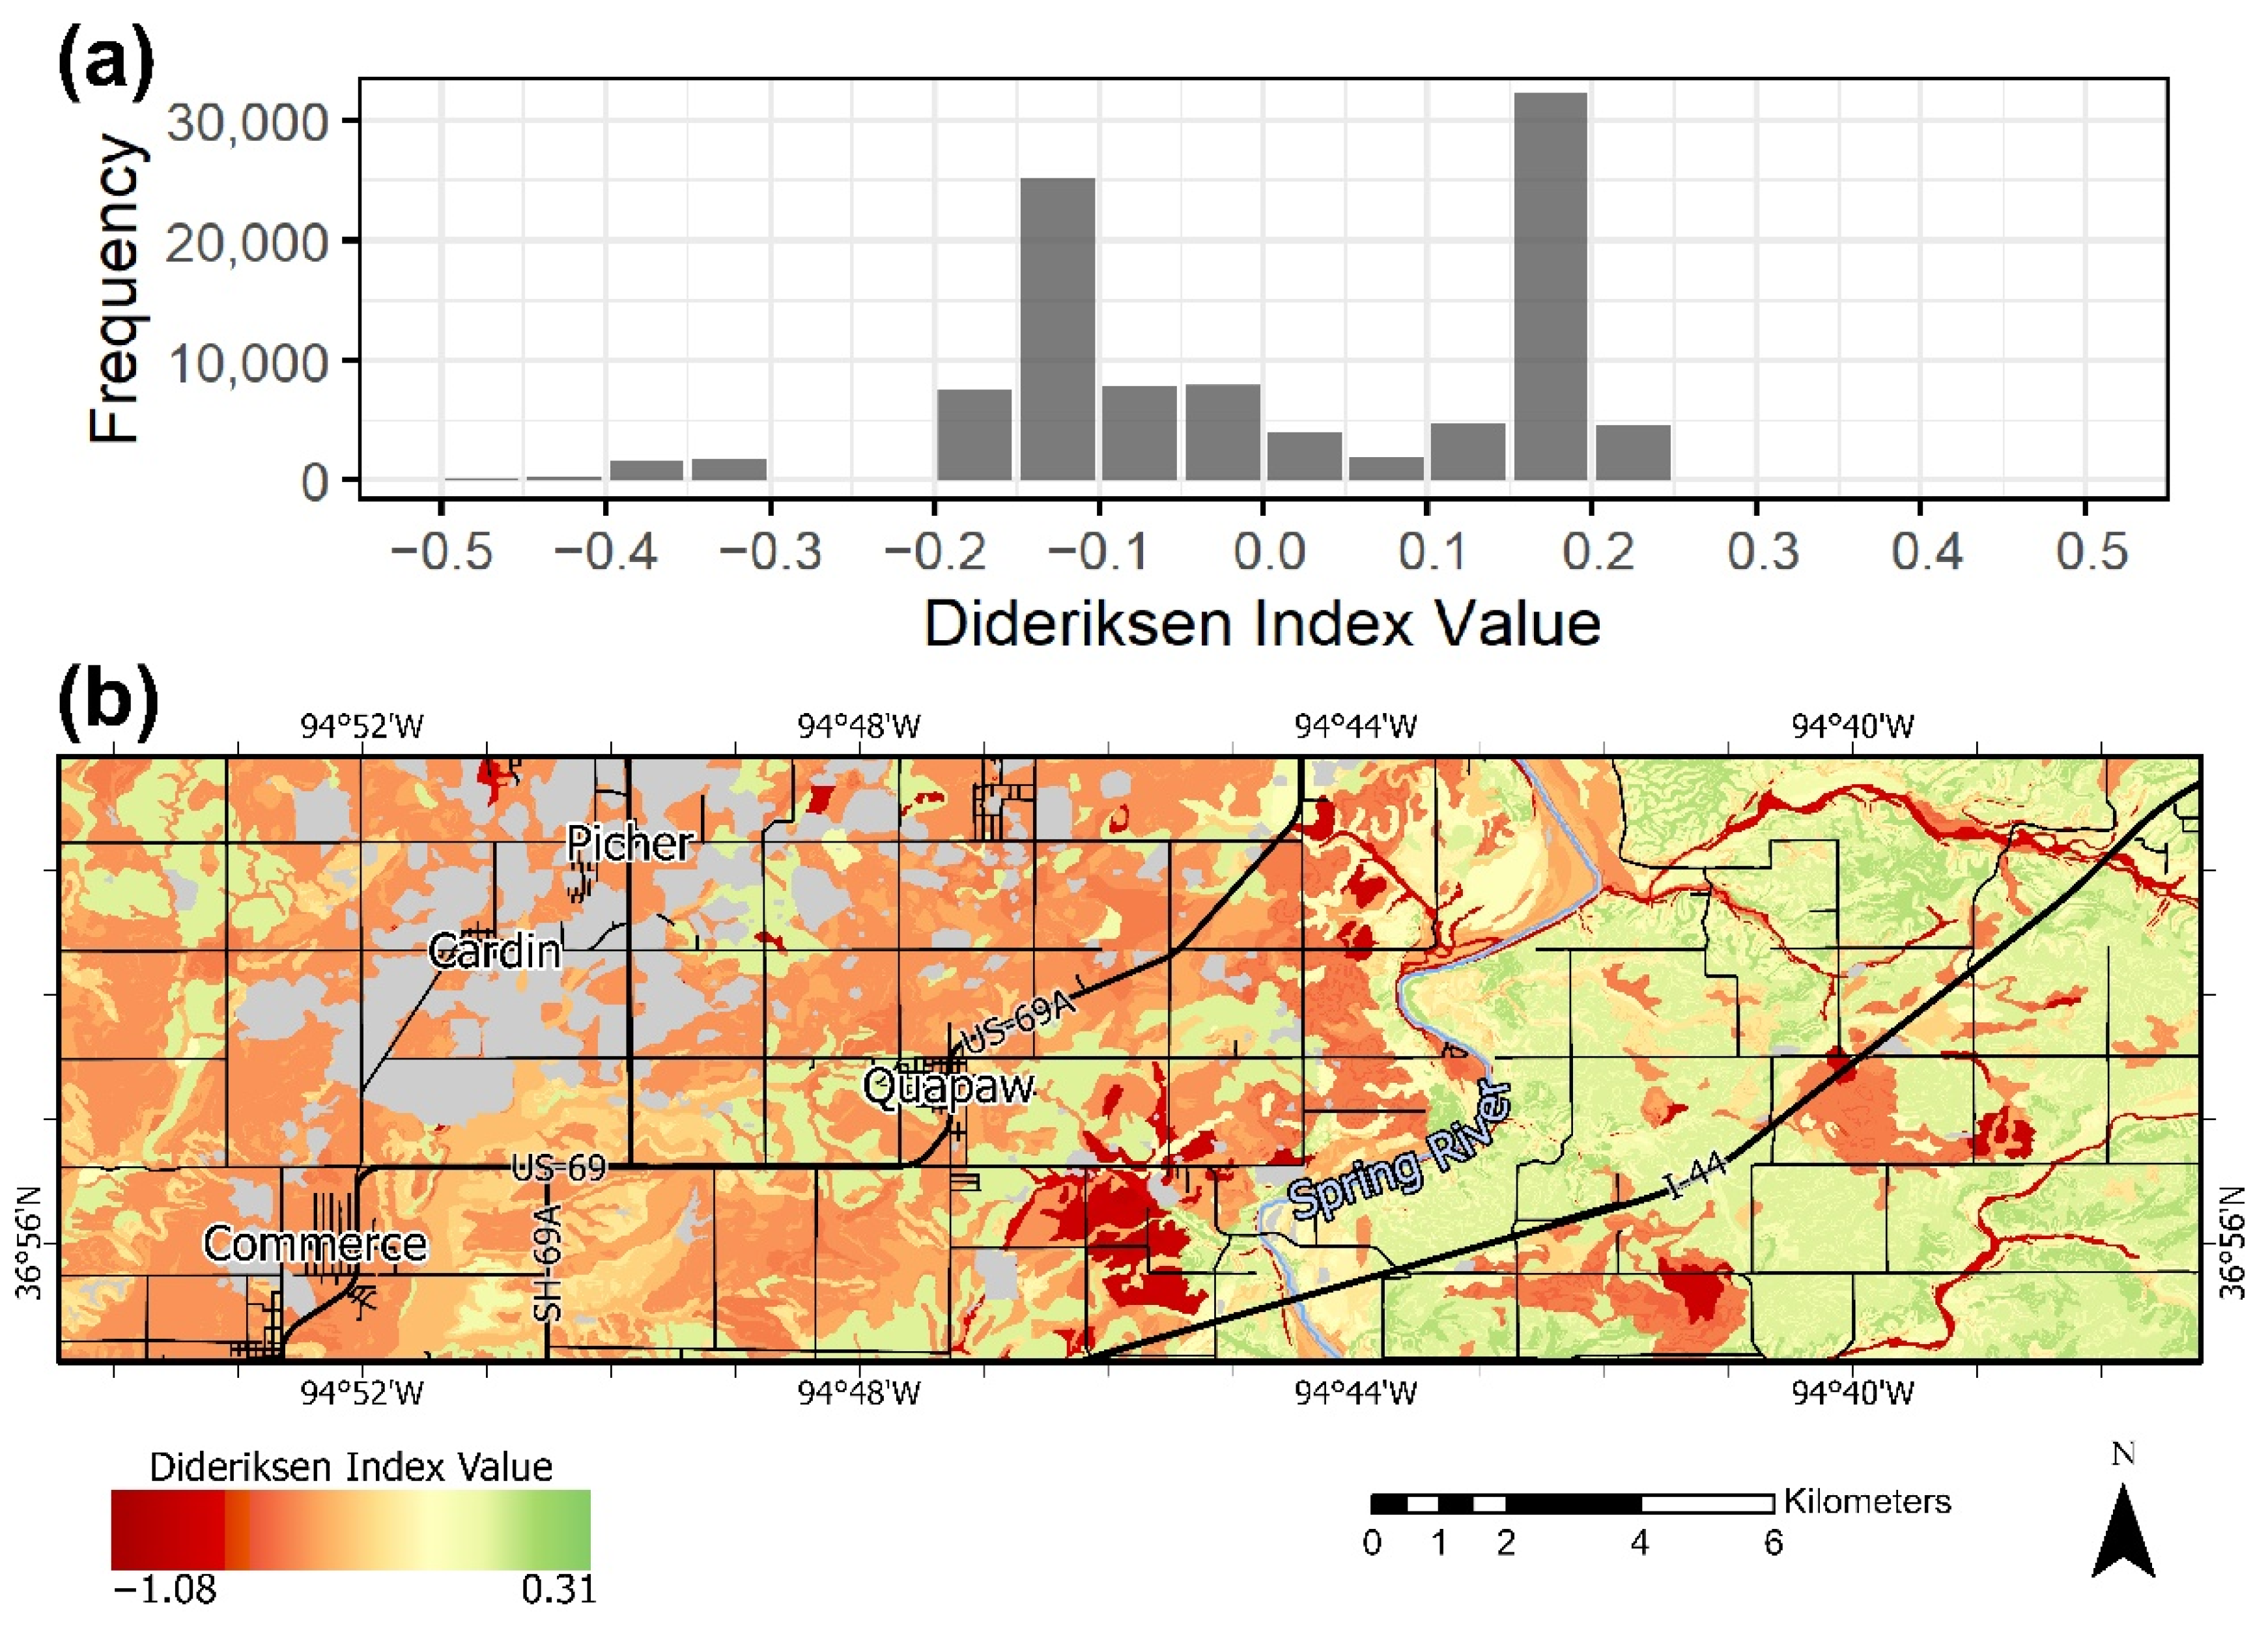
3.1. Dideriksen Model Results

The Dideriksen model results indicated that most of the Quapaw Tribal soils are not suitable for corn production. The Dideriksen index values were less than or equal to zero (indicating unsuitable land) for approximately 108 km2, or approximately 45% of the study area. Approximately 12 km2 (5%) of the area had suitability values between 0 and 0.1, 77 km2 (32%) between 0.1 and 0.2, and 10 km2 (4%) greater than 0.2 (Figure 1).
The maximum Dideriksen index value calculated was 0.31, which corresponded to a predicted relative yield value only 31% of the average corn yield reported in Oklahoma between 2015 and 2019. Of the fourteen soil factors that make up the Dideriksen suitability index, ten had an effect (p < 0.05) on index results (Table 1). Solum thickness had the strongest effect of any factor in the model, uniquely explaining approximately 21% of the variance in Dideriksen values, greater than any other factor by an order of magnitude. The sum of squared semi-partial correlation values was 0.38, indicating that approximately 38% of the variation in Dideriksen index values was explained by the soil factors independently. The remaining 62% of the variation in Dideriksen values is therefore the result of the interaction of two or more soil factors.

3.2. Storie Model Results

Storie index values were classified into five categories based on suitability for cultivation [6]. The categories were very poor (values between 0 and 0.2), poor (0.2 to 0.4), fair (0.4 to 0.6), good (0.6 to 0.8), and excellent (0.8 to 1.0). In general, crop suitability index results from the Storie index were more favorable and showed greater variation across the landscape than those from the Dideriksen suitability index. Only 1 km2 (<1%) was classified as “very poor” in this index. Approximately 82 km2 (34%) was classified as “poor”, 51 km2 (21%) as “fair”, 36 km2 (15%) as “good”, and 37 km2 (15%) as “very good” (Figure 2).
Soil factors from the Storie index that were associated (p < 0.05) with Storie index values were factors related to the physical profile (e.g., PM), surface texture, slope, drainage, and erosion (Table 2). The factor which had the strongest effect on index values in the Storie index was soil drainage, which explained approximately 28% of variation in Storie index values, followed closely by the soil parent material. Factors relating to alkalinity, nutrient level, acidity, and microrelief did not affect the Storie index values because values for these factors were constant throughout the study area. The sum of the squared semi-partial correlation of the soil factors in the Storie index was 0.55, meaning the factors included in the model individually accounted for 55% of variance in index values, and the remaining 45% of variance in Storie index values were the result of the relationship between multiple Storie soil factors.

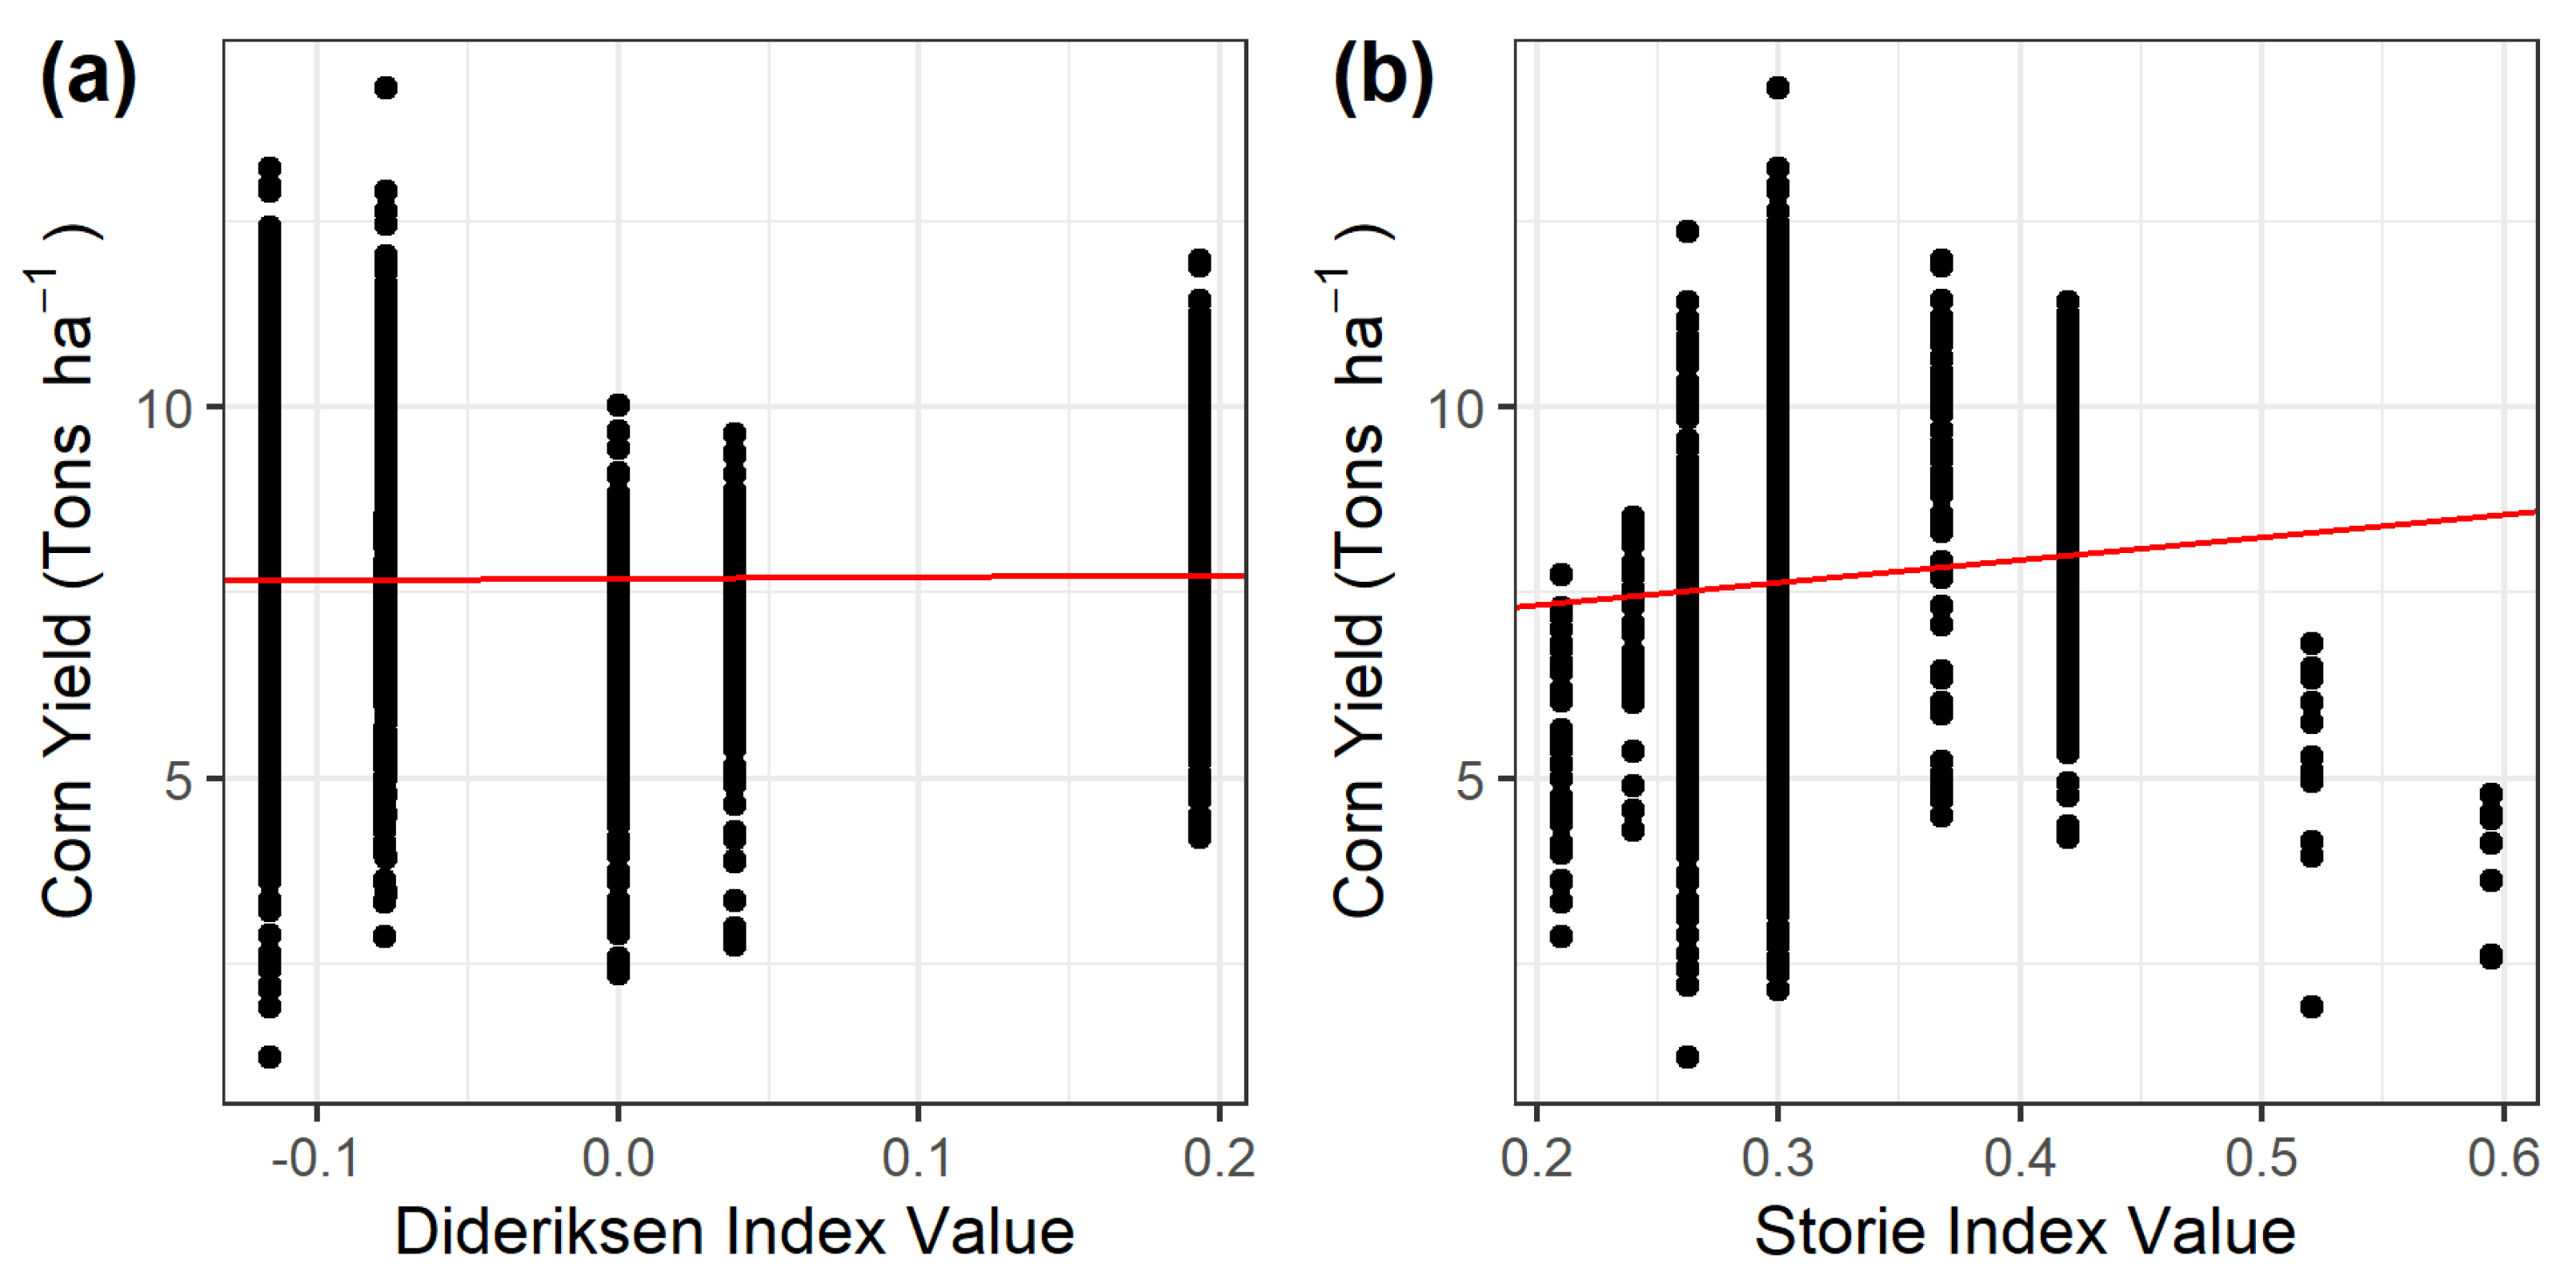
3.3. Model Correlation with Observed Yield

Modeled indices were compared with corn yield from farms within the study area to assess their ability to determine within-field variability in yield (Figure 3). Spearman rank correlation demonstrated a positive relationship between corn yield and the Storie suitability index (Spearman rho = 0.16, p < 0.01), but the association between yield and the Dideriksen index was weak (Spearman rho = 0.02, p = 0.19) and not statistically significant at an alpha of 0.05. Of the two indices, the Storie index, therefore, appeared to have a stronger relationship with observed corn yield, indicating that the Storie model had a superior performance and should be used over the Dideriksen model for estimating crop suitability on similar soils, conditions, and parameters.
On the Quapaw Tribal lands, the majority of agricultural activity occurs on soils classified as “poor” or “fair” in the Storie index. Similarly, the majority of agriculture occurring in the Quapaw Tribal lands fell within areas the Dideriksen index predicted to have a suitability of less than zero, while very little occurred in areas with relatively higher suitability.
We found that the majority of highly suitable agricultural soils according to the Storie index are currently covered by a mosaic of forest/shrubland and grassland/pasture (Figure 4). Only a small fraction of soils predicted to be most productive for row crop agriculture are currently under cultivation. In the Dideriksen index, only 12.4 km2 out of the 98.5 km2 (~13%) of land with a suitability above zero was under active cultivation. Similarly, out of the 47.6 km2 of land classified as having “good” or “very good” suitability by the Storie index, only 2.8 km2 were used for agriculture. According to both models, the majority of land with the highest suitability values is currently covered in forest or shrubland or is used as grassland or pasture (Figure 4).

4. Discussion

4.1. Multi-Criteria Evaluation—Trends across Indices

At the landscape level, the two crop suitability indices showed similar trends in relative suitability for the Quapaw Tribal area, despite differences in model inputs for calculating crop suitability values (Figure 1). In both cases, the areas west of Spring River were lower in suitability than the areas to the east, suggesting agreement between the models in terms of relative suitability. Further, the factors most important for determining soil suitability were similar in both indices, and included factors related to parent material, texture, depth, and soil drainage (Table 1 and Table 2). These soil factors were all related to soil depth and water storage capacity, which plays a key role in crop production [20,21].
When assessing the Dideriksen index results, the majority of the study area is not well suited for growing corn. A maximum Dideriksen index value of 0.3 suggested that soils within the study area only produce approximately 30% of the average yield for the state of Oklahoma. This may not accurately represent the yield potential since the Dideriksen index may be better suited for landscape-level assessments of relative suitability rather than within-field suitability assessments [7]. The Storie index had more favorable index values for the Quapaw Tribal lands and had a more even distribution of modeled values across all possible index values than the Dideriksen index, suggesting that the Storie suitability index may be better suited for within-field suitability assessments because its modeled values are more continuous across landscapes. The Storie index is also more generalizable and widely applied than the Dideriksen index, making it a better option for an initial suitability assessment [8,9,10]. However, despite the positive relationship between the observed yield (>130,000 points within the Tribal nation) and the suitability predicted by the Storie index model, further work should be conducted to improve parameter development and ultimately yield correlations.

4.2. Observed Yield and Suitability Indices

The results presented here support the general notions that the Storie crop suitability index can characterize relative yield potential of soils at the regional and local scales [8,10]. The Storie suitability model was correlated with observed yields, indicating this index does have explanatory power in Quapaw lands (Figure 3), though more research is needed to determine how well the index characterizes within-field variation in crop suitability. This novel application of crop suitability mapping can, therefore, contribute to improved agricultural production and soil conservation efforts in the Quapaw Tribal lands through the matching of land-use goals with appropriate soils [3,4,11]. Additionally, the parametric method of the square root and the fuzzy method for crop suitability were shown to be more accurate than the Storie model in some areas [22,23]. Therefore, additional research is needed to assess these additional methods for crop suitability mapping in this study area. Finally, future work that develops empirical crop suitability indices explicitly for precision management applications in this area will be needed for optimization of crop production and more precise identification of yield gaps on U.S. Tribal lands.
Though continuous soil property maps were developed for several of the factors used in each index, some soil characteristics could only be obtained through the Soil Survey Database [14]. The mapping units delineated by the Soil Survey are not necessarily intended to be used for within-field soil assessments due to the scale of production which includes soil associations, consociations, multiple series mapping units, and up to 0.8 ha of inclusions within a mapping unit; therefore, soil surveys have limited accuracy at the fine spatial resolutions required for precise recommendations. Further development of continuous maps of such important soil properties would, therefore, improve the overall accuracy of suitability indices at the landscape and field scale [4].

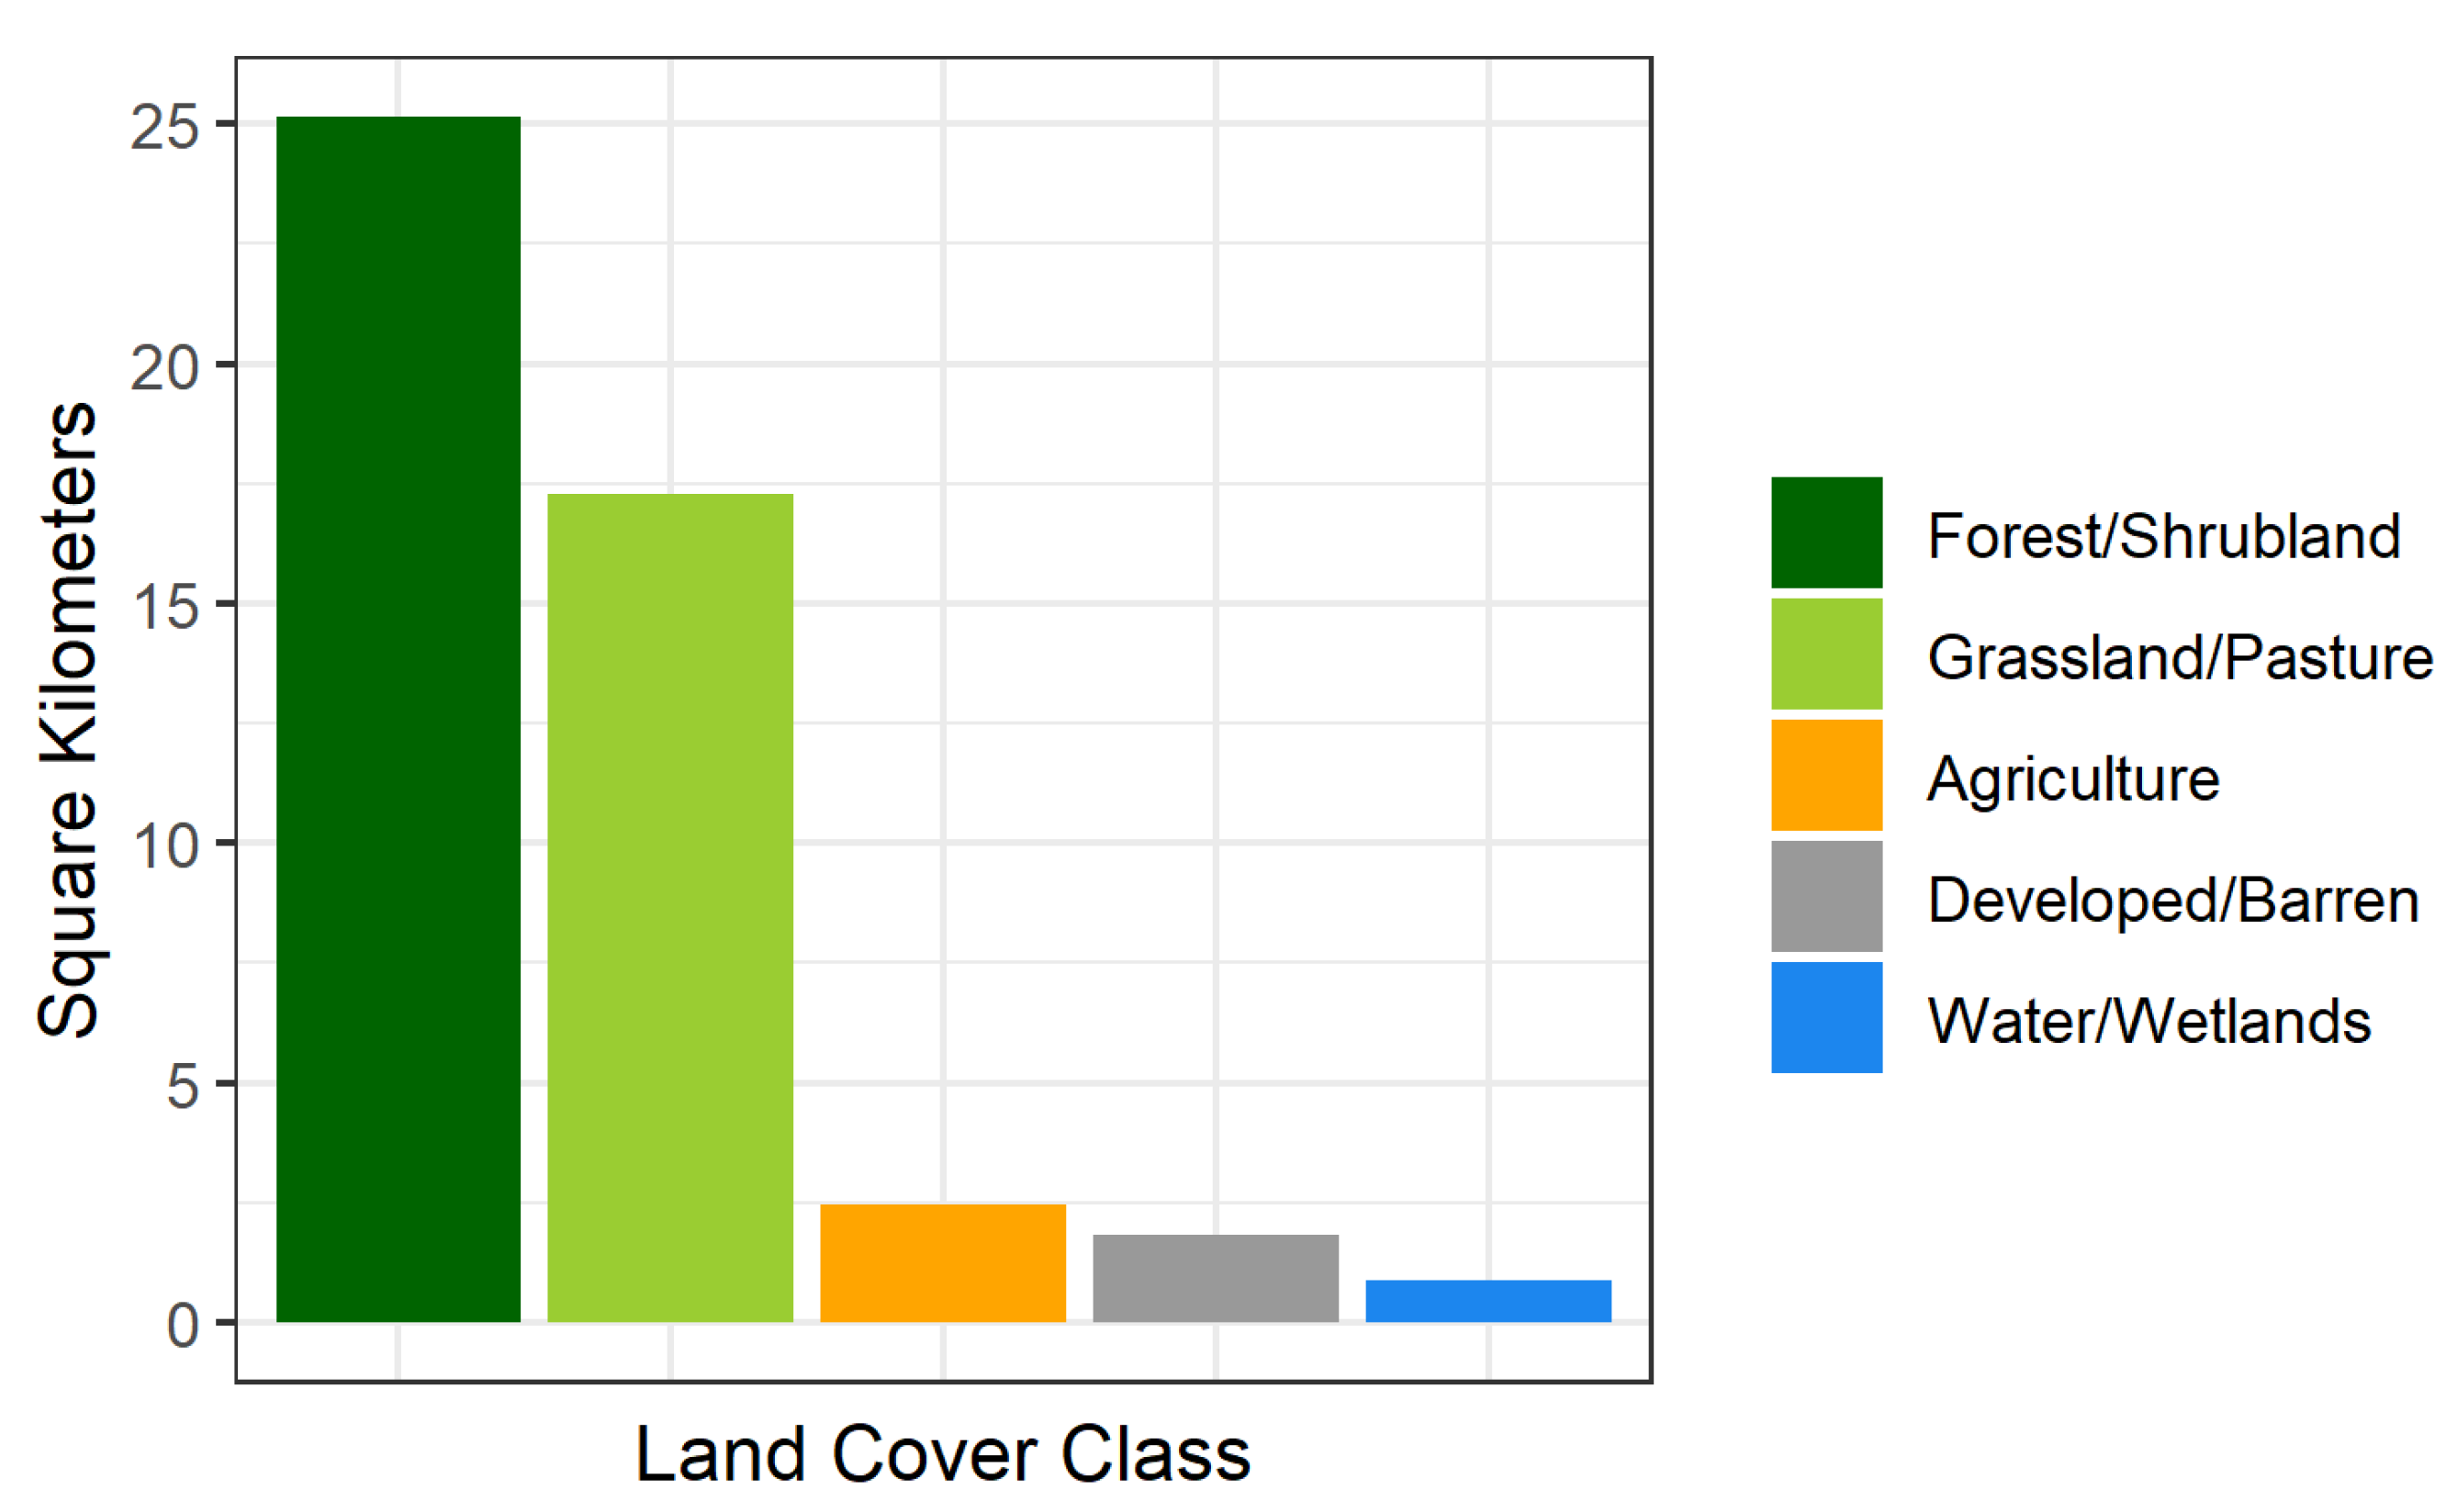
4.3. Land-Use Patterns and Crop Suitability

A noteworthy finding is that much of the most suitable soils for crop growth are currently underutilized. Similarly, areas where crops are currently grown are predominantly in areas of lower suitability. A likely reason for the absence of agriculture in highly ranked soils is the high percentage of coarse rocks and gravel for many areas west of Spring River, which makes cultivation of the area difficult. Additionally, some members of the Tribe have expressed a strong desire to the Quapaw Environmental Office that their land should remain forested (personal communication with the authors). This preference could also account for the high prevalence of forested land cover on prime soils. Finally, much of the area has a long history with cattle ranching, dating back to the earliest land use on Quapaw Tribal lands [24]. The long-standing practice of cattle ranching in the territory may have taken precedence over growing crops because of existing relationships with cattle ranchers, even in areas of high potential crop suitability.
Similar to these results, previous studies found that producers were not necessarily cultivating crops based on prime suitability of biophysical conditions but rather based on the suitability of socio-economic parameters [11,12]. Similar to the present study [12], previous work found that there are yield gaps for major crops in the Bundelkhand region in India, owing to marginal soils being used to grow prime revenue-generating row crops. Crop suitability mapping has also been used to optimize regional resource use, such as irrigation. For example, in northwest China, researchers found that crop water consumption could be optimized through crop suitability tools and found overall 31–33% efficiency gains through optimization [12]. Overall, crop suitability mapping can be a useful tool for sustainable resource management and planning, enhanced socio-economic outcomes, and for closing yield gaps at the local, regional, and national levels [3,25,26].

5. Conclusions

Spatially accurate, high-resolution soil data remains limited in Tribal territories, and there is a strong need for such data to inform landscape management and enable sustainable intensification. In this study, we used GIS tools to integrate novel continuous soil properties and existing soil information to produce first-ever crop suitability indices on Quapaw Tribal lands. Of the two suitability indices examined in this study, the Storie index demonstrated a stronger potential for quantifying suitability based on correlation with observed yields. Results suggested that there were potential yield gaps and opportunities for sustainable intensification in the Quapaw Tribal lands due to underutilization of highly suitable soils. Better matching of soils with land use in these areas could allow for more optimum resource allocation and improved food security on U.S. Tribal lands. More work is needed in order to refine soil suitability mapping in the Quapaw Tribal lands and in the region more broadly, including the development of new high-resolution spatial models that are better able to characterize within-field suitability at the farm level.

Supplementary Materials

The following supporting information can be downloaded at: https://www.mdpi.com/article/10.3390/agriculture12091307/s1, Table S1: List of soil factors used in the Dideriksen suitability index; Table S2: List of soil factors used in the Storie suitability index.

Author Contributions

Conceptualization, A.J.A., P.R.O. and H.W.S.; Methodology, H.W.S.; Formal Analysis, H.W.S.; Writing—Original Draft Preparation, H.W.S.; Writing—Review and Editing, A.J.A., P.R.O. and H.W.S. All authors have read and agreed to the published version of the manuscript.

Funding

This project was made possible by the Foundation for Food and Agriculture, New Innovator Award (993-6022-006).

Institutional Review Board Statement

Not applicable.

Informed Consent Statement

Not applicable.

Data Availability Statement

The data presented in this study are available on request from the corresponding author.

Acknowledgments

The authors are grateful to Taylor Adams and Tulsi Kharel with the USDA-ARS; Bryan Fuentes, Rick DeBois, and Alexis Dixon with the University of Arkansas; and, Tim Kent, Craig Kreman, and Summer King with the Quapaw Nation Environmental Office for their assistance soil sampling and identifying sampling locations, as well as Janie Hipp and Colby Duren with the Indigenous Food and Agriculture Initiative for their programmatic and project oversight. Mention of trade names or commercial products in this publication is solely for the purpose of providing specific information and does not imply recommendation or endorsement by the U.S. Department of Agriculture.

Conflicts of Interest

The authors declare no conflict of interest.

References

  1. FAO. The Future of Food and Agriculture–Trends and Challenges; FAO: Rome, Italy, 2017; pp. 1–180. [Google Scholar]
  2. Karthikeyan, K.; Vasu, D.; Tiwary, P.; Cunliffe, A.M.; Chandran, P.; Mariappan, S.; Singh, S.K. Comparison of Methods for Evaluating the Suitability of Vertisols for Gossypium Hirsutum (Bt Cotton) in Two Contrasting Agro-Ecological Regions. Arch. Agron. Soil Sci. 2019, 65, 968–979. [Google Scholar] [CrossRef]
  3. Vázquez-Quintero, G.; Prieto-Amparán, J.A.; Pinedo-Alvarez, A.; Valles-Aragón, M.C.; Morales-Nieto, C.R.; Villarreal-Guerrero, F. GIS-Based Multicriteria Evaluation of Land Suitability for Grasslands Conservation in Chihuahua, Mexico. Sustainability 2020, 12, 185. [Google Scholar] [CrossRef]
  4. Fuentes, B.; Ashworth, A.J.; Ngunjiri, M.; Owens, P. Mapping Soil Properties to Advance the State of Spatial Soil Information for Greater Food Security on US Tribal Lands. Front. Soil Sci. 2021, 1, 695386. [Google Scholar] [CrossRef]
  5. Walker, C.F. A Model to Estimate Corn Yields for Indiana Soils. Master’s Thesis, Purdue University, Lafayette, IN, USA, 1976. [Google Scholar]
  6. Storie, R.E. Storie Index Soil Rating (Revised); Division of Agricultural Sciences, University of California: Berkeley, CA, USA, 1978. [Google Scholar]
  7. Logan, A.E. Soil Productivity Ranking Factors of Indiana; Purdue University Department of Agronomy: Lafayette, IN, USA, 2013. [Google Scholar]
  8. El Baroudy, A.A. Mapping and Evaluating Land Suitability Using a GIS-Based Model. CATENA 2016, 140, 96–104. [Google Scholar] [CrossRef]
  9. Seyedmohammadi, J.; Sarmadian, F.; Jafarzadeh, A.A.; McDowell, R.W. Development of a Model Using Matter Element, AHP and GIS Techniques to Assess the Suitability of Land for Agriculture. Geoderma 2019, 352, 80–95. [Google Scholar] [CrossRef]
  10. Vasu, D.; Srivastava, R.; Patil, N.G.; Tiwary, P.; Chandran, P.; Kumar Singh, S. A Comparative Assessment of Land Suitability Evaluation Methods for Agricultural Land Use Planning at Village Level. Land Use Policy 2018, 79, 146–163. [Google Scholar] [CrossRef]
  11. Jain, R.; Chand, P.; Rao, S.; Agarwal, P. Crop and Soil Suitability Analysis Using Multi-Criteria Decision Making in Drought-Prone Semi-Arid Tropics in India. J. Soil Water Conserv. 2020, 19, 271–283. [Google Scholar] [CrossRef]
  12. He, L.; Wang, S.; Peng, C.; Tan, Q. Optimization of Water Consumption Distribution Based on Crop Suitability in the Middle Reaches of Heihe River. Sustainability 2018, 10, 2119. [Google Scholar] [CrossRef]
  13. USDA-NASS Cropland Data Layer. Available online: https://nassgeodata.gmu.edu/CropScape/ (accessed on 20 February 2021).
  14. Soil Survey Staff Web Soil Survey. Available online: http://websoilsurvey.sc.egov.usda.gov/ (accessed on 9 December 2020).
  15. Owens, P.R.; Dorantes, M.J.; Fuentes, B.A.; Libohova, Z.; Schmidt, A. Taking Digital Soil Mapping to the Field: Lessons Learned from the Water Smart Agriculture Soil Mapping Project in Central America. Geoderma Reg. 2020, 22, e00285. [Google Scholar] [CrossRef]
  16. USDA-NASS Statistics by State. Available online: https://www.nass.usda.gov/Statistics_by_State/Oklahoma/index.php (accessed on 8 March 2021).
  17. Estes, L.D.; Bradley, B.A.; Beukes, H.; Hole, D.G.; Lau, M.; Oppenheimer, M.G.; Schulze, R.; Tadross, M.A.; Turner, W.R. Comparing Mechanistic and Empirical Model Projections of Crop Suitability and Productivity: Implications for Ecological Forecasting. Glob. Ecol. Biogeogr. 2013, 22, 1007–1018. [Google Scholar] [CrossRef]
  18. Kim, S. Ppcor: An R Package for a Fast Calculation to Semi-Partial Correlation Coefficients. Commun. Stat. Appl. Methods 2015, 22, 665–674. [Google Scholar] [CrossRef] [PubMed]
  19. Dobermann, A.; Ping, J.L. Geostatistical Integration of Yield Monitor Data and Remote Sensing Improves Yield Maps. Agron. J. 2004, 96, 285–297. [Google Scholar] [CrossRef]
  20. Kravchenko, A.N.; Bullock, D.G. Correlation of Corn and Soybean Grain Yield with Topography and Soil Properties. Agron. J. 2000, 92, 75–83. [Google Scholar] [CrossRef]
  21. Rhoton, F.E.; Lindbo, D.L. A Soil Depth Approach to Soil Quality Assessment. J. Soil Water Conserv. 1997, 52, 66–72. [Google Scholar]
  22. Jafarzadeh, A.A.; Alamdari, P.; Neyshabouri, M.R.; Saedi, S. Land Suitability Evaluation of Bilverdy Research Station for Wheat, Barley, Alfalfa, Maize and Safflower. Soil Water Res. 2008, 3, S81–S88. [Google Scholar] [CrossRef]
  23. Sharififar, A.; Ghorbani, H.; Sarmadian, F. Soil Suitability Evaluation for Crop Selection Using Fuzzy Sets Methodology. Acta. Agric. Slov. 2016, 107, 159. [Google Scholar] [CrossRef]
  24. Baird, W.D. The Quapaw Indians: A History of the Downstream People, 1st ed.; University of Oklahoma Press: Norman, OK, USA, 1980. [Google Scholar]
  25. Van Wart, J.; van Bussel, L.G.J.; Wolf, J.; Licker, R.; Grassini, P.; Nelson, A.; Boogaard, H.; Gerber, J.; Mueller, N.D.; Claessens, L.; et al. Use of Agro-climatic Zones to Upscale Simulated Crop Yield Potential. Field Crops Res. 2013, 143, 44–55. [Google Scholar] [CrossRef]
  26. Akpoti, K.; Kabo-bah, A.T.; and Zwart, S.J. Agricultural Land Suitability Analysis: State-of-the-art and Outlooks for Integration of Climate Change Analysis. Agric. Syst. 2019, 173, 172–208. [Google Scholar] [CrossRef]
Figure 1. (a) Frequency distribution of Dideriksen crop suitability index values for soils within Quapaw Tribal lands and (b) the spatial distribution of Dideriksen index values.
Agriculture 12 01307 g001
Figure 2. (a) Frequency distribution of Storie crop suitability index values for soils within the Quapaw Tribal lands and (b) the spatial distribution of Storie index values.
Agriculture 12 01307 g002
Figure 3. (a) Scatterplot of observed corn yield and Dideriksen index values; (b) Scatterplot of observed corn yield and Storie index values. Red lines represent the best fit line from a linear model of index values and observed yield.
Agriculture 12 01307 g003
Figure 4. Area of relatively higher suitability cropland predicted by the Storie index, grouped by landcover according to the 2020 Cropland Data Layer. For the purposes of this analysis, high suitability is defined as areas ranking “good” or “very good” in the Storie index.
Agriculture 12 01307 g004
Table 1. Semi-partial correlation and squared semi-partial correlation of Dideriksen soil factors with Dideriksen suitability index values. Factors with zero variance were not included and are marked with a dash.
FactorSemi-Partial
Correlation
Semi-Partial
Correlation2
p-Value
1 Soil material0.1620.026<0.001 *
2 Base saturation0.1120.012<0.001 *
3 Surface thickness and organic matter0.1760.031<0.001 *
4 Calcareous soils---
5 Clay-iron bands---
6 Fragipans0.0620.004<0.001 *
7 Depth and texture of two-layered soils0.014<0.0010.173
8 Solum thickness0.4580.210<0.001 *
9 Bottomland soils, family, and drainage0.1570.025<0.001 *
10 Surface horizon texture0.0470.002<0.001 *
11 Soil drainage0.1870.035<0.001 *
12 Slope0.1940.038<0.001 *
13 Erosion0.017<0.0010.092
14 Organic soils---
* significant at alpha = 0.05.
Table 2. Semi-partial correlation and squared semi-partial correlation of Storie soil factors with Storie suitability index values. Factors with zero variance were not included and are marked with a dash.
FactorSemi-Partial CorrelationSemi-Partial Correlation2p-Value
1 Factor A—Physical Profile0.4720.223<0.001 *
2 Factor B—Surface texture0.1770.031<0.001 *
3 Factor C—Slope0.1100.012<0.001 *
4 Factor X—Drainage0.5290.280<0.001 *
5 Factor X—Erosion0.0400.002<0.001 *
6 Factor X—Alkalinity---
7 Factor X—Nutrient level---
8 Factor X—Acidity---
* significant at alpha = 0.05.
Publisher’s Note: MDPI stays neutral with regard to jurisdictional claims in published maps and institutional affiliations.

