1. Introduction
The structure of the greenhouse, as a light steel structure, is significantly affected by the wind load under the effect of wind-induced vibration. The surface envelope is destroyed first under wind loads, especially under the action of a negative pressure load. Due to the upward lift, the greenhouse roof is easily overturned, and the greenhouse skeleton tends to be deformed and displaced, thus resulting in the collapse of the main structure of the greenhouse. As a result, serious damage and losses are caused to agricultural production. To increase the safety of the greenhouse structure, the stability and safety of the main structure of the greenhouse should be investigated under extreme wind load conditions. On-site measurement takes a long time and faces the low detection efficiency of the test results though it is the most direct and basic test method. The wind load measurement system for large-span roofs remains not complete. Accordingly, the two methods were proposed for the analysis through the Fluent simulation to perform a simulation test and to build a thumbnail model for the wind tunnel test. Fluent is capable of visualizing the deformation and stress changes and determining the bearing capacity of the structure based on the effect of peak wind pressure on the greenhouse. The wind tunnel test is capable of verifying the rationality of the greenhouse structure selection to analyze the bearing effect of the overall structure of the greenhouse in depth. The focus of this study is placed on the bearing effect of several main types of greenhouse structures in different directions, and design references and suggestions are provided for the wind resistance design of greenhouses.
The finite element software computational fluid dynamics (CFD) can appraise the injury characteristics of multi-span Saw-tooth type greenhouse under different wind loads supported by elastic-plastic analysis [
1]. The wind pressure coefficient based on the Custom Field Function Calculator of CFD is beneficial to develop a novel calculation method. This coefficient summarizes the characteristics of wind pressure distribution in multi-span greenhouses, and it has been adopted by some researchers to revise the EN13031-1 wind pressure coefficient [
2]. In a previous study, a CFD simulation test of four wind directions of the Round-arch greenhouse in four-span was conducted, and the result has suggested that the oblique flow has the maximum effect on the wind effect of the greenhouse [
3]. Moreover, the study on the effects of dimension changes takes advantage of CFD to conduct numerical simulation [
4,
5,
6,
7,
8,
9,
10]. T. Boulard [
11] has proposed the application of CFD simulation in the design of greenhouse structures early. CFD contains a sensible application in the simulation and analysis of greenhouse wind engineering structures. In brief, wind tunnel tests can simulate the wind response of building surfaces.
The wind tunnel test has been additionally confirmed as an effective way to investigate wind-induced responses [
12,
13]. The wind tunnel pressure test results and numerical calculation conclusions of the CAARC building model [
14] suggest that the direct comparison of the model surface pressure measurement results facilitates the quality verification of the wind field [
15,
16,
17,
18]. It is capable of deducing the critical wind speed for surface damage of a single-span plastic greenhouse in the NH-2 wind tunnel and clearly describing the wind pressure distribution on the respective surface [
19].
Part of the existing research administrated by simulation and wind tunnel test on the wind load characteristics of Saw-tooth type greenhouse roof has confirmed that the area most stricken by wind load includes the corners and edges of the roof [
20]. Some researchers have placed their focus on the surface wind pressure of Venlo type greenhouses with different spans supported by the sensitivity of different layouts to wind loads, thus providing a reference for the design values of greenhouse wind loads [
21]. Kim R. et al. [
22,
23] performed the simulation experiments and wind tunnel tests to investigate the wind pressure coefficients of some typical multi-span greenhouses. To be specific, their main design wind directions were 0° and 90° perpendicular to the ridge. In this study, the wind pressure coefficients for each 15-degree interval from 0°-wind to 180°-wind direction were investigated. Thus, we discerned the effect of the most unfavorable wind direction and maximum wind pressure coefficient values on the main structure of the greenhouse. Furthermore, the Saw-tooth type greenhouse was introduced as an experimental subject, and the wind response characteristics of the three structural types of greenhouses were compared. Notably, a correction factor was introduced to solve the problem of excessive blockage rate in wind tunnel tests, and the results were well verified through the simulation experiments.
With the greater demand for production space in agriculture, the structural analysis for greenhouses with larger spans and openings should be urgently conducted. Thus, in this study, the applicability and refinement of the current Chinese “Code for Structural Loads of Agricultural Greenhouses” (GB/T51183-2016) were demonstrated to be well matched.
2. Materials and Methods
2.1. Geometric Modeling
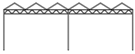
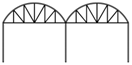
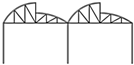
Table 1 lists the structural form and dimensional parameters and schematic diagrams of the greenhouse structure selected in this study. Three different structural forms of greenhouses, including Venlo type, Round-arch type, and Saw-tooth type (with a roof of 3m-arch height and a roof of 1.5m-arch height) were primarily designed, basically for the structural wind response of double-span and four-room greenhouses.
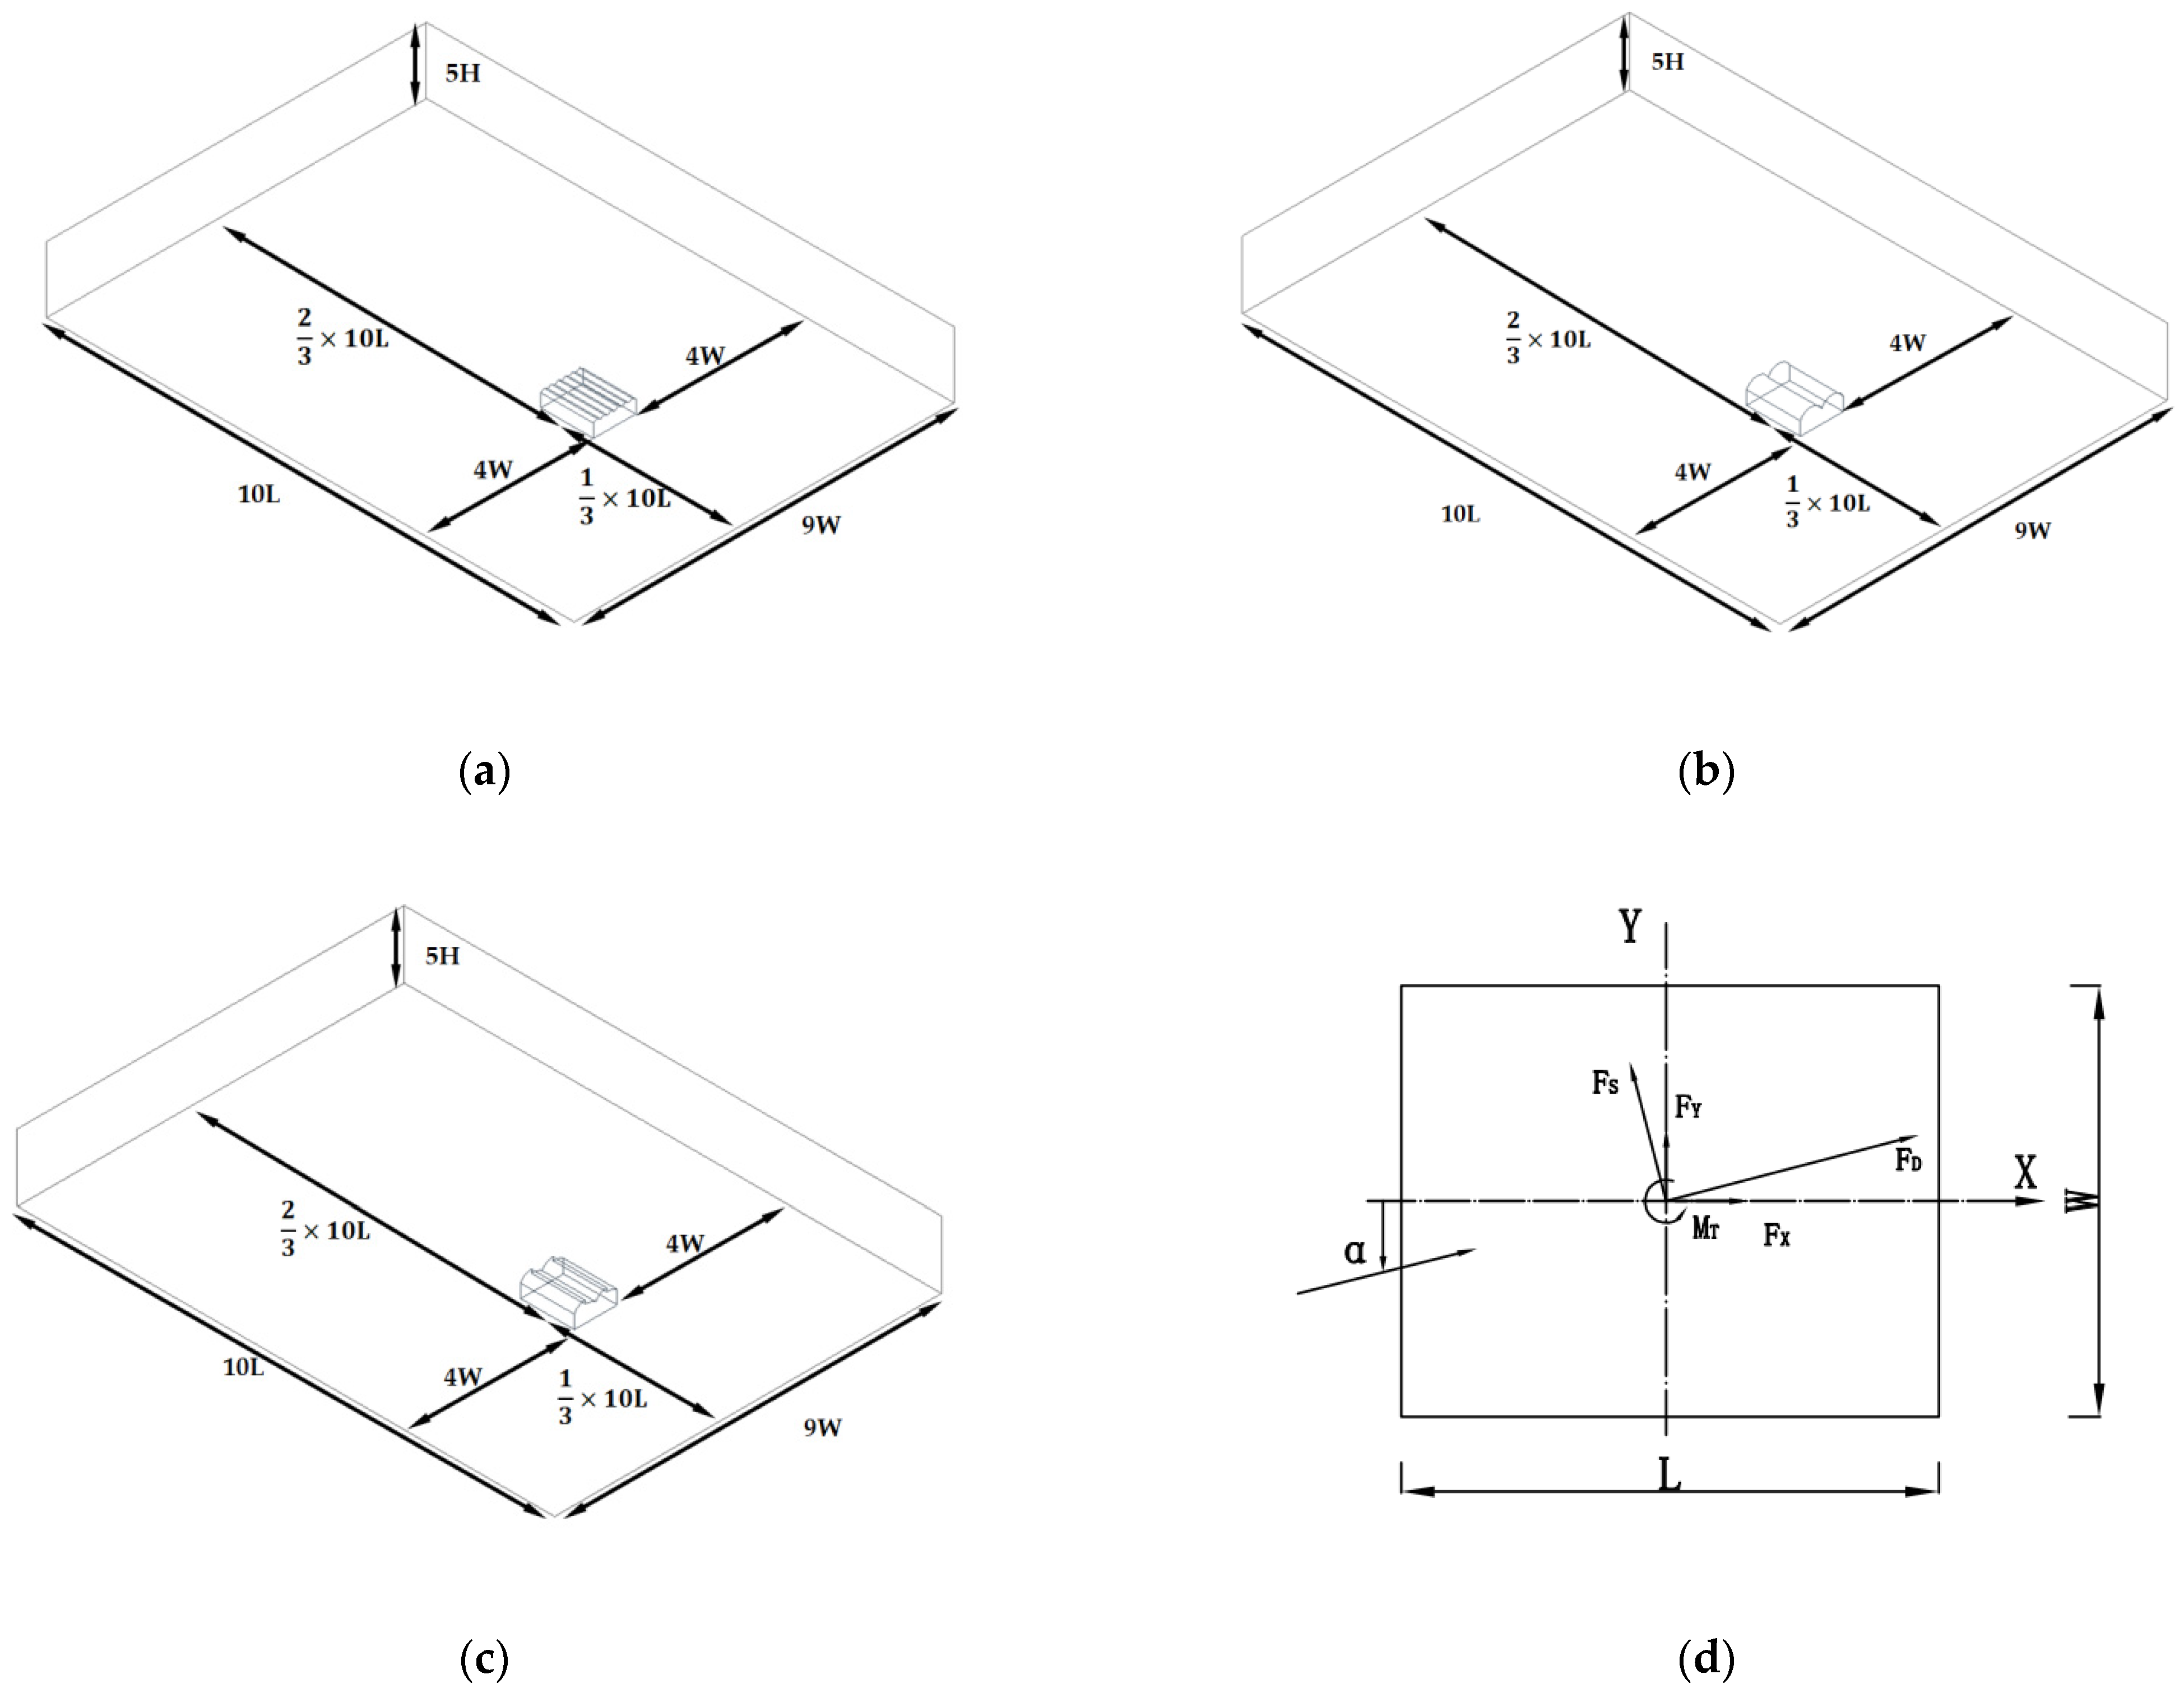
Figure 1 illustrates the structural models.
2.2. Computational Domain and Grid Settings
The calculation domain was set reasonably to ensure the test accuracy and save time. When the wind path was blocked by an object, the winding speed around the object was significantly higher than the actual situation. The wind load acting on it also increased, such that the blocking effect increased with the ratio of the object’s windward area to the watershed area. The blocking rate (Equation (1)) was adopted to measure it.
where
denotes the maximum windward area of the building;
represents the watershed cross-sectional area.
When the blocking rate was less than 3% [
24], the blocking effect had no implications on the greenhouse. Accordingly, according to existing research [
25,
26], the computational domain size is 10 L, 9 W, 5 H. To be specific, L, W and H represent the length, width, and eave height of the greenhouse, respectively, and the values are 24 m, 19.2 m, and 6 m, respectively. With the Venlo Type dimensions and calculation domain as an example, the calculation results according to Equation (1) are
,
, all meeting the obstruction rate requirement of less than 3%. The model was placed in the front 1/3 of the entire calculation basin close to the inlet direction to ensure that there is no backflow at the outlet boundary as shown in
Figure 2.
All grids were set as the unstructured grids, and the minimum size of the calculated domain was taken as 3 m (0.1 × 5 H, H denotes the eave height of the greenhouse). The surface of the greenhouse was encrypted, the minimum size was 0.3 m (0.05 × H). The maximum size of the grid was controlled by changing the Max element × Scalce factor (M × S), the maximum size of the grid was reduced, such that the grid density gradually increased. After the grid dependency test, the error of calculation results based on different grid numbers was less than 2%, i.e., the result did not change significantly. Hence, the mesh size can be considered the better mesh for the calculation.
Table 2 lists the nodes, the number of cells, and the quality coefficient of the grid for the respective structure type of greenhouse in 90°-wind direction. The grid quality was highly comparable with the values listed in
Table 3. The quality characteristics of the grid in all other wind directions were similar to those in 90°-wind direction, which will not to be described here. As depicted in
Figure 3 and
Figure 4, the joints of the grid had a high degree of coincidence.
2.3. Boundary Condition Settings
Natural winds in the atmospheric boundary layer are turbulent winds, which are complex and stochastic in time and space. The main turbulence models employed for wind tunnel simulations in Fluent included the k − ϵ model, the k − ω model, the Transition SST, the Reynolds Stress Model (RSM) and the Large Eddy (LES) model [
6,
22]. To be specific, the k − ϵ model is the most representative turbulence model with better performance for rotational flow, boundary flow with strong adverse pressure gradient, flow separation, as well as secondary flow. It has a wide application in engineering for its simple calculation and high applicability [
9,
14,
27]. Thus, the k − ϵ model was carried in this work. The dissipation rate
into Equation (2) and the turbulent kinetic energy
into Equation (3) [
28] are expressed as follows.
where C
μ denotes coefficient, taken as 0.09; l is turbulent flow length, calculated according to l = 0.07 L; L is length of greenhouse;
is wind profile index, taken as 0.15; U
(z) is the average wind speed at the height z; I
z is the turbulence intensity, as expressed in Equation (4) [
29]; I
10 is the nominal turbulence degree at a height of 10 m, taken as 0.14.
2.3.1. Inlet Boundary Conditions
The boundary condition of the inlet flow was set to be the velocity inlet when the test was conducted. The type of greenhouse terrain category involved in this article is type-B, as the Chinese “Code for Design of Building Structures” (GB50009-2012) informed. in accordance with the Chinese Code, type-B represents fields, villages, jungles, hills, as well as sparsely populated towns and suburban areas. Exponential rate was adopted to simulate the wind profile of the atmospheric boundary layer, and the average wind speed profile is expressed in Equation (5),
where
is the reference height of 10 m,
is wind profile index, taken as 0.15, U
r is the average wind speed of 30 m s
−1 at 10 m height, this wind speed is extremely destructive, and by comparing the wind pressure distribution on the surface of different shaped greenhouses under this speed, we can clearly distinguish the significant changes in each part, and thus determine which greenhouse has better wind resistance.
2.3.2. Outlet Boundary Conditions
Set outlet boundary condition to pressure outlet, with the average outlet pressure of 0 Pa and the reflux strength of 5 percent. That is, if outward flow occurs, the static pressure is 0 Pa, or if the backflow phenomenon occurs, the total pressure is 0 Pa.
2.3.3. Other Boundary Conditions
The symmetric boundary conditions with zero relative pressure were employed for the boundaries on the sides and top of the basin, with relative pressure of 0 Pa, i.e., free-slip wall conditions. The solid walls (no slip) were selected for the ground and building surfaces.
The SIMPLE algorithm was adopted as the solution method, i.e., the velocity and pressure fields were assumed to be independent of each other. The second-order windward format was adopted for the convective term difference format to increase the accuracy. The residual of 10
−4 was set as the criterion for iterative convergence [
30,
31,
32,
33].
2.4. Wind Tunnel Test Experimental Design
The wind tunnel tests for the three types of greenhouses were performed in the DHS-500x500/700x700-II circular low-speed wind tunnel (Dimension: 10 m × 3.5 m × 2.5 m, length, width and height) laboratory at Jiangxi Agricultural University, with turbulence ≤ 0.5% and the flow velocities (0.2 m s
−1 to 40 m s
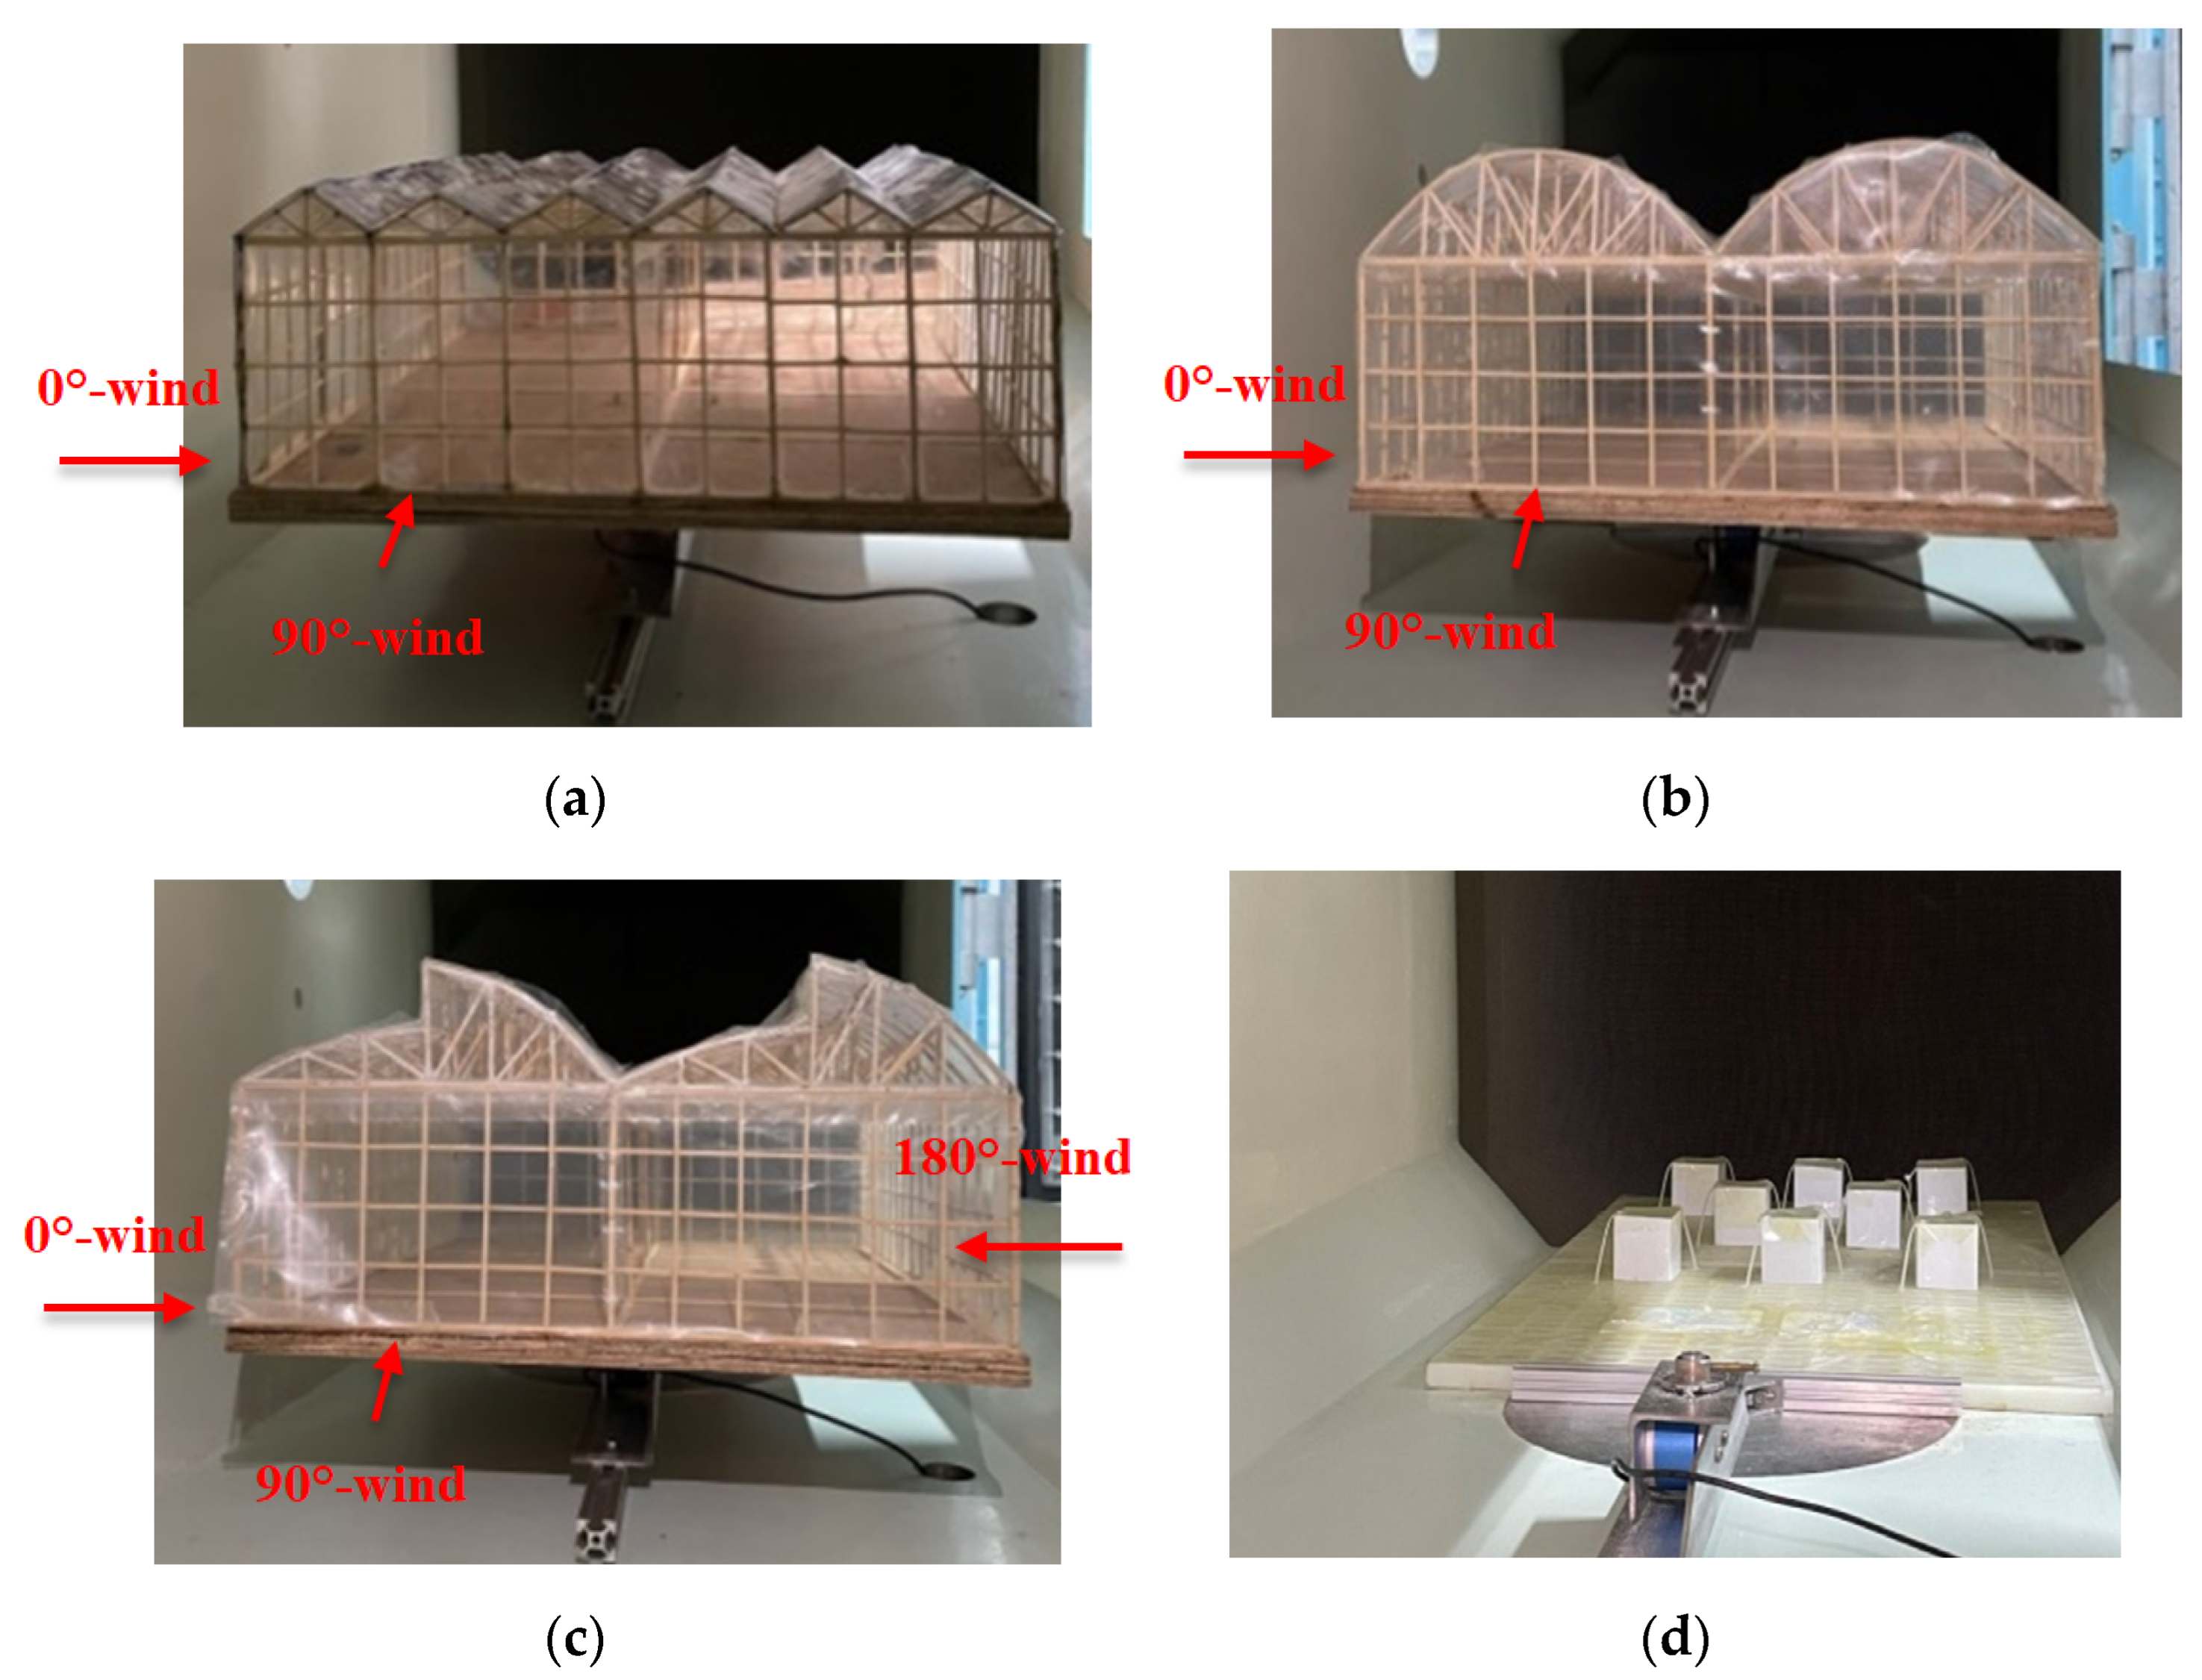
−1). Two working sections were set, the one we select was set as 700 mm × 700 mm (octagonal). The static torsion data were acquired using the FC-USB3200 data acquisition device (Shanghai Nechtronic Testing Technology Co., Shanghai, China), with a range of 5 N m and its accuracy ± 0.5%. The tests were performed at 15° intervals, with seven sets of tests for each structural type of greenhouse, whereas 13 sets of tests were performed for Saw-tooth greenhouses from 0°-wind to 180°-wind. The basic wind pressure was obtained based on the Chinese “Code for Structural Loads of Buildings” (GB 50009-2012) using the basic wind speed measured at 50-year of recurrence and 10-min time distance. Moreover, the models (
Figure 5a–c) at a design scaling ratio of 1:50 were examined. The skeleton of the greenhouse was made of light and rigid bamboo strips, and the surface covering material was made of 0.8mm-thick PC resistant board and 0.12-mm thick greenhouse film. The wind tunnel test wind speed of the model was obtained in accordance with the principle of similarity criterion by comparing the first-order intrinsic frequencies of the actual building and the model. On that basis, the corresponding test wind speed at a height of 0.6 m in the wind tunnel was calculated separately, and the results were 8.5 m s
−1 for the Venlo type greenhouse, 11.88 m s
−1 for the Round-arch type greenhouse and 10.51 m s
−1 for the Saw-tooth type greenhouse.
Table 4 lists the sampling methods and data processing methods.
2.5. Correction of Experimental Data
Eight cube models were set in front of the windward side of the greenhouse to simulate the actual terrain (
Figure 3d) to consider the effect of surrounding buildings on the greenhouse. The blockage rate of the model was 19 % in the X-direction and 31 % in Y-direction at the model scaling ratio of 1:50, and the blockage effect was high. When the winding path was blocked by the model, the wind speed around the model was larger than the actual situation, and the wind load acting on it increased. To solve the problem of the excessive blockage effect, the correction factor based on the relationship between blockage area and wind speed flow per unit time was calculated. The blockage correction factor E
x of 0.7 in the X direction, the blockage correction factor E
y of 0.5 in the Y direction.
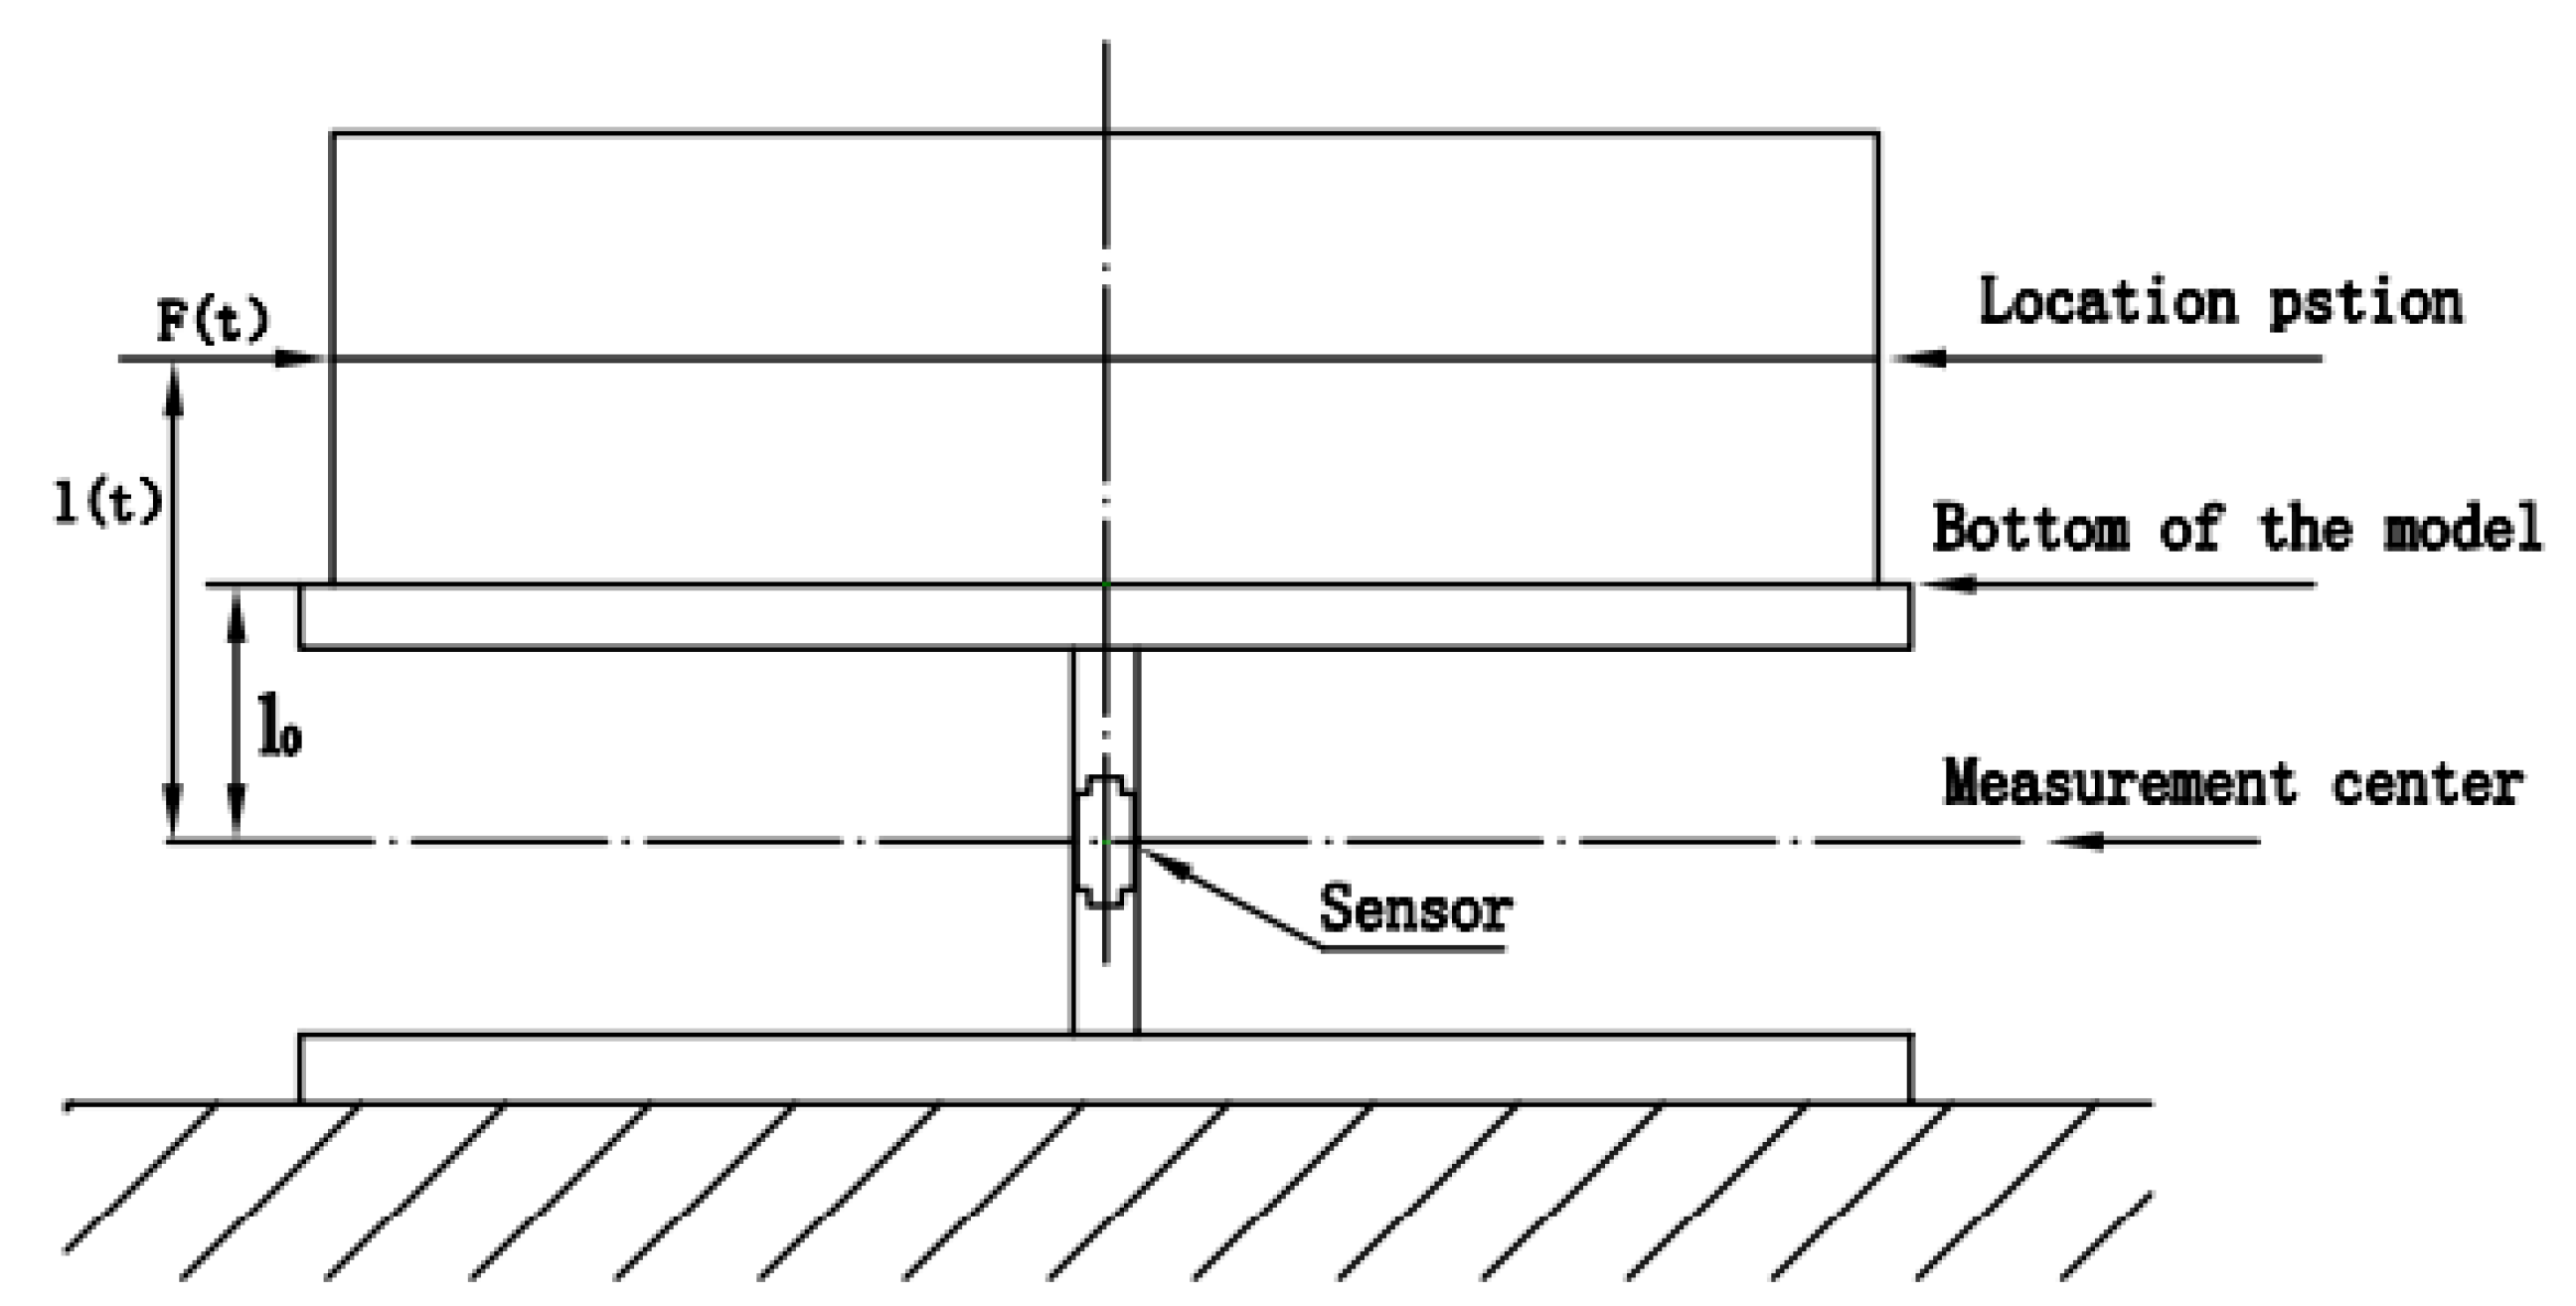
Moreover, since the torque center of the greenhouse was different from the measurement center, the measured overall force should be corrected, which is expressed in Equation (6). As depicted in
Figure 6, the torque measurement center of the sensor was l
0 downwards from the bottom of the model. The measured torsional rejection and the position of the load acted as the center of the model, and the overall force of the building is expressed as follows:
where N
t denotes the torque measured by the test; l
(t) represents the distance between the load application position and the measurement center; l
0 expresses the distance from the bottom of the model to the measurement center.
According to the principle of Pythagorean theorem, the X-direction force FX and Y-direction force FY are obtained, respectively.
2.6. Test Measurement Coefficient
The respective wind coefficient measured in the test is defined in Equations (7) and (8) as follows:
where
denote X-direction wind coefficient, Y-direction wind coefficient, overturning moment in X-direction (around the
Y-axis), and overturning moment in Y-direction (around the
X-axis), respectively;
represents the reference speed pressure, which is expressed in Equation (9):
where
is 0.15;
(Pa) denotes the velocity pressure at the position
above the wind tunnel floor, of which the value is obtained by the wind speed of
;
is 0.2 m (equivalent to height of 10 m above the ground);
,
,
represent the feature width, depth, and eave height of the model, respectively. Thus,
is 0.384 m (equivalent to the width of 19.2 m),
is 0.48 m (equivalent to the depth of 24 m),
is 0.12 m (equivalent to eave height of 6 m), and
is 34.32 N m
−2.
Introducing the wind tunnel blockage correction factor E, the wind coefficients are defined in Equations (10) and (11) as follows:
where
,
denote corrected X-direction wind coefficient, the corrected Y-direction wind coefficient.
2.7. Wind Load on the Main Structure
The design wind speed based on the greenhouse structure was 30 m s
−1 (10 m height above ground) for calculating the wind resistance of the main structure of the greenhouse. Thus, the design velocity pressure at a reference height of 6m is expressed as
= 482.63 N m
−2. The overall basal shear (perpendicular to Z-axis, pointing to X/Y-axis) and overturning moment in the X/Y direction of the greenhouse are expressed in Equations (12) and (13) as follows:
where
denotes the overall shear force in the X-direction of the greenhouse;
represents the overall shear force in the Y-direction of the greenhouse.
3. Results
3.1. Wind Pressure Coefficient
The pressure coefficient was introduced as a response result. The greenhouse surface wind load pressure coefficient is a dimensionless quantity coefficient, which is expressed in Equation (14). To explore the wind pressure coefficient at the location of the most unfavorable load action on the greenhouse, extreme value results were employed to characterize the wind pressure characteristics of the greenhouse surface.
where
denotes the wind pressure coefficient;
is the pressure value at an arbitrary point i on the greenhouse surface (Pa);
expresses the static pressure at the point i (Pa);
is the wind velocity at the reference height(m s
−1);
represents the air density (kg m).
3.2. Numerical Analysis Results
Since the Venlo type and the Round-arch type greenhouses are in good symmetry, the result of 90°-wind to 180°-wind direction was also recorded though it is sufficient studying the response rules of the wind pressure from 0°-wind to 90°-wind direction. However, the surface wind pressure changes under the action of wind loads are different, due to the different heights of the two types of windward sides of the Saw-tooth greenhouse, so it must be studied from 0°-wind to 180°-wind direction.
Table 5 and
Table 6 list the calculation results of the extreme values of the respective wind pressure coefficient and the average wind pressure coefficient in the X/Y direction.
As depicted in
Table 4, the variance of the maximum wind pressure coefficient (
) value for the three types of greenhouses was less than 0.8% for the respective wind angle at 30 m s
−1 wind speed. Nevertheless, the variance of the minimum
value was less than 4%. Since the minimum wind pressure was caused by negative wind pressure, which generally acted on the roof of the greenhouse, it was further confirmed that the load resistance of the main structure can be increased by changing the shape of the roof. An average 16.0% increase in the load resistance of Venlo type compared with Saw-tooth and Round-arch type greenhouses.
As depicted in
Table 5, the results showed an average 5.5% increase in the load resistance of Venlo type compared with Saw-tooth and Round-arch type greenhouses in the X-direction, as well as an average 22.6% increase in the Y-direction, suggesting that the appearance characteristics of Venlo type greenhouse effectively increase the stiffness of the sidewalls, such that it exhibits high wind resistance.
The simulation results were primarily analyzed in terms of 0°, 45° and 90° characteristic directions of the wind.
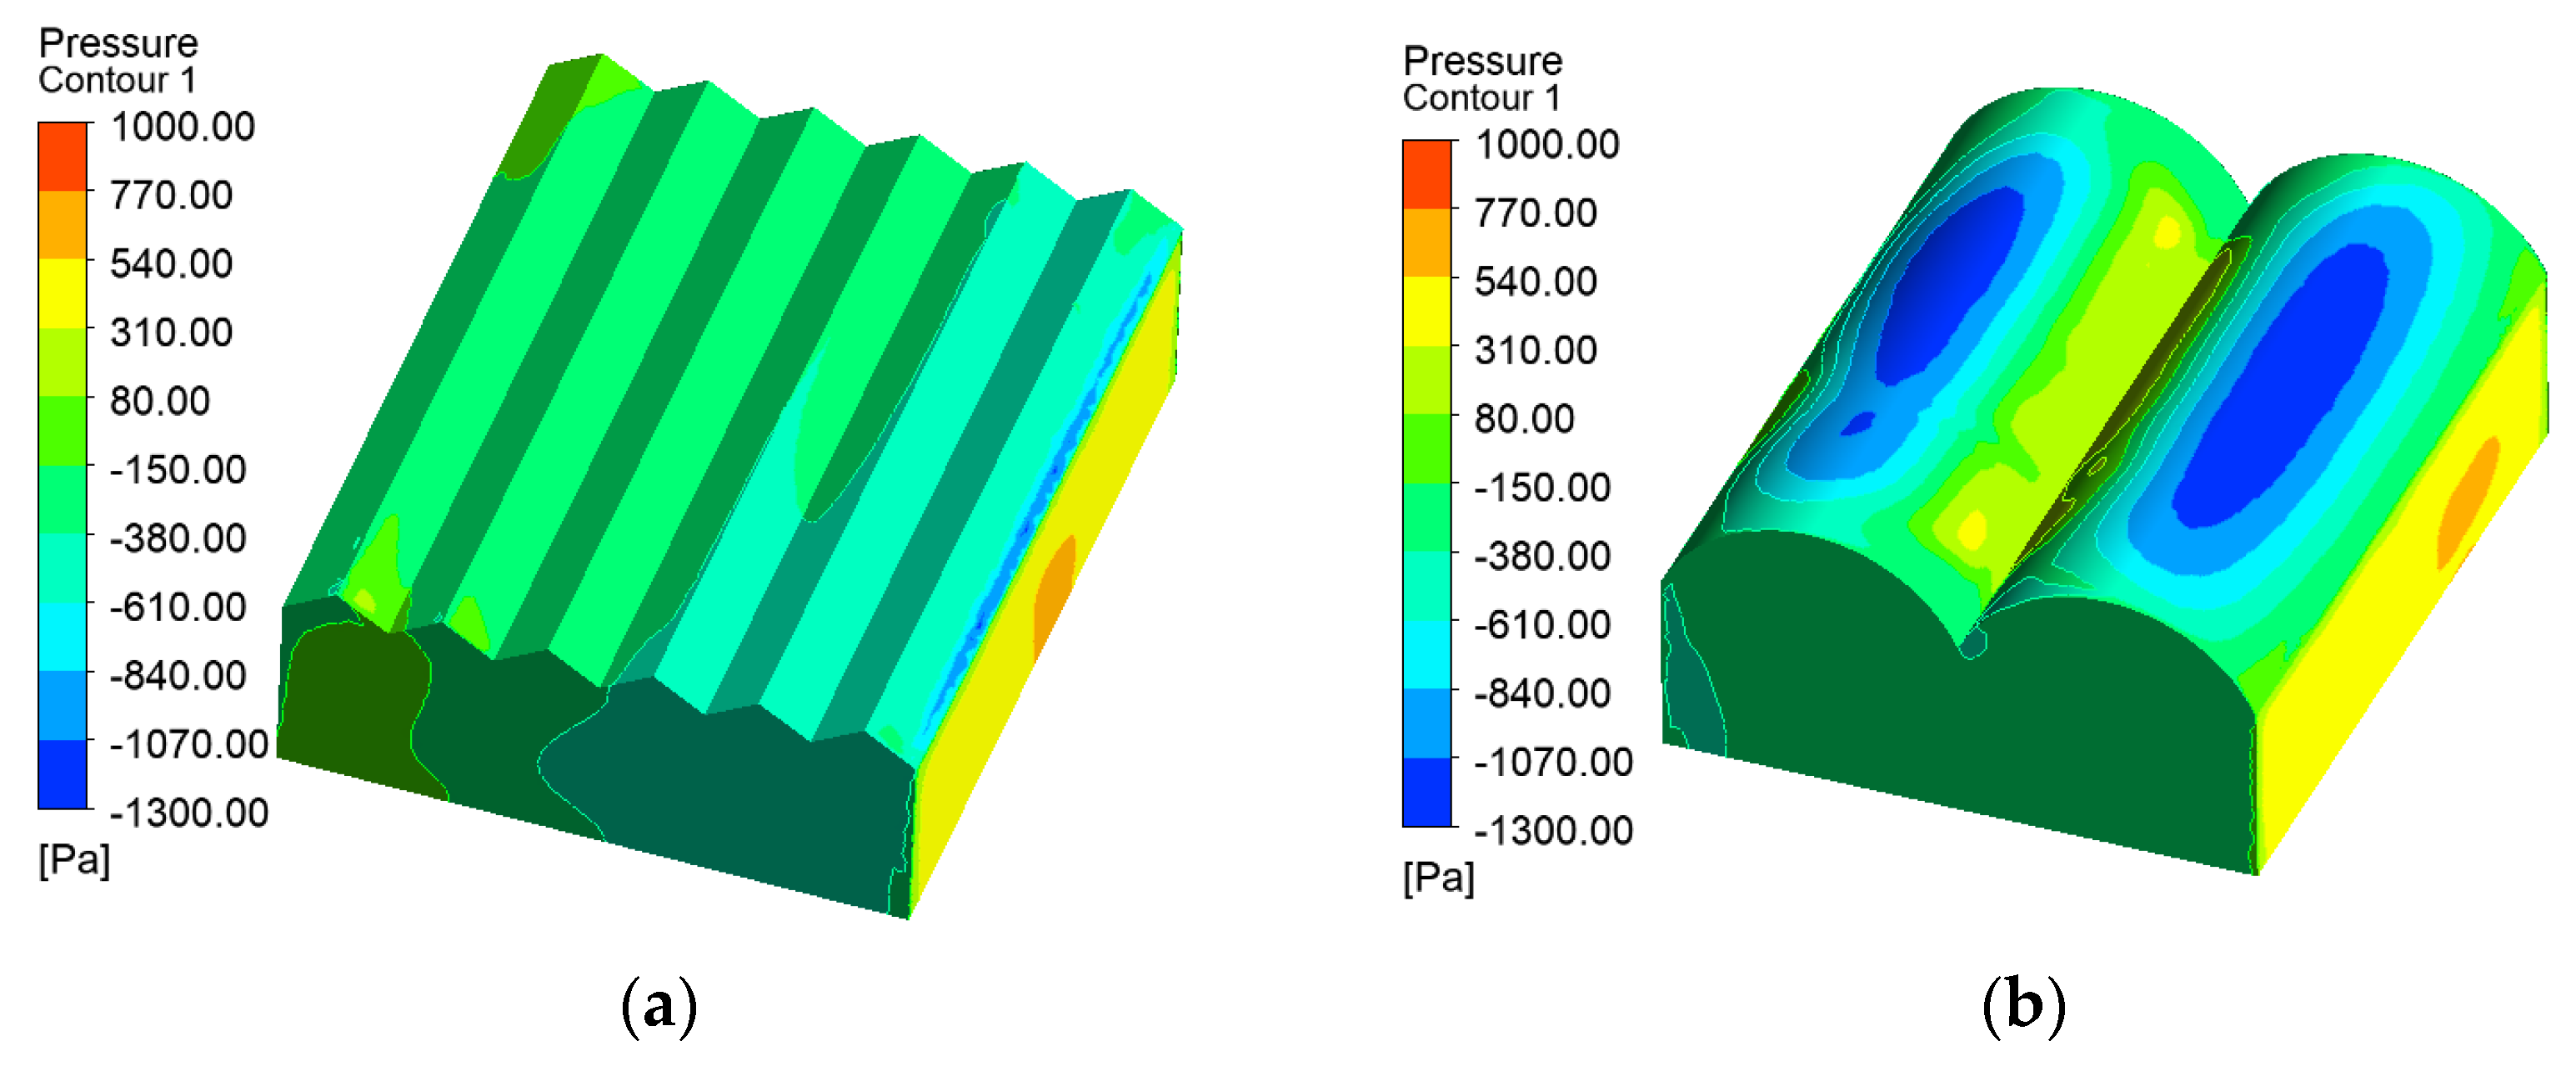
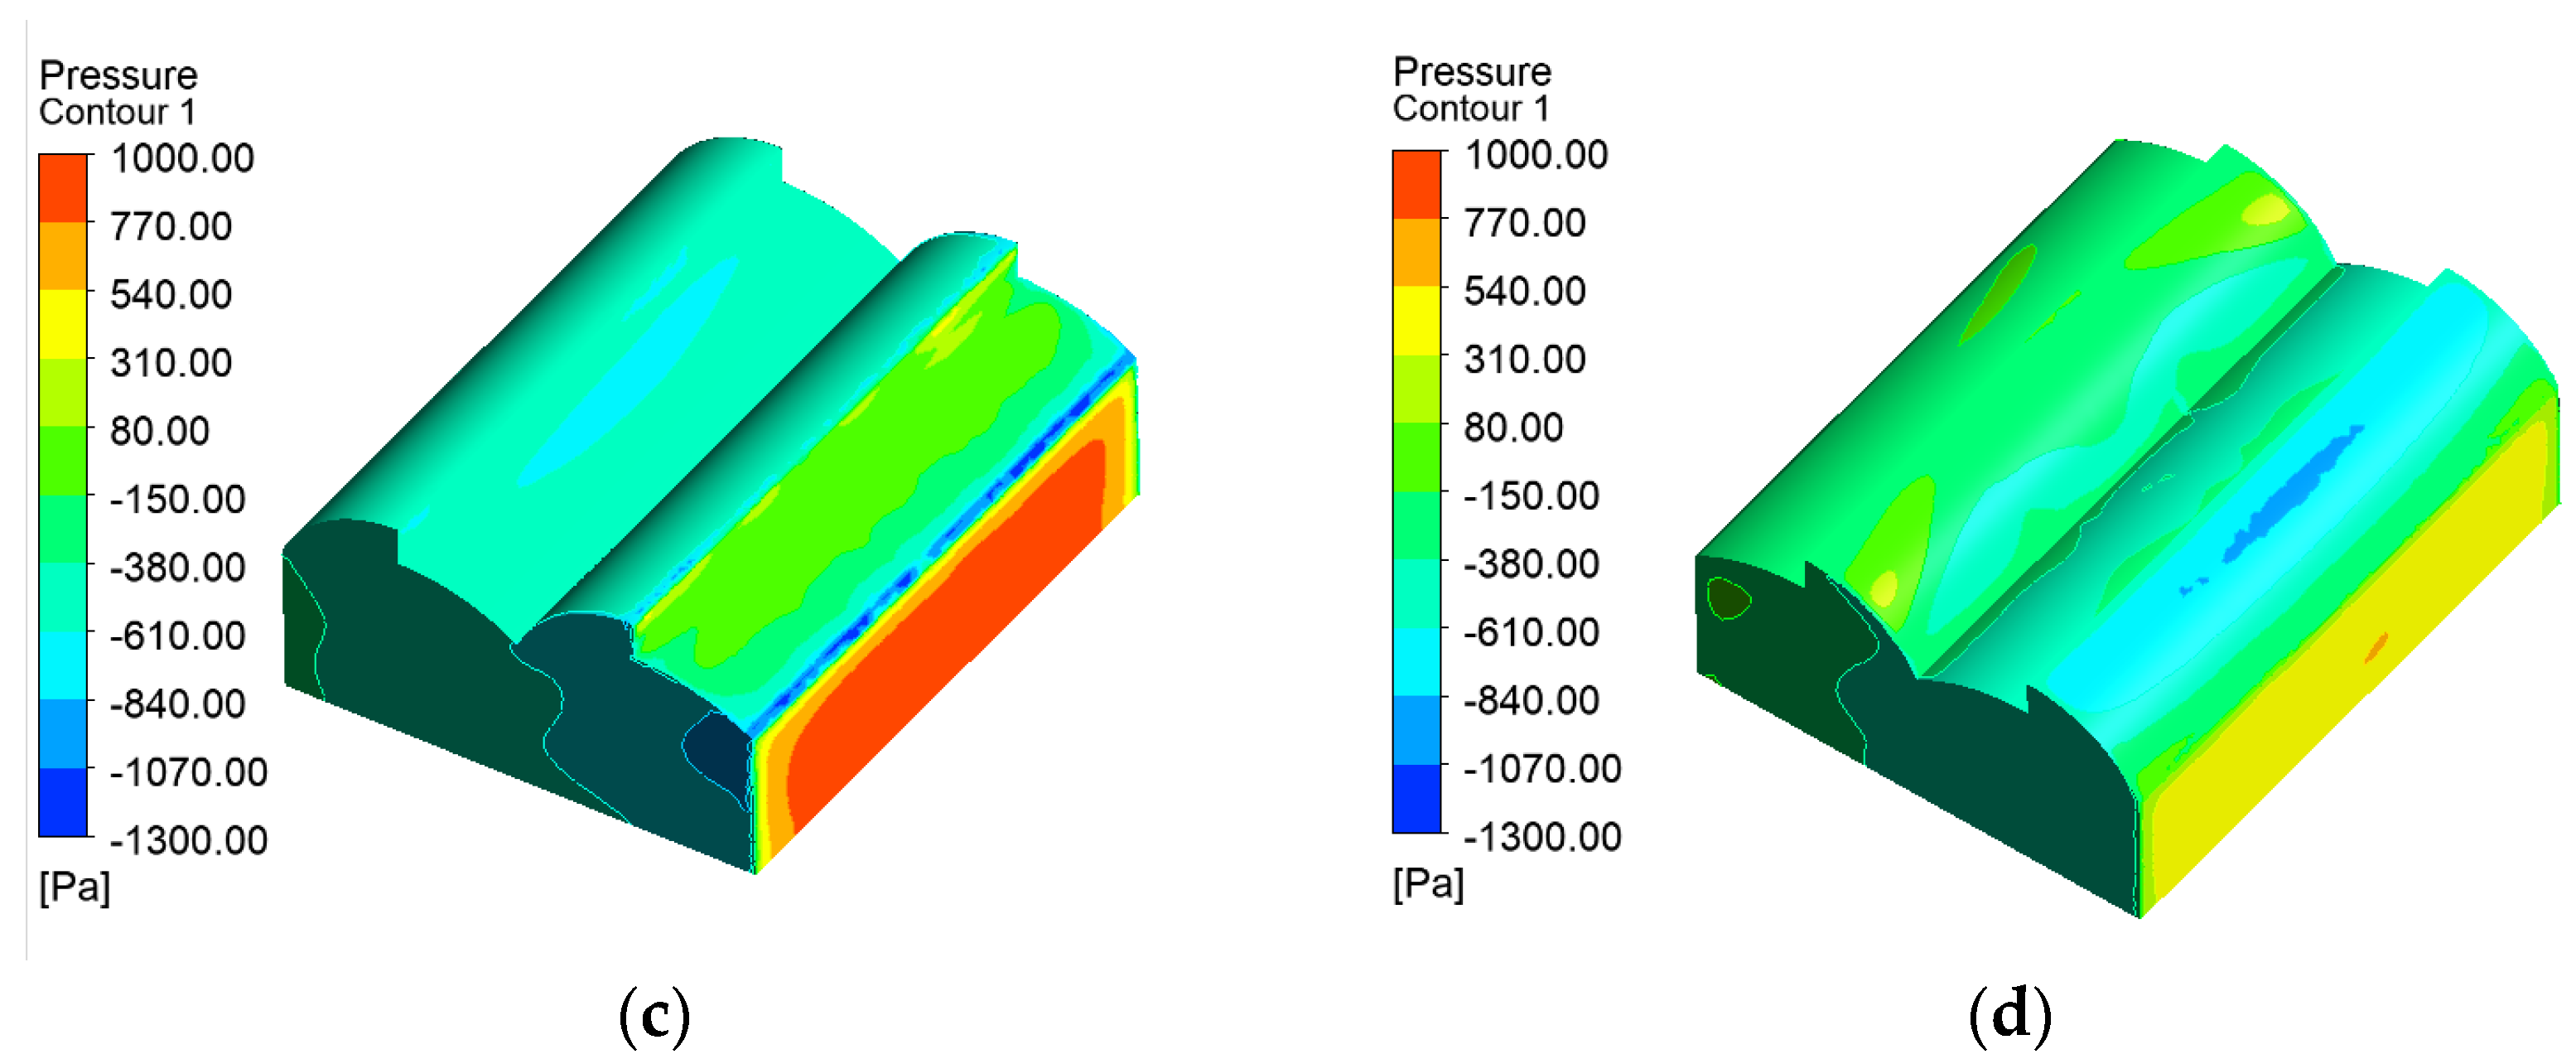
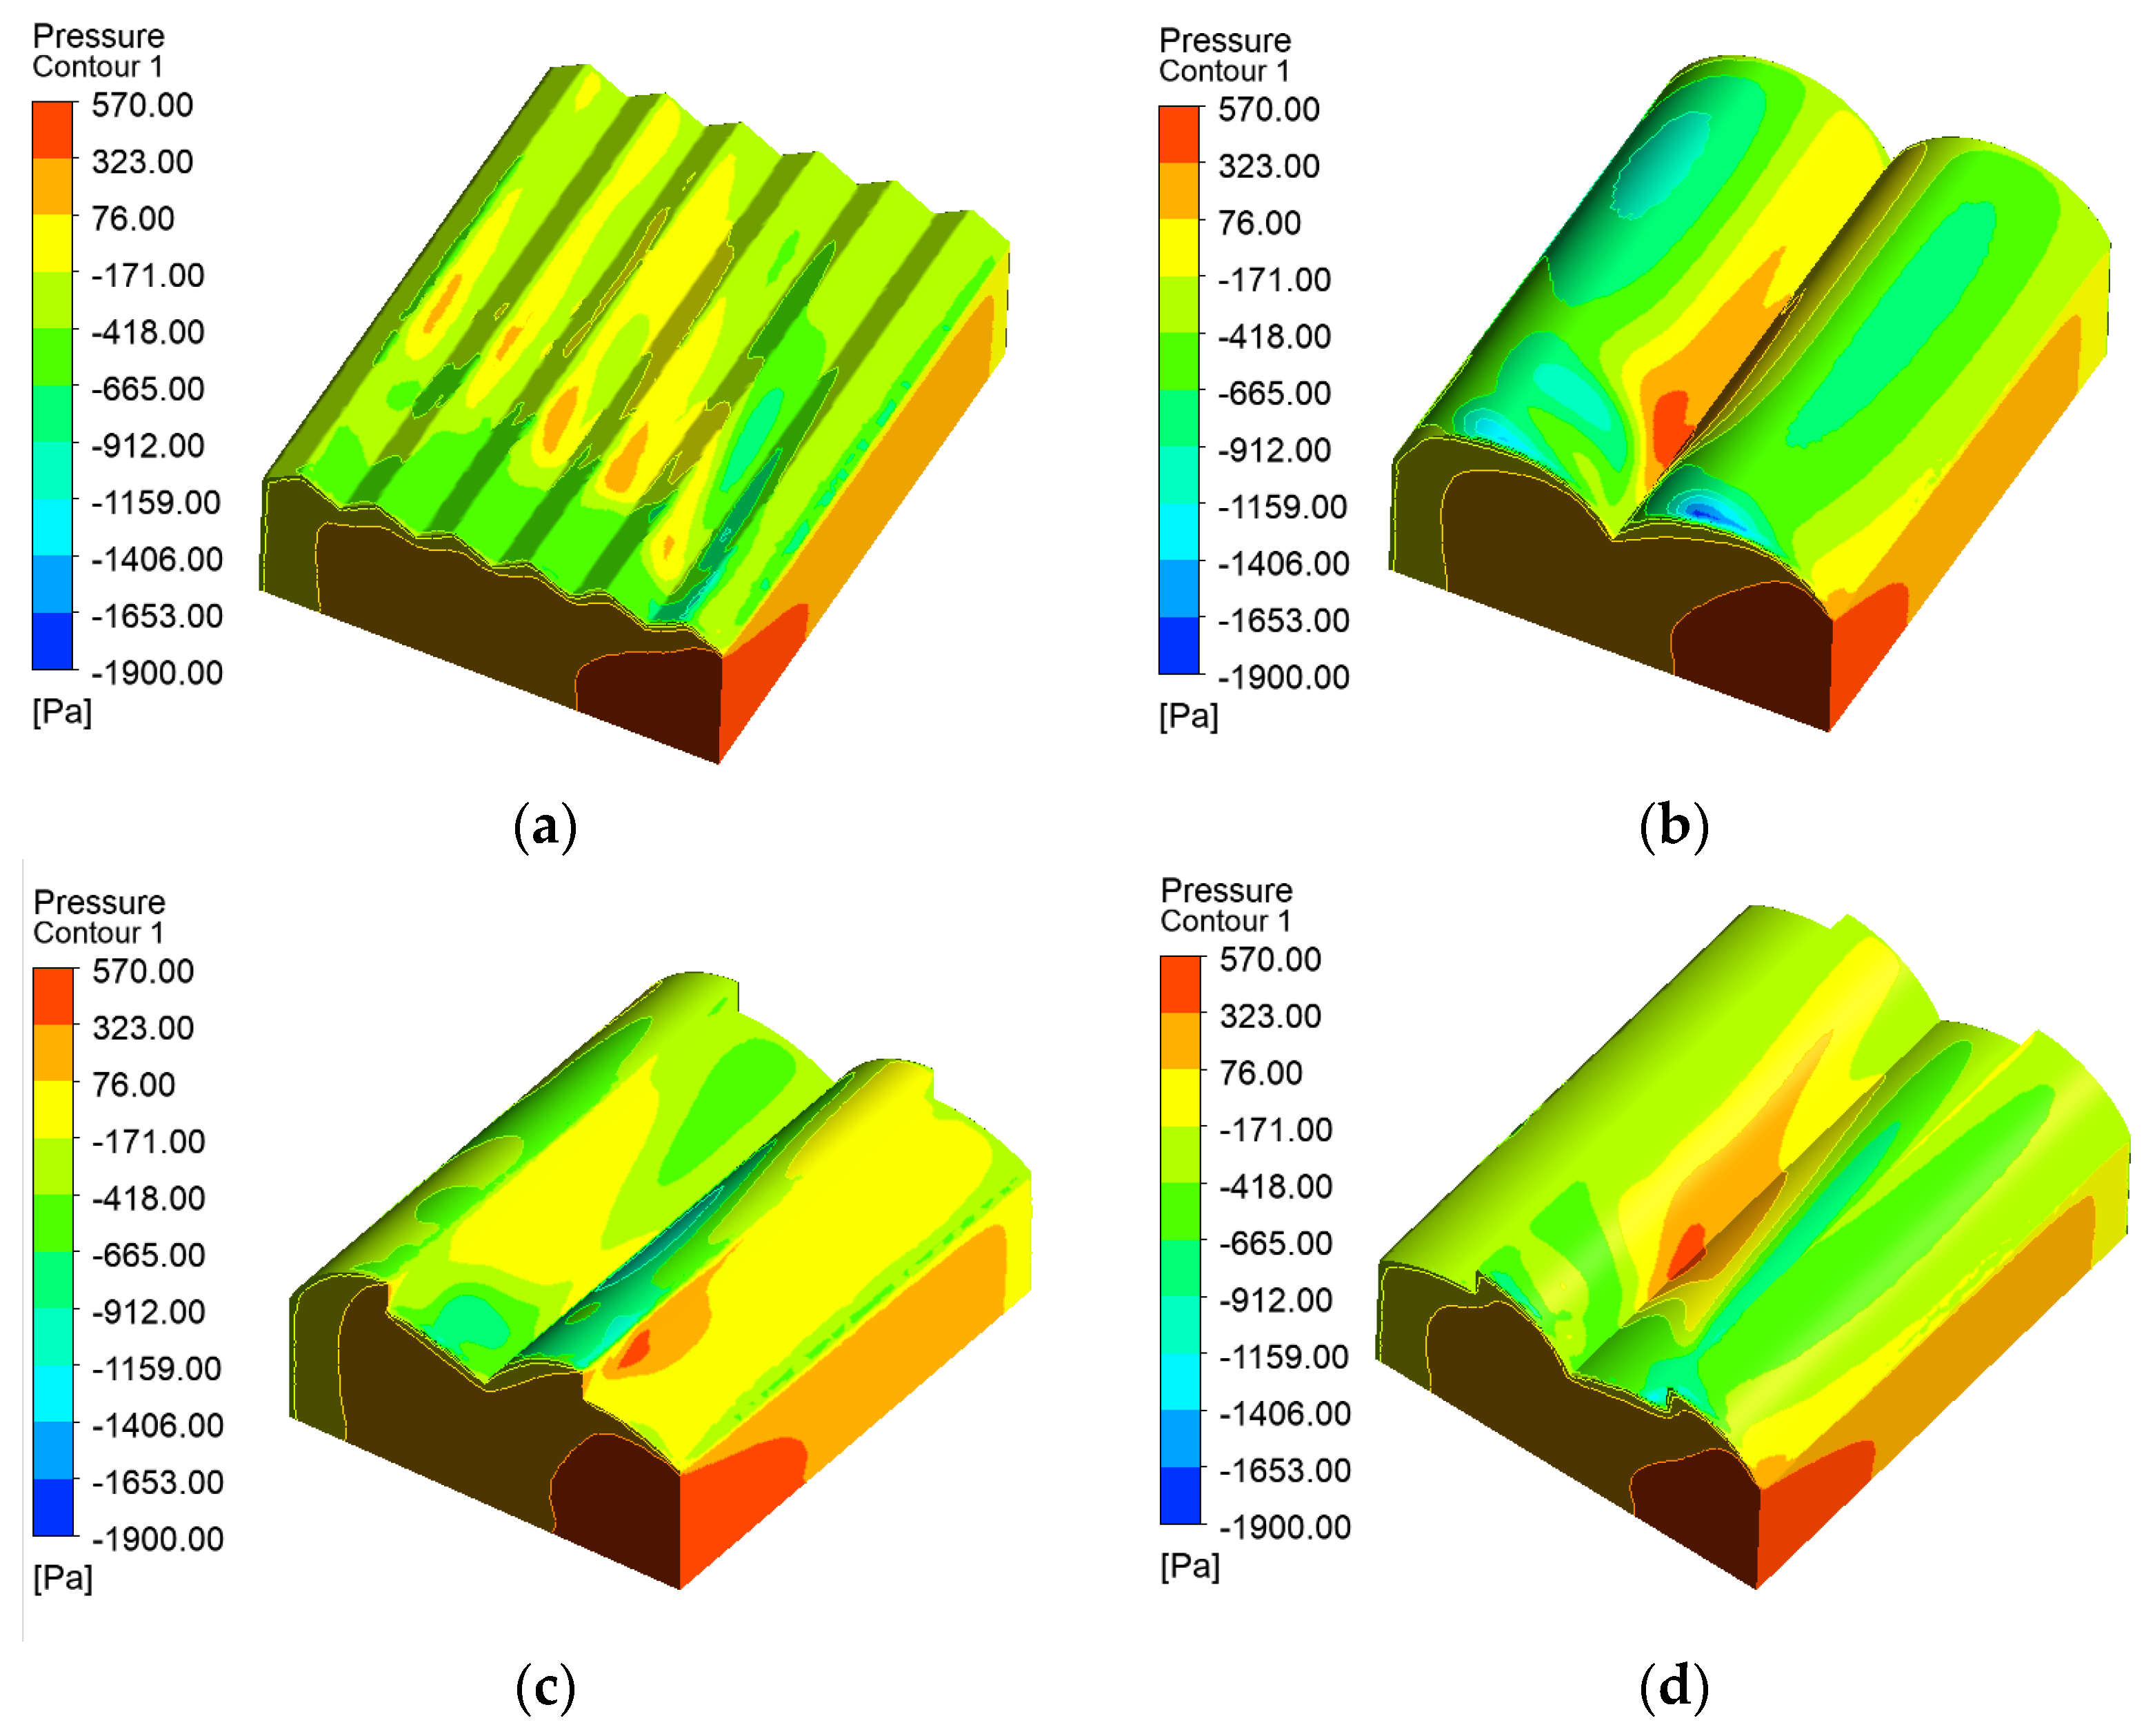
Figure 7 presents the wind pressure distribution counters of the respective greenhouse with a 0°-wind direction and the corresponding Saw-tooth type with a 180°-wind direction, revealing a symmetrical distribution of wind pressure. Some similarities are identified in the wind pressure distribution contours. The maximum positive pressure was located on the windward side, and the maximum negative pressure was located on the first windward roof. The roof and both sides of the gable walls were under negative wind pressure. Certain similarities were identified between the Round-arch type and the Saw-tooth type greenhouse of 180°-wind (
Figure 7b,d). The maximum positive pressure was located on the windward side, and the maximum negative pressure was located on the top of the vault. The roof and both sides of the gable walls were under negative wind pressure. The above results were well consistent with the change of the structural shape factor of wind load of the greenhouse of the 0°-wind direction in the Chinese “Code for Structural Loads of Agricultural Greenhouses” (GB/T51183-2016).
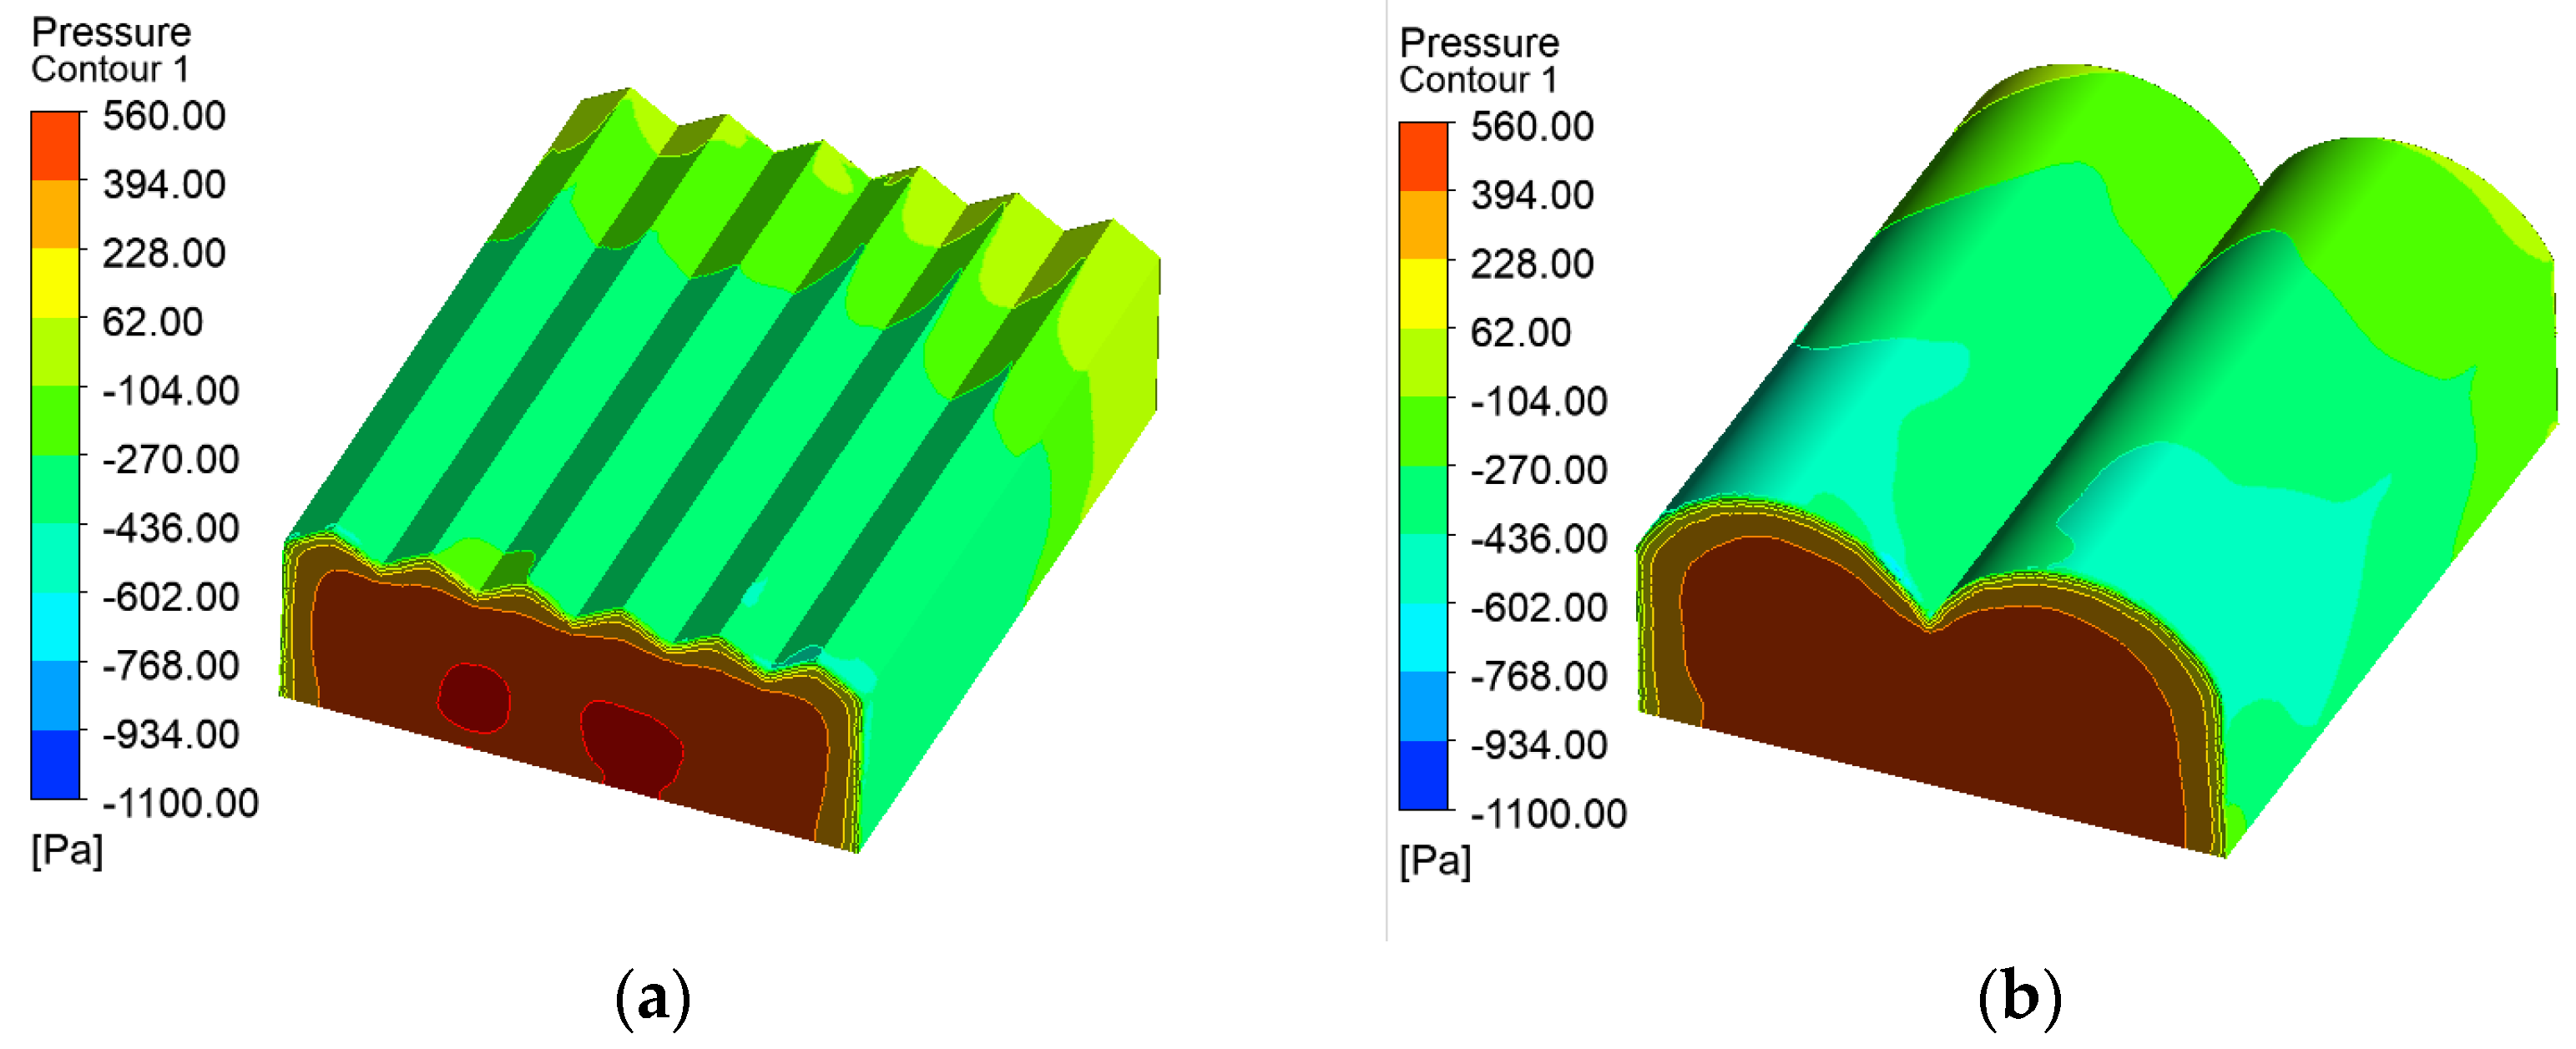
Figure 8 presents the counters of wind pressure distribution on the greenhouse surface at a 45°-wind direction. The maximum wind pressure was identified at the junctions of the gable and the side wall that faced the wind. The gable and side walls were basically under positive pressure. The leeward roof of the roof was basically under negative pressure. However, there were also positive pressures on the windward slopes of the roof.
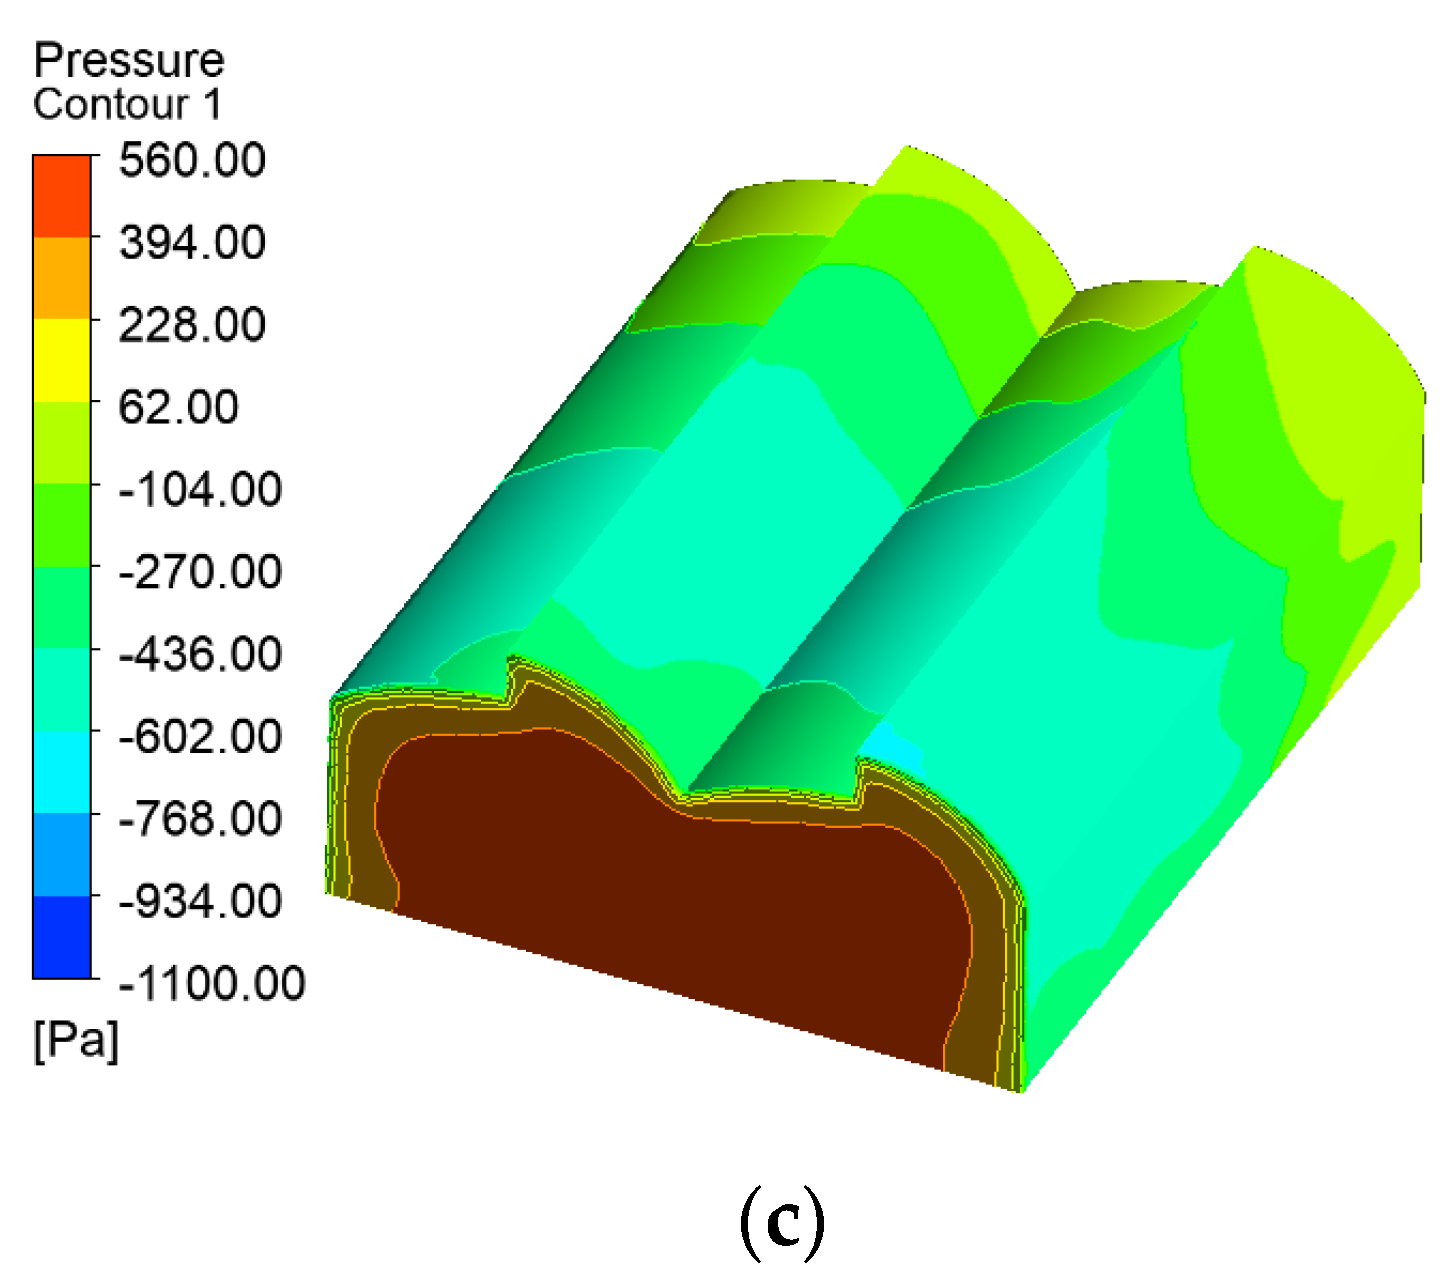
Figure 9 presents the counters of wind pressure distribution on the greenhouse surface in 90°-wind. The wind pressure distribution was symmetrical along the vertical gable centerline, with positive pressure on the windward side of the gable, as well as large negative pressure on the side walls and roof. Its distribution characteristics were well consistent with the change of the structural shape factor of wind load of the greenhouse of 90°-wind in the Chinese “Code for Structural Loads of Agricultural Greenhouses” (GB/T51183-2016).
3.3. Wind Tunnel Test Results
Based on the corrected torque values, the average values of overall shearing force in X-direction and overall shearing force in Y-direction for three types of the greenhouse of different wind directions can be obtained. The trends of wind pressure coefficients for each type of greenhouse display good consistency (
Table 7). The result indicated that the maximum wind pressure coefficient in the Y-direction was identified in the 75°-wind direction. However, there are some different wind direction distributions of the maximum wind pressure coefficient in the X-direction. The maximum value of the Venlo type greenhouse appeared in a 0°-wind direction. The maximum value of Round-arch type and Saw-tooth type greenhouses appeared in a 30°-wind direction. The average wind pressure coefficients for the respective greenhouse in X-direction and Y-direction at different wind angles are listed in
Table 8.
3.4. Comparative Analysis of the Two Results
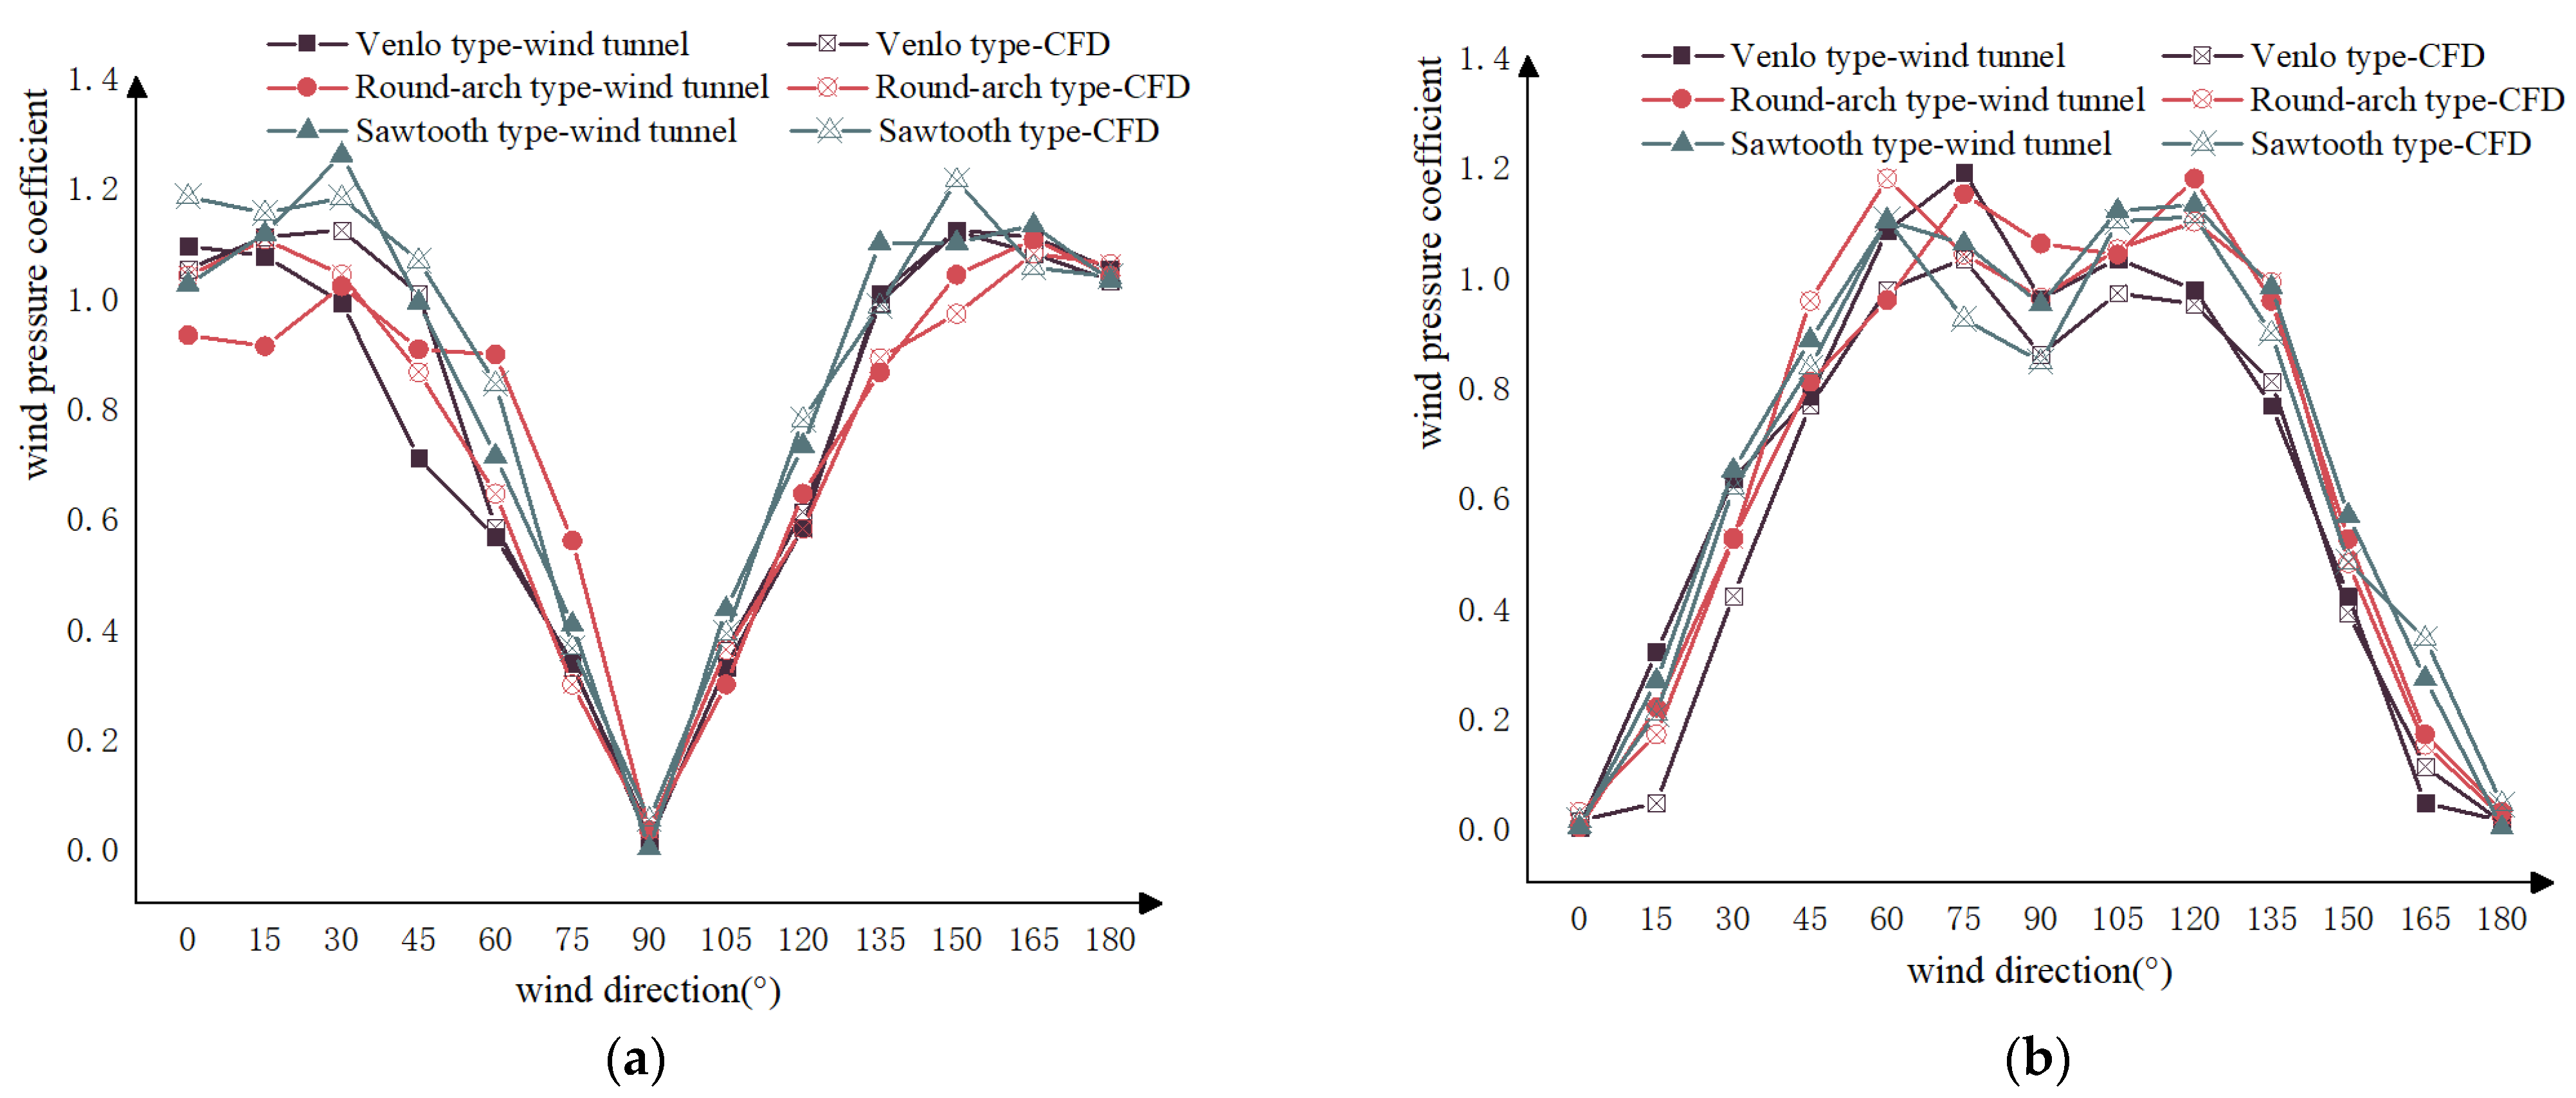
By comparing the trends of the overall wind pressure coefficients in the respective wind direction in X-direction and Y-direction wind tunnel tests and CFD simulation experiments (
Figure 10).
Figure 10 is plotted from the data in
Table 8. First, all types of greenhouses show good symmetry between 0°-wind to 90°-wind and 90°-wind to 180°-wind directions. Moreover, the X-directional wind pressure coefficient (
) value was 0.1–0.6 higher when the Saw-tooth greenhouse was loaded with the roof of 3 m-arch height compared with the roof of 1.5 m-arch height (its value is also presented in
Figure 7c,d). The same results are presented in the Y-direction.
As depicted in
Figure 10b, the wind pressure coefficients from the 60°-wind to 90°-wind direction significantly decreased in the segment, while there was an increase from the 90°-wind to 120°-wind direction, with the range of change ± 0.3. The above result suggests that this type of incoming flow poses the most significant threat to the greenhouse structure.
The 75°-wind direction had the maximum effect on the Y-direction of the greenhouse, and the 30°-wind direction had the maximum effect on the X-direction. Both the results were verified through wind tunnel tests and CFD simulations. It is accordingly recommended that besides the stability and reliability of the greenhouse structure in the 0°-wind and 90°-wind directions, designers should consider the effect of the most adverse wind direction on the greenhouse structure when designing greenhouse structures.
From 0°-wind to 45°-wind angle, a certain deviation (±0.2) was identified in the X-direction wind pressure coefficient values obtained from the same direction of incoming direction between the wind tunnel test and CFD simulation. From 60°-wind to 90°-wind direction, a certain deviation (±0.2) was identified in the Y-direction wind pressure coefficient values calculated according to the same direction incoming direction between the wind tunnel test and CFD simulation, thus resulting in intense regional turbulent motion and complex winding characteristics. Analogously is a nonlinear problem. As a result, the next experimental analysis should be revised for the effect of wind gusts intriguingly on the greenhouse structure.
4. Conclusions
This study was conducted based on wind tunnel tests and CFD simulations for greenhouses with different roof types. The extreme values of wind pressure distribution on the greenhouse surface were investigated, as well as the average wind pressure distribution coefficients in the X-direction and Y-direction from 0°-wind to 180°-wind direction. Through the comparison of the experiment through the wind tunnel tests and CFD simulations, the following conclusions were drawn for the response results of greenhouse structures under different wind directions.
(1) The distribution of the wind pressure coefficients on the surface of three types of greenhouses under the same wind direction was compared. The negative wind pressure on the roof and the positive windward pressure of the Venlo-type greenhouse was identified, significantly lower than the other two types of greenhouses, suggesting that the physique characteristic of the Venlo-type greenhouse exhibits better wind resistance.
(2) The three types of greenhouse structures showed an excellent consistency in the characteristics of wind pressure distribution. The positive pressure was on the windward, while the negative pressure was on the roof. Moreover, the negative pressure was significantly greater than the positive pressure, suggesting that the roof systems are highly susceptible to damage in negative pressure.
(3) It is recommended that the designers should strengthen the structure in the stressed areas of the greenhouse (e.g., the ridge, the joints between the walls and the side walls, and the roof).
Author Contributions
Conceptualization, J.Z. and S.X.; methodology, J.Z. and L.Z.; software, S.X. and B.X.; validation, H.H., B.X. and X.W.; formal analysis, S.X. and B.X.; investigation, X.C.; resources, J.Z.; data curation, H.H.; writing—original draft preparation, S.X.; writing—review and editing, H.H. and X.W.; supervision, L.Z. All authors have read and agreed to the published version of the manuscript.
Funding
This research was funded by Jiangxi Province Modern Agricultural Research Collaborative Innovation Project, grant number JXXTCX201802.
Institutional Review Board Statement
Not applicable.
Informed Consent Statement
Not applicable.
Data Availability Statement
Not applicable.
Acknowledgments
This study is based on work supported by Jiangxi Province Modern Agricultural Research Collaborative Innovation Project (Project No.JXXTCX201802) for the authors. The financial support is gratefully acknowledged. The views, conclusions, and opinions found in this study are those of the authors and do not necessarily indicate the views of the proponents. Thanks for Quan Zhang providing language help and writing assistance.
Conflicts of Interest
The authors declare no conflict of interest.
References
- Fernández-García, M.S.; Vidal-López, P.; Rodríguez-Robles, D.; Villar-García, J.R.; Agujetas, R. Numerical Simulation of Multi-Span Greenhouse Structures. Agriculture 2020, 10, 499. [Google Scholar] [CrossRef]
- Maraveas, C. Wind Pressure Coefficients on Greenhouse Structures. Agriculture 2020, 10, 149. [Google Scholar] [CrossRef]
- Cai, W.; Yuan, J.; Qiao, K.; Lu, J.S. Numerical simulation and research on wind pressure in a round-arch greenhouse. J. Southwest Norm. Univ. 2014, 39, 92–95. [Google Scholar]
- Yu, H.Y. Research on New Type Large-Span Greenhouse Structure System and Nodes. Master’s Thesis, Hebei University of Technology, Tianjin, China, 2015. [Google Scholar]
- Fang, H.; Yang, Q.C.; Zhang, Y.; Cheng, R.F.; Zhang, F.; Lu, W.; Liu, H. Simulation of temperature field of large-span thermal insulation greenhouses with different trends based on CFD. J. China Agric. Univ. 2017, 22, 133–139. [Google Scholar]
- Peng, Y.; Zhao, W.; Ai, X. Field measurement and CFD simulation of wind pressures on rectangular attic. Wind Struct. Int. J. 2019, 29, 487–504. [Google Scholar]
- Jiang, H. Wind-Induced Response Control of the Cantilevered End of a Large-Span Grid Roof. Master’s Thesis, Beijing University of Civil Engineering and Architecture, Beijing, China, 2021. [Google Scholar]
- Li, Z.H.; Peng, Y.X.; Qin, C.; Yang, X.W. Experimental study on non-Gaussian distribution characteristics of fluctuating wind loads on large-span curved roofs. Ind. Archit. 2021, 51, 84–89. [Google Scholar]
- Bijad, E.; Delavar, M.A.; Sedighi, K. CFD simulation of effects of dimension changes of buildings on pollution dispersion in the built environment. Alex. Eng. J. 2016, 55, 3135–3144. [Google Scholar] [CrossRef]
- Li, B.; Liu, J.; Luo, F.; Man, X. Evaluation of CFD Simulation Using Various Turbulence Models for Wind Pressure on Buildings Based on Wind Tunnel Experiments. Procedia Eng. 2015, 121C, 2209–2216. [Google Scholar] [CrossRef]
- Boulard, T. Advantages and constraints of CFD greenhouse modelling. Acta Hortic. 2011, 893, 145–153. [Google Scholar] [CrossRef]
- Wang, D.L. Research on the Value Method of Basic Wind Pressure and Snow Pressure in Greenhouse; China Agricultural University: Beijing, China, 2005. [Google Scholar]
- Xie, Z.N.; Liu, S.; Shi, B.Q. Wind tunnel test research on the standard model of low-rise buildings. J. South China Univ. Technol. 2011, 39, 106–112. [Google Scholar]
- Wang, Y.J. Research on The Influence of Wind Field Parameters Based on CAARC Standard Model Wind Tunnel Test; Harbin Institute of Technology: Harbin, China, 2020. [Google Scholar]
- Shin, D.; Park, J.; Kang, B.; Kim, E.; Lim, H.; Lee, J. A Study of Wind Pressure Distribution for a Rectangular Building Using CFD. Korean J. Air Cond. Refrig. Eng. 2016, 28, 1–6. [Google Scholar]
- Engineering—Wind Engineering. Studies from Technical University of Denmark (DTU) Have Provided New Information about Wind Engineering (Towards a Standard CFD Setup for Wind Load Assessment of High-rise Buildings: Part 1-Benchmark of the Caarc Building). Energy Weekly News.
- Engineering—Civil Engineering. Reports from KEPCO Research Institute Highlight Recent Research in Civil Engineering (Static Wind Load Evaluation under Steady-State Wind Flow for 2-Edge Sloped Box Girder by Using Wind Tunnel Test). Energy Weekly News, 2020.
- Thordal, M.S.; Bennetsen, J.C.; Capra, S.; Kos, H.H.H. Towards a standard CFD setup for wind load assessment of high-rise buildings: Part 1—Benchmark of the CAARC building. J. Wind Eng. Ind. Aerodyn. 2020, 205, 104283. [Google Scholar] [CrossRef]
- Yang, Z.Q.; Li, Y.X.; Xue, X.P.; Huang, C.R.; Zhang, B. Wind Loads on Single-span Plastic Greenhouses and Solar Greenhouses. HortTechnology 2013, 23, 622–628. [Google Scholar] [CrossRef]
- Atmaca, M. Wind Tunnel Experiments and CFD Simulations for Gable-Roof Buildings with Different Roof Slopes. Acta Phys. Pol. A 2019, 135, 690–693. [Google Scholar] [CrossRef]
- Tao, Y. Numerical Simulation of Wind Loads on Different Roof Windows of Venlo Greenhouse; Southwest University: Chongqing, China, 2014. [Google Scholar]
- Kim, R.; Lee, I.; Kwon, K. Evaluation of wind pressure acting on multi-span greenhouses using CFD technique, Part 1: Development of the CFD model. Biosyst. Eng. 2017, 164, 235–256. [Google Scholar] [CrossRef]
- Kim, R.; Hong, S.; Lee, I.; Kwon, K. Evaluation of wind pressure acting on multi-span greenhouses using CFD technique, Part 2: Application of the CFD model. Biosyst. Eng. 2017, 164, 257–280. [Google Scholar] [CrossRef]
- Wind Tunnel Laboratory Research Committee (Ed.) Construction Wind Tunnel Experiment Guide; Revised Edition; Department of Mechanical Engineering: Tokyo, Japan, 2008. [Google Scholar]
- Jing, W.Y.; Yuan, K.Q.J. Numerical simulation and research on wind load of circular arch plastic greenhouse group based on CFD. Chin. J. Agric. Mach. 2016, 37, 70–74, 90. [Google Scholar]
- Yan, F.E.; Li, W.Q. Numerical simulation and research on wind pressure in spire-shaped greenhouses. J. Southwest Norm. Univ. 2017, 42, 127–132. [Google Scholar]
- Nebbali, R.; Roy, J.C.; Boulard, T. Dynamic simulation of the distributed radiative and convective climate within a cropped greenhouse. Renew. Energy 2012, 43, 111–129. [Google Scholar] [CrossRef]
- Peter, J.W.; Launder, B.E. The prediction of laminarization with a two-equation model of turbulence. Int. J. Heat Mass Transf. 1972, 15, 301–314. [Google Scholar]
- Wang, W.H. Structural Wind Load Theory and MATLAB Calculation; National Defence Industry Press: Beijing, China, 2018; pp. 3–4. [Google Scholar]
- Xiao, M.K.; Zhao, M.; Wang, T. Numerical simulation of wind-induced internal pressure of low-rise buildings with double-slope roofs. J. Huaqiao Univ. 2012, 33, 310–316. [Google Scholar]
- Li, M. Research on the Overall Performance of Greenhouse Structure Space Based on Stable Bearing Capacity; China Agricultural University: Beijing, China, 2012. [Google Scholar]
- Ha, T.; Lee, I.; Hwang, H.; Ha, J. Wind pressure coefficients determination for greenhouse built on a reclaimed land. Acta Hortic. 2014, 1037, 1001–1007. [Google Scholar]
- Cao, X.B. Stress Analysis and Optimization Design of Multi-Span Greenhouse Structure; Shanxi Agricultural University: Taiyuan, China, 2016. [Google Scholar]
Figure 1.
Perspective view of the three kinds of greenhouses in its computational domain. (a) Venlo Type; (b) Round-arch Type; (c) Saw-tooth Type; (d) Definition of each wind. Note: L, W, H represent the length, width, and height of the green house, respectively, and they are 24 m, 19.2 m, 6 m, respectively. is the wind angle; FX is the horizontal force in the X-direction; FY is horizontal force in the Y-direction; FD is the downwind horizontal force; FS is the horizontal force perpendicular to the wind direction; MT represents the torque around the Z-axis.
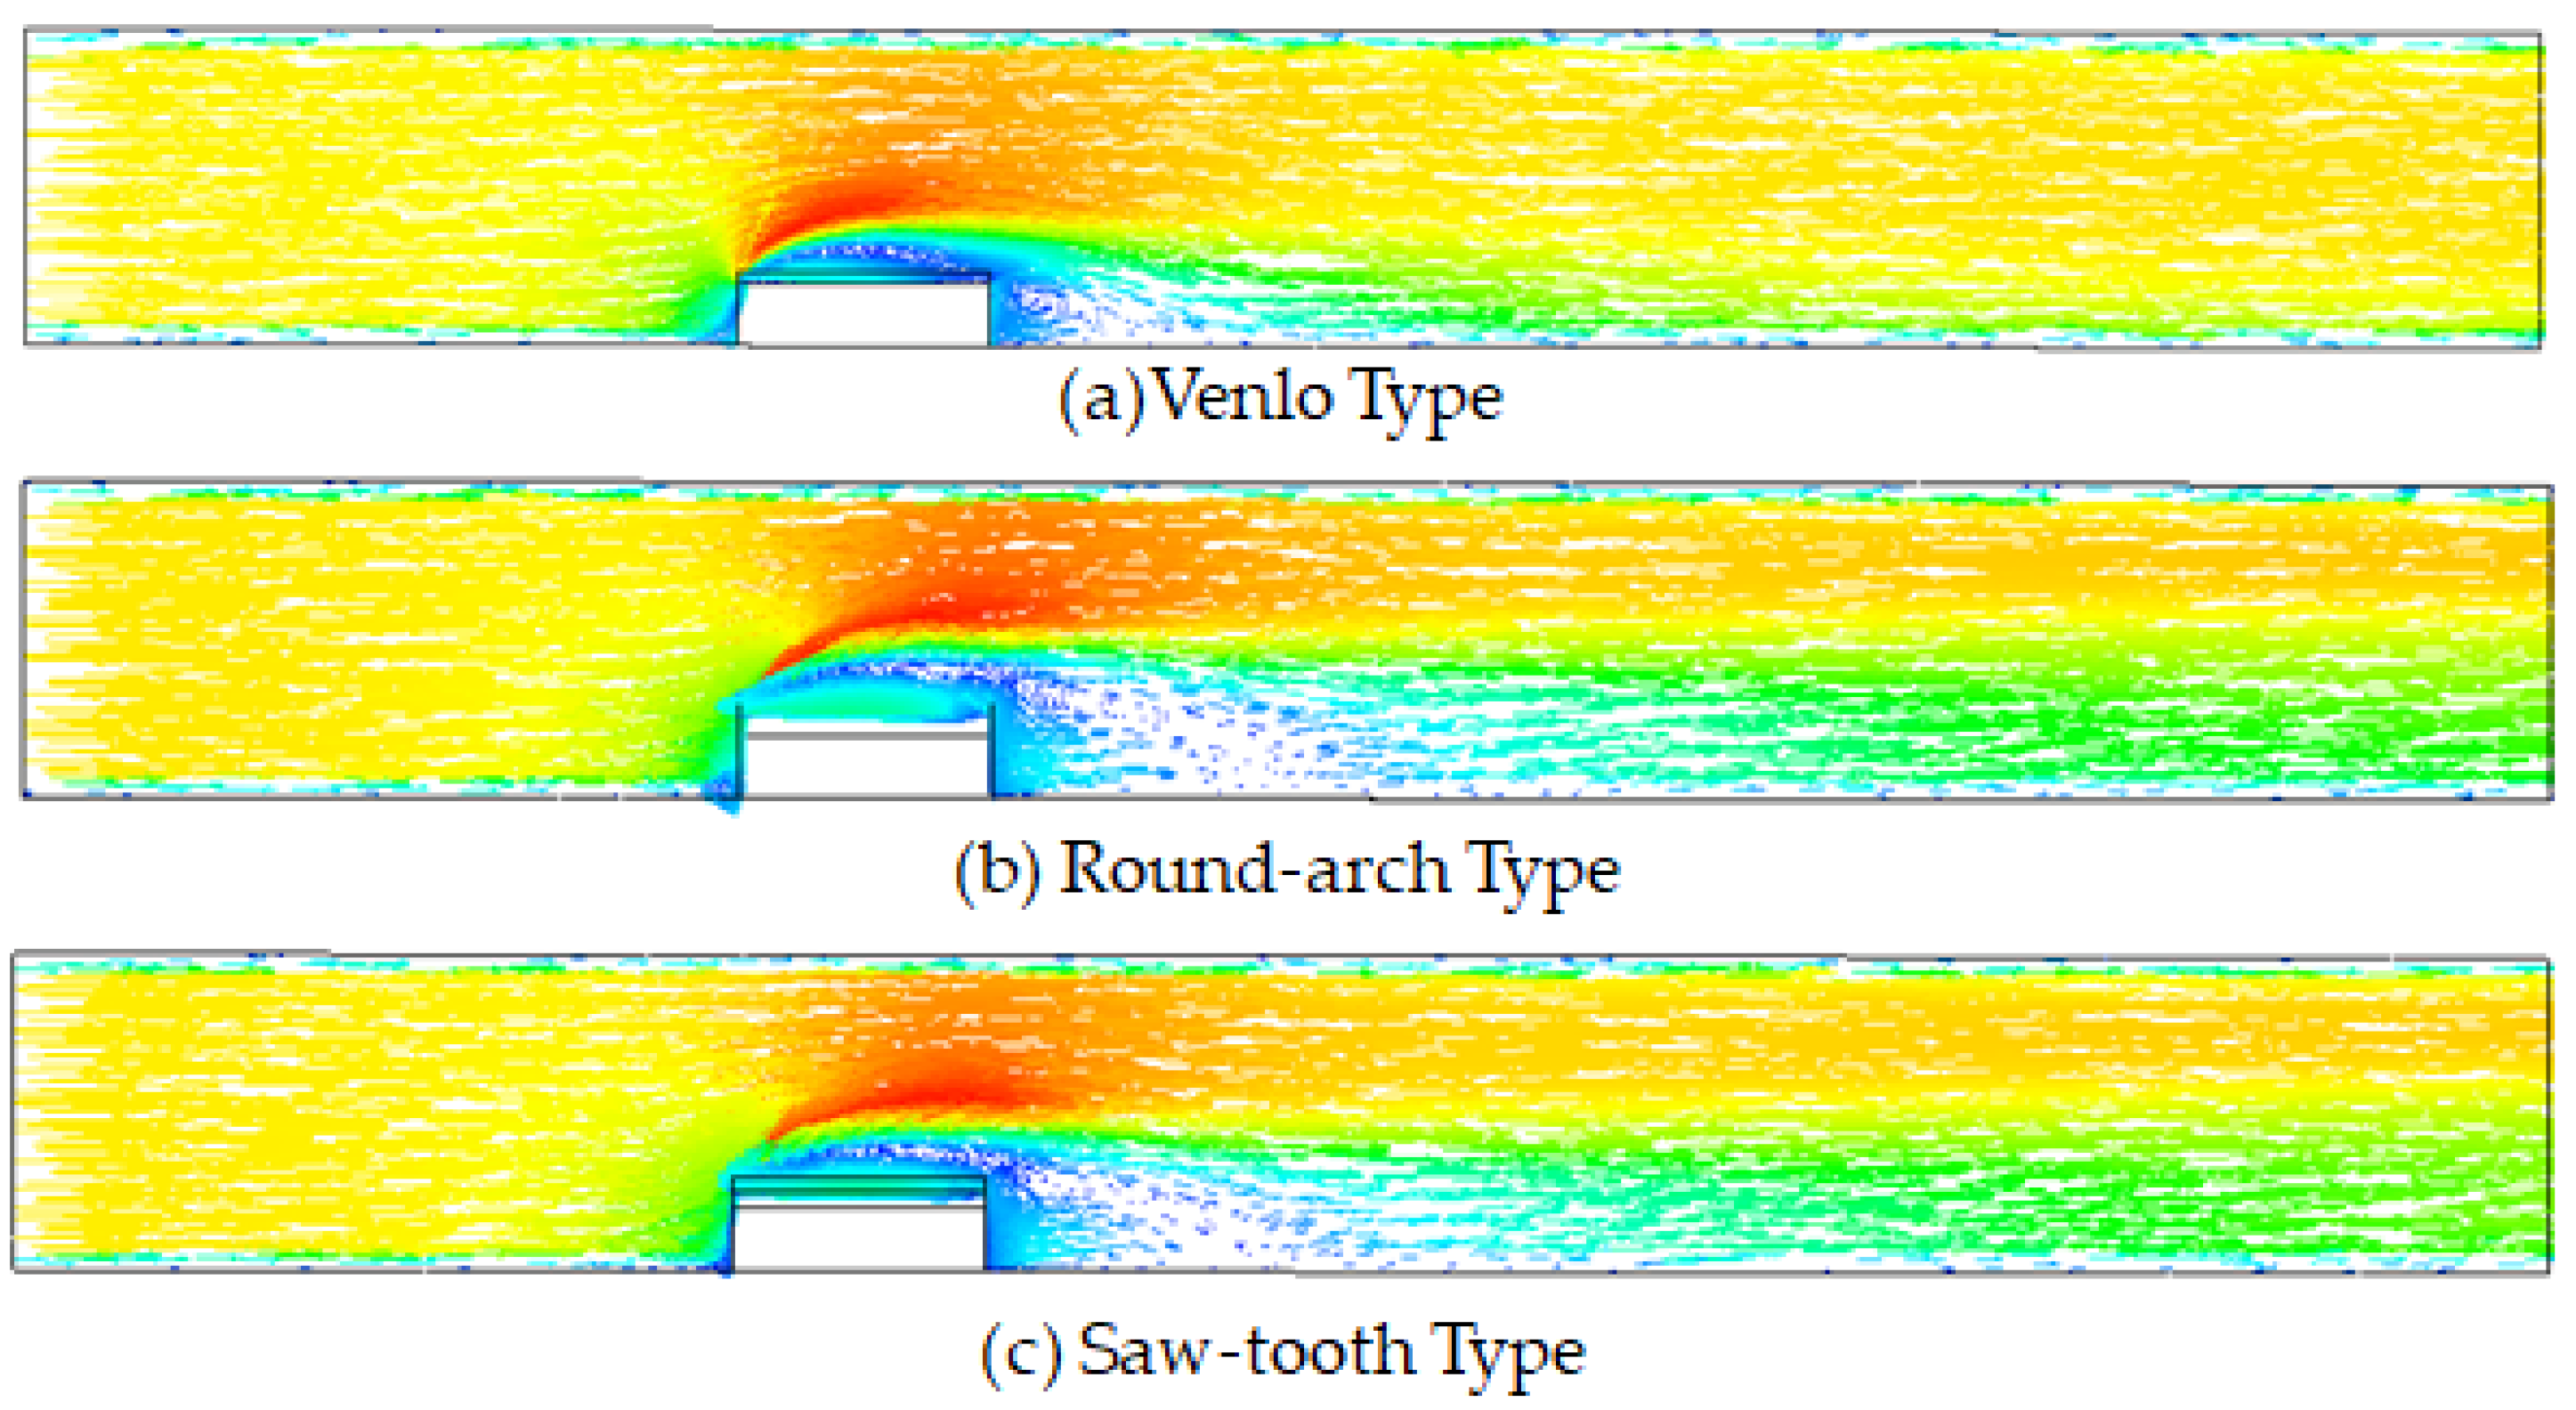
Figure 2.
Velocity vector over three types of greenhouses.
Figure 2.
Velocity vector over three types of greenhouses.
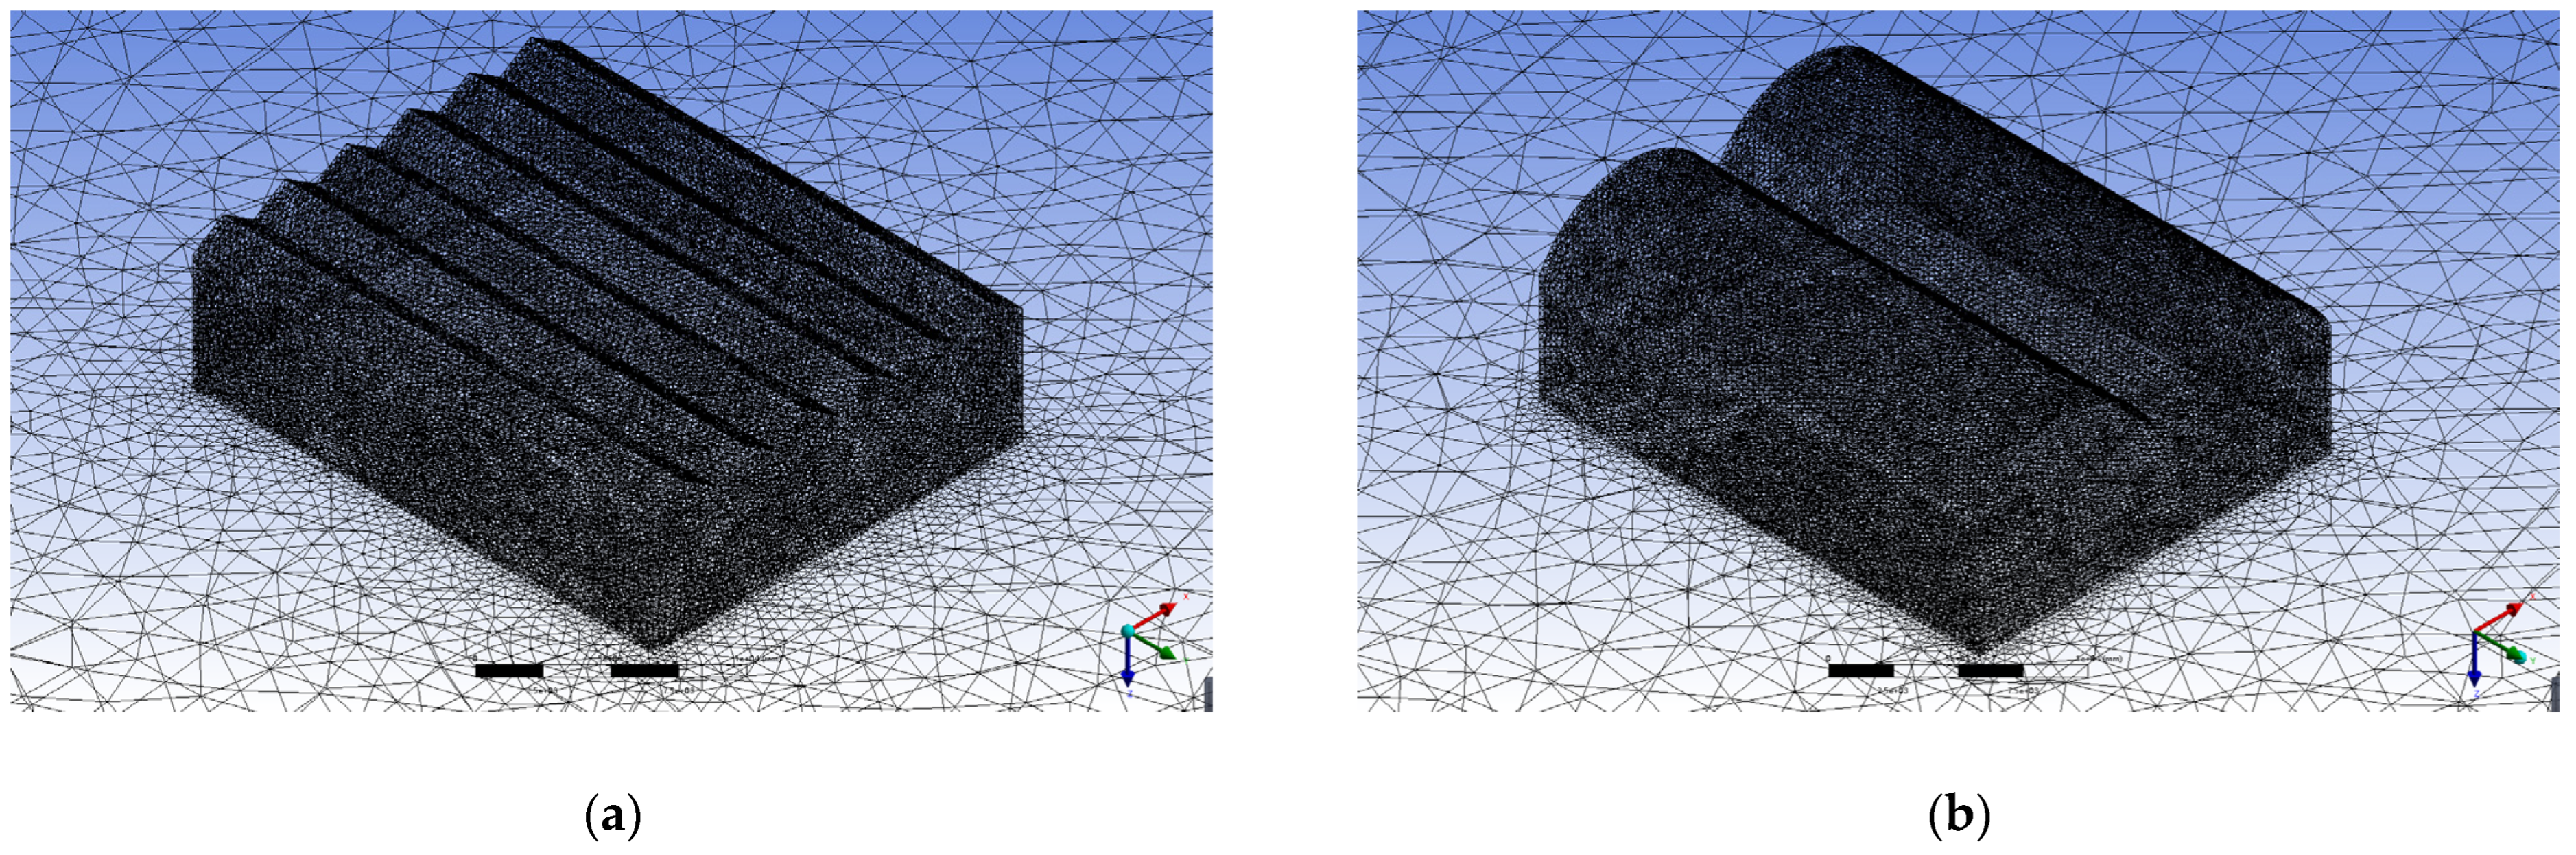
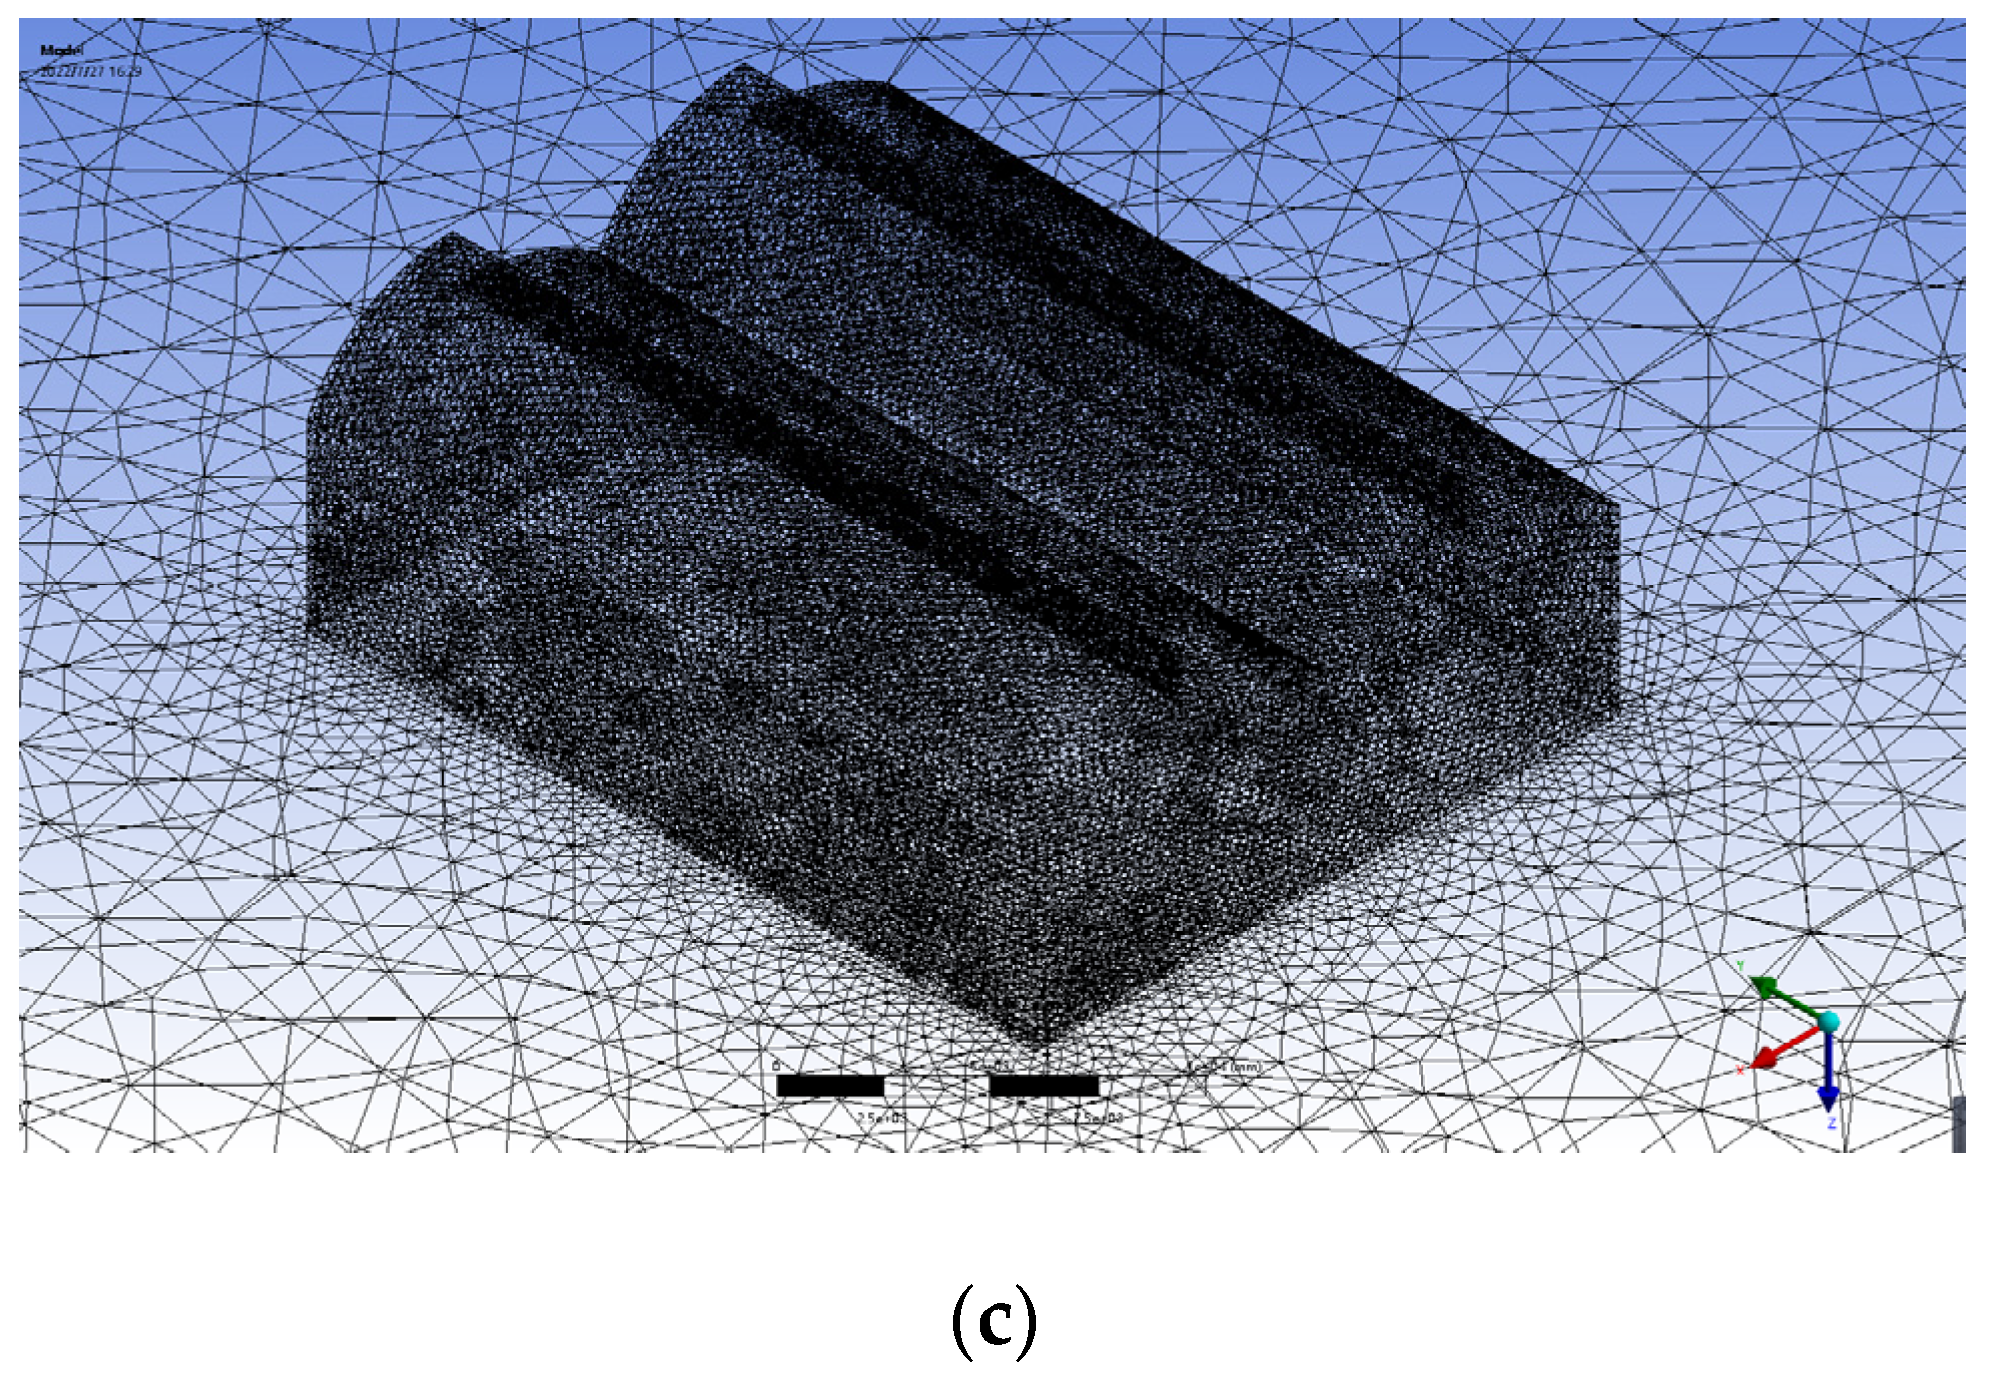
Figure 3.
Grid division. (a)Venlo Type (b) Round-arch Type (c) Saw-tooth Type.
Figure 3.
Grid division. (a)Venlo Type (b) Round-arch Type (c) Saw-tooth Type.
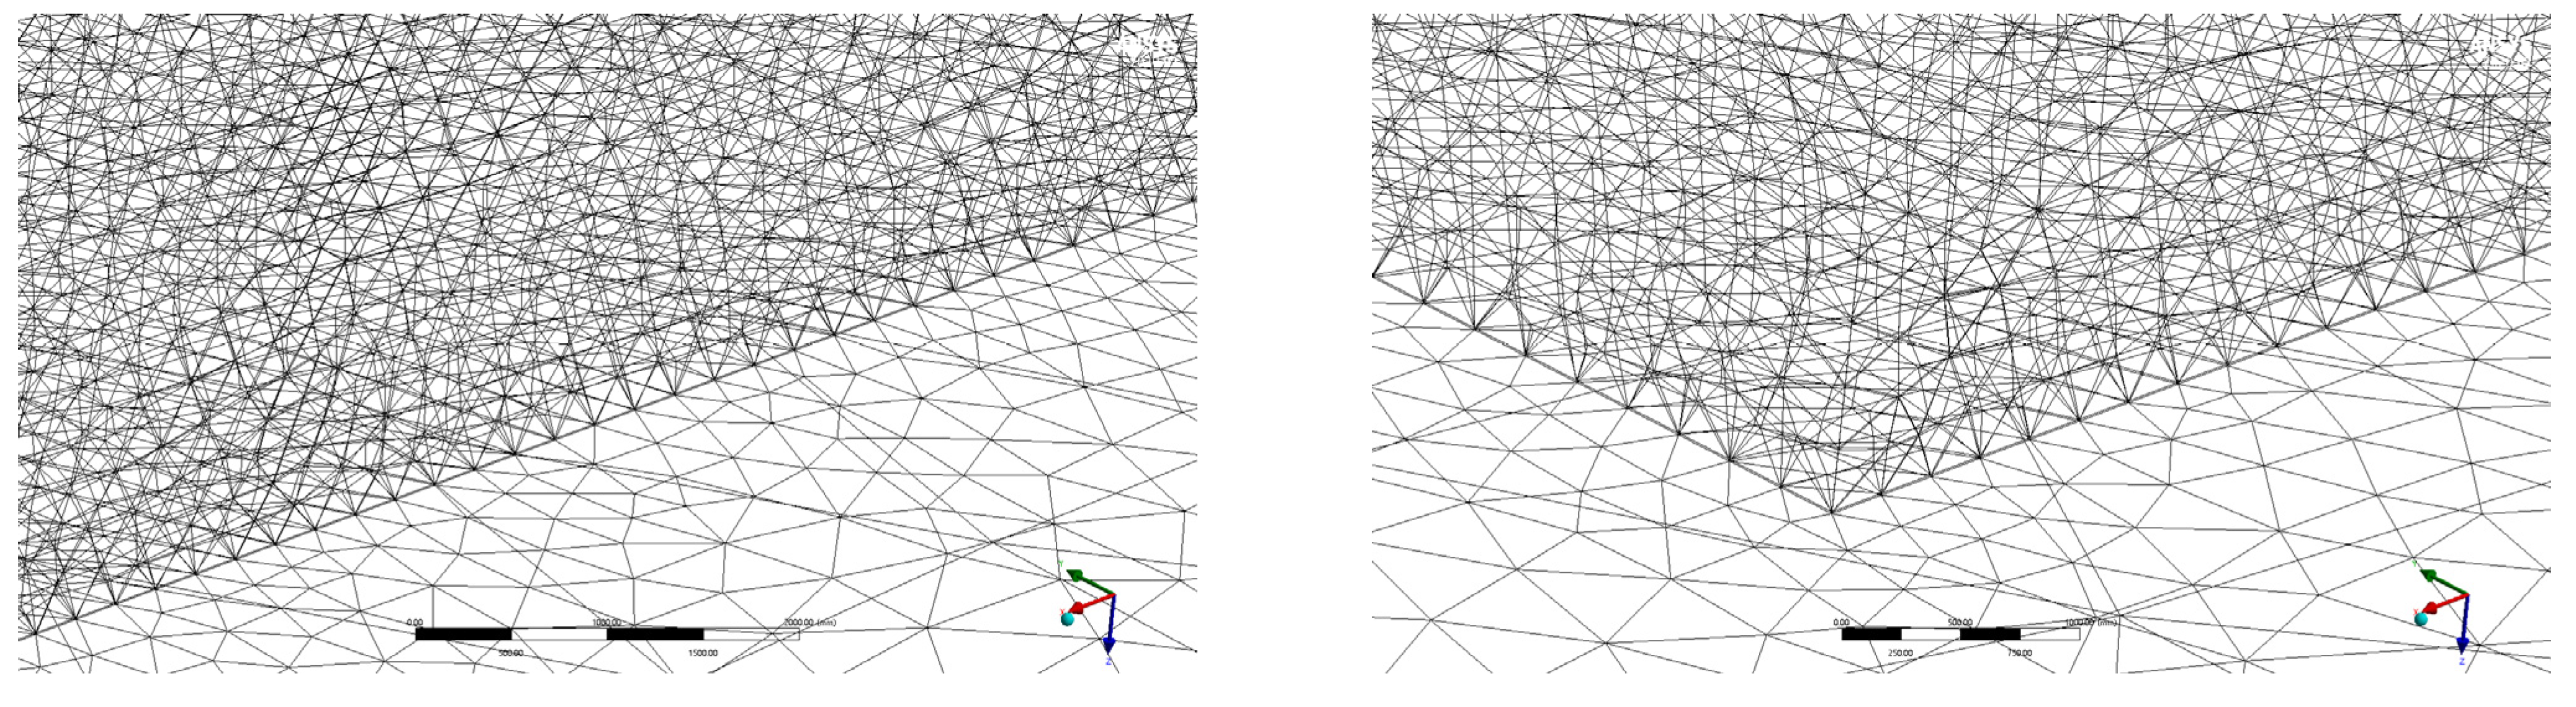
Figure 4.
Detail of grid division node connections.
Figure 4.
Detail of grid division node connections.
Figure 5.
Experimental model for wind tunnel tests and simulation model for site type. (a)Venlo Type (b) Round-arch Type (c) Saw-tooth Type (d) Simulate Terrain.
Figure 5.
Experimental model for wind tunnel tests and simulation model for site type. (a)Venlo Type (b) Round-arch Type (c) Saw-tooth Type (d) Simulate Terrain.
Figure 6.
Correction of test data.
Figure 6.
Correction of test data.
Figure 7.
Counters of wind pressure distribution on the greenhouse surface in 0°-wind. (a) Venlo Type (b) Round-arch Type (c) Saw-tooth Type (d) Saw-tooth Type (180°-wind).
Figure 7.
Counters of wind pressure distribution on the greenhouse surface in 0°-wind. (a) Venlo Type (b) Round-arch Type (c) Saw-tooth Type (d) Saw-tooth Type (180°-wind).
Figure 8.
Counters of wind pressure distribution on the greenhouse surface in 45°-wind. (a) Venlo Type (b) Round-arch Type (c) Saw-tooth Type (d) Saw-tooth Type (135°-wind).
Figure 8.
Counters of wind pressure distribution on the greenhouse surface in 45°-wind. (a) Venlo Type (b) Round-arch Type (c) Saw-tooth Type (d) Saw-tooth Type (135°-wind).
Figure 9.
Counters of wind pressure distribution on the greenhouse surface in 90°-wind. (a) Venlo Type (b) Round-arch Type (c) Saw-tooth Type.
Figure 9.
Counters of wind pressure distribution on the greenhouse surface in 90°-wind. (a) Venlo Type (b) Round-arch Type (c) Saw-tooth Type.
Figure 10.
Variation of wind tunnel test and CFD wind pressure coefficient for each wind direction in the X/Y direction. (a) X-direction (b) Y-direction.
Figure 10.
Variation of wind tunnel test and CFD wind pressure coefficient for each wind direction in the X/Y direction. (a) X-direction (b) Y-direction.
Table 1.
Greenhouse structure.
Table 2.
Greenhouse grid quality evaluation factors.
Table 2.
Greenhouse grid quality evaluation factors.
| Structure Form | Nodes | Elements | Element Quality | Aspect Ratio | Skewness | Orthogonal Quality |
|---|
| Venlo Type | 167555 | 892253 | 0.73 | 1.78 | 0.22 | 0.79 |
| Round-arch Type | 153846 | 806256 | 0.7 | 1.65 | 0.36 | 0.63 |
| Saw-tooth Type | 176413 | 942256 | 0.73 | 1.36 | 0.33 | 0.66 |
Table 3.
Grid quality evaluation criteria.
Table 3.
Grid quality evaluation criteria.
| Cell Quality | Value of Element Quality | Value of Aspect Ratio | Value of Skewness | Value of Orthogonal Quality |
|---|
| Bad | Range from 0 to 1,excellent equal to 1, bad equal to 0 | Preferably equal to 1, not more than 5 | 0.901–0.00 | 0.00–0.15 |
| Poor | 0.75–0.90 | 0.15–0.20 |
| Fair | 0.50–0.75 | 0.20–0.70 |
| Very well | 0.25–0.50 | 0.70–0.95 |
| Excellent | 0.00–0.25 | 0.95–1.00 |
Table 4.
Sampling methods and data processing methods.
Table 4.
Sampling methods and data processing methods.
| Item | Characteristic |
|---|
| Greenhouse Type | Venlo Type | Round-Arch Type | Saw-Tooth Type |
|---|
| Sampling time (s) | 42.4 | 30.3 | 34.7 |
| Sampling rate | 1/2048 s |
| Number of records | 86836 | 62055 | 71066 |
| Filter | fc = 100 Hz |
Table 5.
Extreme values of wind pressure coefficients for the respective greenhouse type at different wind angles in roof and sidewalls.
Table 5.
Extreme values of wind pressure coefficients for the respective greenhouse type at different wind angles in roof and sidewalls.
| | | Greenhouse
Type | Wind Pressure Coefficient |
|---|
| | | | Venlo Type | Round-Arch Type | Saw-Tooth Type |
|---|
| Wind Angle | | | Max | Min | Max | Min | Max | Min |
|---|
| 0° | 1.01 | −2.23 | 0.99 | −2.33 | 0.98 | −2.23 |
| 15° | 1.00 | −2.24 | 1.01 | −2.55 | 1.01 | −2.35 |
| 30° | 1.04 | −2.00 | 1.04 | −2.85 | 1.04 | −2.62 |
| 45° | 1.01 | −2.13 | 1.02 | −2.39 | 1.01 | −2.14 |
| 60° | 1.03 | −1.92 | 1.04 | −2.96 | 1.03 | −2.18 |
| 75° | 0.99 | −1.52 | 1.01 | −2.27 | 1.05 | −1.72 |
| 90° | 0.98 | −1.09 | 0.99 | −2.33 | 1.02 | −1.37 |
| 105° | 1.00 | −1.29 | 1.03 | −2.48 | 1.00 | −2.29 |
| 120° | 1.02 | −1.7 | 1.03 | −2.41 | 1.03 | −3.01 |
| 135° | 1.00 | −2.16 | 1.04 | −2.88 | 1.01 | −2.39 |
| 150° | 1.05 | −1.75 | 1.06 | −2.52 | 1.05 | −1.88 |
| 165° | 1.02 | −1.49 | 1.03 | −2.41 | 0.97 | −1.66 |
| 180° | 0.95 | −1.8 | 0.95 | −2.15 | 1.00 | −1.31 |
Table 6.
Average wind pressure coefficients for the respective greenhouse in the X/Y direction at different wind angles in roof and sidewalls.
Table 6.
Average wind pressure coefficients for the respective greenhouse in the X/Y direction at different wind angles in roof and sidewalls.
| | | Greenhouse
Type | Wind Pressure Coefficient |
|---|
| | | | Venlo Type | Round-Arch Type | Saw-Tooth Type |
|---|
| Wind Angle | | | X | Y | X | Y | X | Y |
|---|
| 0° | 1.05 | 0.01 | 1.04 | 0.03 | 1.18 | 0.01 |
| 15° | 1.11 | 0.04 | 1.11 | 0.17 | 1.15 | 0.21 |
| 30° | 1.12 | 0.42 | 1.04 | 0.52 | 1.18 | 0.62 |
| 45° | 1.01 | 0.77 | 0.86 | 0.96 | 1.07 | 0.84 |
| 60° | 0.58 | 0.98 | 0.64 | 1.18 | 0.84 | 1.10 |
| 75° | 0.33 | 1.03 | 0.3 | 1.04 | 0.36 | 0.92 |
| 90° | 0.01 | 0.86 | 0.03 | 0.96 | 0.02 | 0.87 |
| 105° | 0.36 | 0.97 | 0.36 | 1.05 | 0.39 | 1.10 |
| 120° | 0.61 | 0.95 | 0.58 | 1.10 | 0.78 | 1.11 |
| 135° | 0.99 | 0.81 | 0.89 | 0.99 | 0.98 | 0.9 |
| 150° | 1.12 | 0.39 | 0.97 | 0.48 | 1.21 | 0.48 |
| 165° | 1.08 | 0.11 | 1.08 | 0.15 | 1.05 | 0.34 |
| 180° | 1.03 | 0.01 | 1.06 | 0.02 | 1.04 | 0.04 |
Table 7.
Design wind load of main structure.
Table 7.
Design wind load of main structure.
| | Greenhouse Type | Venlo Type | Round-Arch Type | Saw-Tooth Type |
|---|
| Wind Angle | | | | | | | |
|---|
| 0° | 86.77 | 0 | 73.94 | 0 | 81.27 | 0 |
| 15° | 85.35 | 17.58 | 72.36 | 13.85 | 88.56 | 16.95 |
| 30° | 78.60 | 34.88 | 80.99 | 33.40 | 99.91 | 41.20 |
| 45° | 56.18 | 43.19 | 71.93 | 51.38 | 78.69 | 56.21 |
| 60° | 44.84 | 59.71 | 71.14 | 60.81 | 56.52 | 69.93 |
| 75° | 26.64 | 65.60 | 44.32 | 73.03 | 32.21 | 67.31 |
| 90° | 0 | 52.92 | 0 | 67.31 | 0 | 60.33 |
| 105° | 23.59 | 81.96 | 23.59 | 82.59 | 34.44 | 71.12 |
| 120° | 51.10 | 77.52 | 51.10 | 93.53 | 58.03 | 71.80 |
| 135° | 68.59 | 60.81 | 68.59 | 75.88 | 87.22 | 62.3 |
| 150° | 82.64 | 33.43 | 82.64 | 41.56 | 87.28 | 35.99 |
| 165° | 87.74 | 13.51 | 87.74 | 13.43 | 89.78 | 17.18 |
| 180° | 82.52 | 0 | 82.52 | 0 | 81.77 | 0 |
Table 8.
Average wind pressure coefficients for the respective greenhouse in the X/Y direction at different wind angles.
Table 8.
Average wind pressure coefficients for the respective greenhouse in the X/Y direction at different wind angles.
| | | Greenhouse
Type | Wind Pressure Coefficient |
|---|
| | | | Venlo Type | Round-Arch Type | Saw-Tooth Type |
|---|
| Wind Angle | | | X | Y | X | Y | X | Y |
|---|
| 0° | 1.09 | 0 | 0.93 | 0 | 1.02 | 0 |
| 15° | 1.08 | 0.32 | 0.91 | 0.22 | 1.12 | 0.27 |
| 30° | 0.99 | 0.63 | 1.02 | 0.53 | 1.26 | 0.65 |
| 45° | 0.71 | 0.78 | 0.91 | 0.81 | 0.99 | 0.89 |
| 60° | 0.57 | 1.08 | 0.90 | 0.96 | 0.71 | 1.10 |
| 75° | 0.34 | 1.19 | 0.56 | 1.15 | 0.41 | 1.06 |
| 90° | 0 | 0.96 | 0 | 1.06 | 0 | 0.95 |
| 105° | 0.33 | 1.03 | 0.30 | 1.04 | 0.43 | 1.12 |
| 120° | 0.58 | 0.98 | 0.64 | 1.18 | 0.73 | 1.13 |
| 135° | 1.00 | 0.77 | 0.86 | 0.96 | 1.01 | 0.98 |
| 150° | 1.12 | 0.42 | 1.04 | 0.52 | 1.10 | 0.54 |
| 165° | 1.11 | 0..04 | 1.11 | 1.17 | 1.13 | 0.27 |
| 180° | 1.05 | 0 | 1.04 | 0 | 1.03 | 0 |
| Publisher’s Note: MDPI stays neutral with regard to jurisdictional claims in published maps and institutional affiliations. |
© 2022 by the authors. Licensee MDPI, Basel, Switzerland. This article is an open access article distributed under the terms and conditions of the Creative Commons Attribution (CC BY) license (https://creativecommons.org/licenses/by/4.0/).

