Article

Development and Experiment of an Online Measuring System for Spray Deposition

1
High-Tech Key Laboratory of Agricultural Equipment and Intelligence of Jiangsu Province, Jiangsu University, Zhenjiang 212013, China
2
School of Agricultural Engineering, Jiangsu University, Zhenjiang 212013, China
3
Faculty of Mechanical and Electrical Engineering, Yunnan Agricultural University, Kunming 650500, China
*
Author to whom correspondence should be addressed.
Agriculture 2022, 12(8), 1195; https://doi.org/10.3390/agriculture12081195
Submission received: 13 July 2022 / Revised: 31 July 2022 / Accepted: 8 August 2022 / Published: 10 August 2022
(This article belongs to the Section Agricultural Technology)

Abstract

:
To realize the online evaluation of spray quality, an online measuring system for spray coverage and deposition quality is developed. The measuring theory of spray coverage and deposition quality on an LWS (leaf wetness sensor) surface is analyzed. When the spray conditions are constant, there is a linear correlation between the spray coverage on the sensor surface, the spray deposition quality and the LWS output voltage increment. The results of calibration experiments show that when the spray conditions are constant, the coefficient of determination R 2 of the regression curves between the sensor output voltage increment and the spray coverage on the sensor surface is more than 0.75, and the coefficient of determination R 2 of the regression curves between the sensor output voltage increment and the spray deposition quality on the sensor surface is more than 0.90. Based on ZigBee wireless sensor technology, this paper reports an online measuring system for spray coverage and deposition quality at multiple points in the field. The test results show that the online measuring system has good uniformity. Field test results show that the LWS voltage increment and the coverage rate of water-sensitive paper have a good correlation, and the measuring results of the spray deposition quality trend are in good agreement. The fit of the spray deposition quality curves measured by the two methods was 0.8924. The research results in this paper can provide a reference for using LWS sensors to measure spray coverage and deposition quality.

1. Introduction

Spraying pesticide is an important way to reduce pests and diseases and helps to increase crop yields [1]. The extensive use of pesticides poses a threat to human health, which requires us to raise the awareness of environmental protection. Reasonable pesticide application technology can improve pesticide application efficiency [2]. The scientific application of pesticides requires us to accurately obtain the distribution characteristics and rules of spray droplets, which is of significance for improving the utilization rate of pesticides [3].
Spray coverage and deposition quality are important indicators of spray distribution characteristics. Spray deposition quality refers to the quality of the liquid compound on the leaves of the target plant, which can directly reflect the utilization rate of pesticide spray [4]. In contrast, spray coverage refers to the droplet spreading area of the liquid compound on the target plant. Pesticides can be divided into suction and touch types. Spray coverage has a significant impact on the prevention and control of diseases and insect pests [5,6]. The spray coverage and deposition quality can be measured by using water-sensitive paper. By quickly processing the image of the water-sensitive paper, the number of droplets and the spray coverage can be obtained to calculate the size of the droplets, and the spray deposition can be estimated [7,8,9,10]. Some studies used the tracer method to collect samples for elution and obtained the spray deposition quality through the calibration curve of sample concentration and absorbance [11,12]. Salyani et al. designed a droplet deposition sensor based on the variable resistor principle and established a relationship model between the sensor output voltage and the liquid deposition amount. The results show that the stability of the system is poor, and the oxidation problem of its electrodes affects the accuracy [13]. With the development of advanced sensing technology and internet of things technology, the online rapid detection technology of spray deposition has been developed. Crowe et al. quantify deposition volume using a series of discrete numerical indications rather than a spatially integrated response. However, the instrument requires a higher instrument manufacturing process [14]. Among them, the online detection technology of spray deposition quality based on capacitive sensors has been developed, and the research results show that it has certain application prospects in the measurement of spray deposition [15,16,17]. Sun et al. [18] developed a rapid measuring system based on the theory of solution conductivity, which adds 1% KNO3 solution to the collected solution. The accumulated spray deposition quality is obtained through the relationship between solution conductivity and concentration. Wu et al. [19,20] designed sensors based on the principle of the standing wave ratio to achieve the real-time measurement of droplet deposition quality and droplet evaporation. Foqué et al. [21] used an LWS capacitive sensor for spray testing, which gave the measurement accuracy of the sensor. The research results showed that there is a good correlation between the spray coverage on the LWS surface and the sensor output voltage.
As shown in Table 1, Spray App is often used to assess spray quality. The scanner equipment (more than 1000 RMB) and consumption of water-sensitive paper (more than 200 RMB/time) are expensive. The online measuring system is practically material-free. The system-fixed equipment is about 2500 RMB. Improving the measurement accuracy of the online inspection system and increasing the measurement parameters are important research directions. This research develops an online measuring system for spray deposition based on the LWS. The surface of the LWS (LWS-10, Yingtai Tech., Tianjin, China) is composed of an interdigital electrode structure with a capacitor fixed on a resin plate and the surface being sprayed with insulating material [17]. Through the change in the capacitance dielectric constant, the LWS can accurately measure the trace water information of plant leaves with high sensitivity and can realize the measurement of leaf spray deposition [22].
Table 1. Existing services for the online quality assessment of spraying.
ServicesPrincipleSoftware or SensorAdvantagesDisadvantages
Spray AppProcessing water-sensitive paper based on image technology [23,24,25].DepositScan, Spray_imageI and II, SnapCard. High measurement accuracy for droplet deposition density and droplet coverage area.Consumables, expensive, long period.
Online Measuring SystemCalculating deposition volume based on resistive and capacitive sensors [13,16,17].LWS capacitive sensor, resistive sensor.Reusable, low cost, fast response.Low measurement accuracy and few measurement parameters (only spray deposition quality).
DepositScan was developed by Zhu et al., in USDA-ARS Application Technology Research Unit, Wooster, OH, USA [9]. Spray_imageI and II were developed by A. R. S. Marçal et al. in Universidade do Porto, Portugal [25]. SnapCard was developed by Nansen et al., in The University of Western Australia [23].
The purpose of the research is to realize the online measurement of spray coverage and deposition quality and reduce the cost and difficulty of detection. Based on the LWS capacitive sensor and ZigBee wireless sensor network technology, this paper reports the development of an online measuring system for detecting spray coverage and deposition quality. This paper explores the feasibility of the system application through theoretical analysis, calibration tests and field tests.

2. Materials and Methods

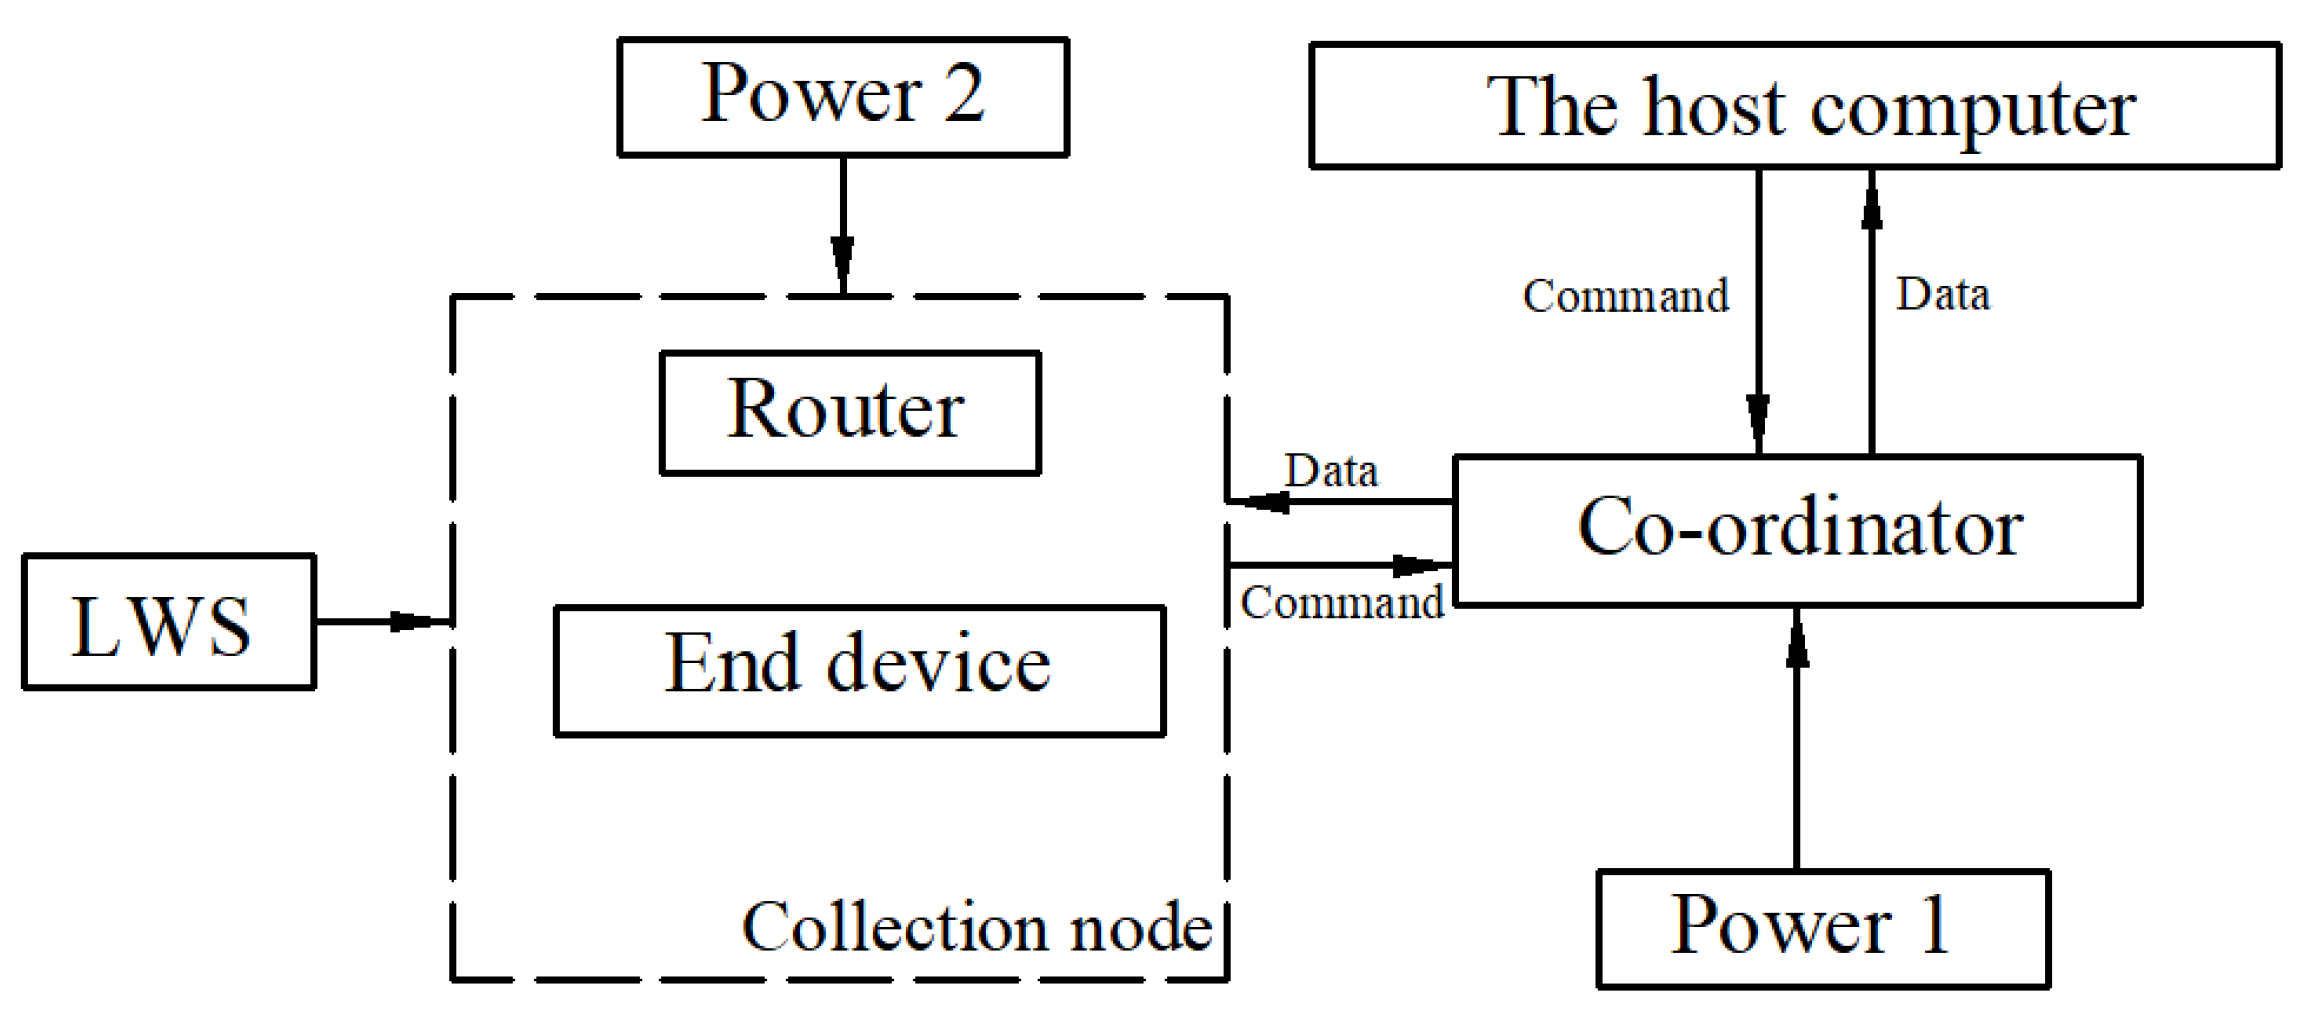
2.1. Online Measuring System

The multipoint measurement of spray deposition can not only realize the measurement of single-point spray deposition but also evaluate the overall uniformity of spray deposition so that the spray quality can be fully understood. The network topology used by the multipoint spray deposition online measuring system is a tree network structure. The data communication methods in the local area network are broadcast, multicast and on-demand. The host computer first sends the start command to the coordinator, and the coordinator forwards the command in the local area network by broadcasting. After the end device receives the command, it sends the voltage of each capacitive sensor to the router in a multicast mode with a sending cycle of 1 s. The router 1 collects data and sends them to the coordinator. After the coordinator summarizes the data, it will upload the data to the host computer, and, thus, one acquisition is completed. The system structure is shown in Figure 1.
The coordinator, router and end device are based on the CC2530 development board (Shenzhen Yiyan Electronic Technology Co., Shenzhen, China). Z-Stack protocol provides open-source code to help workers set up a wireless local area network. Users set the device type by programming different codes. The humidity measurement of LWS (LWS-10, Yingtai Tech., Tianjin, China) ranges from 0% to 100%, and the accuracy is 5%. The LWS has one pin to obtain the analog voltage envelope of the capacitance, which allows the development board to record its value. The sampling precision of the development board is set to 12 Bit.
Figure 2 shows the host computer detection interface. The main function of the host computer is to realize the setting of the spray deposition and the sensor voltage increment algorithm. It sends “start” and “stop” commands to the lower computer and displays the data. The interface is written using the Guide module of Matlab 2015b software (Math-Works, Natick, MA, USA). The real-time data editable text box is used for the real-time display of data, which can be used to judge whether the system is running normally. Start and stop buttons are used to start and stop the acquisition program.

2.2. Analysis of Measuring Spray Coverage and Deposition Quality Based on LWS

Two nozzle models (Lechler ST110−01 and Lechler ST110−03, both standard flat-fan spray nozzles, Lechler GmbH, Metzingen, Germany) with a 110° spray angle were tested. For a standard flat-fan spray nozzle, the schematic view of the coordinate for the spray is shown in Figure 3. The theoretical derivation is based on the assumptions that the spray droplets do not overlap on the collecting plate and that the spreading factor (ratio of droplet size and spot size) is independent from the droplet size. Under specific operating conditions, the relationship between the spray deposition quality and spray coverage on the collecting plate was explored.
The spray height is h (m), the width in the x direction is l (m) and the width in the y direction is d (m). The value v (m/s) is the moving speed of the collecting plate in the -y direction, and la (m) and lb (m) are the lengths of the collecting plate in the x direction and y direction, respectively. The length lx (m) is randomly selected in the x direction, and we can calculate:
A x = d × l x
l = x = 1 n l x
Q = 60 × x = 1 n m x
t = l b v
where Ax (m2) is the horizontal cross-sectional area corresponding to lx, mx (g∙s−1) is the spray deposition passing through the horizontal section of Ax per second, t (s) is the exposure time of the collecting plate in the spray range and Q (mL∙min−1) is the flow rate of the nozzle.
The Equations (1), (3) and (4) can be used to calculate the collecting plate with a speed of v (m/s), the vertical height h (m) from the nozzle and the spray deposition quality on the collecting plate after passing through the spray area:
m = m x × t × l b × l a A x = m x ¯ × t × l b × l a
where m x ¯ g · s 1 m 2 is the quality parameter corresponding to the length lx in the x direction.
S x   m 2 · s 1 is the spray coverage passing through the horizontal section of Ax per second. By taking the collecting plate with speed v (m/s) and the vertical height h (m) from the nozzle, after passing through the spray area, the droplet coverage Sz of the spray droplets on the collecting plate is:
S z = S x × t × l b × l a A x = S x ¯ × t × l b × l a
where s x ¯   m 2 · s 1 m 2 is the area parameter corresponding to the length l x in the x direction.
According to Equations (5) and (6), for the same nozzle and the same working condition, ( m x ¯ ) and ( S x ¯ ) are fixed values that can be set as:
m x ¯ = k 1 × S x ¯
According to Equation (5), we can obtain:
m x = k 1 × S z
Equation (7) shows that there is a good correlation between spray deposition quality and spray coverage on the collecting plate. This result is consistent with the experimental result of Sama et al. [26].
The capacitance of the capacitive sensor changes as the droplets deposit on the surface of the capacitive sensor. The relationship between the capacitance changes and the droplet deposition is as follows [14]:
m = d 2 × C d C 0 × ρ ε y ε 0 = d 2 × C × ρ ε y ε 0
where C d is the capacitor capacitance with droplet deposition, C 0 is the initial capacitance of the capacitor, ε 0 is the dielectric constant of air, ε 0 is the dielectric constant of pesticide, ρ is the pesticide liquid density, d is the distance between parallel plates and Δ C is the capacitance changes.
The concentration of the liquid pesticide is fixed, and the dielectric constant of the liquid pesticide is a fixed value when the influence of the environmental temperature difference on the dielectric constant of the solution is ignored. The spray deposition quality on the LWS surface and the sensor voltage increment (∆u) are linearly related [16,25]. Under specific operating conditions, t, lb and la are fixed values. We can then obtain:
m = k 2 × u
According to Equations (8) and (10), we obtain:
S z = k 2 k 1 × u
According to Equations (7), (10) and (11), when the spray operating conditions are different, the relationship between the spray deposition quality (m), spray coverage (Sz) and capacitance sensor voltage increment (∆u) may be different. The spray operating conditions include nozzle type, spray pressure, spray height, pesticide concentration and so on. Therefore, this paper studies spray deposition quality and coverage under the same operating conditions, which is also in line with the actual operating conditions.
In summary, when the LWS is used under the same operating conditions mentioned above, the capacitance sensor voltage increment (∆u) can linearly indicate the spray coverage Sz and the spray deposition quality m on the sensor surface. Therefore, it can be seen through theoretical analysis that the LWS capacitance sensor can be used to measure the droplet deposition quality and the droplet coverage on the sensor surface.

2.3. Experimental Design

2.3.1. Calibration Tests Design

The calibration test platform is shown in Figure 4. It consists of a spray system, a movable platform and a single-module wireless detection system. An analytical balance (GR-202, A&D Co., Tokyo, Japan) is used to weigh the spray deposition quality on an LWS surface. The flow rate is adjusted by the pressure valve. An adjustable bracket is used for longitudinal adjustment to ensure that the nozzle is 0.5 m away from the surface of the LWS capacitive sensor.
To obtain the spray deposition quality and spray coverage on the LWS surface under specific operating conditions, it is necessary to obtain the relationship between the spray coverage, spray deposition quality and output voltage increment of the LWS by a calibration test. As shown in Table 2, this paper reports five designed tests. The nozzle (Lechler ST110-01 and Lechler ST110-03, both standard flat-fan spray nozzles with a 110° spray angle) is 0.5 m away from the surface of the LWS. The solution used is 1 g/L carmine solution. The calibration test selects 15 speeds, and each speed is repeated three times.

2.3.2. Homogeneity Check of the Measuring System

The multipoint measurement of spray deposition is used to test the uniformity of spray deposition. However, before it is used as a spray deposition distribution uniformity test, the error of the system measurement uniformity must be checked. The uniformity of spray deposition distribution is represented by the coefficient of variation measured by the spray deposition capacitance collector. For the uneven spray of the movable spray platform, the weighing method is used to test the homogeneity of the measuring system. By comparing the coefficient of variation of weighing and the coefficient of variation of the measuring system, the uniformity of the measuring system designed in this paper is evaluated. The nozzle type used in this paper is Lechler ST110−01, and the flow rate is 0.3 MPa. The tests are repeated five times. The detection method is as follows:
Five LWS capacitive sensors are selected and arranged, as shown in Figure 5. According to the inspection requirements, the flow rate of the plant protection sprinkler and the distance between the working sprinkler and the surface of the LWS capacitive sensor are set. Each time the spraying operation is completed, the spray deposition on the surface of each sensor will be displayed on the host computer interface. The coefficient of variation of spray deposition measured by the system will be automatically calculated. Each spray deposition on the LWS surface is weighed. The above process is repeated for multiple measurements, and the mean is calculated. The detection steps are shown in Figure 6.

2.3.3. Outdoor Tests

The sampling points of the field test are shown in Figure 7, and the five-point arrangement method is adopted. The sprayer is equipped with a nozzle (Lechler ST110−01, a standard flat-fan spray nozzle with a 110° spray angle), and the flow rate is controlled at a pressure of 0.3 MPa. Taking into account the safety of experimental operators, tap water was used as a surrogate for the pesticide solution in this test. The ambient temperature was 22 ± 0.5 °C, and the humidity was 19% ± 0.8%. The calibration curve of the Lechler ST110−01 at a flow rate controlled by a pressure of 0.3 MPa was used as the measuring system for the calculation of the spray deposition quality algorithm. Due to the limitations of outdoor experimental conditions, this paper only uses water-sensitive paper as a comparison for droplet deposition parameters. Water-sensitive paper is used to measure droplet coverage and droplet deposition density. The droplet coverage calibration of tap water is hard to carry out. This paper will compare the coverage rate measured by the water-sensitive paper and the change trend of the LWS voltage increment. Water-sensitive papers deform the droplets and cannot measure deposition, but, outdoors, we cannot accurately weigh or elute the solution to get the droplet mass, so we use water-sensitive paper to estimate the droplet deposition.

2.4. Data Processing

2.4.1. Variation Coefficient Calculation

The coefficient of variation of droplet deposition quality between each measurement point can be used to evaluate the uniformity of the measuring system. It can also be used for spray distribution uniformity measurements during spraying operations. The following method for calculating the coefficient of variation was used to calculate the coefficient of variation of each group of weighing tests, and the error between the two was calculated to test the uniformity of the system measurement.
The average spray deposition q ¯ can be calculated according to Equation (12):
q ¯ = i = 1 n q i n
where qi (g) is the spray deposition at each sampling point, q ¯ (g) is the average spray deposition and n is the number of sampling points.
The standard deviation (D) can be calculated using Equation (13).
D = i = 1 n q i q ¯ 2 n 1
The coefficient of variation (V) can be calculated according to Equation (14).
V = D q ¯ × 100 %

2.4.2. Spray Coverage Processing

To obtain the spray coverage on the surface of the LWS, this paper uses a commercial image analysis software (Image Pro Plus, Meyer instruments, Inc., Houston, TX, USA). This paper uses the Photoshop software (Photoshop 2018, Adobe Systems, San Jose, CA, USA) to preprocess the acquired pictures to remove the factors that affect the spray coverage acquisition due to the uneven light source of the photo. Then, Image Pro Plus uses pseudocolor to highlight the target object requested by the user, and the total pixel points of the target can be quickly solved. The ruler is used as a control to calculate the pixels corresponding to 1 cm2. The solution process is shown in Figure 8 below:
The above method is used to find the total pixel points (AC) of the spray coverage on the LWS surface and the pixel points (LP) of the reference ruler (Lr) to calculate the spray coverage (S) on the LWS surface. The spray coverage (S) can be calculated according to Equation (15):
S = A C × L r 2 L P 2

3. Results

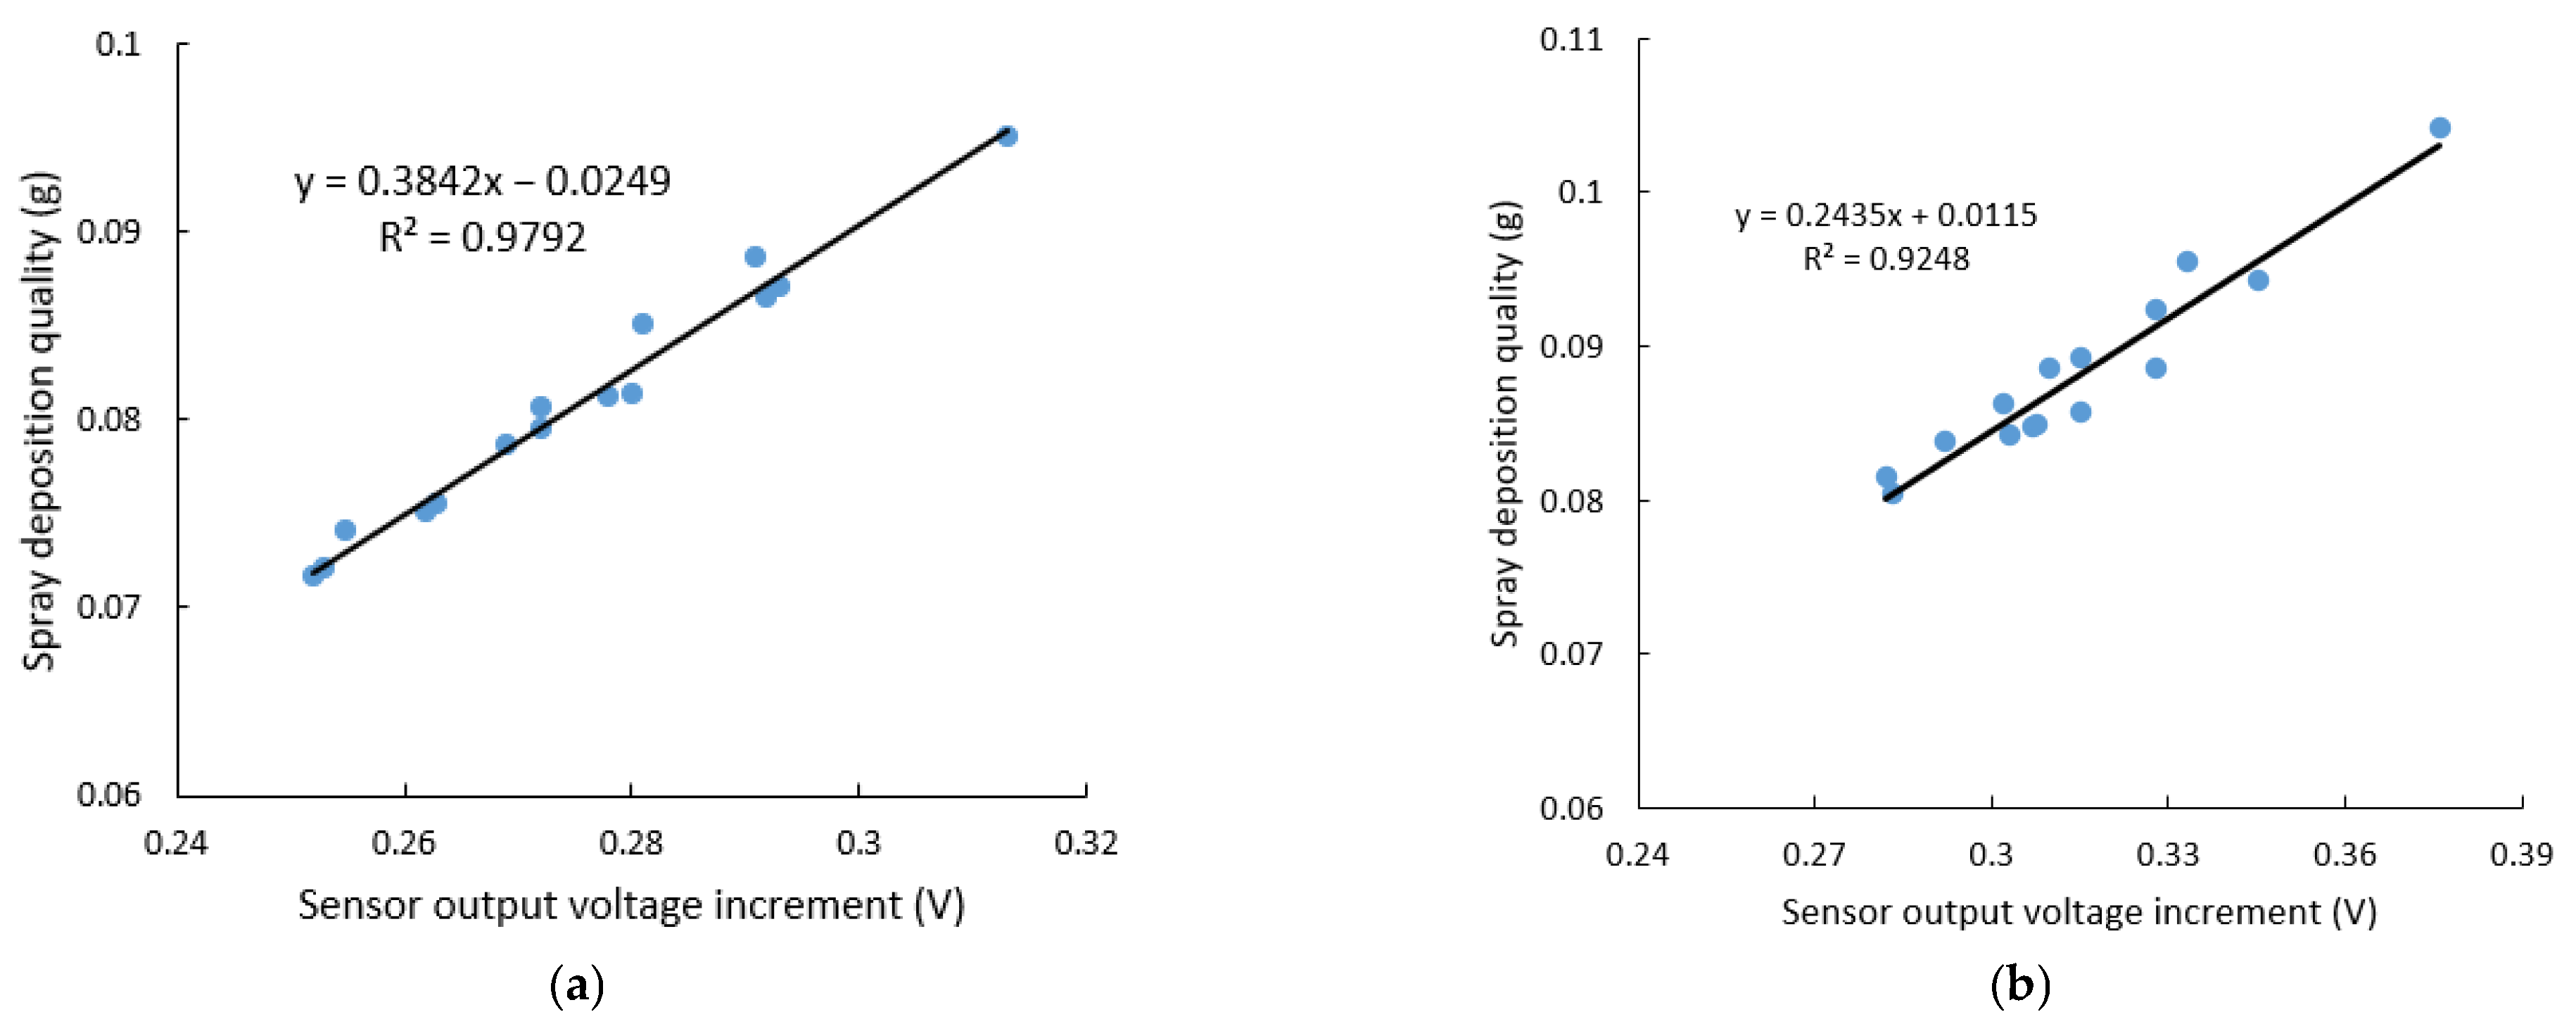
3.1. Calibration Curve

Figure 9 shows that the coefficient of determination R2 of the regression curves between the sensor output voltage increment and the spray coverage on the sensor surface is more than 0.75. To further verify the linear correlation between the sensor voltage increment and the spray coverage on the sensor surface, the F test is used to test the significance of the above results at the significance level α = 0.01. The results are shown in Table 3. The linear correlation between the sensor voltage increment and the spray coverage on the sensor surface is very significant. The mean relative error (MRE) of the observed spray coverage and the regression value are 2.22% and 2.39%, respectively.
Figure 10 and Figure 11 show that the coefficient of determination (R2) is more than 0.90, and the degree of fit is higher. The regression curve coefficients of the two solutions are different under different pressures at the same concentration of carmine solution. To further verify the linear correlation between the sensor voltage increment and the amount of spray deposition quality on the sensor surface, the F test was used to perform a significant test on the above results at a significance level of α = 0.01. The results are shown in Table 4 below. The MRE of the observed spray deposition quality and the regression value is less than 1.67%.

3.2. Homogeneity Check Results

Table 4 shows the results of the homogeneity check. The coefficient of variation of spray deposition quality between the five detection modules measured by the measuring system ranged from 4.92% to 7.35%. The coefficient of variation of spray deposition quality between the five detection modules measured by the weighing ranged from 3.95% to 7.16%. The coefficient of variation between the five detection modules measured by the weighing method is also shown in Table 5. The range of the relative errors of the coefficient of variation ranged from 0.11% to 0.27%.

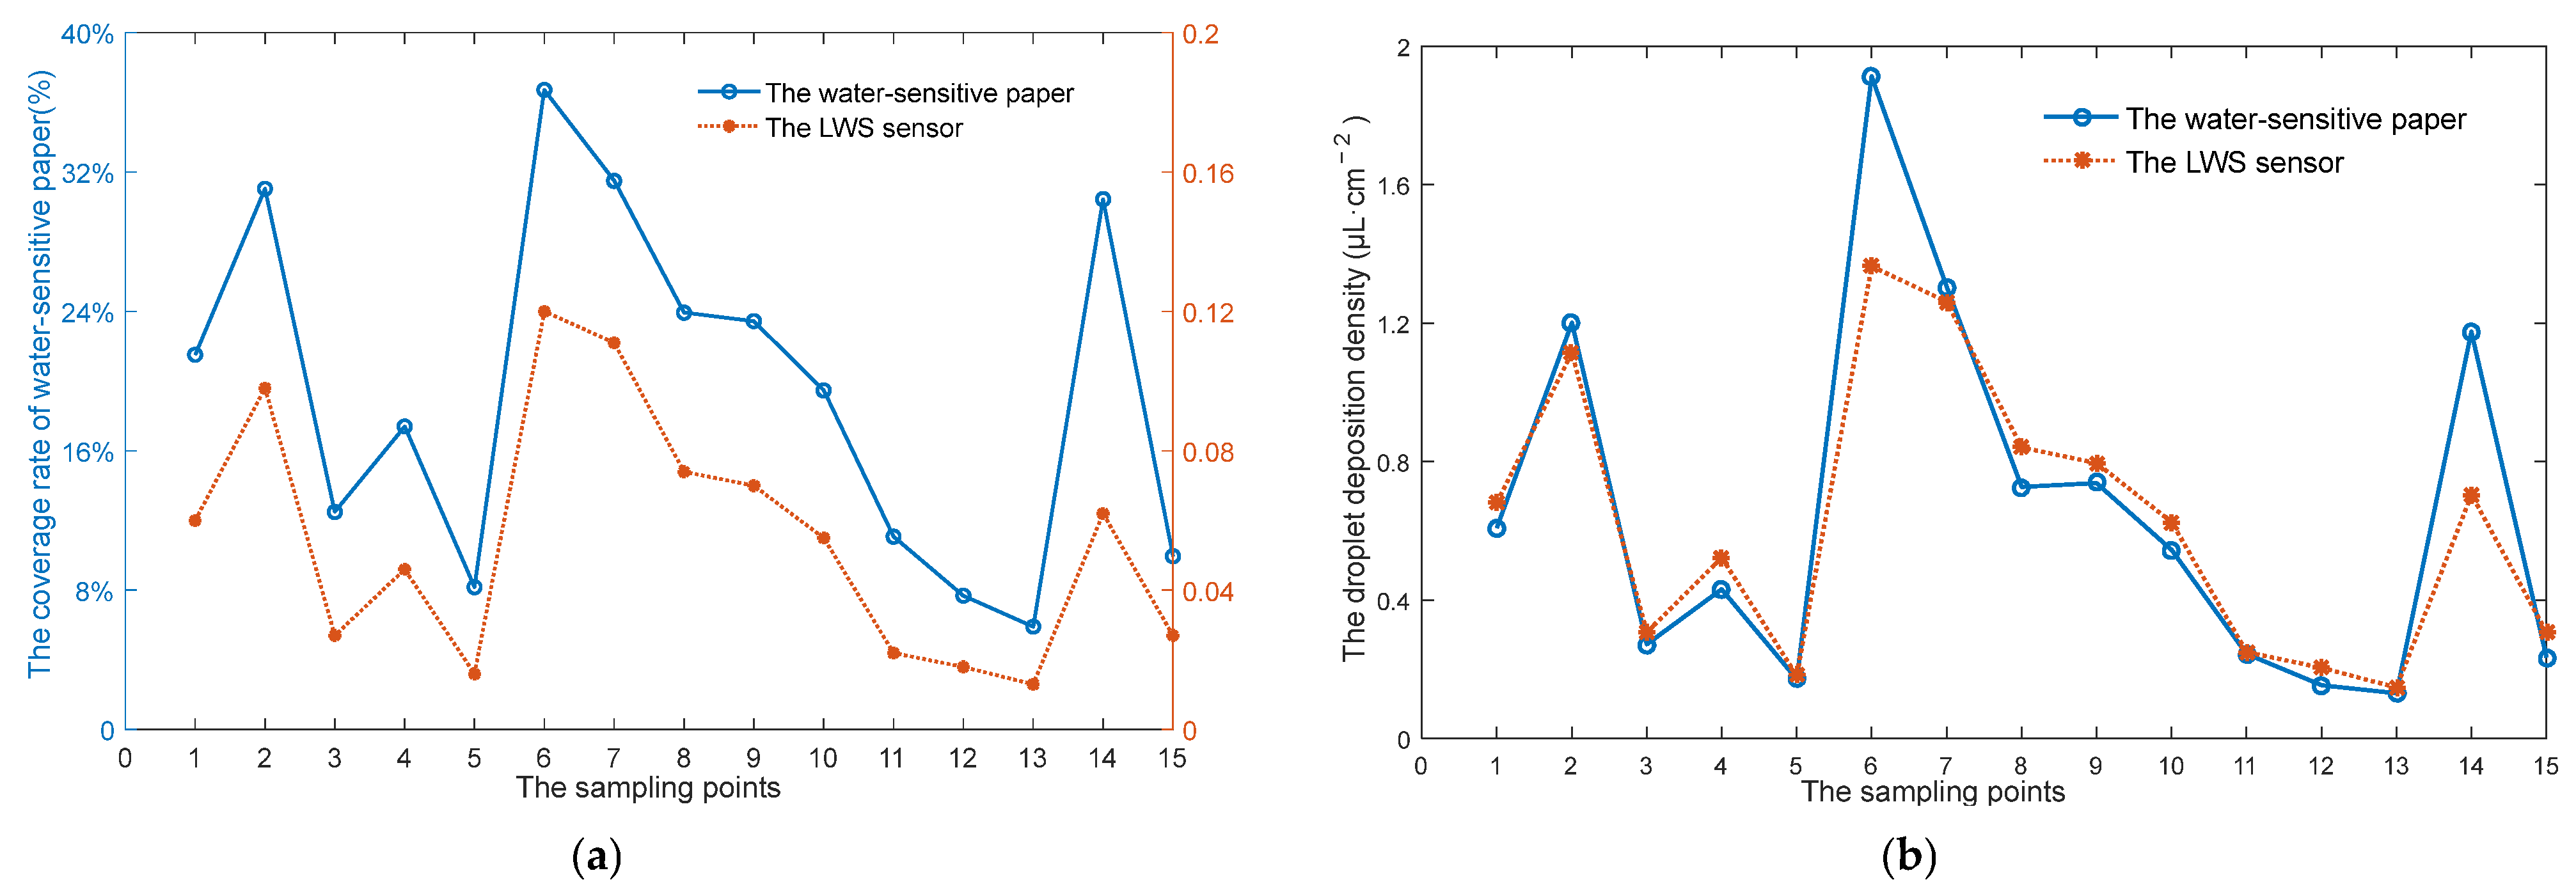
3.3. Outdoor Test Results

Figure 12a shows the relationship between the coverage rate of water-sensitive paper and the sensor voltage increment. This shows that the correlation between the sensor voltage increment of the measuring system and the coverage rate of the water-sensitive paper is good and that the online measuring system can measure the spray coverage on the LWS surface outdoors. Figure 12b shows that the measurement results of the spray deposition of the two methods are in good agreement, and the fitting degree of the spray deposition curve obtained by the two methods is 0.8924. Taking the data obtained by the water-sensitive paper image processing method as a reference, the relative errors of the two measurements range from 3.26% to 40.03%. The mean relative error of the coefficient of variation is 17.67%.

4. Discussion

The coefficient of determination R2 of the regression curves between the sensor output voltage increment and the spray coverage on the sensor surface is low. This deviates from the results obtained by theoretical analysis. The method of spray coverage processing needs to be improved, which is a reason for the error. In future research, more accurate calibration methods to obtain spray coverage on LWS surfaces will be investigated. When analyzing the measuring spray coverage on an LWS surface, it assumes that there is no overlap of droplets sitting on the surface and that the spreading factor (ratio of droplet size and spot size) is independent from the droplet size. However, during actual spraying, the droplets adhered when they deposited on the sensor surface, resulting in a change in the shape of the droplets [28]. With the development of precise plant protection, the problems of large spray volume and spray adhesion will be reduced [29]. Spray coverage measurement using LWS will be used in the future.
The results show that the measuring system will have better repeatability under constant spray conditions. The research results of Foqué et al. [18] show that the LWS output voltages of the scattered droplets and the droplets that land on the same place are different. Although the capacitor is only sensitive to the dielectric material near the electrode [30], the droplets beyond the electrode may affect it.
The measurement results show that the uniformity of the measuring system built is relatively good. The reason for the relative errors of the two measurements outdoors is that the droplet size has a great influence on the measurement accuracy of the water-sensitive paper image analysis method [31], and the uneven ground in the field leads to the difference between the spray deposition on the sensor surface and that on the surface of the water-sensitive paper itself.
The conductivity, pH or surface tension of the liquid also will change the LWS output voltage increment [16,25]. The droplet formation on actual leaves also depends on the surface characteristics of leaves [32,33]. The droplet evaporation, the gravitational separation of droplets by size (deposition rate), the inertia of spray mechanisms, the method and the exposure time will affect the measurement accuracy for spray coverage and deposition quality. How to correct the changes caused by these problems will be the focus of later research.

5. Conclusions

In this article, we propose the use of LWS to measure spray coverage. The LWS was often used to measure spray deposition quality in previous studies. The principle of measuring spray coverage based on LWS was analyzed. When the spray conditions are constant, the spray coverage and LWS output voltage increment are linearly related. However, its linearity is affected by droplet adhesion. The coefficient of determination R2 of the regression curves is more than 0.75. These results showed that the sensor output voltage increment can be used to evaluate the spray coverage on the surface of the sensor. However, its measurement accuracy needs to be improved by considering the influencing factors (adhesion, evaporation) presented above.
Based on ZigBee wireless sensor technology, this paper reports an online measuring system for spray coverage and deposition quality. The homogeneity check results showed that the range of the relative errors of the coefficient of variation is less than 0.27%. The online measuring system can be used to test the uniformity of spray deposition. The outdoor test results showed that the relative errors of the two measurements range from 3.26% to 40.03%. The field experiment is affected by the uneven ground, resulting in the inconsistent distribution of the sensor surface and the surface of the water-sensitive paper and changes in operating conditions, resulting in a decrease in the accuracy of the measurement system. When the detection system is used to measure the droplet deposition, the measurement accuracy is greatly affected by the operating conditions.
With the development of precise plant protection, the problems of large spray volume and spray adhesion will be reduced. The measurement system will have great application prospects in precise plant protection. Using detecting systems to measure spray coverage and deposition quality will reduce costs and measurement cycles, which will promote the development of plant protection technology.

Author Contributions

Conceptualization, S.D., M.W. and M.O.; methodology, S.D., M.W., H.Z., R.G., C.W., G.W., Z.L. and H.C.; software, S.D. and M.W.; validation, M.O. and W.J.; resources, M.O.; data curation, S.D.; writing—original draft preparation, S.D.; writing—review and editing, S.D. and M.O.; funding acquisition, M.O. All authors have read and agreed to the published version of the manuscript.

Funding

This work was funded by the Project of the Faculty of Agricultural Equipment of Jiangsu University (grant number NZXB20210101).

Institutional Review Board Statement

Not applicable.

Informed Consent Statement

Not applicable.

Data Availability Statement

The data are available within the article.

Acknowledgments

The authors thank the Faculty of Agricultural Equipment of Jiangsu University and the High-tech Key Laboratory of Agricultural Equipment and Intelligence of Jiangsu Province for the facilities and support.

Conflicts of Interest

The authors declare no conflict of interest.

References

  1. Chahal, G.S.; Jordan, D.L.; Brandenburg, R.L.; Shew, B.B.; Burton, J.D.; Danehower, D.; York, A.C. Interactions of agrochemicals applied to peanut; part 3: Effects on insecticides and prohexadione calcium. Crop Prot. 2012, 41, 150–157. [Google Scholar] [CrossRef]
  2. Zhang, C.; Shi, G.; Shen, J.; Rui-Fa, H.U. Productivity effect and overuse of pesticide in crop production in China. J. Integr. Agric. 2015, 14, 1903–1910. [Google Scholar] [CrossRef]
  3. Wu, S.; Liu, J.; Wang, J.; Hao, D.; Wang, R. The Motion of Strawberry Leaves in an Air-Assisted Spray Field and its Influence on Droplet Deposition. Trans. ASABE 2021, 64, 83–93. [Google Scholar] [CrossRef]
  4. Sánchez-Hermosilla, J.; Páez, F.; Rincón, V.J.; Carvajal, F. Evaluation of the effect of spray pressure in hand-held sprayers in a greenhouse tomato crop. Crop Prot. 2013, 54, 121–125. [Google Scholar] [CrossRef]
  5. Appah, S.; Jia, W.; Ou, M.; Wang, P.; Asante, E.A. Analysis of potential impaction and phytotoxicity of surfactant-plant surface interaction in pesticide application. Crop Prot. 2020, 127, 104961. [Google Scholar] [CrossRef]
  6. Zhu, H.; Yu, Y.; Ozkan, H.E.; Derksen, R.C.; Krause, C.R. Influence of spray additives on droplet evaporation and residual patterns on wax and wax-free surfaces. In Proceedings of the 2008 ASABE Annual International Meeting, Providence, RI, USA, 29 June–2 July 2008. Paper No. 083752. [Google Scholar]
  7. Fox, R.D.; Derksen, R.C.; Cooper, J.A.; Krause, C.R.; Ozkan, H.E. Visual and image system measurement of spray deposits using water-sensitive paper. Appl. Eng. Agric. 2003, 19, 549. [Google Scholar]
  8. Hoffmann, W.C.; Hewitt, A.J. Comparison of three imaging systems for water-sensitive papers. Appl. Eng. Agric. 2005, 21, 961–964. [Google Scholar] [CrossRef]
  9. Zhu, H.; Salyani, M.; Fox, R.D. A portable scanning system for evaluation of spray deposit distribution. Comput. Electron. Agric. 2011, 76, 38–43. [Google Scholar] [CrossRef]
  10. Cunha, J.P.A.R.; Farnese, A.C.; Olivet, J.J. Computer programs for analysis of droplets sprayed on water sensitive papers. Planta Daninha 2013, 31, 715–720. [Google Scholar] [CrossRef] [Green Version]
  11. Fritz, B.K.; Hoffmann, W.C.; Jank, P. A fluorescent tracer method for evaluating spray transport and fate of field and laboratory spray applications. J. ASTM Int. 2011, 8, 1–9. [Google Scholar] [CrossRef]
  12. Hoffmann, W.C.; Kirk, I.W. Spray deposition and drift from two “medium” nozzles. Trans. ASAE 2005, 48, 5–11. [Google Scholar] [CrossRef]
  13. Salyani, M.; Serdynski, J. Development of a sensor for spray deposition assessment. Trans. ASAE 1990, 33, 1464. [Google Scholar] [CrossRef]
  14. Crowe, T.G.; Downey, D.; Giles, D.K. Digital device and technique for sensing distribution of spray deposition. Trans. ASAE 2005, 48, 2085–2093. [Google Scholar] [CrossRef]
  15. Melissa, A.; Joe, D.; Michael, P. Development and Preliminary Evaluation of a Spray Deposition Sensing System for Improving Pesticide Application. Sensors 2015, 15, 31965–31972. [Google Scholar]
  16. Wang, P.; Yu, W.; Ou, M.; Gong, C.; Jia, W. Monitoring of the Pesticide Droplet Deposition with a Novel Capacitance Sensor. Sensors 2019, 19, 537. [Google Scholar] [CrossRef] [Green Version]
  17. Zhang, R.; Chen, L.; Lan, Y.B.; Xu, G.; Kan, J.; Zhang, D. Development of a Deposit Sensing System for Aerial Spraying Application. Trans. Chin. Soc. Agric. Mach. 2014, 45, 123–127. [Google Scholar]
  18. Sun, C.; Qiu, W.; Ding, W.; Gu, J. Design and Experiment of a Real-Time Droplet Accumulating Mass Measurement System. Trans. ASABE 2017, 60, 615–624. [Google Scholar] [CrossRef]
  19. Wu, Y.; Qi, L.; Zhang, Y.; Elizabeth, M.; Li, S.; Cheng, Z. Design and test of real-time monitoring of droplet evaporation system based on standing wave and ZigBee. Trans. Chin. Soc. Agric. Eng. 2017, 33, 128–135. [Google Scholar]
  20. Wu, Y.; Qi, L.; Zhang, Y.; Gao, C.; Li, S.; Elizabeth, M. Design and experiment of pesticide droplet deposition detection system based on principle of standing wave ratio. Trans. Chin. Soc. Agric. Eng. 2017, 33, 64–71. [Google Scholar]
  21. Foqué, D.; Dekeyser, D.; Langenakens, J.; Nuyttens, D. Evaluating the usability of a leaf wetness sensor as a spray tech monitoring tool. Int. Adv. Pestic. Appl. 2018, 137, 191–200. [Google Scholar]
  22. Wei, Y.; Ziyuan, H.; Minzan, L.; Xu, Z. Detecting System Design of Droplet Deposition on Fruit Leaves. Trans. Chin. Soc. Agric. Mach. 2017, 48, 8–14. [Google Scholar]
  23. Nansen, C.; Ferguson, J.C.; Moore, J.; Groves, L.; Emery, R.; Garel, N.; Hewitt, A. Optimizing pesticide spray coverage using a novel web and smartphone tool, SnapCard. Agron. Sustain. Dev. 2015, 35, 1075–1085. [Google Scholar] [CrossRef]
  24. Xu, G.; Zhang, R.; Chen, L. Assessing the Ability of Image Processing Methods of Droplets Sprayed on Water Sensitive Papers for Aerial Application; Springer: Cham, Switzerland, 2016. [Google Scholar]
  25. Cunha, M.; Carvalho, C.; Marcal, A.R.S. Assessing the ability of image processing software to analyse spray quality on water-sensitive papers used as artificial targets. Biosyst. Eng. 2012, 111, 11–23. [Google Scholar] [CrossRef] [Green Version]
  26. Sama, M.P.; Weiss, A.M.; Benedict, E.K. Validating Spray Coverage Rate Using Liquid Mass on a Spray Card. Trans. ASABE 2018, 61, 887–895. [Google Scholar] [CrossRef]
  27. Yunyan, L.; Chuangrong, H. Experiment Design and Data Processing; Chemical Industry Press: Beijing, China, 2014; p. 257. [Google Scholar]
  28. Özlüoymak, Ö.B.; Bolat, A. Development and assessment of a novel imaging software for optimizing the spray parameters on water-sensitive papers-sciencedirect. Comput. Electron. Agric. 2020, 168, 105104. [Google Scholar] [CrossRef]
  29. Utstumo, T.; Urdal, F.; Brevik, A.; Dørum, J.; Netland, J.; Overskeid, Ø.; Berge, T.W.; Gravdahl, J.T. Robotic in-row weed control in vegetables. Comput. Electron. Agric. 2018, 154, 36–45. [Google Scholar] [CrossRef]
  30. Longworth, L.; Post, S.; Jermy, M.; Hendrickson, H.; Steel, J.; Cannon, E.; Brown, S. Evaluating capacitive wetness sensors for measuring deposition in electrostatically charged spraying operations-ScienceDirect. Comput. Electron. Agric. 2020, 179, 105829. [Google Scholar] [CrossRef]
  31. Thacker, J.R.M.; Hall, F.R. The effects of drop size and formulation upon the spread of pesticide droplets impacting on water-sensitive papers. J. Environ. Sci. Health Part B 1991, 26, 631–651. [Google Scholar] [CrossRef]
  32. Yu, Y.; Zhu, H.; Frantz, J.M.; Reding, M.E.; Chan, K.C.; Ozkan, H.E. Evaporation and coverage area of pesticide droplets on hairy and waxy leaves. Biosyst. Eng. 2009, 104, 324–334. [Google Scholar] [CrossRef]
  33. Zhu, H.; Yu, Y.; Ozkan, H.E. Influence of spray formulation and leaf surface structures on droplet evaporation and wetted area. Asp. Appl. Biol. 2010, 99, 333–340. [Google Scholar]
Figure 1. Network topology of the multipoint measuring system.
Agriculture 12 01195 g001
Figure 2. Multi-point measuring interface.
Agriculture 12 01195 g002
Figure 3. Schematic view of the coordinate for the spray.
Agriculture 12 01195 g003
Figure 4. Calibration curve calibration platform. 1 is the spray system, 2 is the LWS capacitive sensor, 3 is the acquisition and transmission node, 4 is the movable platform, 5 is the coordinator node and 6 is the PC tablet.
Agriculture 12 01195 g004
Figure 5. Multiple collector arrangement. A–E are the sensor measurement module.
Agriculture 12 01195 g005
Figure 6. Experimental detection steps.
Agriculture 12 01195 g006
Figure 7. Layout of field sampling points.
Agriculture 12 01195 g007
Figure 8. Image solution process.
Agriculture 12 01195 g008
Figure 9. Regression curve of the spray coverage of Lechler ST110−03 on the sensor surface. (a) is at 0.3 MPa, (b) is at 0.4 MPa, MRE represents the mean relative error of the observed spray coverage and the regression value.
Agriculture 12 01195 g009
Figure 10. Regression curve of the spray deposition of Lechler 110−01 at 0.3 MPa on the sensor surface. MRE represents the mean relative error of the observed spray deposition and the regression value.
Agriculture 12 01195 g010
Figure 11. Regression curve of the spray deposition of Lechler 110−03 on the sensor surface. (a) is at 0.3 MPa, (b) is at 0.4 MPa, MRE represents the mean relative error of the observed spray deposition and the regression value.
Agriculture 12 01195 g011
Figure 12. Comparison chart of droplet deposition quality measurement values. (a) compares water-sensitive paper coverage and the sensor voltage increment, and (b) compares the comparison chart for the measurement of droplet deposition quality.
Agriculture 12 01195 g012
Table 2. Calibration tests.
Group NumberNozzle TypeFlow Rate (MPa)Test Type
1Lechler ST110−030.3A
2Lechler ST110−030.4A
3Lechler ST110−010.3B
4Lechler ST110−030.3B
5Lechler ST110−030.4B
A represents the droplet coverage calibration test; B represents the droplet deposition quality calibration test.
Table 3. ANOVA of spray coverage.
Group Number F = M S R / S e   Fα (1, n − 2) Significance
14069.329.07**
22584.759.07**
M S R represents the mean square of the regression sum of squares SSR, and M S e represents the mean square of the residual sum of squares S S e . ** means that the linear relationship between x and y is very significant [27].
Table 4. ANOVA of spray deposition.
Group Number F = M S R / S e   Fα (1, n − 2) Significance
390.339.07**
41654.609.07**
51213.259.07**
M S R represents the mean square of the regression sum of squares SSR, and M S e represents the mean square of the residual sum of squares S S e ** means that the linear relationship between x and y is very significant.
Table 5. Coefficient of variation of the mean spray deposition.
Test NumberCoefficient of VariationRelative Error
Measuring SystemWeighing
14.92%4.80%0.12%
27.35%7.16%0.19%
37.06%6.95%0.11%
44.11%3.95%0.16%
55.88%5.61%0.27%
Publisher’s Note: MDPI stays neutral with regard to jurisdictional claims in published maps and institutional affiliations.

