Article

Nitrogen and Phosphorus Concentrations and Their Ratios as Indicators of Water Quality and Eutrophication of the Hydro-System Danube–Tisza–Danube

by
Radovan Savic
1,*,
Milica Stajic
1,
Boško Blagojević
1,
Atila Bezdan
1,
Milica Vranesevic
1,
Vesna Nikolić Jokanović
2,
Aleksandar Baumgertel
2,
Marina Bubalo Kovačić
3,
Jelena Horvatinec
3 and
Gabrijel Ondrasek
3
1
Faculty of Agriculture, University of Novi Sad, Trg D. Obradovica 1, 21000 Novi Sad, Serbia
2
Faculty of Forestry, University of Belgrade, Kneza Viseslava 1, 11000 Belgrade, Serbia
3
Faculty of Agriculture, University of Zagreb, Svetosimunska cesta 25, 10000 Zagreb, Croatia
*
Author to whom correspondence should be addressed.
Agriculture 2022, 12(7), 935; https://doi.org/10.3390/agriculture12070935
Submission received: 9 May 2022 / Revised: 14 June 2022 / Accepted: 24 June 2022 / Published: 28 June 2022
(This article belongs to the Section Agricultural Soils)

Abstract

:
Conserving clean and safe freshwater is a global challenge, with nitrogen (N) and phosphorus (P) as frequent limiting factors affecting water quality due to eutrophication. This paper provides a critical overview of the spatiotemporal variability in both nutrient concentrations and their total mass ratio (TN:TP) in the canal network of the Hydro system Danube–Tisza–Danube at 21 measuring locations monitored by the Environmental Protection Agency of the Republic of Serbia over a length of almost 1000 km, collected once a month during the last decade. A spatiotemporal variation in nutrient concentrations in the tested surface water samples was confirmed by correlations and cluster analyses. The highest TN concentrations were found in winter and early spring (non-vegetation season), and the highest TP concentrations in the middle of the year (vegetation season). The TN:TP mass ratio as an indicator of the eutrophication pointed out N and P co-limitation (TN:TP 8–24) in 64% of samples, N limitation (TN:TP < 8) was detected in 27% and P limitation (TN:TP > 24) in the remaining 9% of water samples. Such observations indicate slow-flowing, lowland water courses exposed to the effects of non-point and point contamination sources as nutrient runoff from the surrounding farmlands and/or urban and industrial zones, but further investigation is needed for clarification. These results are an important starting point for reducing N and P runoff loads and controlling source pollution to improve water quality and underpin recovery from eutrophication in the studied watershed.

1. Introduction

As an essential and irreplaceable natural resource, surface water is exposed to numerous natural and anthropogenic pressures from (non)point sources that can significantly compromise water quality and its ecological status [1,2,3,4,5]. Moreover, surface hydro-resources are very vulnerable to external influences. They can be instantly degraded and devasted from the deposited organo–mineral matrices, while the restoration to the previous uncontaminated state is usually a slow and technically very demanding process [6,7,8,9].
Numerous studies have often emphasized that hazardous and harmful substances such as heavy metals, PAHs, PCBs, and pesticides have direct toxic, mutagenic or carcinogenic effects on aquatic ecosystems, and on humans residing within the vicinity [10,11,12,13,14,15]. In addition, the quality of surface water can also be compromised by increased nutrient concentrations, primarily nitrogen (N) and/or phosphorus (P) compounds [16,17,18,19,20]. Problems resulting from nutrient excess can be especially profound in lakes, water accumulations or shallow and slow-flowing lowland water courses [1,21,22]. As a result, most of these aquatic ecosystems worldwide suffer from eutrophication, which is mainly caused by (i) the overloading of nutrients from agroecosystems and (ii) the discharge of untreated industrial or municipal wastewaters [23,24,25,26,27,28]. Eutrophication as a biological response of an aquatic system to excessive nutrient(s) input results in many adverse effects related to degradation of water quality and its limited use in industry and agriculture [29]. The consequences of eutrophication on aquatic ecosystems are well known and documented in numerous studies. The most profound are water and environmental quality degradation, algal blooms, reduced water clarity, oxygen depletion, alteration of taste and odor, fish deaths, loss of biodiversity including ecosystem services and negative impacts on human health [19,22,27,29,30,31,32,33,34,35].
In addition, other aspects, and issues of eutrophication, such as socioeconomic [36], hydrotechnical (e.g., reduced water flow and water course capacity, increased risk of flooding, impaired operational and hydrotechnical facilities, increased management costs, reduced aesthetic values of waterbodies) issues [22,37,38,39] are also very prominent.
Faced with the risk of elevated nutrient concentrations in surface waters, most European countries have significantly reduced and stabilized the nutrient balance in agroecosystems in recent decades. However, agroecosystems are still considered the most important non-point source of nutrients in water bodies [40,41,42,43], as even up to 80% of N and P in surface waters originate from the agricultural sector [44,45,46]. The processes of nutrient leaching and runoff from agricultural lands are extremely complex, difficult to quantify and control, and depend on many factors such as topography, climatic characteristics, land use, drainage systems, etc. [22,31,47,48]. The annual nutrient balance for agricultural soils in most EU countries is between 20–60 kg N/ha/year and 5–10 kg P/ha/year, but can be higher by multifold, e.g., almost 200 kg N/ha/year in the Netherlands and >20 kg P/ha/year in Ireland [44,46].
The concentrations of N and P compounds, their total content in water (TN and TP) as well as their ratio (TN:TP mass ratio) is crucial in determining the ecological state of water bodies and in assessing possible limitations towards recovery from eutrophication [39,49,50,51]. The relevance and importance of this issue has been reported in many studies dealing with the N and P concentration ratio [18,30,52,53,54,55], which is an important component in studying the state and changes of trophic structure, biochemical cycles, and biodiversity [56]. The balance between N and P is an important ecological indicator of eutrophication and ecosystem productivity, known as the Redfield ratio [57]. Any deviation of the TN:TP ratio can result in favoring the intensive growth of certain phytoplankton species [36,55].
Issues regarding nutrients and eutrophication in natural or artificial lakes, and other water courses (e.g., rivers, drainage canal networks), are present in Serbia and surrounding regions with similar agroecological conditions, especially in predominantly agricultural lowlands such as Vojvodina [25,37,38,58,59,60,61,62,63,64]. Such waterbodies face additional challenges, as they consist of finely structured sediments loaded with high concentrations of nutrients that interact between their solid and liquid matrices [1,22,33,65,66,67].
One of such examples is the multi-purpose Hydro-system Danube–Tisza–Danube (HS DTD), which is of great importance not only for Vojvodina, but for the broader region. Its main canal network (about 960 km long) consists of artificial and integrated smaller natural water courses. This channel network is incorporated into the farmlands, breaking the monotony of the “cultivated steppe”, ensuring a specific ambience and scenic values [37,38,63]. For most of the year, the channels are calm and shallow, with low flows; however, exposure to the effects of non-point source pollution from surrounding agricultural lands, as well as municipal and industrial sources, leads to dominantly untreated wastewaters stemming from these networks. These pollution sources potentially release significant amounts of N and P into the canal network of the HS DTD, while environmental conditions favor the occurrence and development of eutrophication [25,37,38,59,61,63].
However, most of the studies on eutrophication have examined the state of natural and artificial lakes, lagoons, and coastal waters, while there is a lack of results surrounding river systems [2,29,39], especially canal networks as elaborated in this study. Considering the environmental, economic, and hydrotechnical significance of HS DTD, and potential risk for its water quality, our main objectives were: (i) to provide an overview of the monthly variability of N and P concentrations), (ii) to present and analyze the spatiotemporal distribution of N and P concentrations, and (iii) to analyze the variability of TN:TP mass ratio in the canal network of the HS DTD water matrix based on the recent (2010–2019) dataset from the national water quality monitoring program. The analyses performed here can help identify the origin and nature of N and P pollution and accelerate the decision-making process for (inter)national action measures to reduce the impact of (non)point pollution sources on examined hydro-resources. Finally, the results represent a contribution in the development of nutrient control strategies in HS DTD and similar catchment areas.

2. Materials and Methods
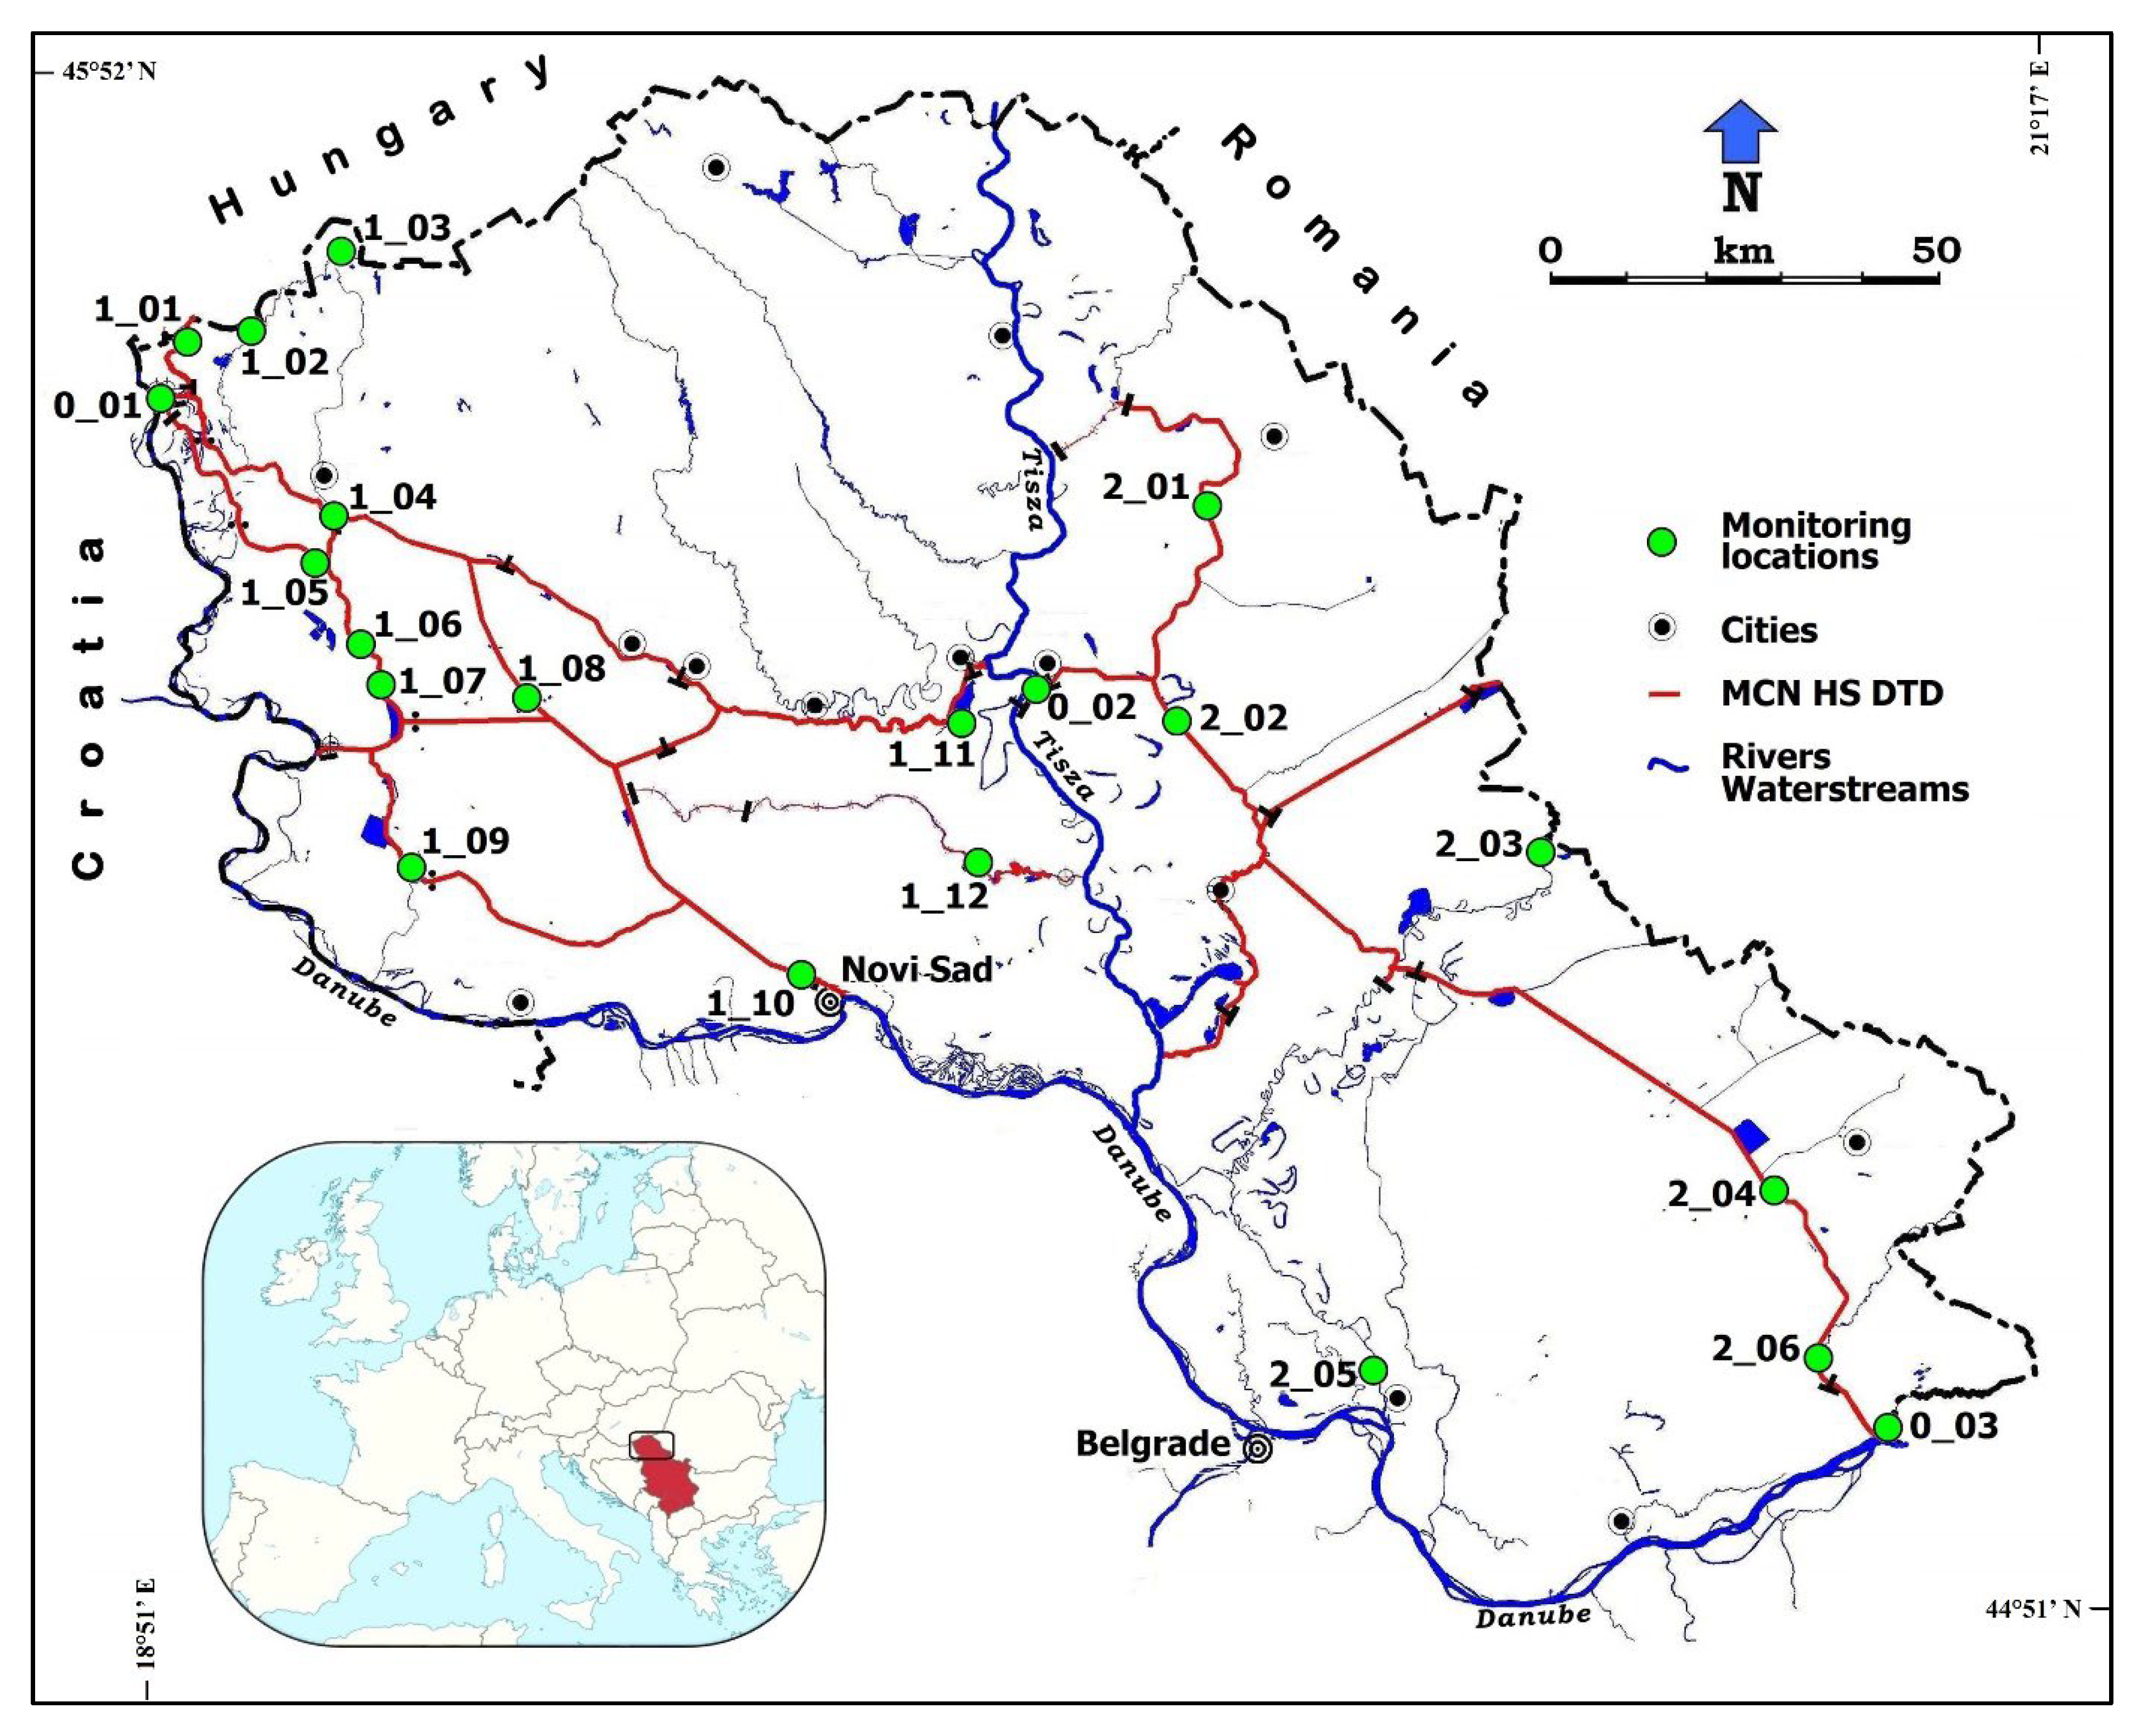
2.1. Study Area

The multi-purpose HS DTD is of crucial economic importance for the northern part of Serbia. The main uses of this hydro-system are drainage, water supply for industry and agriculture (irrigation), wastewater intake and transfer, inland navigation, flood control and protection and aquafarming. The system encompasses about 1.1 M ha of the catchment area, which extends from 44°51′-45°52′ N to 18°51′-21°17′ E (Figure 1). The landscape is predominantly lowland (75–90 m above sea), with a temperate continental climate with an average annual precipitation of ~600 mm and an average annual temperature of ~11 °C. This hydro system connects two large rivers, the Danube and the Tisza, and consists of a canal network of almost 1000 km long, with integrated smaller natural water courses and several hydrotechnical facilities (pumping stations, floodgates, ship locks) that ensure the maintenance of water regime. It is mainly composed of 20–40 m wide channels with navigable sections about 2–3 m deep [63,68,69,70]. In addition, there are about 250 smaller incorporated drainage systems in the watershed with a canal network of 16,000 km [63], most of which flow into the main canals of the HS DTD, loading it with nutrients from a wider catchment area.
Land resources in the surrounding of HS DTD are predominantly (75%) used for farming, and are of exceptional soil (chernozems, meadow black soils) fertility [37,63,69]. However, there are about 80 diverse urban zones with 1 M inhabitants adjacent to the canal network, as well as numerous industrial facilities. Such surrounding favors’ pollution of the canal network by agrochemicals and/or untreated wastewater from (non)point sources [13,71]. At the same time, the canals and their coasts serve as bio-oases, green ecological corridors that contribute to the biodiversity [7,37,38,63].

2.2. Data Collection and Analysis

This study elaborated water samples collected at 21 permanent locations of the National surface water-quality monitoring program in Serbia. Among them, three locations are situated on large international rivers: the main HS DTD water intakes on the Danube (0_01) and Tisza (0_02), and the final discharge from the canal network into the Danube (0_03). Other sampling points are located on the canals or smaller natural water courses integrated into the HS DTD network (Figure 1 and Table 1).
During the period 2010–2019, water samples were collected once a month to be analyzed for parameters relevant to determining the trophic state, such as specific forms and total N and P concentrations. Water samples were provided by the Environmental Protection Agency of the Republic of Serbia (SEPA), as an official accredited institution (ISO/IEC 17025:2006/2017) for the national water-monitoring programs. All water samples were analyzed in the accredited SEPA laboratory according to the following methods: nitrates (NO3-N): UP 1.98/PC 12; nitrites (NO2-N): UP 1.97/PC 12 and HACH Method 8507-EPA 353.2; ammonium (NH4-N): SRPS ISO 7150-1: 1992 and HACH Method 8155; dissolved organic nitrogen (DON): UP 1.27/PC 12, total nitrogen (TN): UP 1.27/PC 12; orthophosphates (PO4-P): UP 1.102/PC 12 and HACH method 8048-EPA 365.1; and total phosphorus (TP): APHA AWWA WEF 4500 (A, B, E).

2.3. Criteria for Water Quality Assessment

For the quality assessment of examined water samples, the classification prescribed by the currently valid legal acts of the Republic of Serbia were applied [72]. The limiting values for the concentrations of N, P, and their compounds for a good ecological status (first and second quality class out of five classes) within water courses are given in Table 2.
In addition, concentrations of total N (TN) and total P (TP) were used to estimate the potential risk of eutrophication. The following values were set as limits: TN > 1.5 mg/L and TP > 0.075, which corresponds to the eutrophic status of slow-flowing waters from similar studies [22,34,73,74,75,76,77,78]. Next, TN:TP mass ratio is frequently used as a significant ecological indicator for assessing the quality of surface waters and the trophic status of aquatic ecosystems. In this study, based on similar approaches we considered the following situations: TN:TP < 8 for N-limitation and TN:TP > 24 for P-limitation, with the zone of N- and P-co-limitation between these values, divided into two intervals: 8–16 and 16–24 [18,39,50,79,80].

2.4. Statistical Data Analyses

Descriptive statistical procedures were performed to determine characteristic parameters of the basic set of analyzed data on water quality from examined locations, including measures of central tendency, dispersion and distribution. The significance of the deviation of the set of water quality data from the average or reference limit values were analyzed using Student’s t test (for parameters that followed a normal distribution) or using a non-parametric one-sample Wilcoxon test (for a data set that did not follow a normal distribution), both for p < 0.05. The ratio between the variables (the analyzed water quality parameters) were determined through Pearson’s correlation analysis.
Cluster analysis (CA), as a multivariate statistical approach, defines the internal structure of a data set and groups it according to the selected water-quality parameters by linking sampling locations or months, i.e., seasonal distribution. Cluster analysis was applied for grouping data based on their similarity according to spatiotemporal distribution. Ward’s minimum variance method was used with Euclidean distances as a measure of similarity shown on the dendrogram [33,75,81,82,83,84,85,86,87]. Complete data were statistically processed using Statistica 14 TIBCO Software Inc. and Microsoft Office Excel.

3. Results and Discussion

3.1. Nutrient Status in the Canal Network

Figure 2 shows box-plot diagrams with characteristic values of the average monthly concentrations of the various N and P forms in examined water samples. Most of the recorded values (78.6–99.6%) in the studied period fell within the favorable range of good environmental status (Si), i.e., within the first and second classes. In addition, most of the observed parameters (NO2-N, NO3-N, TN, PO4-P and TP) had monthly average values well below the corresponding standard limits Si (Table 2), except of NH4-N (Figure 2). Results of both Student’s t test for normally distributed data and Wilcoxon test for data sets that did not follow normal distribution confirmed that all data sets are statistically significant for p < 0.05.
TN content was dominated by the dissolved inorganic forms—DIN (59.3%) in comparison with dissolved organic nitrogen—DON (40.7%). The nitrate form of N (NO3-N) had the highest average contribution (on average 51.1% from TN and 82.5% from DIN), followed by ammonium NH4-N (on average 9.4% from TN and 15.2% from DIN). The observed pattern of average contribution of certain N forms was: NO3-N (0.92 mg/L) > DON (0.69 mg/L) > NH4-N (0.17 mg/L) > NO2-N (0.025 mg/L), which is consistent with some other similar studies [88,89]. The average portion of orthophosphates PO4-P (0.124 mg/L) to total phosphorus-TP (0.205 mg/L) was 60.5%.
Parameters of descriptive statistics for datasets on concentrations of different forms of N and P in HS DTD canal water are shown in Table 3. Spatial and temporal variability of data and various natural and anthropogenic factors affected the heterogeneity of sets with relatively high coefficients of variation (CV > 0.30 for all parameters). However, variability was the highest for PO4, NH4 and NO2 (CV 1.54, 1.50 and 1.33, respectively). Most parameters (except NO3) showed strong positive asymmetry of datasets (skewness > 1, highly skewed) and higher frequency of below-average values. The calculated values of kurtosis were > 3, which is outside the range of normal elongation. An overly peaked, leptokurtic distribution was observed, with a large number of outliers in the data set, except for NO3 and TN (Table 3).
According to the criteria and limits for eutrophic status of surface waters in similar studies [22,34,73,75,77,78], and considering the observed average TN concentration (1.80 mg/L) and maximum TN concentration (5.95 mg/L), the examined HS DTD water can be classified as potentially eutrophic. The same is valid for TP concentration (avg. 0.205 mg/L, max. 1.215 mg/L), as shown in Table 3. TN was above 1.5 mg/L in 55.9% of the average monthly values and TP was above 0.075 mg/L in 87.7% of the average monthly values. Both limits were confirmed combined in 52.4% of average monthly values at all sampled locations. Based on the TN and TP indicators, there is a potential risk of eutrophication incidence provided there is coincidence of other relevant factors (temperature, chlorophyll, water transparency, oxygen level, etc.). Similar concentrations of N and P, their ranges and contribution of individual forms were reported in other studies on this issue [55,58,90].

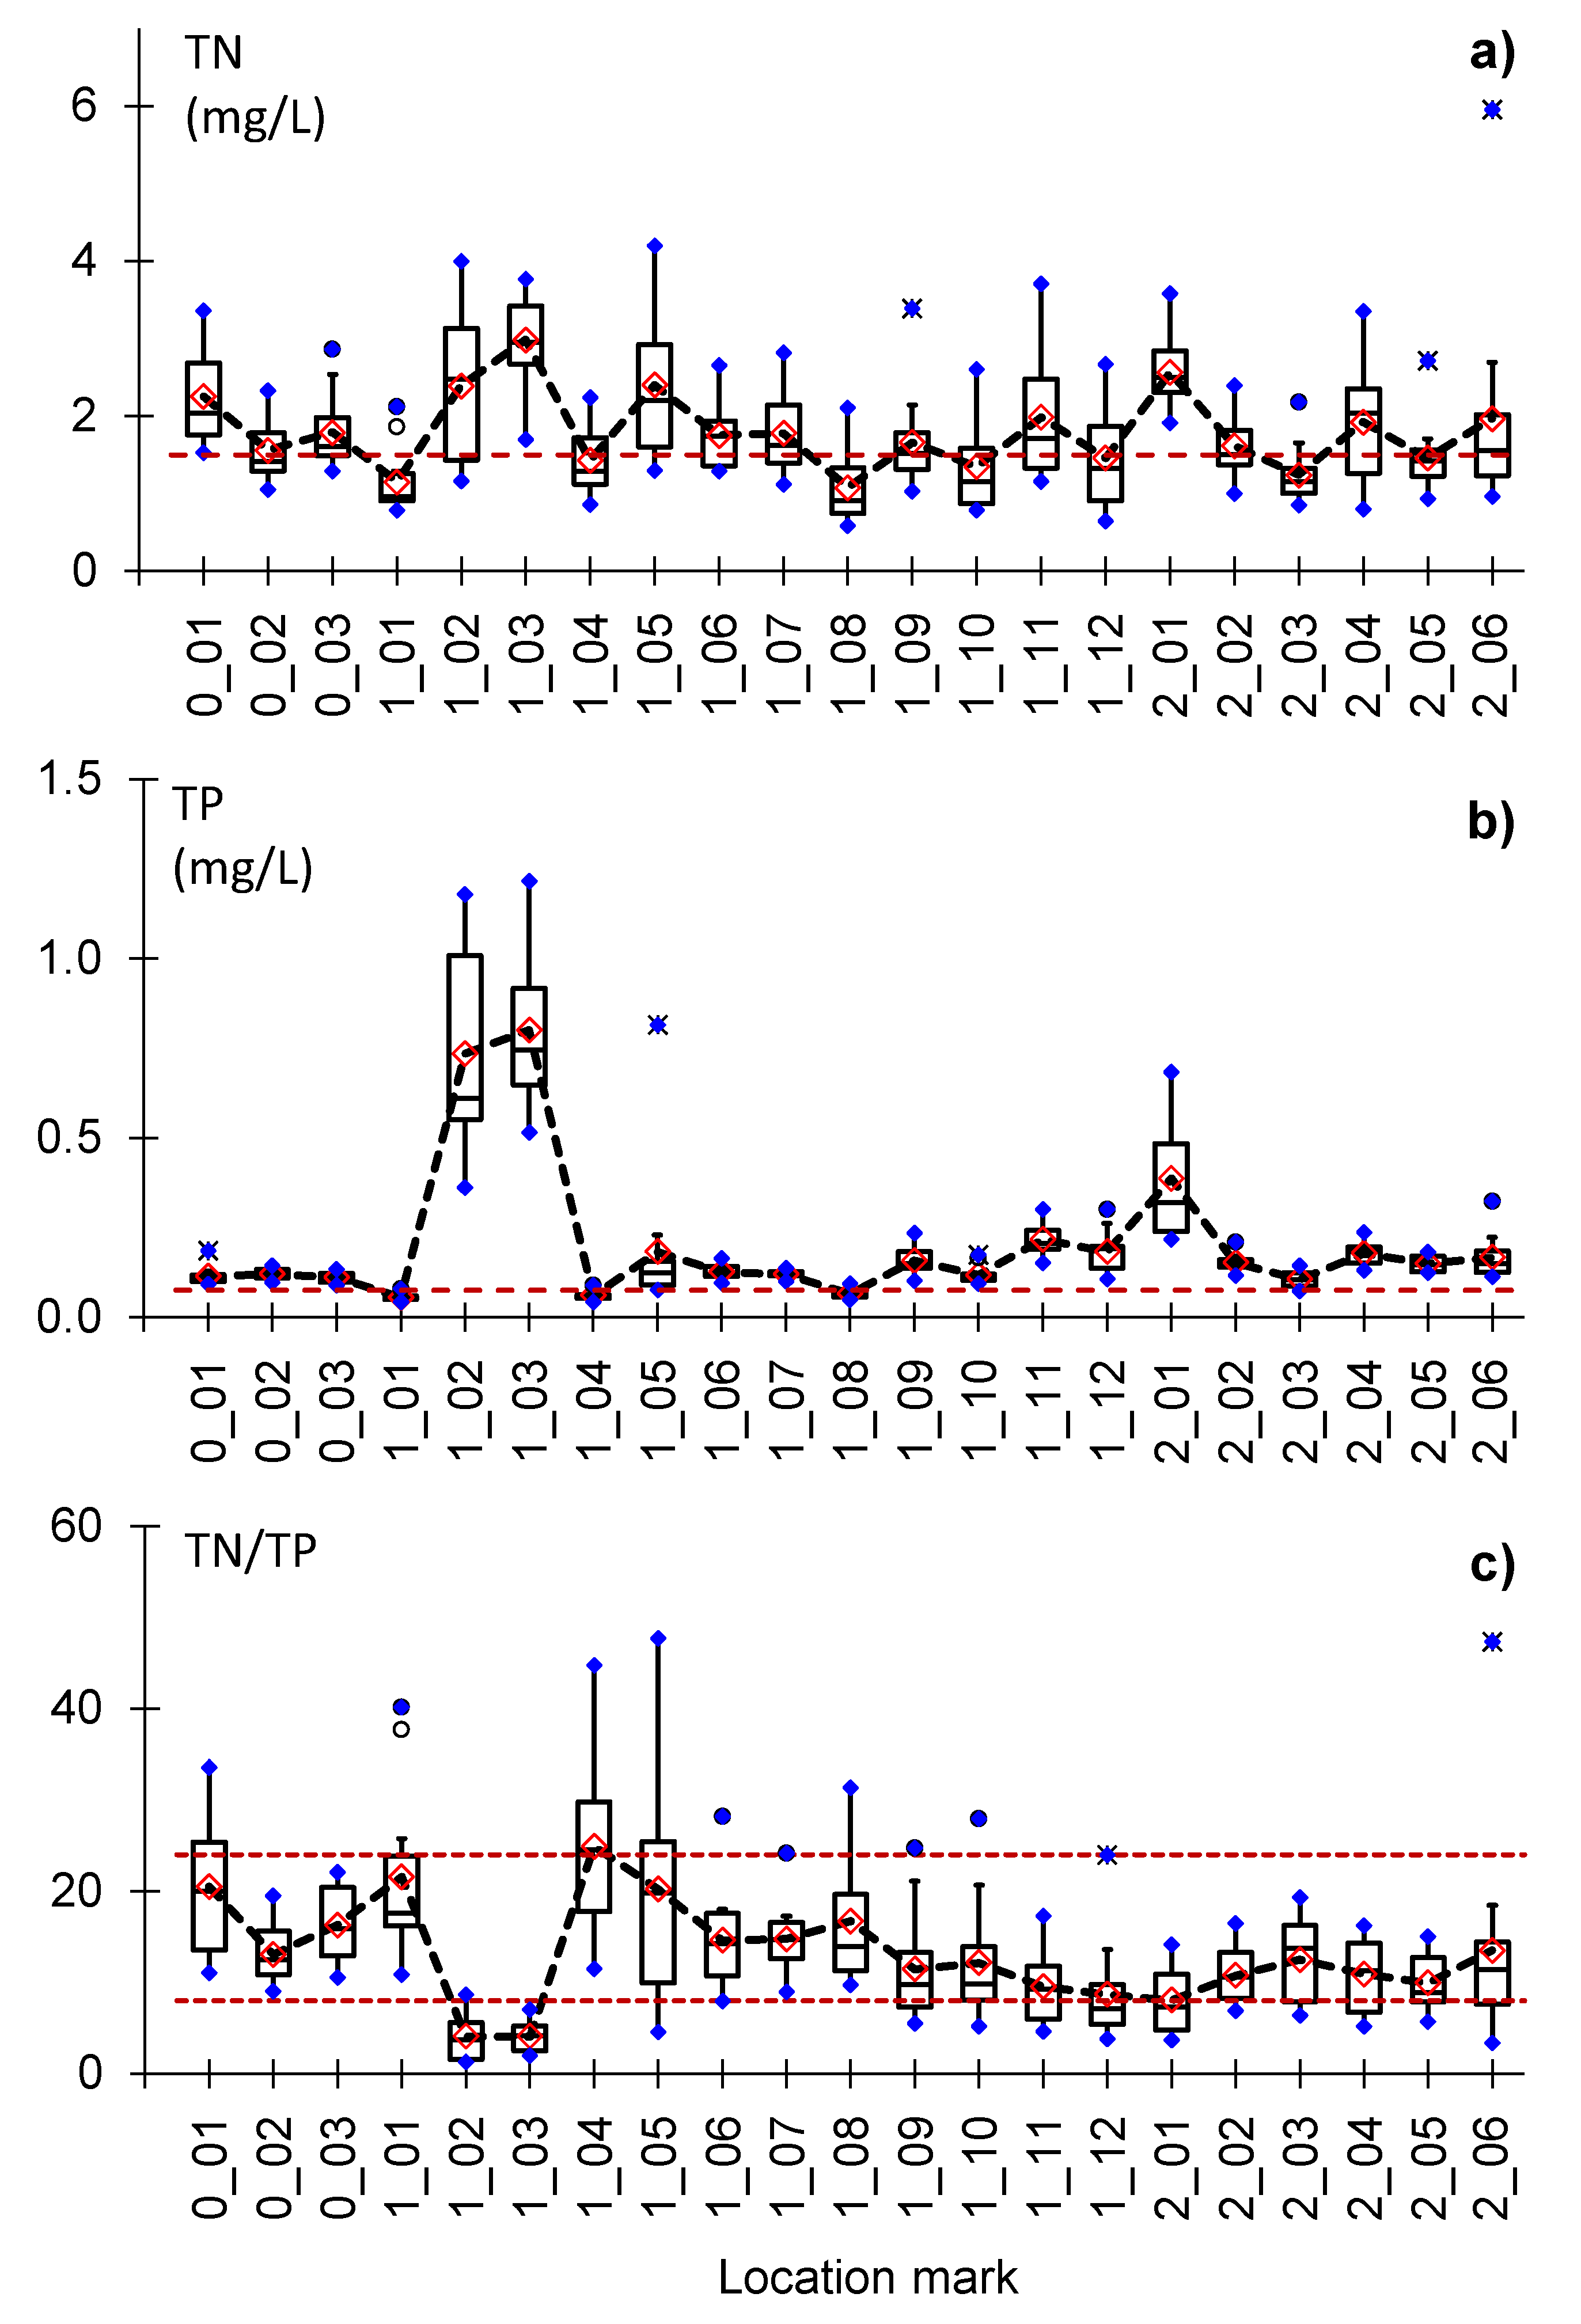
3.2. Spatial Distribution of TN and TP

The spatial distribution of average monthly TN and TP concentrations in the studied water samples during the 2010–2019 period is shown in Figure 3. The observed TN concentrations ranged from 0.59 to 5.95 mg/L, with an average concentration of 1.80 mg/L (Figure 3a). However, at five locations (0_01, 1_02, 1_03, 1_05, and 2_01), these concentrations were significantly higher than the overall average (t values ranged from 4.16 to 10.91 relative to t critical 2.09, for p < 0.05). In addition, at three locations (0_01, 1_03, and 2_01), average monthly TN concentrations exceeded the eutrophic status threshold (TN > 1.5 mg/L) during all 12 months. The lowest TN concentrations were reported at three locations (1_01, 1_08, and 2_03), exceeding the limit for 2–3 months per year (Figure 3a).
The corresponding values of TP concentrations ranged from 0.04 to 1.22 mg/L (average 0.20 mg/L; SD 0.06 mg/L), as shown in Figure 3b. However, at three locations (1_02, 1_03 and 2_01), levels were up to four-fold higher than the overall average. In addition, average monthly concentrations of TP were more frequently above the eutrophic status threshold (TP > 0.075 mg/L). This value was exceeded on average during all 12 months at 16 locations, and at two other locations during a period of 11 months. The remaining 3 locations (1_03, 2_02 and 2_06) showed higher values only during 1–3 months per year (Figure 3b).
There are various factors and circumstances that cause a wide range of N and P concentrations in the water samples studied, such as: (i) a number of monitoring stations, (ii) a well-developed channel network (960 km), (iii) long observation period (2000–2019), (iv) the frequency of sampling, (v) total catchment area (1.1 million ha), (vi) different land use and management, (vii) the impact of different (non)point sources and other relevant factors. However, which one is the most dominant remains to be clarified in the future by more specific investigations.

3.3. Seasonal Distribution of TN and TP

Monthly distribution of the average concentrations of TN and TP shows their seasonal character (Figure 4). The highest average TN concentrations were observed in winter and early spring (TN > 2 mg/L), while the lowest average values were observed in late spring and summer months, from May to September (TN ranged from 1.3 to 1.5 mg/L) as shown in Figure 4a. Thus, values most frequently exceeded the eutrophic status threshold (TN > 1.5 mg/L) from January to March (at 95.2–100% of the locations analyzed) and mostly lasted from July to September (at 19.1 to 23.8% of the locations).
The highest average TP values (TP > 0.25 mg/L) were observed from May to August. The same is valid for the maximum average monthly TP concentrations, which ranged from 1.0 to 1.25 mg/L during the same period. TP concentrations exceeded the eutrophic status limit (TP > 0.075 mg/L) for most of the year at the majority (18/21) of locations, while at three locations, corresponding values were above the limit from April to June, Figure 4b.
Such seasonal distribution of nutrients is common mostly for shallow, steady or slow-flowing waterbodies in similar climatic conditions. For example, ref. [90] reported that low water flow in summer months affected the reductive conditions, leading to minimum concentrations of N compounds and maximum P concentrations due to its release from sediments. Similar results of N and P distribution in surface water were reported in other studies [16,21,35,39,56,75,80,91]. Leaching and runoff of nutrients from the surrounding farmlands after heavy precipitation, or inflow of water from the drainage system, can impact the seasonal distribution of nutrients in a waterbody as well [1,7,22,55,58,75].

3.4. TN:TP Ratio

TN:TP mass ratio can be used to estimate conditions and limits for hyperproduction of certain algal species caused by macronutrient (s) loading or imbalance. Such estimates and classifications are based on the Redfield TN:TP 16:1 (mole) or 7.3:1 (mass) ratio [57]. For example, values < 7.3 indicate N limitation, while values > 7.3 indicate P limitation, implying a relative deficit/surplus of one nutrient responsible for accelerating eutrophication processes and algal blooms. In addition, estimates based on the TN:TP ratio can be even better indicator of the eutrophication risk than those obtained from other N and P forms or compounds [18,54,55,62,92,93]. In addition, Redfield TN:TP ratio was often corrected and adapted to local conditions (e.g., nutrient form and bioavailability, phytoplankton variations in nutrient requirements) in numerous studies [30,52,53,55,75,76,79,80,93,94,95,96,97,98]. Such an approach is suitable, since it provides a quick rough estimate of the limiting nutrients without extensive hydrobiological research [99].
Average monthly TN:TP mass ratios for the analyzed locations along HS DTD canal network ranged from 1.24–47.73 (avg. 13.25 and STD 8.18) (Figure 3c). TN:TP mass ratio (as different N and P forms), showed heterogeneity (Cv = 0.62), asymmetry (Skew = 1.49) and elongation (Kurt = 3.11), as presented in Table 3. The lowest average values of TN:TP mass ratio were found at the characteristic locations with high TN and TP concentrations (1_02 and 1_03), but also at locations 1_12 and 2_01 (Figure 3c). These values were significantly (p > 0.05) below the overall average TN:TP for all analyzed locations. In contrast, locations 0_01, 1_01, 1_04 and 1_05 recorded average TN:TP of: 20.51, 21.58, 24.93, 20.22, respectively, which was significantly higher (p < 0.05) from the overall average, Figure 3c. Analysis of the seasonal, monthly distribution of the average TN:TP mass ratio showed the highest values in winter and early spring (>20), and the lowest (8–9) from May to September (Figure 4c).
According to the calculated values of TN:TP mass ratio and applied criteria, potential N limitation (TN:TP<8) and P limitation (TN:TP > 24) were found in 9.1% and 27.0% of examined samples, respectively (Figure 5). The rest of the examined water samples (64%) were classified in the interval of simultaneous N and P co-limitation (Figure 5). These results are consistent with some other aquatic ecosystems; for example, simultaneous co-limitation of N and P is a common response of phytoplankton communities to nutrient inputs in 63% of shallow European and USA lakes [30,95].
At all examined locations, the average seasonal values of TN:TP mass ratio were by 1.2- to 2.8-fold higher (average 1.8) in the fall–winter period (non-vegetation period; average TN:TP = 16.91) than in the spring–summer period (vegetation period; average TN:TP = 9.60), as shown in Figure 6a. Additionally, the seasonal distribution of TN:TP mass ratio showed that the values < 8 (N-limitation) were mainly from the spring–summer period, while the values > 24 (P-limitation) were almost exclusively from the fall–winter period (Figure 6b and Table 4). In addition, the highest density of TN:TP mass ratio points from both periods (spring–summer and fall–winter) was between the limit lines 8:1 and 24:1 (N and P co-limitation) as presented in Figure 6b and Table 4.
The predicted limitations based on the TN:TP mass ratio may differ from the actual situation in particular waterbody, depending on climatic, hydrological, (agro)ecological and other conditions. Thus, the results should be considered only as a possible indicator for approximate estimation and prediction [29,30,80,94], as long as detailed studies are conducted at each particular location.

3.5. Correlation Analysis

The results of correlation analysis between average monthly TN, TP and TN:TP mass ratio concentrations in examined canal water samples are summarized in Table 5.
Considering examined locations (Table 5), a strong positive significant correlation (r = 0.76) was found between sets of average TN and TP values (Figure 3a,b). Such results indicate a possible similar origin and sources of nutrients at the analyzed locations and are in line with some recent studies [56,58,100]. Additionally, a strong statistically significant negative correlation (r = −0.71) (Table 5) was found between sets of average TP and TN:TP mass ratio values, per locations (Figure 3b,c).
Correlation analysis of datasets sorted by months (Figure 4) indicates a strong, significant positive correlation (r = 0.96) between TN and TN:TP mass ratio (Table 5). On the other hand, average TP concentrations showed reversed monthly distribution in relation to TN:TP ratio (r = −0.74), as presented in Table 5, per months [16,39,75,93].
The observed relationships between TN, TP, and TN:TP mass ratio are also very common for shallow, steady, or slow-flowing surface water [55,58,100], as characterized within the analyses of the HS DTD canal network. The occurrence of significant positive correlations of different intensities between certain N and P forms can indicate their similar origin in the analyzed waterbodies [56,88]. Additionally, a negative correlation is usually found in monthly TN and TP distribution and can be explained as a result of surface/underground leaching and runoff of nutrients, their uptake by plants, different meteorological and hydrological conditions, development of aquatic vegetation, etc. [22,27,90].

3.6. Cluster Analysis

The basis for clustering analysis (CA) was the mutual spatiotemporal similarity of the analyzed surface-water-quality parameters as; TN, TP, and TN:TP ratio (Figure 7), [33,75,81,82,83,84,85,86,87].
In our case, hierarchical agglomerative clustering grouped the analyzed locations into three clusters. For example, locations with codes 1_03, 0_01, 1_05, 1_02 and 2_01 had significantly above-average TN and/or TP concentrations (Figure 3), and were grouped into the first cluster (Figure 7a). Other locations had moderate values (closer to average) and thus were grouped into two clusters that merged into one.
In addition, three basic clusters have also been identified in the seasonal distribution using the CA approach (Figure 7b). The first cluster was formed by the monthly values from the spring–summer period (growing season), second cluster by the monthly values for January and February, and the third cluster by the monthly values for March, April, October, November and December. Clusters 2 and 3 are formed by all months from the fall–winter period (non-growing season), which are then combined into one cluster, with the exception of April. Recorded clustering of monthly values is consistent with previously discussed seasonal distribution of TN, TP and TN:TP mass ratio (Figure 4). Similar distributions of these surface-water-quality parameters are common in temperate continental climate regions, but they are essentially the result of seasonal dynamics of meteorological, hydrological, hydrobiological, agroecological and other factors [10,81,82,83].

4. Conclusions

The multi-purpose HS DTD is an important aquatic body within the Danube river basin, comprising artificial and native water courses that replenish agroecosystems and accept wastewaters of different origin. Correlation and cluster analyses confirmed spatial and temporal variations in increased concentration of TN, TP and their mass ratio across the examined 960 km-long HS DTD canal network at 21 water monitoring locations in the 2009–2019 period. At most locations, water quality can be classified as potentially eutrophic (TN > 1.5 mg/L and TP > 0.075 mg/L in, respectively, 56% and 88% of all average monthly values). The highest TN values were detected in the non-vegetation period (winter–early spring), whereas the highest TP concentrations were found during the vegetation season. In addition, the co-limitation of N and P (TN:TP 8–24) was detected in 64% of samples, whereas N (TN:TP <8) and P (TN:TP > 24) limitations were confirmed in 27% and 9% of the tested samples, respectively.
Observed results are specific for slow-flowing, lowland water courses, receiving nutrient inputs from surrounding farmlands and urban and industrial areas; however, further studies are needed for clarification. Increased concentrations of TN and TP and unfavorable TN:TP mass ratio indicate the need for contamination control and reduction, as well as control and limitation of nutrient input. This may be achieved through establishment of technical support for the ecological control of pollution arising from agriculture (fertilization management) and municipality and industry sources (wastewater treatment), as the principal causes of water-quality problems in the HS DTD canal network.

Author Contributions

Conceptualization and writing—draft preparation, R.S., M.S. and G.O.; literature collection and review, data analysis and interpretation, R.S., M.S., B.B., A.B. (Atila Bezdan), M.V., V.N.J.; A.B. (Aleksandar Baumgertel), M.B.K., J.H. and G.O. All authors: writing—review and editing. All authors have read and agreed to the published version of the manuscript.

Funding

This research was funded by the Provincial Secretariat for Higher Education and Scientific Research, AP Vojvodina, Republic of Serbia (Grant No. 142-451-2578/2021-01).

Institutional Review Board Statement

Not applicable.

Informed Consent Statement

Not applicable.

Data Availability Statement

Not applicable.

Acknowledgments

The authors are grateful to the Environmental Protection Agency of the Republic of Serbia (SEPA) for providing the input data for this study.

Conflicts of Interest

The authors declare no conflict of interest.

References

  1. Hui, X.C.; Jie, L.; Xiuyun, H.; Chunlei, C.; Zhou, S.Y. Sediment-Water Interaction in Phosphorus Cycling as Affected by Trophic States in a Chinese Shallow Lake (Lake Donghu). Hydrobiologia 2016, 776, 19–33. [Google Scholar] [CrossRef]
  2. Glińska-Lewczuk, K.; Gołaś, I.; Koc, J.; Gotkowska-Płachta, A.; Harnisz, M.; Rochwerger, A. The Impact of Urban Areas on the Water Quality Gradient along a Lowland River. Environ. Monit. Assess. 2016, 188, 624. [Google Scholar] [CrossRef] [PubMed]
  3. Khatri, N.; Tyagi, S. Influences of Natural and Anthropogenic Factors on Surface and Groundwater Quality in Rural and Urban Areas. Front. Life Sci. 2015, 8, 23–39. [Google Scholar] [CrossRef]
  4. Mentzafou, A.; Panagopoulos, Y.; Dimitriou, E. Designing the National Network for Automatic Monitoring of Water Quality Parameters in Greece. Water 2019, 11, 1310. [Google Scholar] [CrossRef] [Green Version]
  5. Spänhoff, B.; Dimmer, R.; Friese, H.; Harnapp, S.; Herbst, F.; Jenemann, K.; Mickel, A.; Rohde, S.; Schönherr, M.; Ziegler, K.; et al. Ecological Status of Rivers and Streams in Saxony (Germany) According to the Water Framework Directive and Prospects of Improvement. Water 2012, 4, 887. [Google Scholar] [CrossRef]
  6. Ren, L.; Cui, E.; Sun, H. Temporal and Spatial Variations in the Relationship between Urbanization and Water Quality. Environ. Sci. Pollut. Res. 2014, 21, 13646–13655. [Google Scholar] [CrossRef]
  7. Savic, R.; Ondrasek, G.; Blagojevic, B.; Bubalo Kovacic, M.; Zemunac, R. Spatial Distribution and Temporal Variation of Chemical Properties of Drainage Watercourses in Rural and Peri-Urban Areas of Novi Sad (Serbia)—A Case Study. Environ. Monit. Assess. 2018, 190, 53. [Google Scholar] [CrossRef]
  8. Su, S.; Li, D.; Zhang, Q.; Xiao, R.; Huang, F.; Wu, J. Temporal Trend and Source Apportionment of Water Pollution in Different Functional Zones of Qiantang River, China. Water Res. 2011, 45, 1781–1795. [Google Scholar] [CrossRef]
  9. Yu, S.; Yu, G.B.; Liu, Y.; Li, G.L.; Feng, S.; Wu, S.C.; Wong, M.H. Urbanization Impairs Surface Water Quality: Eutrophication and Metal Stress in the Grand Canal of China. River Res. Appl. 2012, 28, 1135–1148. [Google Scholar] [CrossRef]
  10. Barakat, A.; El Baghdadi, M.; Rais, J.; Aghezzaf, B.; Slassi, M. Assessment of Spatial and Seasonal Water Quality Variation of Oum Er Rbia River (Morocco) Using Multivariate Statistical Techniques. Int. Soil Water Conserv. Res. 2016, 4, 284–292. [Google Scholar] [CrossRef]
  11. Bhateria, R.; Jain, D. Water Quality Assessment of Lake Water: A Review. Sustain. Water Resour. Manag. 2016, 2, 161–173. [Google Scholar] [CrossRef] [Green Version]
  12. Brooks, B.W.; Lazorchak, J.M.; Howard, M.D.A.; Johnson, M.V.V.; Morton, S.L.; Perkins, D.A.K.; Reavie, E.D.; Scott, G.I.; Smith, S.A.; Steevens, J.A. Are Harmful Algal Blooms Becoming the Greatest Inland Water Quality Threat to Public Health and Aquatic Ecosystems? Environ. Toxicol. Chem. 2016, 35, 6–13. [Google Scholar] [CrossRef]
  13. Krčmar, D.; Dubovina, M.; Grba, N.; Pešić, V.; Watson, M.; Tričković, J.; Dalmacija, B. Distribution of Organic and Inorganic Substances in the Sediments of the “Great Bačka Canal”, a European Environmental Hotspot. Sci. Total Environ. 2017, 601–602, 833–844. [Google Scholar] [CrossRef]
  14. Savić, R.; Radović, J.R.; Ondrašek, G.; Pantelić, S. Occurrence and Sources of Polycyclic Aromatic Hydrocarbons (PAHs) in Drainage Channel Sediments in Vojvodina (Serbia). Environ. Eng. Manag. J. 2016, 15, 287–295. [Google Scholar] [CrossRef]
  15. Ustaoğlu, F.; Tepe, Y. Water Quality and Sediment Contamination Assessment of Pazarsuyu Stream, Turkey Using Multivariate Statistical Methods and Pollution Indicators. Int. Soil Water Conserv. Res. 2019, 7, 47–56. [Google Scholar] [CrossRef]
  16. Chen, D.; Lu, J.; Wang, H.; Shen, Y.; Kimberley, M.O. Seasonal Variations of Nitrogen and Phosphorus Retention in an Agricultural Drainage River in East China. Environ. Sci. Pollut. Res. 2010, 17, 312–320. [Google Scholar] [CrossRef]
  17. Newcomer Johnson, T.; Kaushal, S.; Mayer, P.; Smith, R.; Sivirichi, G. Nutrient Retention in Restored Streams and Rivers: A Global Review and Synthesis. Water 2016, 8, 116. [Google Scholar] [CrossRef] [Green Version]
  18. Paerl, H.W.; Scott, J.T.; McCarthy, M.J.; Newell, S.E.; Gardner, W.S.; Havens, K.E.; Hoffman, D.K.; Wilhelm, S.W.; Wurtsbaugh, W.A. It Takes Two to Tango: When and Where Dual Nutrient (N & P) Reductions Are Needed to Protect Lakes and Downstream Ecosystems. Environ. Sci. Technol. 2016, 50, 10805–10813. [Google Scholar] [CrossRef] [Green Version]
  19. Salas, E.A.L.; Subburayalu, S.K. Analysis of Phosphorus and Nitrogen Concentrations in the Great Miami and Little Miami Basins in Ohio, USA from 2015 to 2017. River Res. Appl. 2020, 36, 1345–1352. [Google Scholar] [CrossRef]
  20. Tekile, A.; Kim, I.; Kim, J. Mini-Review on River Eutrophication and Bottom Improvement Techniques, with Special Emphasis on the Nakdong River. J. Environ. Sci. 2015, 30, 113–121. [Google Scholar] [CrossRef]
  21. Niemistö, J.; Holmroos, H.; Pekcan-Hekim, Z.; Horppila, J. Interactions between Sediment Resuspension and Sediment Quality Decrease the TN: TP Ratio in a Shallow Lake. Limnol. Oceanogr. 2008, 53, 2407–2415. [Google Scholar] [CrossRef] [Green Version]
  22. Varol, M. Temporal and Spatial Dynamics of Nitrogen and Phosphorus in Surface Water and Sediments of a Transboundary River Located in the Semi-Arid Region of Turkey. CATENA 2013, 100, 1–9. [Google Scholar] [CrossRef]
  23. Carpenter, S.R.; Caraco, N.F.; Correll, D.L.; Howarth, R.W.; Sharpley, A.N.; Smith, V.H. Nonpoint Pollution of Surface Waters with Phosphorus and Nitrogen. Ecol. Appl. 1998, 8, 559–568. [Google Scholar] [CrossRef]
  24. Casquin, A.; Gu, S.; Dupas, R.; Petitjean, P.; Gruau, G.; Durand, P. River Network Alteration of C–N–P Dynamics in a Mesoscale Agricultural Catchment. Sci. Total Environ. 2020, 749, 141551. [Google Scholar] [CrossRef]
  25. Csathó, P.; Sisák, I.; Radimszky, L.; Lushaj, S.; Spiegel, H.; Nikolova, M.T.; Nikolov, N.; Čermák, P.; Klir, J.; Astover, A.; et al. Agriculture as a Source of Phosphorus Causing Eutrophication in Central and Eastern Europe. Soil Use Manag. 2007, 23, 36–56. [Google Scholar] [CrossRef]
  26. Dupas, R.; Delmas, M.; Dorioz, J.M.; Garnier, J.; Moatar, F.; Gascuel-Odoux, C. Assessing the Impact of Agricultural Pressures on N and P Loads and Eutrophication Risk. Ecol. Indic. 2015, 48, 396–407. [Google Scholar] [CrossRef]
  27. Stefanidis, K.; Christopoulou, A.; Poulos, S.; Dassenakis, E.; Dimitriou, E. Nitrogen and Phosphorus Loads in Greek Rivers: Implications for Management in Compliance with the Water Framework Directive. Water 2020, 12, 1531. [Google Scholar] [CrossRef]
  28. Van Drecht, G.; Bouwman, A.F.; Harrison, J.; Knoop, J.M. Global Nitrogen and Phosphate in Urban Wastewater for the Period 1970 to 2050. Glob. Biogeochem. Cycles 2009, 23, GB0A03. [Google Scholar] [CrossRef] [Green Version]
  29. Wurtsbaugh, W.A.; Paerl, H.W.; Dodds, W.K. Nutrients, Eutrophication and Harmful Algal Blooms along the Freshwater to Marine Continuum. WIREs Water 2019, 6, e1373. [Google Scholar] [CrossRef]
  30. Dzialowski, A.R.; Wang, S.-H.; Lim, N.-C.; Spotts, W.W.; Huggins, D.G. Nutrient Limitation of Phytoplankton Growth in Central Plains Reservoirs, USA. J. Plankton Res. 2005, 27, 587–595. [Google Scholar] [CrossRef]
  31. Oppeltová, P.; Kasal, P.; Krátký, F.; Hajšlová, J. Analysis of Selected Water Quality Indicators from Runoff during Potato Cultivation after Natural Precipitation. Agriculture 2021, 11, 1220. [Google Scholar] [CrossRef]
  32. Smith, V.H.; Schindler, D.W. Eutrophication Science: Where Do We Go from Here? Trends Ecol. Evol. 2009, 24., 201–207. [Google Scholar] [CrossRef] [PubMed]
  33. Varol, M.; Şen, B. Assessment of Nutrient and Heavy Metal Contamination in Surface Water and Sediments of the Upper Tigris River, Turkey. CATENA 2012, 92, 1–10. [Google Scholar] [CrossRef]
  34. Yang, X.E.; Wu, X.; Hao, H.L.; He, Z.L. Mechanisms and Assessment of Water Eutrophication. J. Zhejiang Univ. Sci. B 2008, 9, 197–209. [Google Scholar] [CrossRef] [PubMed]
  35. Zhang, W.; Jin, X.; Liu, D.; Lang, C.; Shan, B. Temporal and Spatial Variation of Nitrogen and Phosphorus and Eutrophication Assessment for a Typical Arid River—Fuyang River in Northern China. J. Environ. Sci. 2017, 55, 41–48. [Google Scholar] [CrossRef] [PubMed]
  36. Chen, N.; Peng, B.; Hong, H.; Turyaheebwa, N.; Cui, S.; Mo, X. Nutrient Enrichment and N:P Ratio Decline in a Coastal Bay–River System in Southeast China: The Need for a Dual Nutrient (N and P) Management Strategy. Ocean Coast. Manag. 2013, 81, 7–13. [Google Scholar] [CrossRef]
  37. Savic, R.; Ondrasek, G.; Letic, L.; Nikolic, V.; Tanaskovik, V. Nutrients Accumulation in Drainage Channel Sediments. Int. J. Sediment Res. 2017, 32, 180–185. [Google Scholar] [CrossRef]
  38. Savic, R.; Ondrasek, G.; Zemunac, R.; Bubalo Kovacic, M.; Kranjcec, F.; Nikolic Jokanovic, V.; Bezdan, A. Longitudinal Distribution of Macronutrients in the Sediments of Jegricka Watercourse in Vojvodina, Serbia. Sci. Total Environ. 2021, 754, 142138. [Google Scholar] [CrossRef]
  39. Voutsa, D.; Manoli, E.; Samara, C.; Sofoniou, M.; Stratis, I. A Study of Surface Water Quality in Macedonia, Greece: Speciation of Nitrogen and Phosphorus. Water Air. Soil Pollut. 2001, 129, 13–32. [Google Scholar] [CrossRef]
  40. Bechmann, M.; Greipsland, I.; Øgaard, A.F. Implementation of Mitigation Measures to Reduce Phosphorus Losses: The Vestre Vansjø Pilot Catchment. Agriculture 2019, 9, 15. [Google Scholar] [CrossRef] [Green Version]
  41. Guignard, M.S.; Leitch, A.R.; Acquisti, C.; Eizaguirre, C.; Elser, J.J.; Hessen, D.O.; Jeyasingh, P.D.; Neiman, M.; Richardson, A.E.; Soltis, P.S.; et al. Impacts of Nitrogen and Phosphorus: From Genomes to Natural Ecosystems and Agriculture. Front. Ecol. Evol. 2017, 5, 70. [Google Scholar] [CrossRef] [Green Version]
  42. Ondrasek, G.; Bakić Begić, H.; Zovko, M.; Filipović, L.; Meriño-Gergichevich, C.; Savić, R.; Rengel, Z.; Ondrašek, G.; Bakić Begić, H.; Zovko, M.; et al. Biogeochemistry of Soil Organic Matter in Agroecosystems & Environmental Implications. Sci. Total Environ. 2019, 658, 1559–1573. [Google Scholar] [CrossRef]
  43. Withers, P.J.A.; Neal, C.; Jarvie, H.P.; Doody, D.G. Agriculture and Eutrophication: Where Do We Go from Here? Sustainability 2014, 6, 5853–5875. [Google Scholar] [CrossRef] [Green Version]
  44. OECD (Organisation for Economic Cooperation and Development). Environmental Performance of Agriculture in OECD Countries Since 1990; OECD: Paris, France, 2008; Volume 9789264040854. [Google Scholar]
  45. Ondrasek, G.; Bakić Begić, H.; Romić, D.; Brkić, Ž.; Husnjak, S.; Bubalo Kovačić, M. A Novel LUMNAqSoP Approach for Prioritising Groundwater Monitoring Stations for Implementation of the Nitrates Directive. Environ. Sci. Eur. 2021, 33, 23. [Google Scholar] [CrossRef]
  46. Parris, K. Impact of Agriculture on Water Pollution in OECD Countries: Recent Trends and Future Prospects. Int. J. Water Resour. Dev. 2011, 27, 33–52. [Google Scholar] [CrossRef] [Green Version]
  47. Gramlich, A.; Stoll, S.; Stamm, C.; Walter, T.; Prasuhn, V. Effects of Artificial Land Drainage on Hydrology, Nutrient and Pesticide Fluxes from Agricultural Fields—A Review. Agric. Ecosyst. Environ. 2018, 266, 84–99. [Google Scholar] [CrossRef]
  48. Olaoye, I.A.; Confesor, R.B.; Ortiz, J.D. Impact of Agricultural Practices on Water Quality of Old Woman Creek Watershed, Ohio. Agriculture 2021, 11, 426. [Google Scholar] [CrossRef]
  49. Downing, J.A.; Mccauley, E. The Nitrogen: Phosphorus Relationship in Lakes. Limnol. Oceanogr. 1992, 37, 936–945. [Google Scholar] [CrossRef] [Green Version]
  50. Jarvie, H.P.; Whitton, B.A.; Neal, C. Nitrogen and Phosphorus in East Coast British Rivers: Speciation, Sources and Biological Significance. Sci. Total Environ. 1998, 210–211, 79–109. [Google Scholar] [CrossRef]
  51. Stelzer, R.S.; Lamberti, G.A. Effects of N:P Ratio and Total Nutrient Concentration on Stream Periphyton Community Structure, Biomass, and Elemental Composition. Limnol. Oceanogr. 2001, 46, 356–367. [Google Scholar] [CrossRef]
  52. Fujimotol, N.; Sudo, R.; Sugiura, N.; Inamori, Y. Nutrient-Limited Growth of Microcystis Aeruginosa and Phomzidium Tenue and Competition under Various N:P Supply Ratios and Temperatures. Limnol. Oceanogr. 1997, 42, 250–256. [Google Scholar] [CrossRef]
  53. Kilic Taseli, B. Water Quality Changes in Uzungol Lake Due to Influent Tributaries and Land-Based Fish-Farms. Carpathian J. Earth Environ. Sci. 2013, 8, 125–136. [Google Scholar]
  54. Seip, K.L. Phosphorus and Nitrogen Limitation of Algal Biomass across Trophic Gradients. Aquat. Sci. 1994, 56, 16–28. [Google Scholar] [CrossRef]
  55. Yamazaki, Y.; Muneoka, T.; Okazawa, H.; Kimura, M.; Tsuji, O. Influence of the Agricultural Land Agglomeration to the Nutrients of the River Water in the Tokachi River Basin. Paddy Water Environ. 2017, 15, 277–290. [Google Scholar] [CrossRef]
  56. Zhang, W.; Jin, X.; Shan, B. Spatial and Temporal Variations of Nutrition in Representative River Networks in Southwest China. Environ. Monit. Assess. 2018, 190, 707. [Google Scholar] [CrossRef]
  57. Redfield, A.C. The Biological Control of Chemical Factors in the Environment. Sci. Prog. 1960, 11, 150–170. [Google Scholar]
  58. Dević, G.; Sakan, S.; Đorđević, D. Assessment of the Environmental Significance of Nutrients and Heavy Metal Pollution in the River Network of Serbia. Environ. Sci. Pollut. Res. 2016, 23, 282–297. [Google Scholar] [CrossRef]
  59. Dzigurski, D.; Stojanovic, S.; Knezevic, A.; Nikolic, L.; Ljevnaic-Masic, B. Vegetation of the Classes Hydrochari-Lemnetea Oberd. 1967 and Potametea Tx. et Prsg. 1942 in the Jegrička Watercourse (The Province of Vojvodina, Serbia). Zb. Matice Srp. Za Prir. Nauk. 2010, 118, 99–106. [Google Scholar] [CrossRef]
  60. Istvánovics, V.; Honti, M. Efficiency of Nutrient Management in Controlling Eutrophication of Running Waters in the Middle Danube Basin. Hydrobiologia 2012, 686, 55–71. [Google Scholar] [CrossRef]
  61. Ljevnaić-Mašić, B.; Džigurski, D.; Nikolić, L.; Brdar-Jokanović, M.; Čabilovski, R.; Ćirić, V.; Petrović, A. Assessment of the Habitat Conditions of a Rare and Endangered Inland Saline Wetland Community with Bolboschoenus maritimus (L.) Palla Dominance in Southeastern Europe: The Effects of Physical–Chemical Water and Soil Properties. Wetl. Ecol. Manag. 2020, 28, 421–438. [Google Scholar] [CrossRef]
  62. Peršić, V.; Horvatić, J.; Has-Schön, E.; Bogut, I. Changes in N and P Limitation Induced by Water Level Fluctuations in Nature Park Kopački Rit (Croatia): Nutrient Enrichment Bioassay. Aquat. Ecol. 2009, 43, 27–36. [Google Scholar] [CrossRef]
  63. Savic, R.; Belic, A.; Pantelic, S. Comparative Review of Sediment Properties from Drainage Canals. Pol. J. Environ. Stud. 2013, 22, 849–859. [Google Scholar]
  64. Svirčev, Z.; Simeunović, J.; Subakov-Simić, G.; Krstić, S.; Pantelić, D.; Dulić, T. Cyanobacterial Blooms and Their Toxicity in Vojvodina Lakes, Serbia. Int. J. Environ. Res. 2013, 7, 745–758. [Google Scholar]
  65. McDowell, R.W.; Sharpley, A.N. Atmospheric Deposition Contributes Little Nutrient and Sediment to Stream Flow from an Agricultural Watershed. Agric. Ecosyst. Environ. 2009, 134, 19–23. [Google Scholar] [CrossRef]
  66. Neal, C.; Davies, H.; Neal, M. Water Quality, Nutrients and the Water Framework Directive in an Agricultural Region: The Lower Humber Rivers, Northern England. J. Hydrol. 2008, 350, 232–245. [Google Scholar] [CrossRef]
  67. Rozpondek, K.; Rozpondek Rafałand Pachura, P. Characteristics of Spatial Distribution of Phosphorus and Nitrogen in the Bottom Sediments of the Water Reservoir Poraj. J. Ecol. Eng. 2017, 18, 178–184. [Google Scholar] [CrossRef]
  68. Kadović, R.; Belanović, S.; Ristić, R.; Knežević, M.; Kostadinov, S.; Beloica, J.; Radić, B.; Dragović, N.; Milijić, S.; Miljanović, D.; et al. Deposol Reclamation along a Canal of the Danube-Tisza-Danube Hydro System. Pol. J. Environ. Stud. 2014, 23, 1185–1194. [Google Scholar]
  69. Milanović, A.; Milijašević, D.; Brankov, J. Assessment of Polluting Effects and Surface Water Quality Using Water Pollution Index: A Case Study of Hydro–System Danube–Tisa–Danube, Serbia. Carpathian J. Earth Environ. Sci. 2011, 6, 269–277. [Google Scholar]
  70. Zemunac, R.; Savic, R.; Blagojevic, B.; Benka, P.; Bezdan, A.; Salvai, A. Assessment of Surface and Groundwater Quality for Irrigation Purposes in the Danube-Tisa-Danube Hydrosystem Area (Serbia). Environ. Monit. Assess. 2021, 193, 519. [Google Scholar] [CrossRef]
  71. Josimov-Dundjerski, J.; Savić, R.; Belić, A.; Salvai, A.; Grabić, J. Sustainability of the Constructed Wetland Based on the Characteristics in Effluent. Soil Water Res. 2015, 10, 114–120. [Google Scholar] [CrossRef] [Green Version]
  72. Official Gazette, Republic of Serbia. Regulation on the Parameters of Ecological and Chemical Status of Surface Waters and Parameters of Chemical Status and Quantitative Status of Groundwaters; Serbian Legislation, Official Gazette of the RS, 74/2011; Ministry of Agriculture and Environmental Protection: Belgade, Serbia, 2011. (In Serbian) [Google Scholar]
  73. Diatta, J.; Waraczewska, Z.; Grzebisz, W.; Niewiadomska, A.; Tatuśko-Krygier, N. Eutrophication Induction Via N/P and P/N Ratios Under Controlled Conditions-Effects of Temperature and Water Sources. Water Air Soil Pollut. 2020, 231, 149. [Google Scholar] [CrossRef] [Green Version]
  74. ICPDR (International Commission for the Protection of the Danube River). Joint Danube Survey. Technical Report of the International Commission for the Protection of the Danube River; ICPDR: Vienna, Austria, 2002; 30p. [Google Scholar]
  75. Liu, X.; Zhang, G.; Sun, G.; Wu, Y.; Chen, Y. Assessment of Lake Water Quality and Eutrophication Risk in an Agricultural Irrigation Area: A Case Study of the Chagan Lake in Northeast China. Water 2019, 11, 2380. [Google Scholar] [CrossRef] [Green Version]
  76. OECD (Organisation for Economic Cooperation and Development). Eutrophication of Waters: Monitoring, Assessment and Control; No. 42077; OECD: Paris, France, 1982. [Google Scholar]
  77. Poikane, S.; Kelly, M.G.; Salas Herrero, F.; Pitt, J.A.; Jarvie, H.P.; Claussen, U.; Leujak, W.; Lyche Solheim, A.; Teixeira, H.; Phillips, G. Nutrient Criteria for Surface Waters under the European Water Framework Directive: Current State-of-the-Art, Challenges and Future Outlook. Sci. Total Environ. 2019, 695, 133888. [Google Scholar] [CrossRef]
  78. Wojtkowska, M.; Bojanowski, D. Assessing Trophic State of Surface Waters of Służewiecki Stream (Warsaw). Appl. Water Sci. 2021, 11, 118. [Google Scholar] [CrossRef]
  79. Abell, J.M.; Özkundakci, D.; Hamilton, D.P. Nitrogen and Phosphorus Limitation of Phytoplankton Growth in New Zealand Lakes: Implications for Eutrophication Control. Ecosystems 2010, 13, 966–977. [Google Scholar] [CrossRef] [Green Version]
  80. Søndergaard, M.; Lauridsen, T.L.; Johansson, L.S.; Jeppesen, E. Nitrogen or Phosphorus Limitation in Lakes and Its Impact on Phytoplankton Biomass and Submerged Macrophyte Cover. Hydrobiologia 2017, 795, 35–48. [Google Scholar] [CrossRef]
  81. Zhao, J.; Fu, G.; Lei, K.; Li, Y. Multivariate Analysis of Surface Water Quality in the Three Gorges Area of China and Implications for Water Management. J. Environ. Sci. 2011, 23, 1460–1471. [Google Scholar] [CrossRef]
  82. Wang, Y.; Wang, P.; Bai, Y.; Tian, Z.; Li, J.; Shao, X.; Mustavich, L.F.; Li, B.L. Assessment of Surface Water Quality via Multivariate Statistical Techniques: A Case Study of the Songhua River Harbin Region, China. J. Hydro-Environ. Res. 2013, 7, 30–40. [Google Scholar] [CrossRef]
  83. Voza, D.; Vukovic, M.; Takic, L.; Nikolic, D.; Mladenovic-Ranisavljevic, I. Application of Multivariate Statistical Techniques in the Water Quality Assessment of Danube River, Serbia. Arch. Environ. Prot. 2015, 41, 96–103. [Google Scholar] [CrossRef] [Green Version]
  84. Matijevic, B.M.; Vastag, D.D.; Becelic-Tomin, M.R.; Dalmacija, B.D.; Apostolov, S.L. Interpretation of the Results of Surface Water Quality Applying Multivariate Analysis. Hem. Ind. 2015, 69, 29–37. [Google Scholar] [CrossRef] [Green Version]
  85. Singh, K.P.; Malik, A.; Mohan, D.; Sinha, S. Multivariate Statistical Techniques for the Evaluation of Spatial and Temporal Variations in Water Quality of Gomti River (India)—A Case Study. Water Res. 2004, 38, 3980–3992. [Google Scholar] [CrossRef]
  86. Singh, G.; Patel, N.; Jindal, T.; Srivastava, P.; Bhowmik, A. Assessment of Spatial and Temporal Variations in Water Quality by the Application of Multivariate Statistical Methods in the Kali River, Uttar Pradesh, India. Environ. Monit. Assess. 2020, 192, 394. [Google Scholar] [CrossRef]
  87. Chounlamany, V.; Tanchuling, M.A.; Inoue, T. Spatial and Temporal Variation of Water Quality of a Segment of Marikina River Using Multivariate Statistical Methods. Water Sci. Technol. 2017, 76, 1510–1522. [Google Scholar] [CrossRef]
  88. Mgelwa, A.S.; Hu, Y.L.; Ngaba, M.J.Y. Patterns of Nitrogen Concentrations and Their Controls in Two Southern China Urban River Ecosystems. Glob. Ecol. Conserv. 2020, 23, e01112. [Google Scholar] [CrossRef]
  89. Liu, Y.; Zhu, Y.; Qiao, X.; Zheng, B.; Chang, S.; Fu, Q. Investigation of Nitrogen and Phosphorus Contents in Water in the Tributaries of Danjiangkou Reservoir. R. Soc. Open Sci. 2018, 5, 170624. [Google Scholar] [CrossRef] [Green Version]
  90. Vrzel, J.; Ogrinc, N. Nutrient Variations in the Sava River Basin. J. Soils Sediments 2015, 15, 2380–2386. [Google Scholar] [CrossRef] [Green Version]
  91. Correll, D.L. The Role of Phosphorus in the Eutrophication of Receiving Waters: A Review. J. Environ. Qual. 1998, 27, 261–266. [Google Scholar] [CrossRef] [Green Version]
  92. Dodds, W.K.; Smith, V.H.; Lohman, K. Nitrogen and Phosphorus Relationships to Benthic Algal Biomass in Temperate Streams. Can. J. Fish. Aquat. Sci. 2002, 59, 865–874. [Google Scholar] [CrossRef] [Green Version]
  93. Kolzau, S.; Wiedner, C.; Rücker, J.; Köhler, J.; Köhler, A.; Dolman, A.M. Seasonal Patterns of Nitrogen and Phosphorus Limitation in Four German Lakes and the Predictability of Limitation Status from Ambient Nutrient Concentrations. PLoS ONE 2014, 9, e96065. [Google Scholar] [CrossRef] [PubMed] [Green Version]
  94. Havens, K.E.; James, R.T.; East, T.L.; Smith, V.H. N:P Ratios, Light Limitation, and Cyanobacterial Dominance in a Subtropical Lake Impacted by Non-Point Source Nutrient Pollution. Environ. Pollut. 2003, 122, 379–390. [Google Scholar] [CrossRef]
  95. Maberly, S.C.; Pitt, J.A.; Davies, P.S.; Carvalho, L. Nitrogen and Phosphorus Limitation and the Management of Small Productive Lakes. Inland Waters 2020, 10, 159–172. [Google Scholar] [CrossRef] [Green Version]
  96. Saito, M.A.; Goepfert, T.J.; Ritt, J.T. Some Thoughts on the Concept of Colimitation: Three Definitions and the Importance of Bioavailability. Limnol. Oceanogr. 2008, 53, 276–290. [Google Scholar] [CrossRef] [Green Version]
  97. Smith, V.H.; Bennett, S.J. Nitrogen:Phosphorus Supply Ratios and Phytoplankton Community Structure in Lakes. Arch. Fur Hydrobiol. 1999, 146, 37–53. [Google Scholar] [CrossRef]
  98. Guildford, S.J.; Hecky, R.E. Total Nitrogen, Total Phosphorus, and Nutrient Limitation in Lakes and Oceans: Is There a Common Relationship? Limnol. Oceanogr. 2000, 45, 1213–1223. [Google Scholar] [CrossRef] [Green Version]
  99. Nikolai, S.J.; Dzialowski, A.R. Effects of Internal Phosphorus Loading on Nutrient Limitation in a Eutrophic Reservoir. Limnologica 2014, 49, 33–41. [Google Scholar] [CrossRef]
  100. Quirós, R. The Relationship between Nitrate and Ammonia Concentrations in the Pelagic Zone of Lakes. Limnetica 2003, 22, 37–50. [Google Scholar] [CrossRef]
Figure 1. Study area with the monitoring stations on the main canal network of the HS DTD catchment.
Agriculture 12 00935 g001
Figure 2. Box plots of average monthly N and P concentrations (red square) in examined water samples for the period 2000–2019 in relation to limit value (Si, red dashed line) for the class of good environmental status.
Agriculture 12 00935 g002
Figure 3. Spatial distribution of: (a) TN concentrations, (b) TP concentrations and (c) TN:TP mass ratios in examined water samples. Red lines indicate eutrophic status limits (a) TN > 1.5 mg/L, (b) TP > 0.075 mg/L and (c) TN/TP mass ratio of potentially N-limited (TN/TP < 8) or P-limited (TN/TP > 24).
Agriculture 12 00935 g003
Figure 4. Temporal distribution of: (a) TN concentrations, (b) TP concentrations and (c) TN:TP mass ratios in examined water samples. Red lines indicate eutrophic status limits (a) TN > 1.5 mg/L, (b) TP > 0.075 mg/L and (c) TN/TP mass ratio of potentially N-limited (TN/TP<8) or P-limited (TN/TP > 24).
Agriculture 12 00935 g004
Figure 5. Distribution of TN:TP mass ratio, and % values in different TN:TP ratio ranges, with dashed red lines at particular (8, 16 and 24) threshold.
Agriculture 12 00935 g005
Figure 6. (a) Average TN:TP mass ratio per locations; (b) distribution of average monthly TN:TP mass ratio relative to N and P limitations in spring–summer (growing season) and fall–winter (non-growing season) periods, with dashed lines at particular (8 and 24) thresholds.
Agriculture 12 00935 g006
Figure 7. (a) Spatial and (b) temporal dendrogram of TN, TP, and TN:TP mass ratio.
Agriculture 12 00935 g007
Table 1. Codes and coordinates of examined water-quality monitoring stations.
No.CodeLocation NameLatitude NLongitude EWater Course/
Canal Name
10_01Bezdan45.859818.8564Danube River
20_02Novi Becej45.584820.1384Tisa (Tisza) River
30_03Ban. Palanka44.826121.3436Danube River
41_01Backi Breg 145.908118.8989Bajski Canal
51_02Backi Breg 245.923018.9852Plazovic
61_03Ridjica46.019419.1350Plazovic
71_04Sombor45.740819.1109DTD Canal
81_05Prigrevica45.691019.0944DTD Canal
91_06Doroslovo45.604219.1746DTD Canal
101_07Srpski Miletic45.558619.1927DTD Canal
111_08Ruski Krstur45.560519.4006DTD Canal
121_09Bac45.387919.2320DTD Canal
131_10Novi Sad 145.284119.8065DTD Canal
141_11Backo Gradiste45.536520.0227DTD Canal
151_12Zabalj45.391420.0646Jegricka
162_01Novo Milosevo45.768720.3671DTD Canal, Kikinda
172_02Melenci45.543220.3372DTD Canal
182_03Jasa Tomic45.431720.8616Tamis
192_04Vlajkovac45.074221.1842DTD Canal
202_05Pancevo44.870820.6311Tamis
212_06Kajtasovo44.902621.2458DTD Canal
Table 2. Limit values (Si) in surface waters for the class of good environmental status [72].
ParametersNH4-NNO2-NNO3-NTotal NPO4-PTotal P
Limit values (mg/L)0.20.033.04.00.20.3
Table 3. Descriptive statistics of N and P concentrations in examined water samples.
ParameterNO3-N
(mg/L)
NH4-N
(mg/L)
NO2-N
(mg/L)
DON
(mg/L)
TN
(mg/L)
PO4-P
(mg/L)
TP
(mg/L)
TN/TP
(Mass)
Min0.040.010.0020.170.590.0090.0411.24
Max3.212.000.4253.985.951.1651.21547.73
Avg0.920.170.0250.691.800.1240.20513.25
STD0.570.260.0330.400.800.1910.2188.18
Cv0.621.501.330.580.451.541.070.62
Skewness0.693.417.863.421.253.062.781.49
Kurtosis0.5214.4984.7720.962.439.747.693.11
Cv, skewness and kurtosis are dimensionless.
Table 4. Seasonal distribution (%) values in different TN:TP ratio ranges.
TN/TP (Mass)Spring–Summer
(%)
Fall–Winter
(%)
Total
(%)
Limitation
<822.24.827.0N-limit.
8–2426.637.363.9N and P-co-limit.
>241.27.99.1P-limit.
Table 5. Pearson correlation matrix.
PerVariablesTNTP
LocationsTN1
TP0.76 * (p < 0.0001)1
TN:TP−0.40 (p = 0.0700)−0.71 * (p = 0.0003)
MonthsTN1
TP−0.55 (p = 0.0631)1
TN:TP0.96 * (p < 0.0001)−0.74 * (p = 0.0065)
PerVariablesTNTP
LocationsTN1
TP0.76 * (p < 0.0001)1
TN:TP−0.40 (p = 0.0700)−0.71 * (p = 0.0003)
MonthsTN1
TP−0.55 (p = 0.0631)1
TN:TP0.96 * (p < 0.0001)−0.74 * (p = 0.0065)
* Significant at p < 0.05.
Publisher’s Note: MDPI stays neutral with regard to jurisdictional claims in published maps and institutional affiliations.

