Article

Responses of Soybean Water Supply and Requirement to Future Climate Conditions in Heilongjiang Province

1
School of Water Conservancy and Electric Power, Heilongjiang University, Harbin 150080, China
2
Key Laboratory of Efficient Use of Agricultural Water Resources, Ministry of Agriculture and Rural Affairs, Northeast Agricultural University, Harbin 150030, China
3
School of Water Conservancy and Civil Engineering, Northeast Agricultural University, Harbin 150030, China
4
College of Agricultural Science and Engineering, Hohai University, Nanjing 210098, China
5
School of Architecture and Engineering, Liaocheng University, Liaocheng 252000, China
*
Author to whom correspondence should be addressed.
Agriculture 2022, 12(7), 1035; https://doi.org/10.3390/agriculture12071035
Submission received: 23 May 2022 / Revised: 13 July 2022 / Accepted: 14 July 2022 / Published: 15 July 2022
(This article belongs to the Special Issue Modeling the Adaptations of Agricultural Production to Climate Change)

Abstract

:
Understanding future changes in water supply and requirement under climate change is of great significance for long-term water resource management and agricultural planning. In this study, daily minimum temperature (Tmin), maximum temperature (Tmax), solar radiation (Rad), and precipitation for 26 meteorological stations under RCP4.5 and RCP8.5 of MIRCO5 for the future period 2021–2080 were downscaled by the LARS-WG model, daily average relative humidity (RH) was estimated using the method recommended by FAO-56, and reference crop evapotranspiration (ET0), crop water requirement (ETc), irrigation water requirement (Ir), effective precipitation (Pe), and coupling degree of ETc and Pe (CD) for soybean during the growth period were calculated by the CROPWAT model in Heilongjiang Province, China. The spatial and temporal distribution of these variables and meteorological factors were analyzed, and the response of soybean water supply and requirement to climate change was explored. The result showed that the average Tmin, Tmax, and Rad under RCP4.5 and RCP8.5 increased by 0.2656 and 0.5368 °C, 0.3509 and 0.5897 °C, and 0.0830 and 0.0465 MJ/m², respectively, while the average RH decreased by 0.0920% and 0.0870% per decade from 2021 to 2080. The annual average ET0, ETc, Pe, and Ir under RCP4.5 for 2021–2080 were 542.89, 414.35, 354.10, and 102.44 mm, respectively, and they increased by 1.92%, 1.64%, 2.33%, and −2.12% under the RCP8.5, respectively. The ranges of CD under RCP4.5 and RCP8.5 were 0.66–0.95 and 0.66–0.96, respectively, with an average value of 0.84 for 2021–2080. Spatially, the CD showed a general trend of increasing first and then decreasing from west to east. In addition, ET0, ETc, and Pe increased by 9.55, 7.16, and 8.77 mm per decade, respectively, under RCP8.5, while Ir decreased by 0.65 mm per decade. Under RCP4.5 and RCP8.5, ETc, Pe, and Ir showed an overall increasing trend from 2021 to 2080. This study provides a basis for water resources management policy in Heilongjiang Province, China.

1. Introduction

Global climate change, marked mainly by climate warming, has taken place [1]. Undoubtedly, this change has had and will continue to have an important impact on agricultural water resources on which crop growth depends [2]. In addition, climate factors, such as relative humidity (RH), solar radiation (Rad), and CO2 concentration, have a significant effect on crop water requirements (ETc) [3]. Moreover, the uncertainty of temporal and spatial distribution of precipitation (P) and ETc affects crop irrigation water requirement (Ir) [4]. Therefore, analyzing the impact of future climatic changes on crop water supply and requirement becomes necessary [5].
Future climate change is expected to affect water supply and requirement in a number of ways [6]. Climate change mainly affects the transpiration of plants, evaporation of water from the soil and field surface between plants, and P in the agricultural water cycle system [7]. Rad is the largest source of energy required for soil water vaporization during evapotranspiration, which converts a large amount of liquid water into water vapor. Rad absorbed by the atmosphere and heat emitted from the surface increase the atmospheric temperature [8]. The sensible heat around the atmosphere transmits energy to the crop to control the evapotranspiration rate, and the increase in soil surface temperature promotes evaporation [5]. The water vapor pressure difference between the evapotranspiration surface and the atmosphere is the decisive factor for water vapor movement [9]. The increase in RH leads to the saturation of air humidity, forming a protective layer on the field surface, thus reducing the evapotranspiration requirement [10]. However, the increase in CO2 concentration will also promote the accumulation of crop dry matter, promote plant growth, and increase transpiration [11]. P increases soil water content, replenishes the total effective soil water, improves the plant root water absorption rate, and helps to reduce Ir while meeting the needs of crop evapotranspiration [12]. Some researchers found that the RH in Zimbabwe areas would decrease in the future, while the average temperature, Rad and wind speed would increase, resulting in an increase in ET0 and ETc; however, the decrease in P would eventually lead to the increase of Ir [13]. In contrast, studies in North China Plain (NCP) found that ETc and Ir decreased with increasing temperature, Rad and P, shorten of growth period [14]. In many studies from different regions, the relationships between ETc, Pe, and Ir varies under climate change. Therefore, more in-depth studies are needed to assess the impact of future climate change on crop water supply and requirement.
ETc constitutes a major component of regional and global hydrological cycles and, therefore, has important implications in the use of agricultural irrigation water, as well as in analyzing the crop water supply and requirement relationship in agricultural ecosystems [15]. There are many methods for calculating ETc, such as the empirical estimation method, the Penman–Monteith (P–M) double-crop coefficient method, and the P–M single-crop coefficient method [16]. The empirical formula for estimating ETc is simple and convenient; however, it is only suitable for local instead of large-scale areas [17]. When using P–M double-crop coefficient method to estimate ETc, the crop coefficient is divided into basic crop coefficient (Kcb) and soil evaporation coefficient (Ke), although the estimation accuracy of ETc is improved [18]; however, the estimation of Ke is complex and uncertain, which needs the support of a large amount of experimental data [19,20]. The parameters required by the P–M single-crop coefficient method are easy to obtain, which can be directly substituted into the formula for calculation. The calculated ETc has less difference with the measured ETc. Generally, the P–M single-crop coefficient method has strong universality in different regions and is considered to be a more efficient, convenient, and accurate method [21,22]. Therefore, most scholars use the P–M single-crop coefficient method recommended by the Food and Agriculture Organization of the United Nations (FAO) to calculate ETc [23]. Nie et al. estimated rice ETc in Heilongjiang province using the CROPWAT model based on the P–M single-crop coefficient method [24]; the calculated ETc was only 21–30 mm different from the measured ETc in the field experiment. In order to test the practicability and rationality of the P–M single-crop coefficient method for calculating ETc, Jin et al. calculated wheat ETc in the Huaihongxinhe Irrigation District using the P–M single-crop coefficient method and found that the average difference in ETc for the years was only 6 mm [25].
Quantitative estimation of temporal and spatial variability of ETc, Pe, and Ir under climate change is helpful to maximize the use of rainwater resources and optimize regional water resource allocation [11,14]. P is the main influencing factor of soil moisture content, which provides water for crop evapotranspiration [26]. Ir depends on soil moisture content [27]. Therefore, there is a complex relationship between Pe and Ir, which cannot be fully explained by simple linear equations [28]. In addition, the relationship among ETc, Pe, and Ir is also affected by P distribution pattern, crop species, and planting area [11]. In the Jayakwadi command area, India, the ETc of major crops and Pe increased during the growth period, resulting in less Ir under climate change [29]. In the Najafabad plain in Iran, ETc increased and Pe decreased during the growth period of major crops; therefore, more water needed to be irrigated [30].
As one of the largest developing countries in the world, China constitutes 22% of the world’s population and encompasses 9% of the world’s arable land [31]. Heilongjiang Province has the largest arable land area in China and is also an important commercial grain base in China [32]. The soybean sowing area and yield in Heilongjiang Province rank first in China, with a sowing area of 4.279 × 10⁶ ha and yield of 7.808 × 10⁶ tons as of 2019 [33]. Soybean sowing area increased by an average of 5 × 10⁵ ha per year in the last 5 years. The climate distribution in Heilongjiang province leads to great differences in temporal and spatial distribution of crop water supply and requirement, and agricultural drought occurs frequently in spring and summer [34]. With the increase in soybean planting area and soybean export share, the study on soybean water supply and requirement under future climatic conditions is of great guidance to ensure soybean production and food security in Heilongjiang Province [35].
The purpose of this study was (1) to clarify the spatial and temporal distribution characteristics of ET0, ETc, Pe, Ir, and CD during the soybean growth period for 2021–2080 under RCP4.5 and RCP8.5 in Heilongjiang Province, and (2) to reveal the response of soybean water supply and requirement to climate change for 2021–2080 under RCP4.5 and RCP8.5. This study will provide reasonable planning for water allocation and guide the sustainable development of agricultural irrigation water use in Heilongjiang Province.

2. Materials and Methods

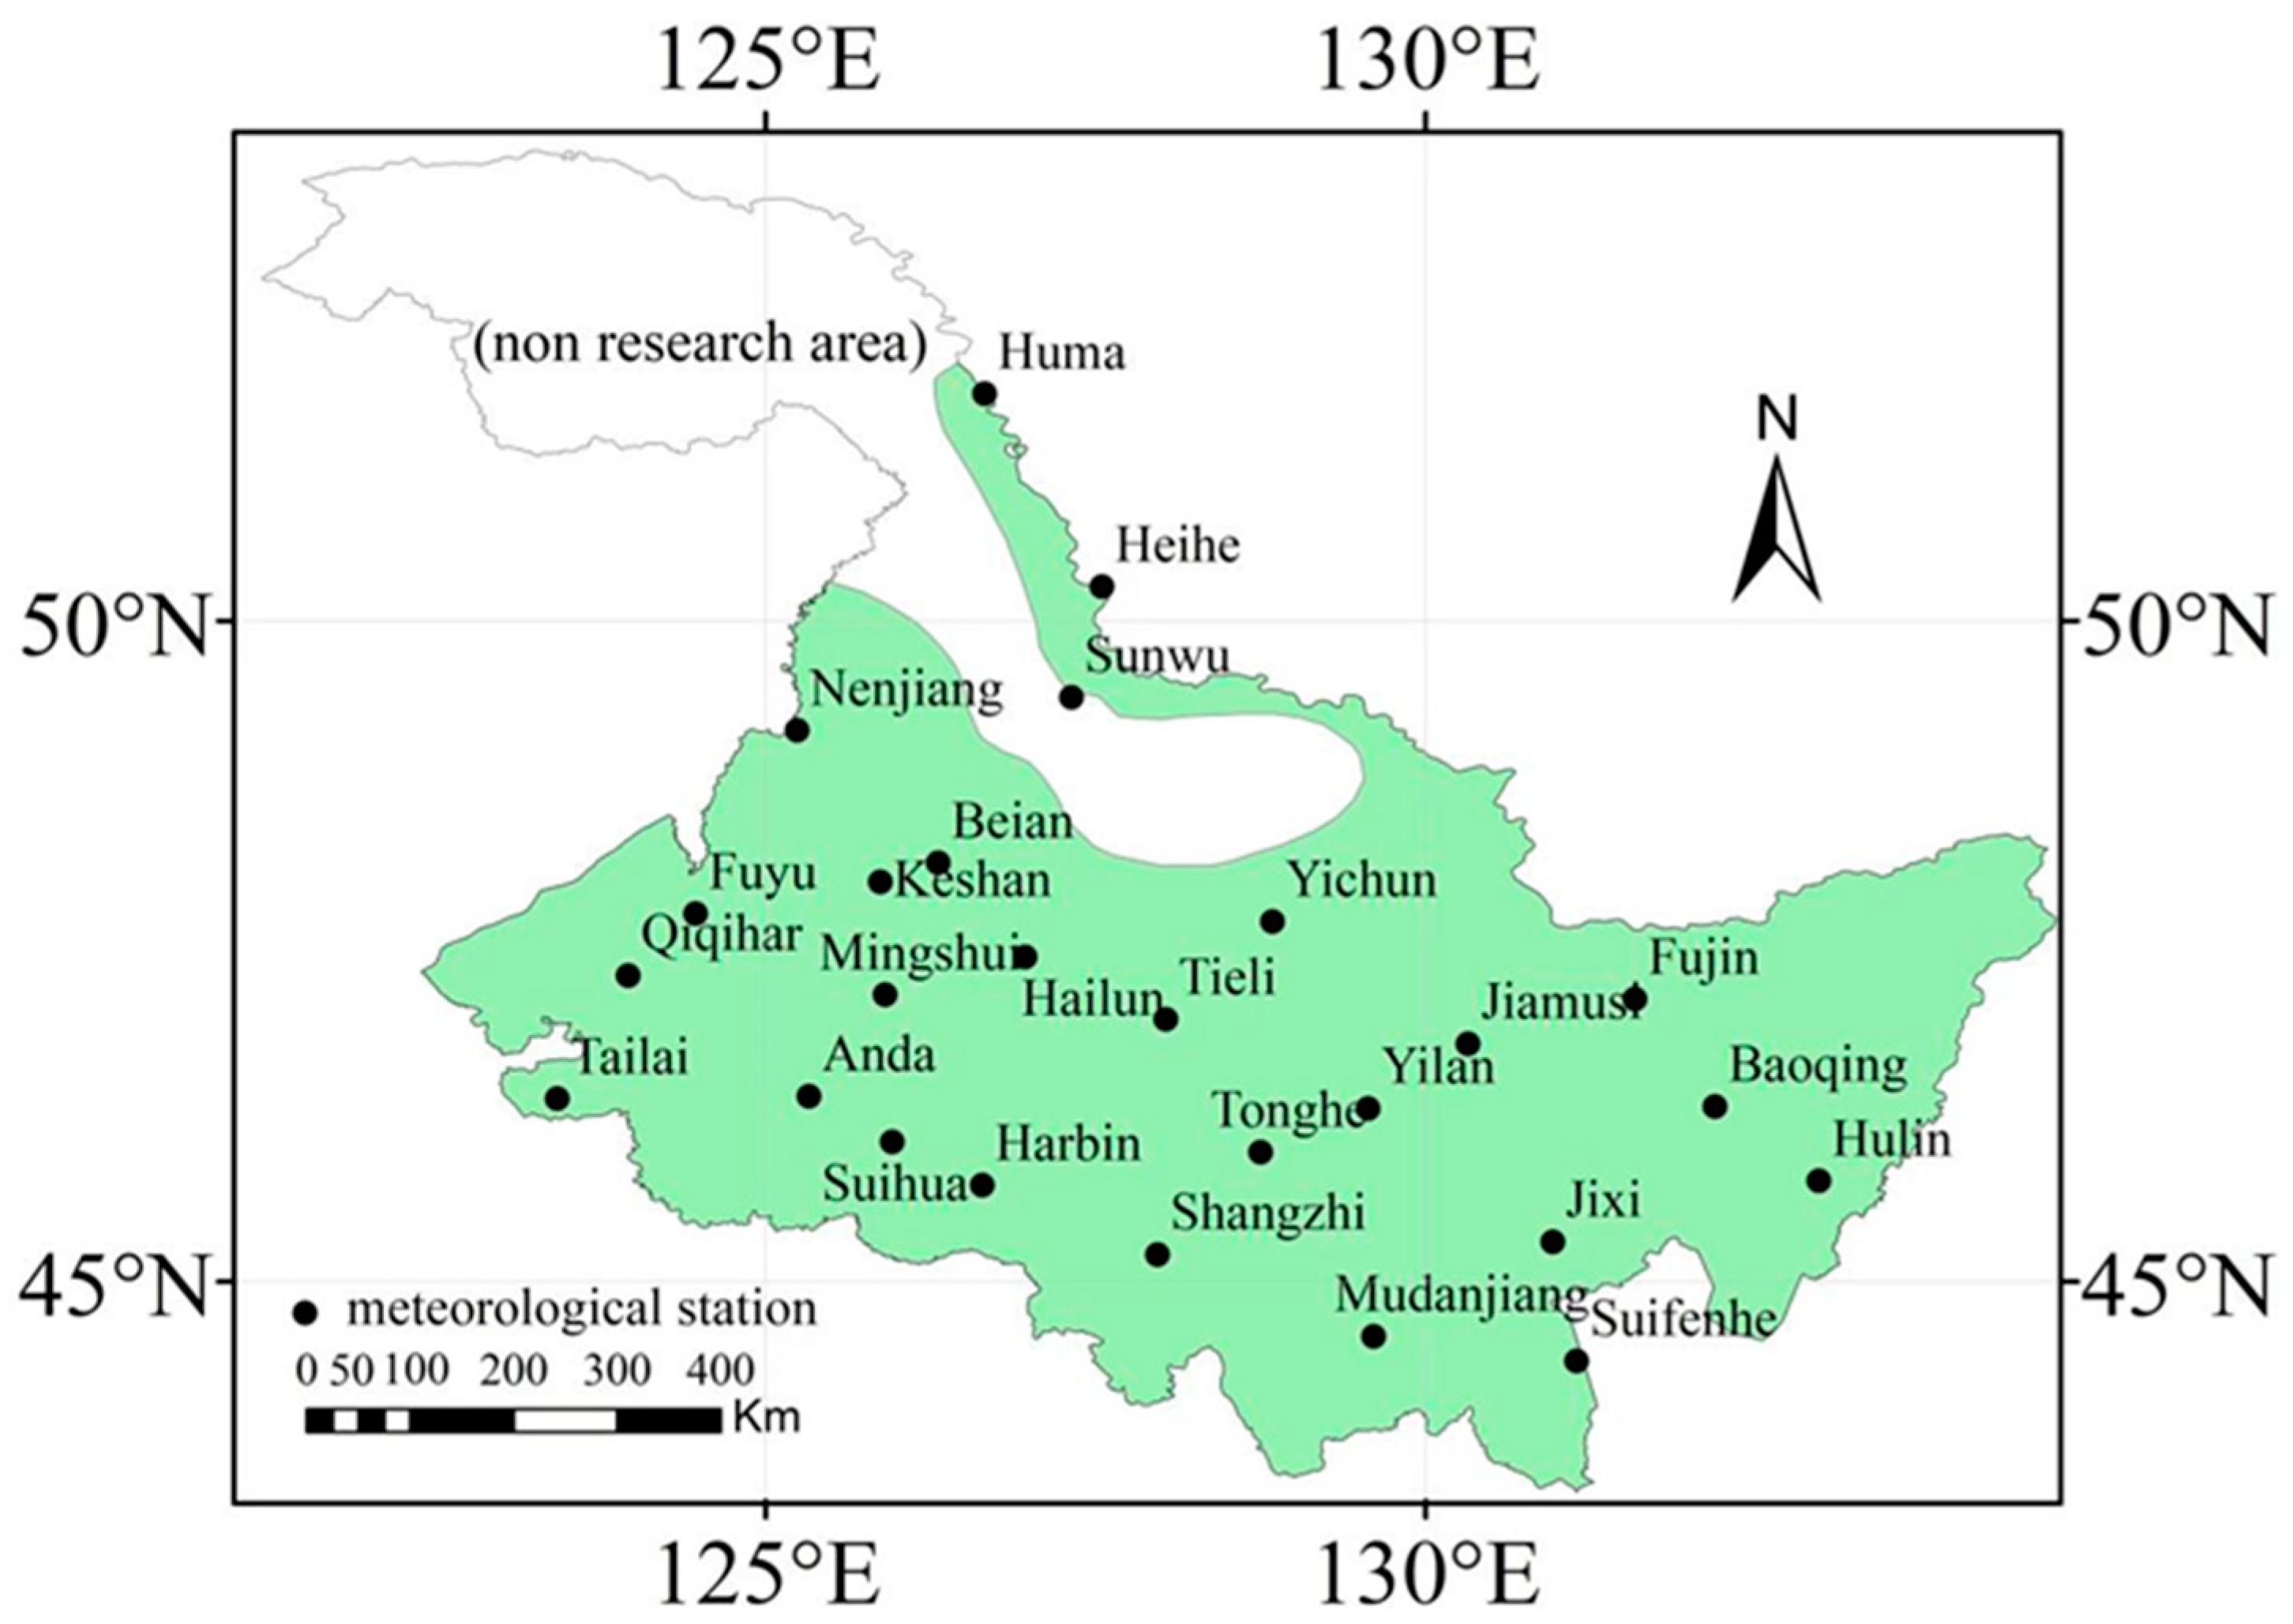
2.1. Study Region and Datasets

The study area is located in Heilongjiang Province, Northeast China, where 26 meteorological stations are located relatively evenly throughout the study area for observations (Figure 1). The area belongs to the cold temperate and temperate continental monsoon climate, with an average annual temperature of 4.52 °C, an average annual solar radiation of 13.72 MJ/m2, and an average annual P of 511 mm. According to the “Heilongjiang Province Crop Variety Cumulative Temperature Zone Plan” [36] and “Heilongjiang Province 2015 Regional Layout Plan for High-Quality and High-Yielding Major Food Crops” [37] issued by the Heilongjiang Provincial Agriculture Committee, the sixth cumulative temperature zone is not suitable for soybean cultivation; therefore, the sixth cumulative temperature zone is not included in this study.
We used the general circulation model (GCM) of MIRCO5 with a resolution of 1.39° × 1.41° and selected two representative concentration pathways (RCP4.5 for the low-radiation scenario and RCP8.5 for the high-radiation scenario) according to the socioeconomic conditions of the radiative forcing currently faced by humans. The minimum temperature (Tmin), maximum temperature (Tmax), Rad, and P data from 26 stations of the China Meteorological Administration (CMA) from 1960–2015 were imported into the LARSWG stochastic weather generator model to generate future climate datasets. The dataset includes daily Tmin, Tmax, Rad, and P for 26 meteorological stations under RCP4.5 and RCP8.5 for the future period (2021–2080). The period 2021–2080 was divided into three time periods: the 2030s (2021–2040), 2050s (2041–2060), and 2070s (2061–2080). Under RCP4.5 and RCP8.5, average RH was estimated using the method recommended by FAO-56.

2.2. Division of Soybean Growth Period

The FAO divides the crop growth period into four stages: initial stage (Lini), crop development stage (Ldev), mid-season stage (Lmid), and late stage (Llate); the crop coefficients in each growth stage are Kcini, Kcmid and Kcend. In this study, the whole growth period of soybean was divided into sowing to three-leaf stage (Lini), three-leaf stage to flowering stage (Ldev), flowering stage to podding stage (Lmid), and podding stage to maturity stage (Llate). The crop coefficients (Kc) were based on the irrigation series “Crop Guide to Crop Water Requirements” published by FAO-56 and corrected using the method recommended by FAO-56 [38,39]. It was assumed that the soybean variety would not change in the future period. According to the observation data of soybean growth period from 1994 to 2005 at 19 agrometeorological observation stations in Heilongjiang Province, the soybean sowing date and the length of each growth stage were determined. The data of the adjacent agrometeorological observation stations in the same temperature accumulation area were selected as the calculation basis, as shown in Table 1.

2.3. Soil Parameters

Parameters such as soil type, total available soil moisture, maximum rain infiltration rate, and maximum rooting depth were obtained from the Harmonized World Soil Database (HSWD). To improve the accuracy of the model simulation results, the initial soil moisture depletion and initial available soil moisture were adjusted according to the “10 day dataset of crop growth and development and farmland soil moisture in China” from the China Meteorological Data Network (http://data.cma.cn, accessed on 22 May 2022). The obtained soil data were input into the CROPWAT model, and the initial soil water content for each year thereafter was taken as the last day of the previous year.

2.4. Effective Precipitation (Pe)

For upland crops, Pe refers to the total precipitation that can be stored in the crop root layer to meet the crop’s water needs, excluding surface runoff and leakage below the crop root layer. In this study, we used the method recommended by the United States Department of Agriculture (USDA) to calculate Pe. The formula was as follows:
P e = { P ( 125 0.6 P ) / 125               ( P 83.3   mm )           125 / 3 + 0.1 P                               ( P > 83.3   mm ) ,
where Pe is the effective precipitation (mm), and P is precipitation (mm).

2.5. Crop Water Requirement (ETc)

Soybean ETc was calculated using the CROPWAT model as a function of the loading altitude, latitude, longitude, Tmin, Tmax, Rad, and RH data from each station into the “climate/ET0” module to calculate ET0. The sowing date, harvest date, Kc, and length of each growing period were loaded into the “crop” module to calculate ETc. Soybean ETc was calculated using the single-crop coefficient method recommended by FAO-56. ETc was calculated from ET0 and Kc using the equation under standard conditions, where ET0 was considered as the key variable for the estimation of ETc. Standard conditions mean that there were no limitations to crop growth, including a sufficient supply of water and crops free from diseases and pest infections.
E T c = K c × E T 0 ,
where ET0 is the reference crop evapotranspiration (mm), Kc is the crop coefficient (dimensionless), and ETc is the crop water requirement (mm).
ET0 was calculated using the P–M formula recommended by FAO; thus,
  E T 0 = 0.408 Δ × ( R n G ) + 900 γ × u 2 × ( e s e a ) ( T + 273 ) Δ + γ × ( 1 + 0.34 u 2 ) ,
where ET0 is the reference crop evapotranspiration (mm·day−1), ∆ is the slope of the vapor pressure curve (kPa·°C−1), Rn is the net radiation at the crop surface (MJ·(m2·day−1)), G is the soil heat flux density (MJ·(m2·day−1)), γ is the psychrometric constant (kPa·°C−1), T is the mean daily air temperature at 2 m height (°C), u2 is the wind speed at 2 m height (m·s−1), es is the saturation vapor pressure, ea is the actual vapor pressure (kPa), esea is the saturation vapor pressure deficit (kPa), and 900 is a conversion factor.

2.6. Irrigation Water Requirement (Ir)

The daily soil water balance equation was used to calculate Ir. Irrigation quota should be less than or equal to the root-zone water consumption to avoid deep leakage loss. The calculation formula is as follows:
I r , i = D r , i 1 + E T c D r , i P e i ,
where Ir,i is the irrigation water requirement on day i, Dr,i − 1 is the water consumption of the root zone on day i − 1, ETc is crop water requirement, Dr,i is the water consumption of the root zone on day i, and Pei is the Pe on day i.

2.7. Climate Tendency Rate

The climate tendency rate is the changing rate of each variable every 10 years. A positive climate tendency rate indicates an increasing trend of the corresponding variable, while a negative value indicates a decreasing trend. By using the least-square method, the changing trend of variable can be expressed by a linear equation formulas follows:
Y t = a t + b ,
where Yt is represents the fitted values of each variable, t is the corresponding year, and a and b are regression coefficients.

2.8. Coupling Degree of ETc and Pe (CD)

During the soybean growth period, the degree to which Pe meets ETc is called the coupling degree between ETc and Pe. The calculation equation is as follows:
                                                                λ i = { 1 P e / E T c                       ( P e E T c ) ( P e < E T c ) .

2.9. Mann–Kendall Trend Test

The Mann–Kendall trend test is a nonparametric statistical method used to reveal how a variable changes with time, introduced by the World Meteorological Organization. Positive and negative values of the statistical variable Z indicate the data changing trend; if the absolute value of Z is greater than 1.64, 2.32, and 2.56, it means that the data have passed the significance test of 95%, 99%, and 99.9% for reliability [40]. This study used this method to test the changing trend of ET0, ETc, Ir, Pe, and CD during the soybean growth period.

2.10. Data Processing

The reduced-dimension downscaled dataset was processed by Codeblocks20.03 [41] open-source software, which made the data schema acceptable to the CROPWAT model. The CROPWAT8.0 [42] model was used to calculate ETc, Pe, and Ir under future climate conditions at 26 meteorological stations in Heilongjiang Province. Matlab R2019a [43] was used to perform Mann–Kendall trend tests of ET0, ETc, Pe, Ir, and their climate tendency rates under future climatic conditions, and the inverse distance weighting (IDW) method in the spatial analysis toolbox of Arcmap 10.2 was used to spatially interpolate and mapping at a resolution of 0.04° × 0.04°. We used SPSS25.0 [44] to process the correlation analysis of Tmin, Tmax, RH, Rad, ET0, ETc, Pe, and Ir, as well as the analysis of variance (ANOVA) of Tmin, Tmax, Pe, RH, Rad, ET0, ETc, Ir, and CD.

3. Results

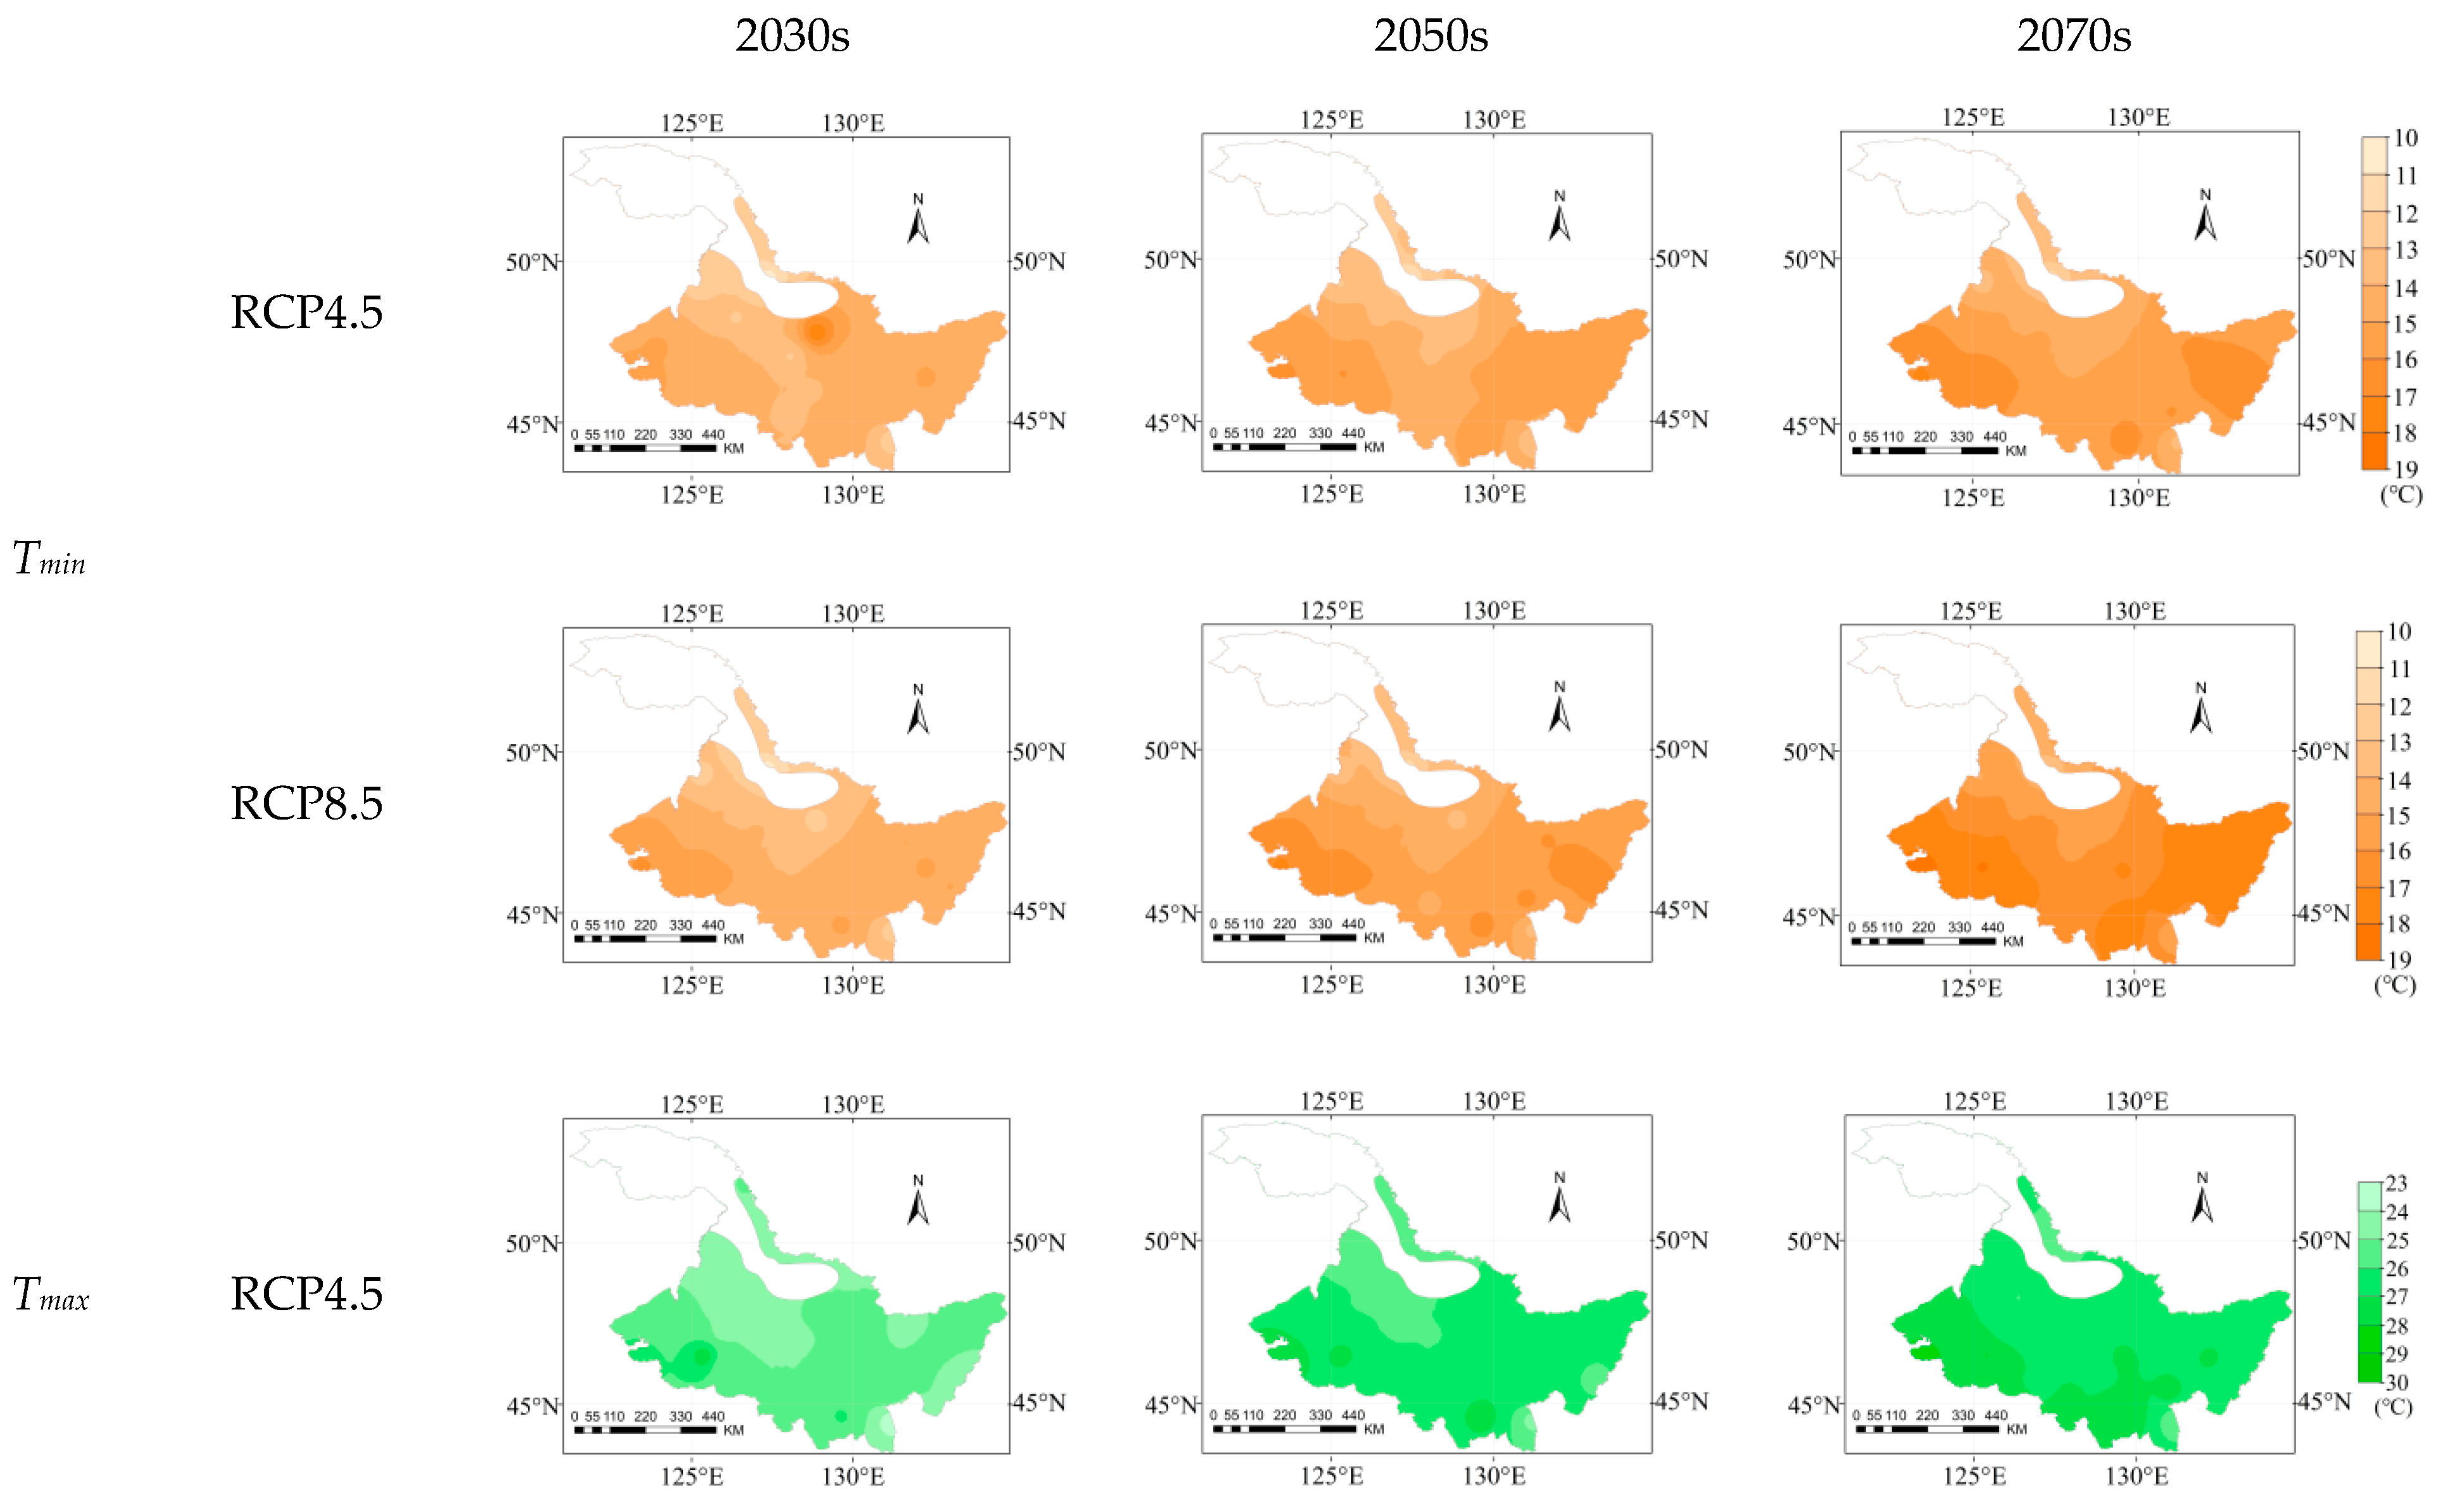
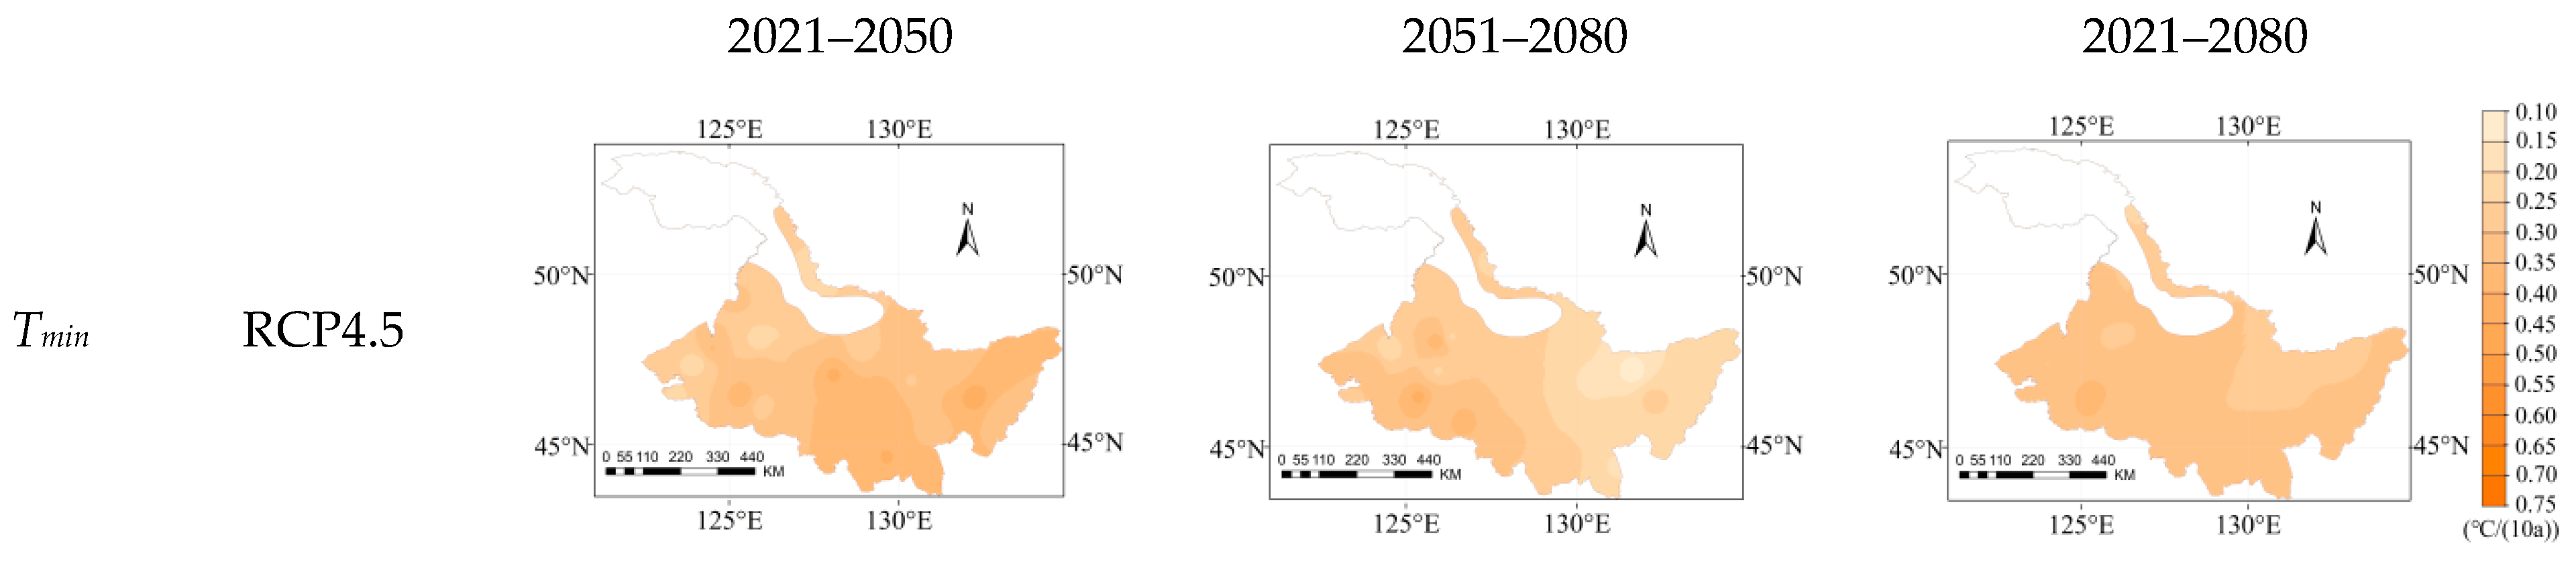
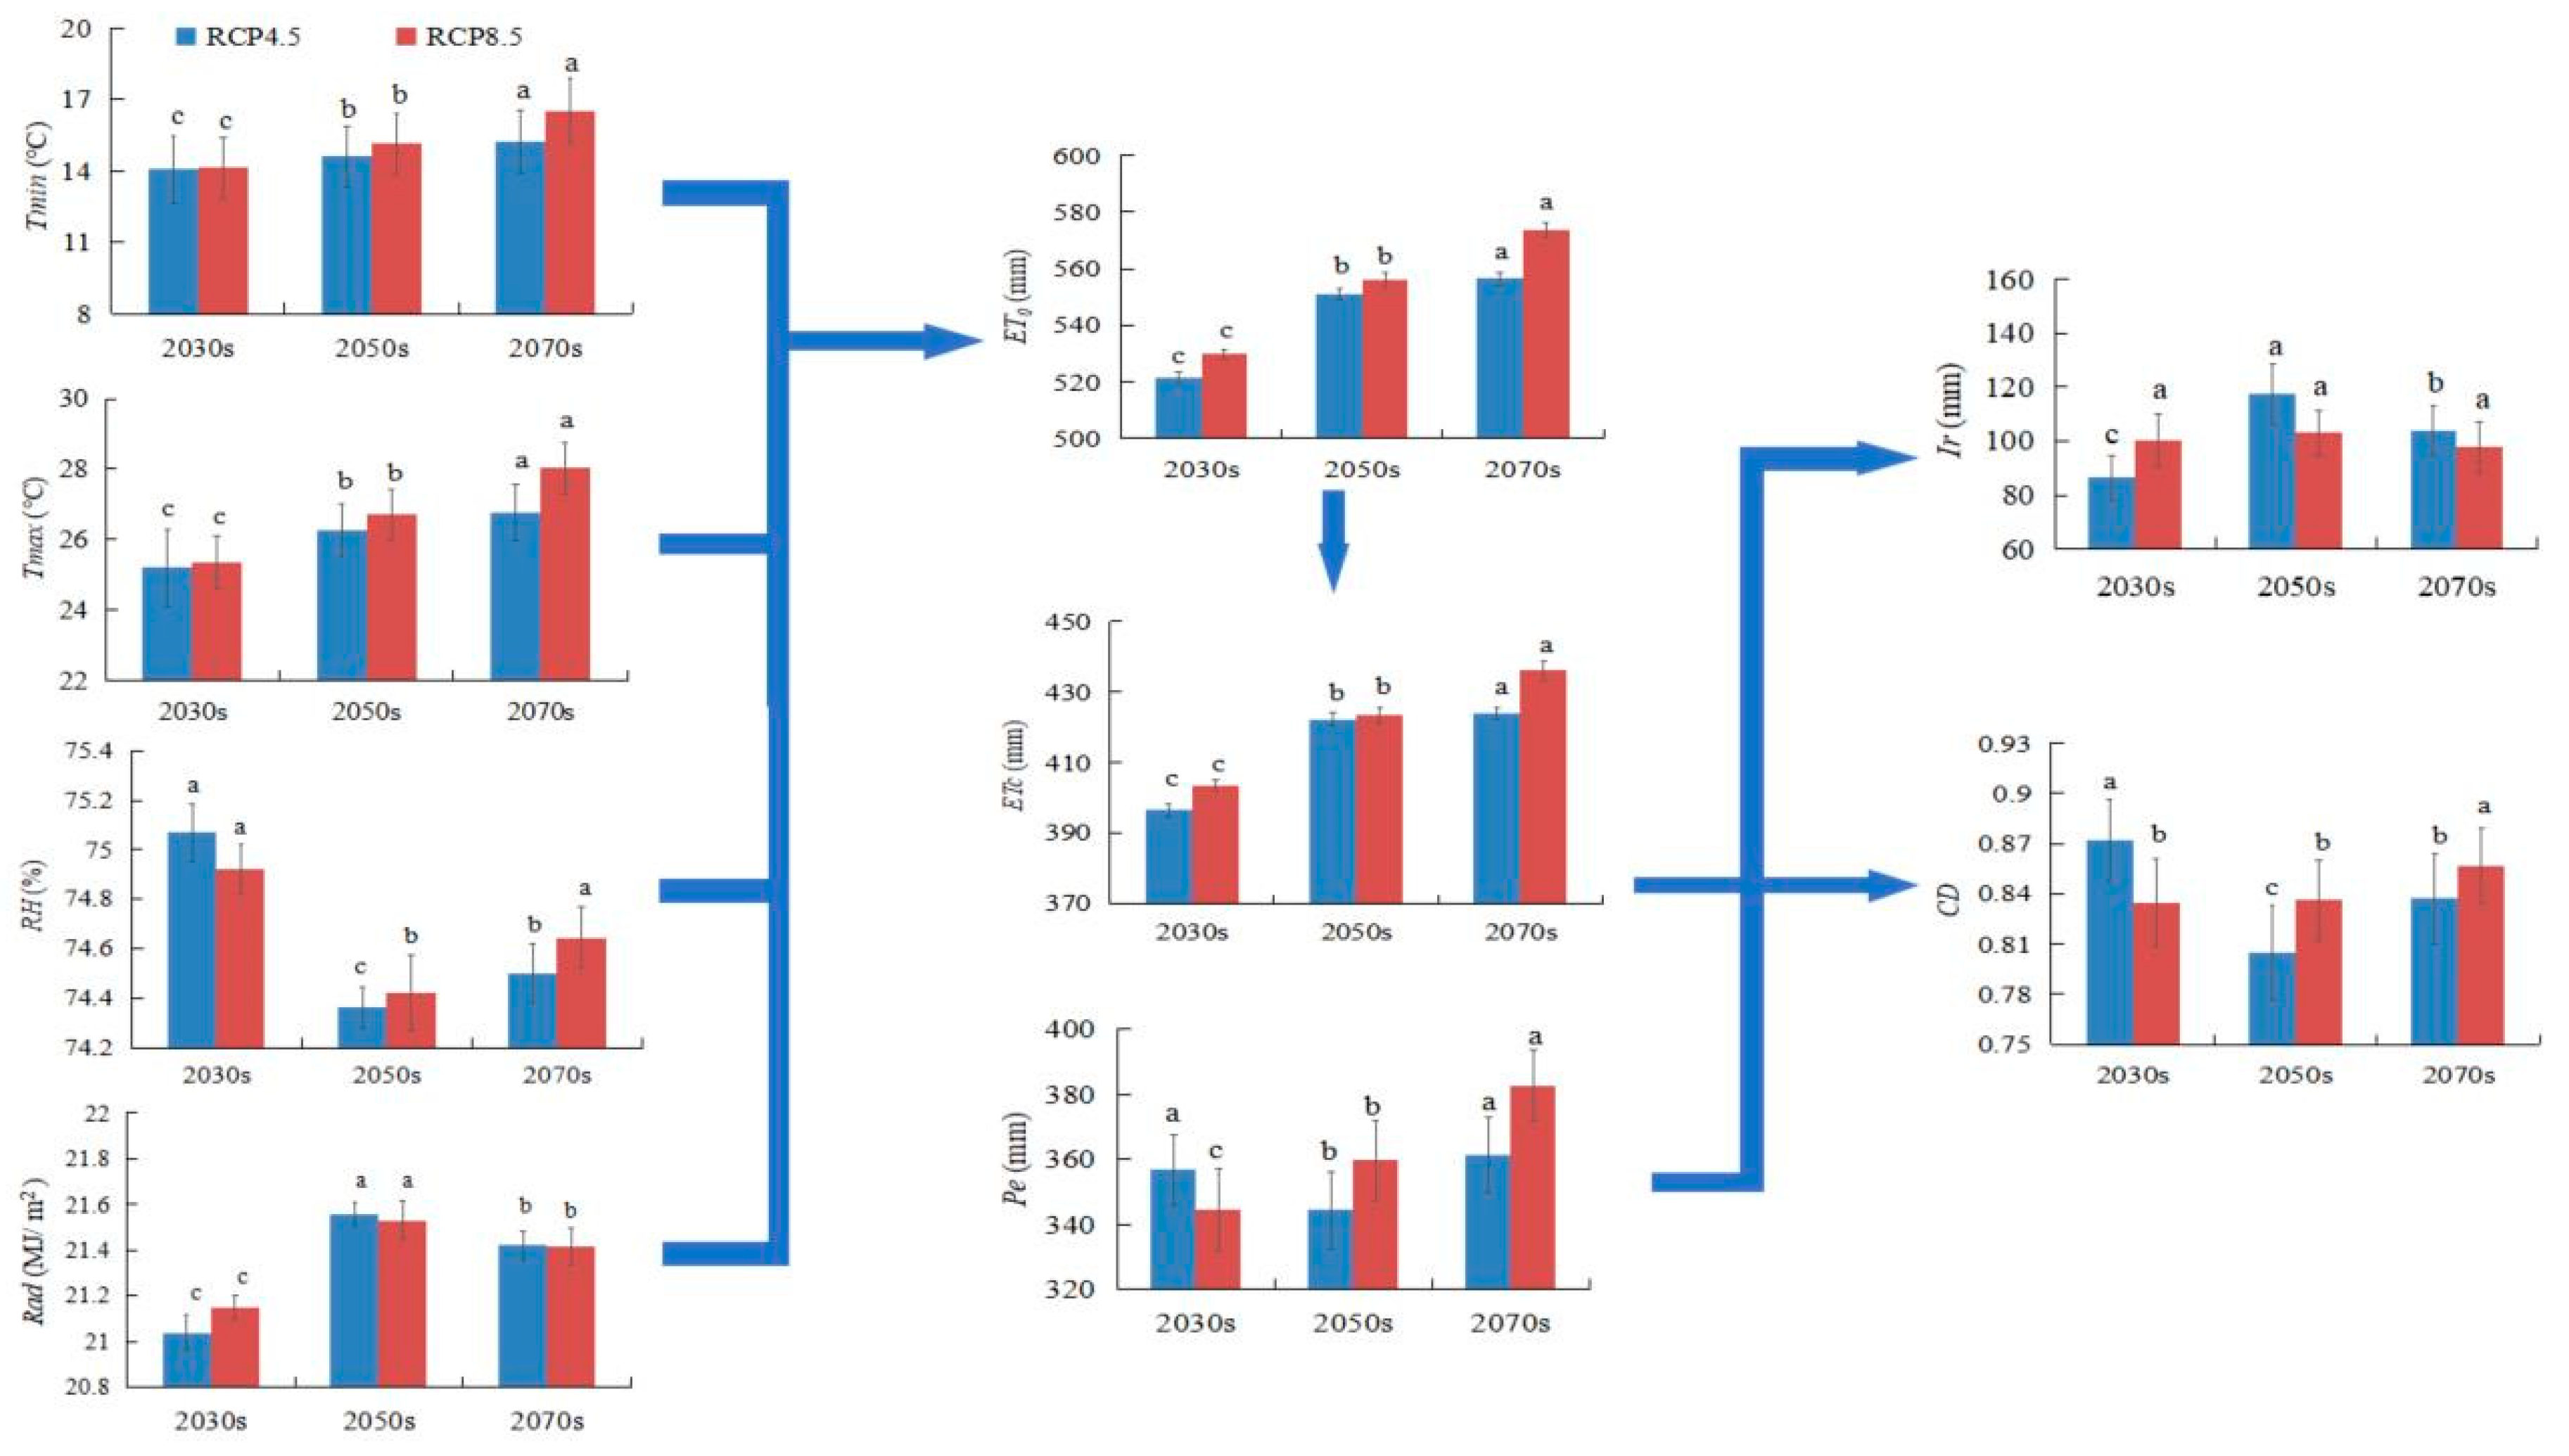
3.1. Spatial and Temporal Variation of Future Meteorological Factor

ET0 during the soybean growth period was driven by interacting effects of different climate factors. Therefore, a detailed analysis of changes for each meteorological factor was conducted (Figure 2 and Figure 3). Average Tmax under RCP4.5 and RCP8.5 showed a significant increasing trend, Rad showed an increasing and then decreasing trend, and average RH showed a decreasing and then increasing trend (Figure 2). Under RCP4.5 and RCP8.5, the average Tmax started from 25.19 and 25.36 °C in the 2030s, respectively, and increased significantly to 26.76 and 28.02 °C in the 2070s. Similarly, the average Rad increased significantly from 21.04 and 21.15 MJ/m² in the 2030s to 21.56 and 21.53 MJ/m2 in the 2050s, respectively, and then both decreased to 21.42 MJ/m2 in the 2070s. The average RH decreased significantly from 75.07% and 74.92% in the 2030s to 74.36% and 74.42% in the 2050s, before continuing to increase to 74.50% and 74.65% in the 2070s, respectively. Under RCP4.5 and RCP8.5, the highest values of the Tmin were distributed in the east, and the highest values of the Tmax were distributed in the south. In addition, the highest RH was found in the central part, and the highest Rad was found in the western and eastern parts.
Under RCP4.5, the average climate tendency rates of Tmin, Tmax, RH, and Rad for 2021–2080 were 0.2656 °C/(10 years), 0.3509 °C/(10 years), −0.0920%/(10 years), and 0.0830 MJ/m2/(10 years), respectively (Figure 3). Under RCP8.5, the average climate tendency rates of Tmin, Tmax, RH, and Rad in 2021–2080 were 0.5368 °C/(10 years), 0.5897 °C/(10 years), −0.0870%/(10 years), and 0.0465 MJ/m2/(10 years), respectively. Under RCP4.5 from 2021–2050, the RH declined most quickly, at a rate of 0.3002%/(10 years), while Rad increased most quickly, at a rate of 0.2193 MJ/m²/(10 years).

3.2. Spatial and Temporal Variation of ET0

The ET0 values during the soybean growth period from 2021–2080 under RCP4.5 and RCP8.5 were shown in Figure 4. Under RCP4.5, ET0 from 2021–2080 was between 409.34 and 621.47 mm, with an average of 542.89 mm. Under RCP8.5, ET0 was between 492.48 and 642.24 mm, with an average of 553.35 mm. Under RCP4.5 and RCP8.5, ET0 increased first and then decreased from west to east in the study area.
The climate tendency rate of ET0 in the soybean growth period from 2021–2080 under RCP4.5 was 3.71–10.18 mm/(10 years). The climate tendency rates of ET0 in 2021–2050, 2051–2080, and 2021–2080 were 12.65 mm/(10 years), 1.93 mm/(10 years), and 7.71 mm/(10 years), respectively (Figure 5a–c). Under RCP8.5, the climate tendency rate of ET0 from 2021–2080 was 7.30–12.07 mm/(10 years), with an average of 9.55 mm/(10 years) (Figure 5d–f). All 26 sites passed the significance test at α = 0.001 under both RCP4.5 and RCP8.5.

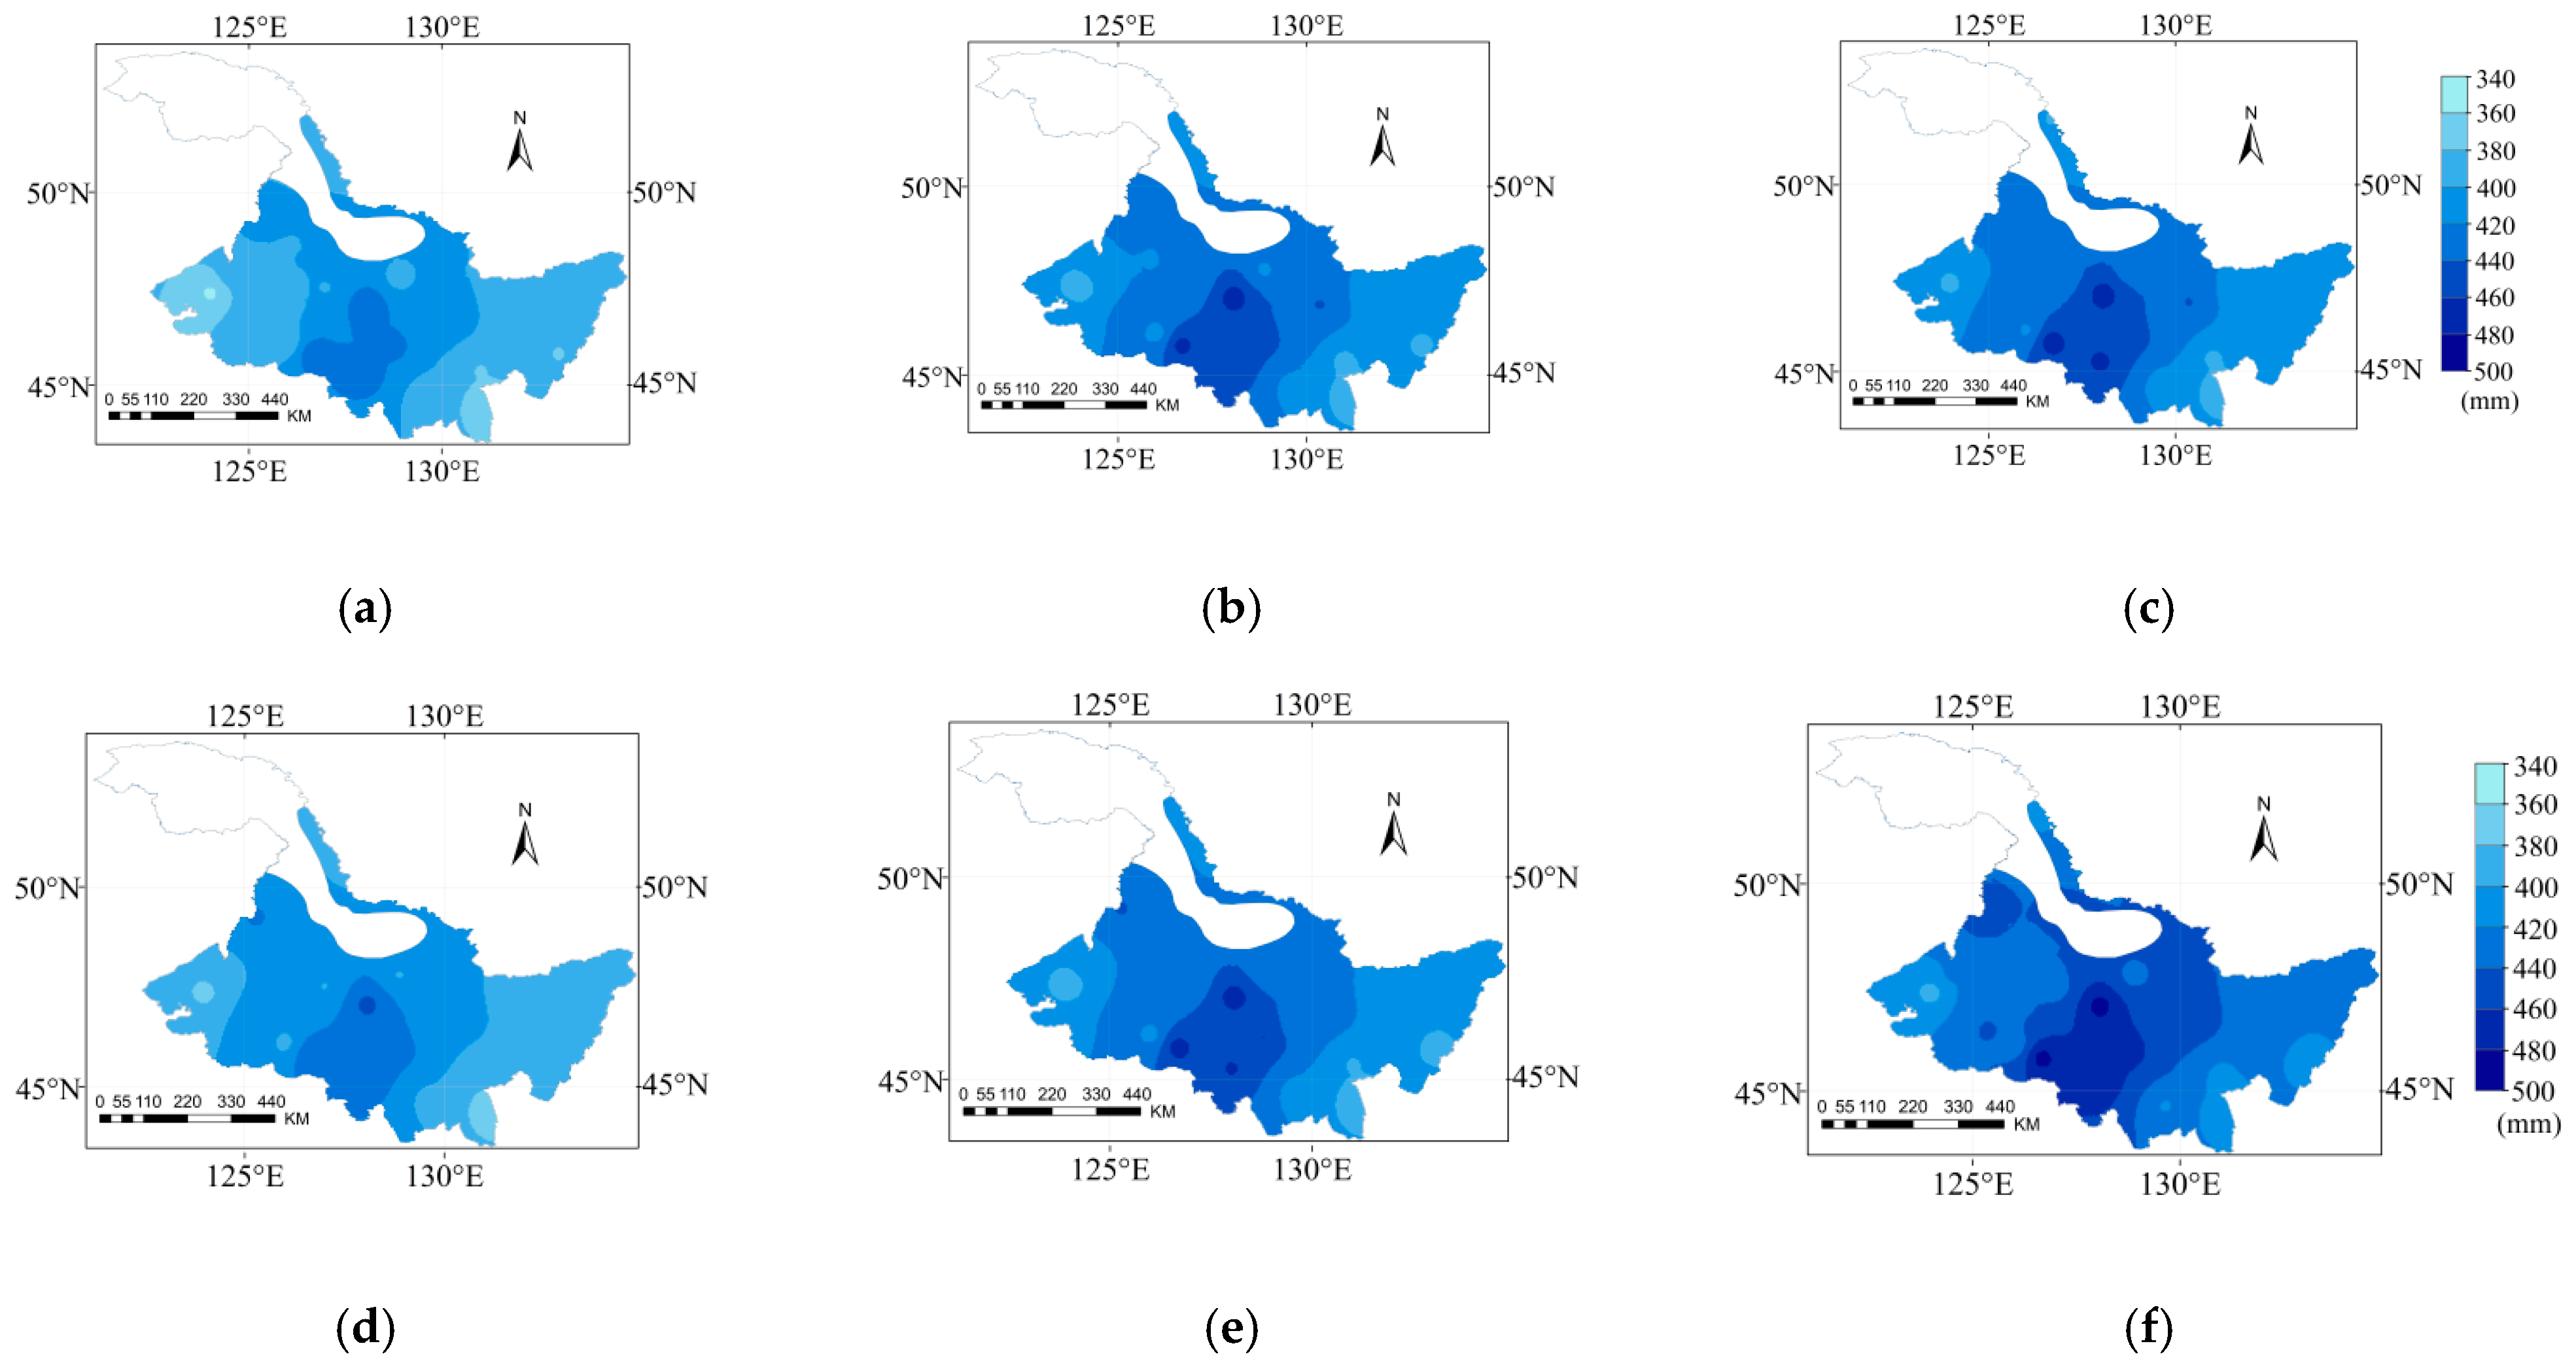
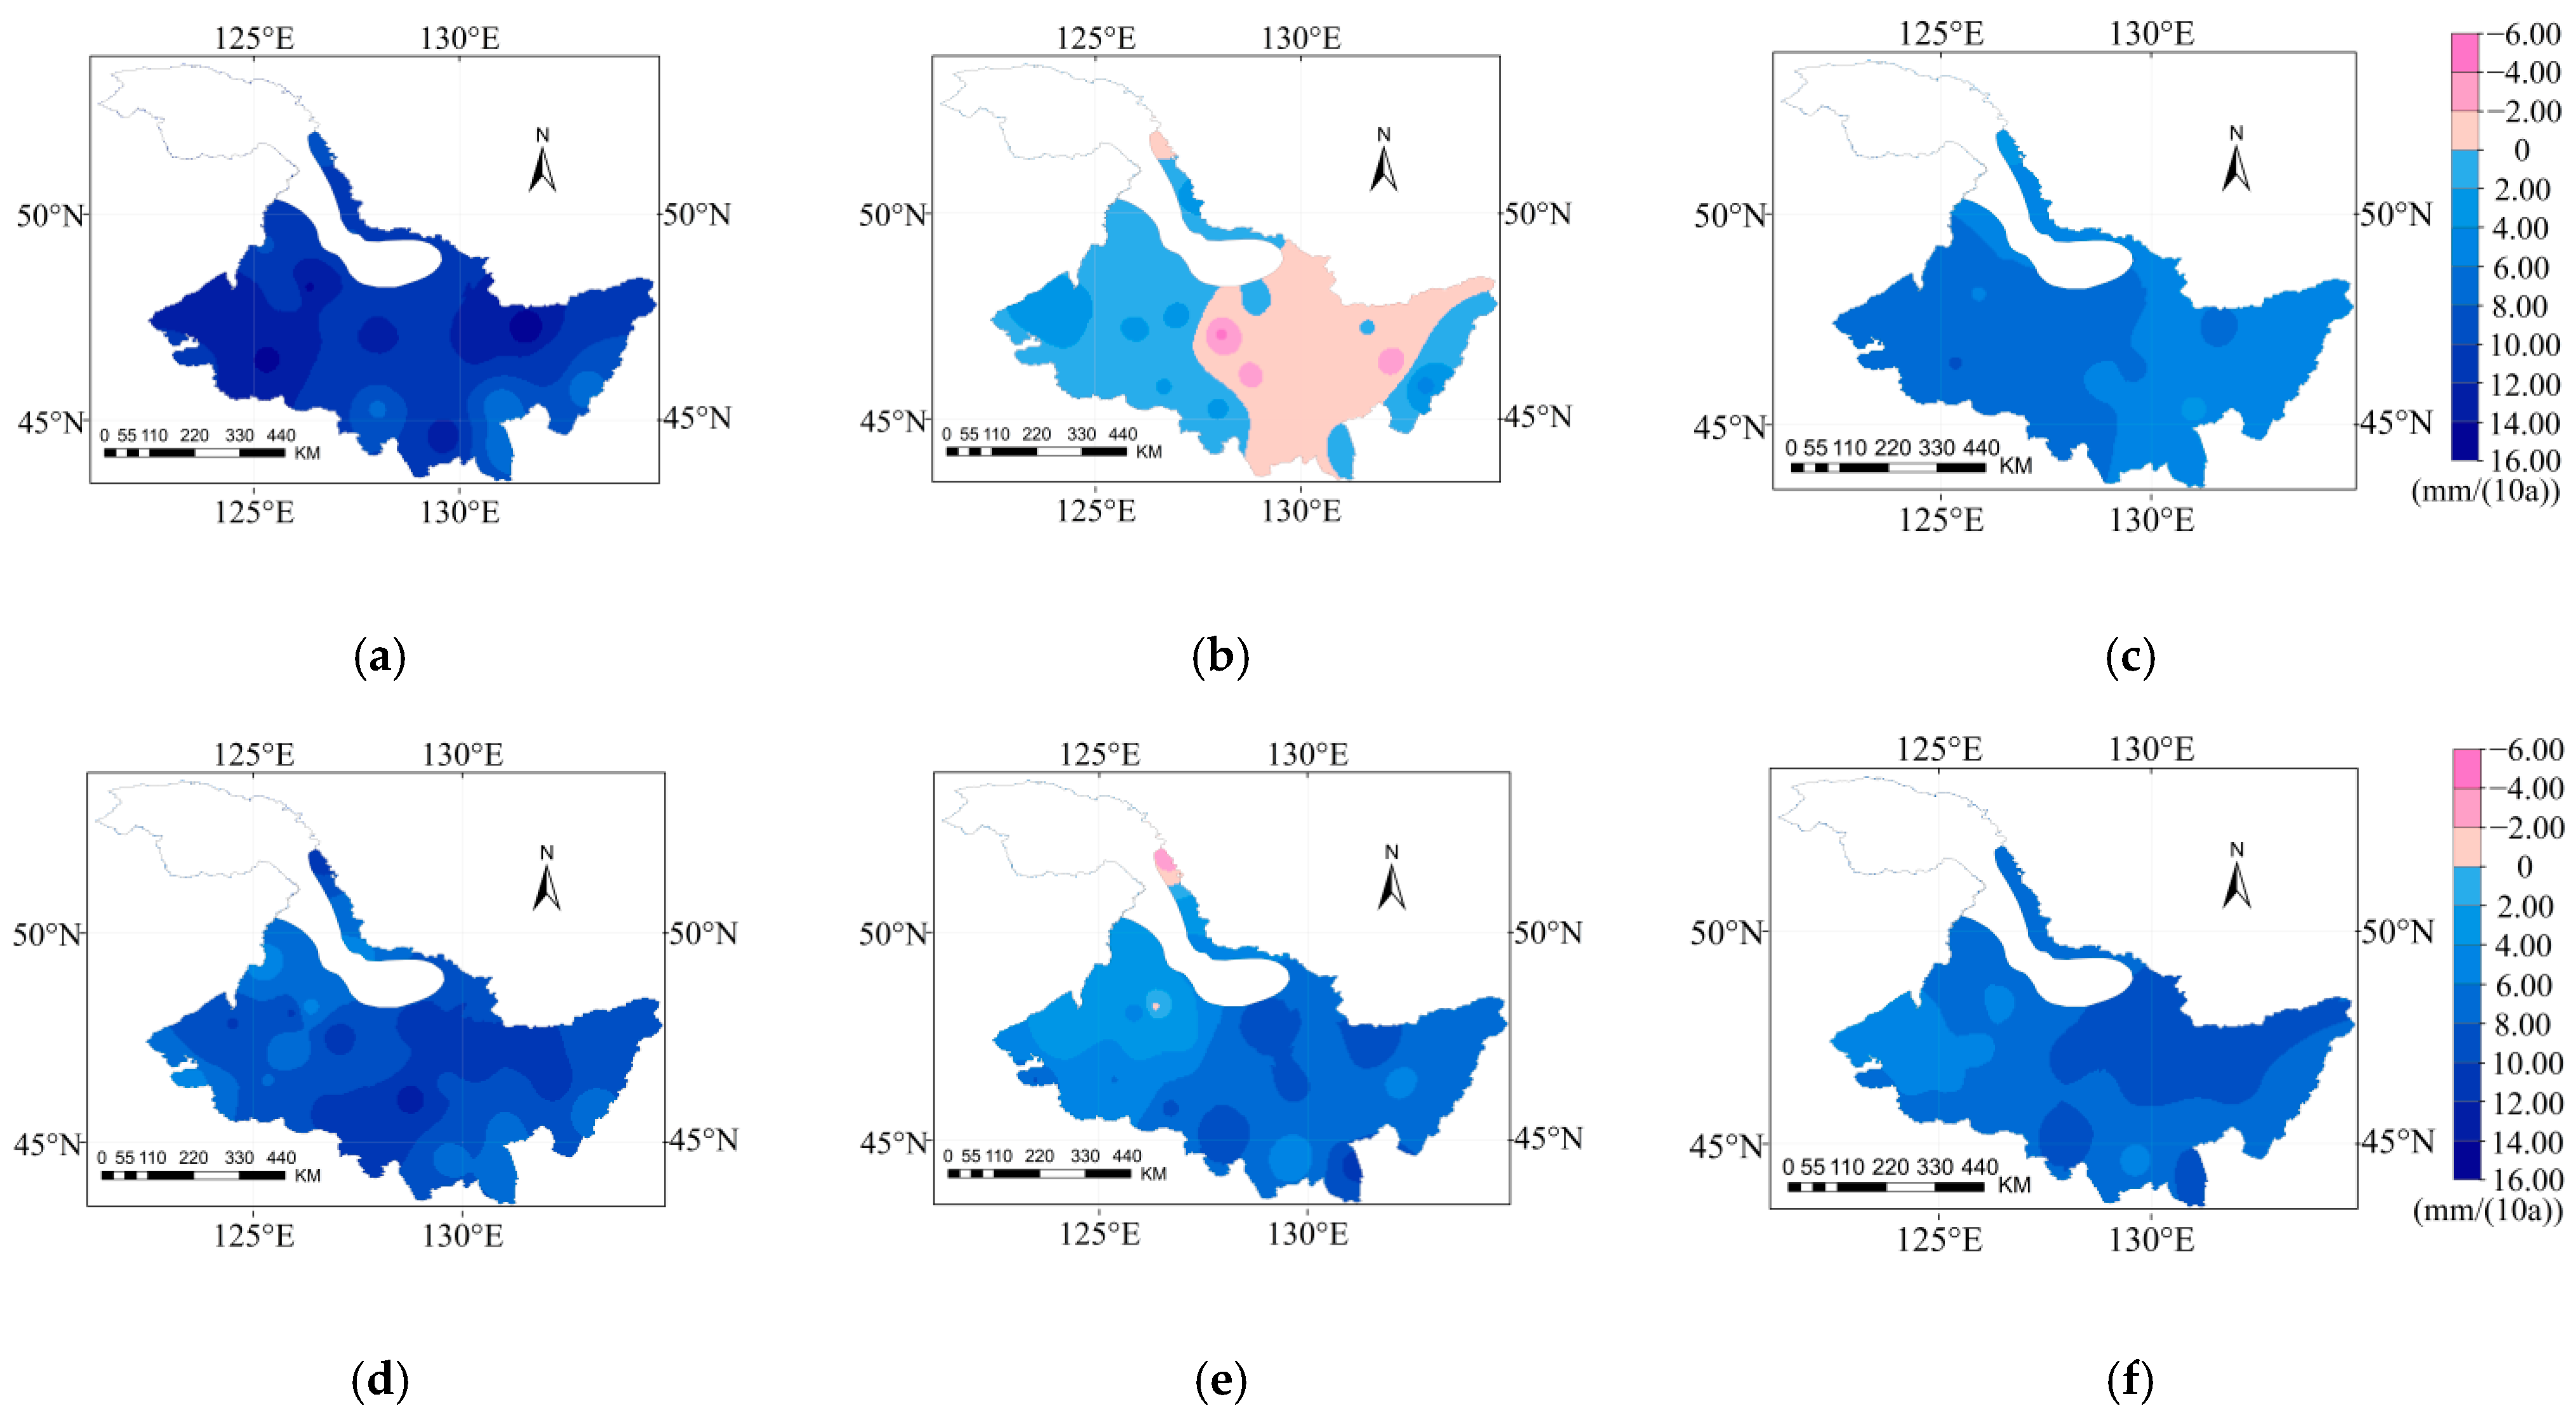
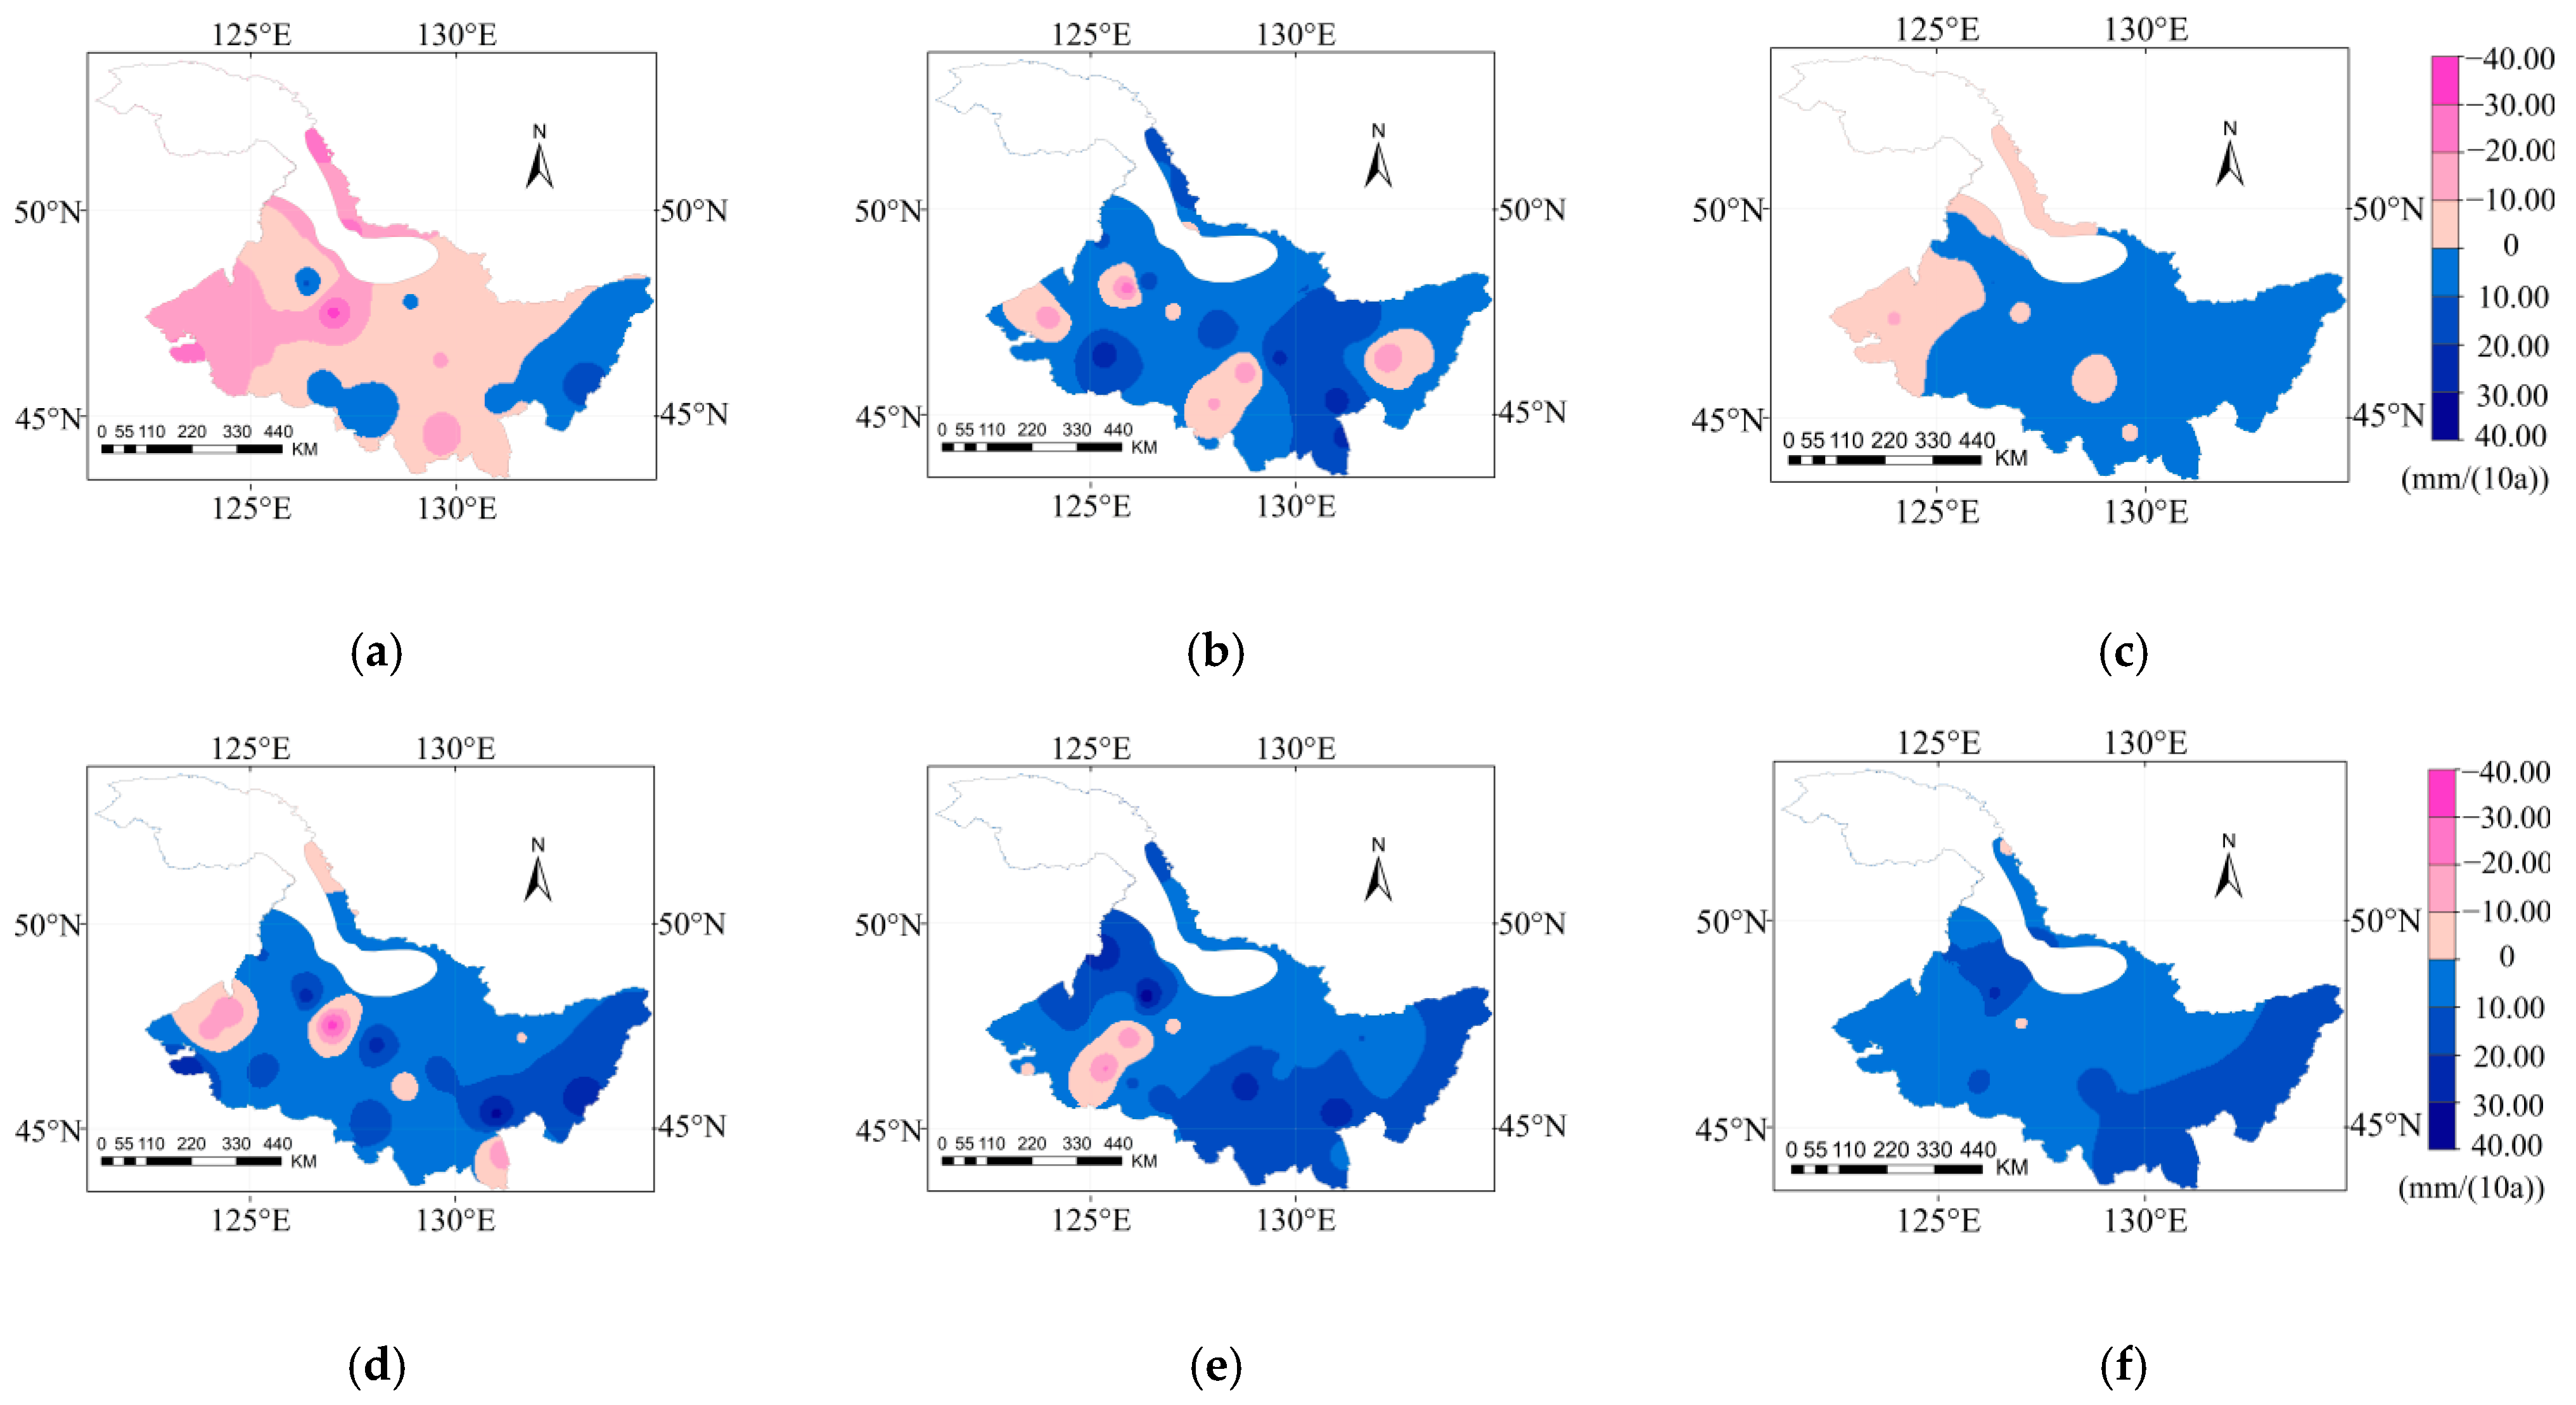
3.3. Spatial and Temporal Variation of ETc

The spatial distribution of ETc and its climate tendency rate of soybean growth period for 2021–2080 under RCP4.5 and RCP8.5 are shown in Figure 6 and Figure 7. Under RCP4.5, the ETc values for 2021–2080 were 356.88–470.45 mm, with an average of 414.35 mm. Under RCP8.5, the average ETc values for the 2030s, 2050s, and 2070s were 403.94, 423.39, and 436.07 mm, respectively. Under both RCP4.5 and RCP8.5, ETc increased and then decreased from west to east in the study area.
As shown in Figure 7, the climate tendency rates of soybean ETc for 2021–2080 were 2.92–8.11 mm/(10 years) and 4.08–9.39 mm/(10 years) under RCP4.5 and RCP8.5 with average values of 6.09 mm/(10 years) and 7.16 mm/(10 years), respectively. The ETc climate tendency rate was higher in the western region than that in the eastern region under RCP4.5, whereas it was higher in the eastern region than that in the western region under RCP8.5. All 26 sites passed the significance test at α = 0.001 under both RCP4.5 and RCP8.5. Specifically, soybean ETc in Yichun and Suifenhe increased at a rate of more than 11 mm/(10 years) under RCP8.5.

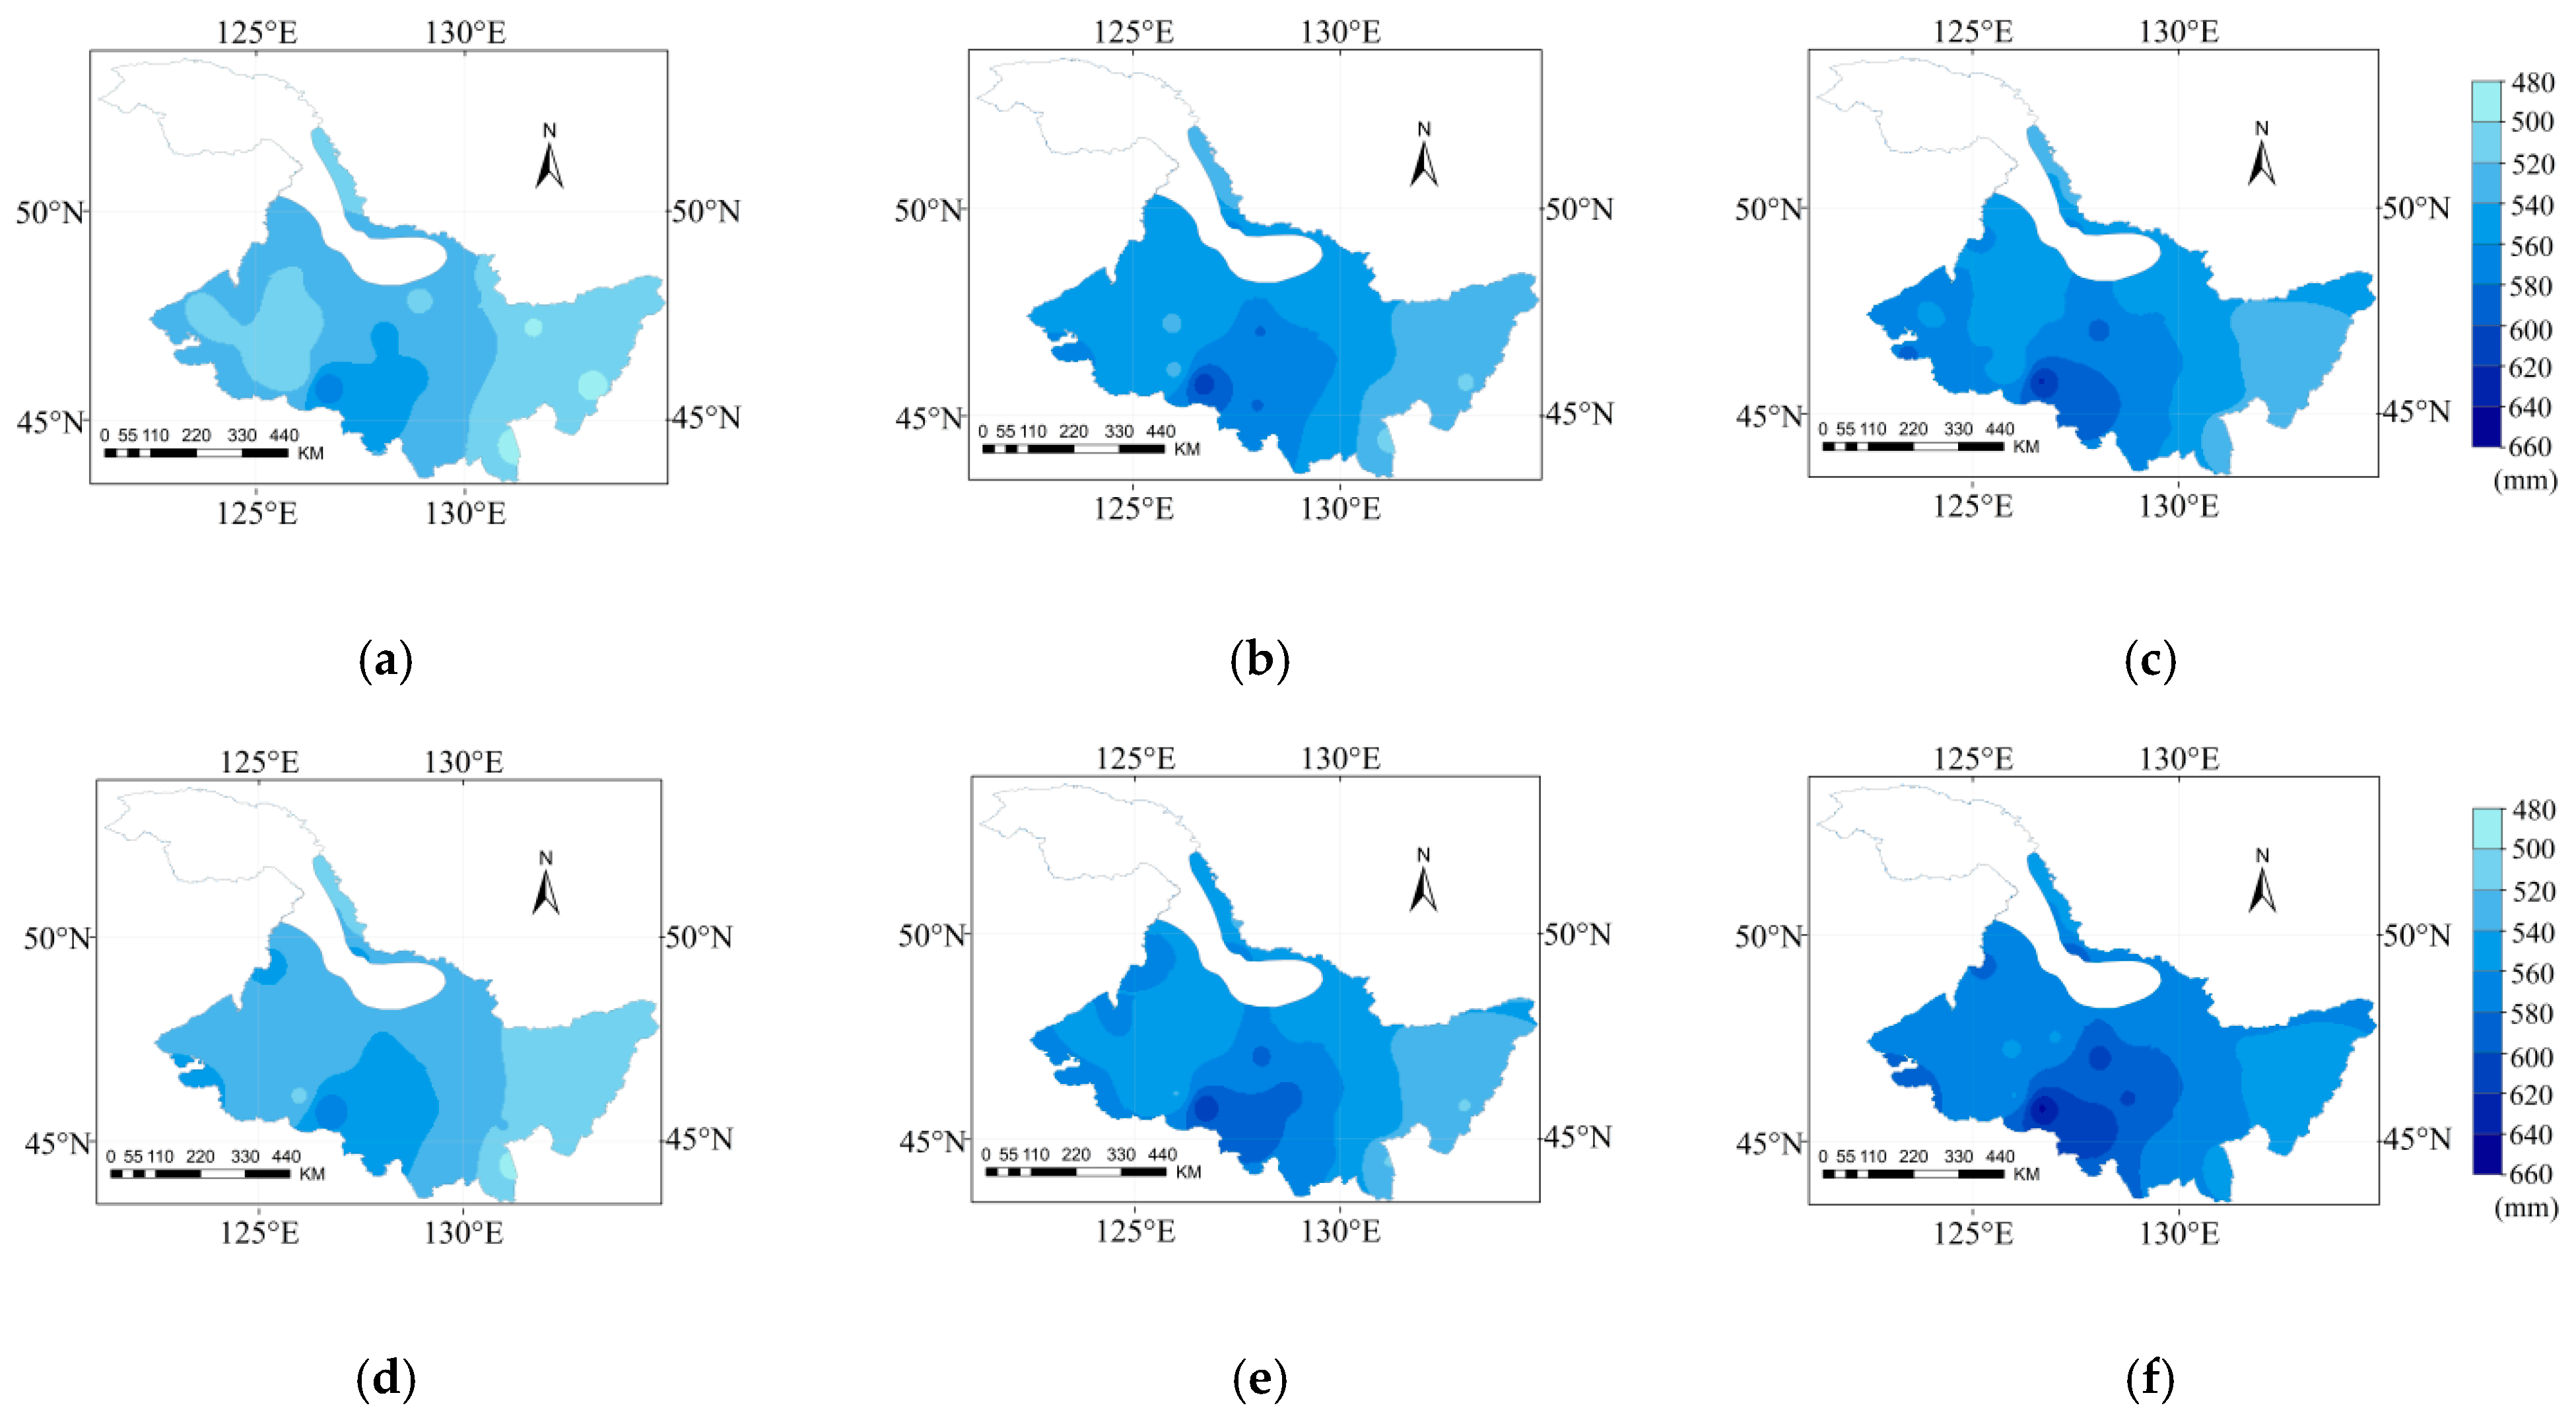
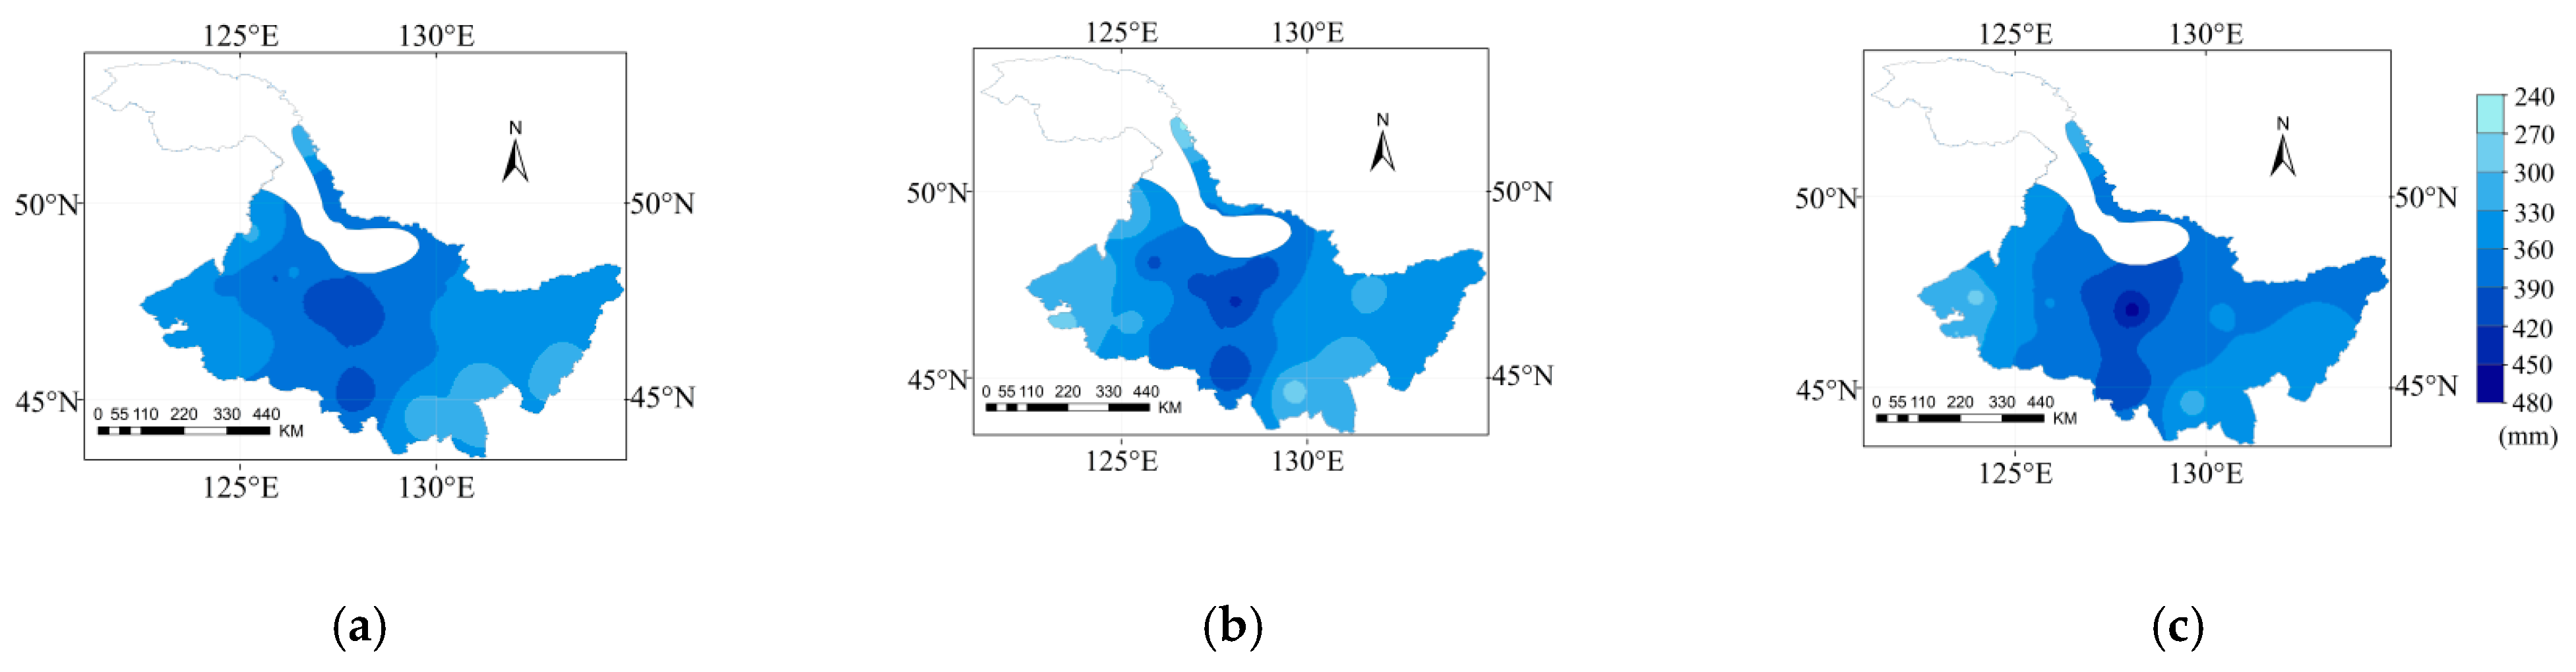
3.4. Spatial and Temporal Variation of Pe

The spatial distribution of Pe and its climate tendency rate under RCP4.5 and RCP8.5 during the soybean growth period for 2021–2080 are shown in Figure 8. Under RCP4.5 and RCP8.5, Pe values were 268.41–459.18 mm and 269.53–466.94 mm, with an average of 354.10 and 362.36 mm, respectively. Under RCP8.5, the greatest difference in Pe was 94.99 mm. Under RCP4.5 and RCP8.5, Pe first increased and then decreased from west to east; higher values were mainly distributed in Hailun and Tieli, with an average value greater than 370 mm, while lower values were mainly distributed in Tailai and Huma, with an average value lower than 340 mm.
Under RCP4.5, the climate tendency rate of Pe during the soybean growth period from 2021–2080 was −10.81–10.11 mm/(10 years), and the average was 1.37 mm/(10 years) (Figure 9). A total of 16 sites showed an upward trend, while 10 sites showed a downward trend. Bei’an, Harbin, Jixi, Suifenhe, and Tieli passed the significance test at α = 0.05, while Hulin, Keshan, and Suihua passed the significance test at α = 0.1. Under RCP8.5, the climate tendency rate of Pe for 2021–2080 was −1.16–22.28 mm/(10 years), with an average value of 8.77 mm/(10 years). Bei’an, Mudanjiang, Suifenhe, Suihua, and Tonghe passed the significance test at α = 0.001, while Baoqing, Fuyu, Fujin, and Mingshui passed the significance test at α = 0.05.

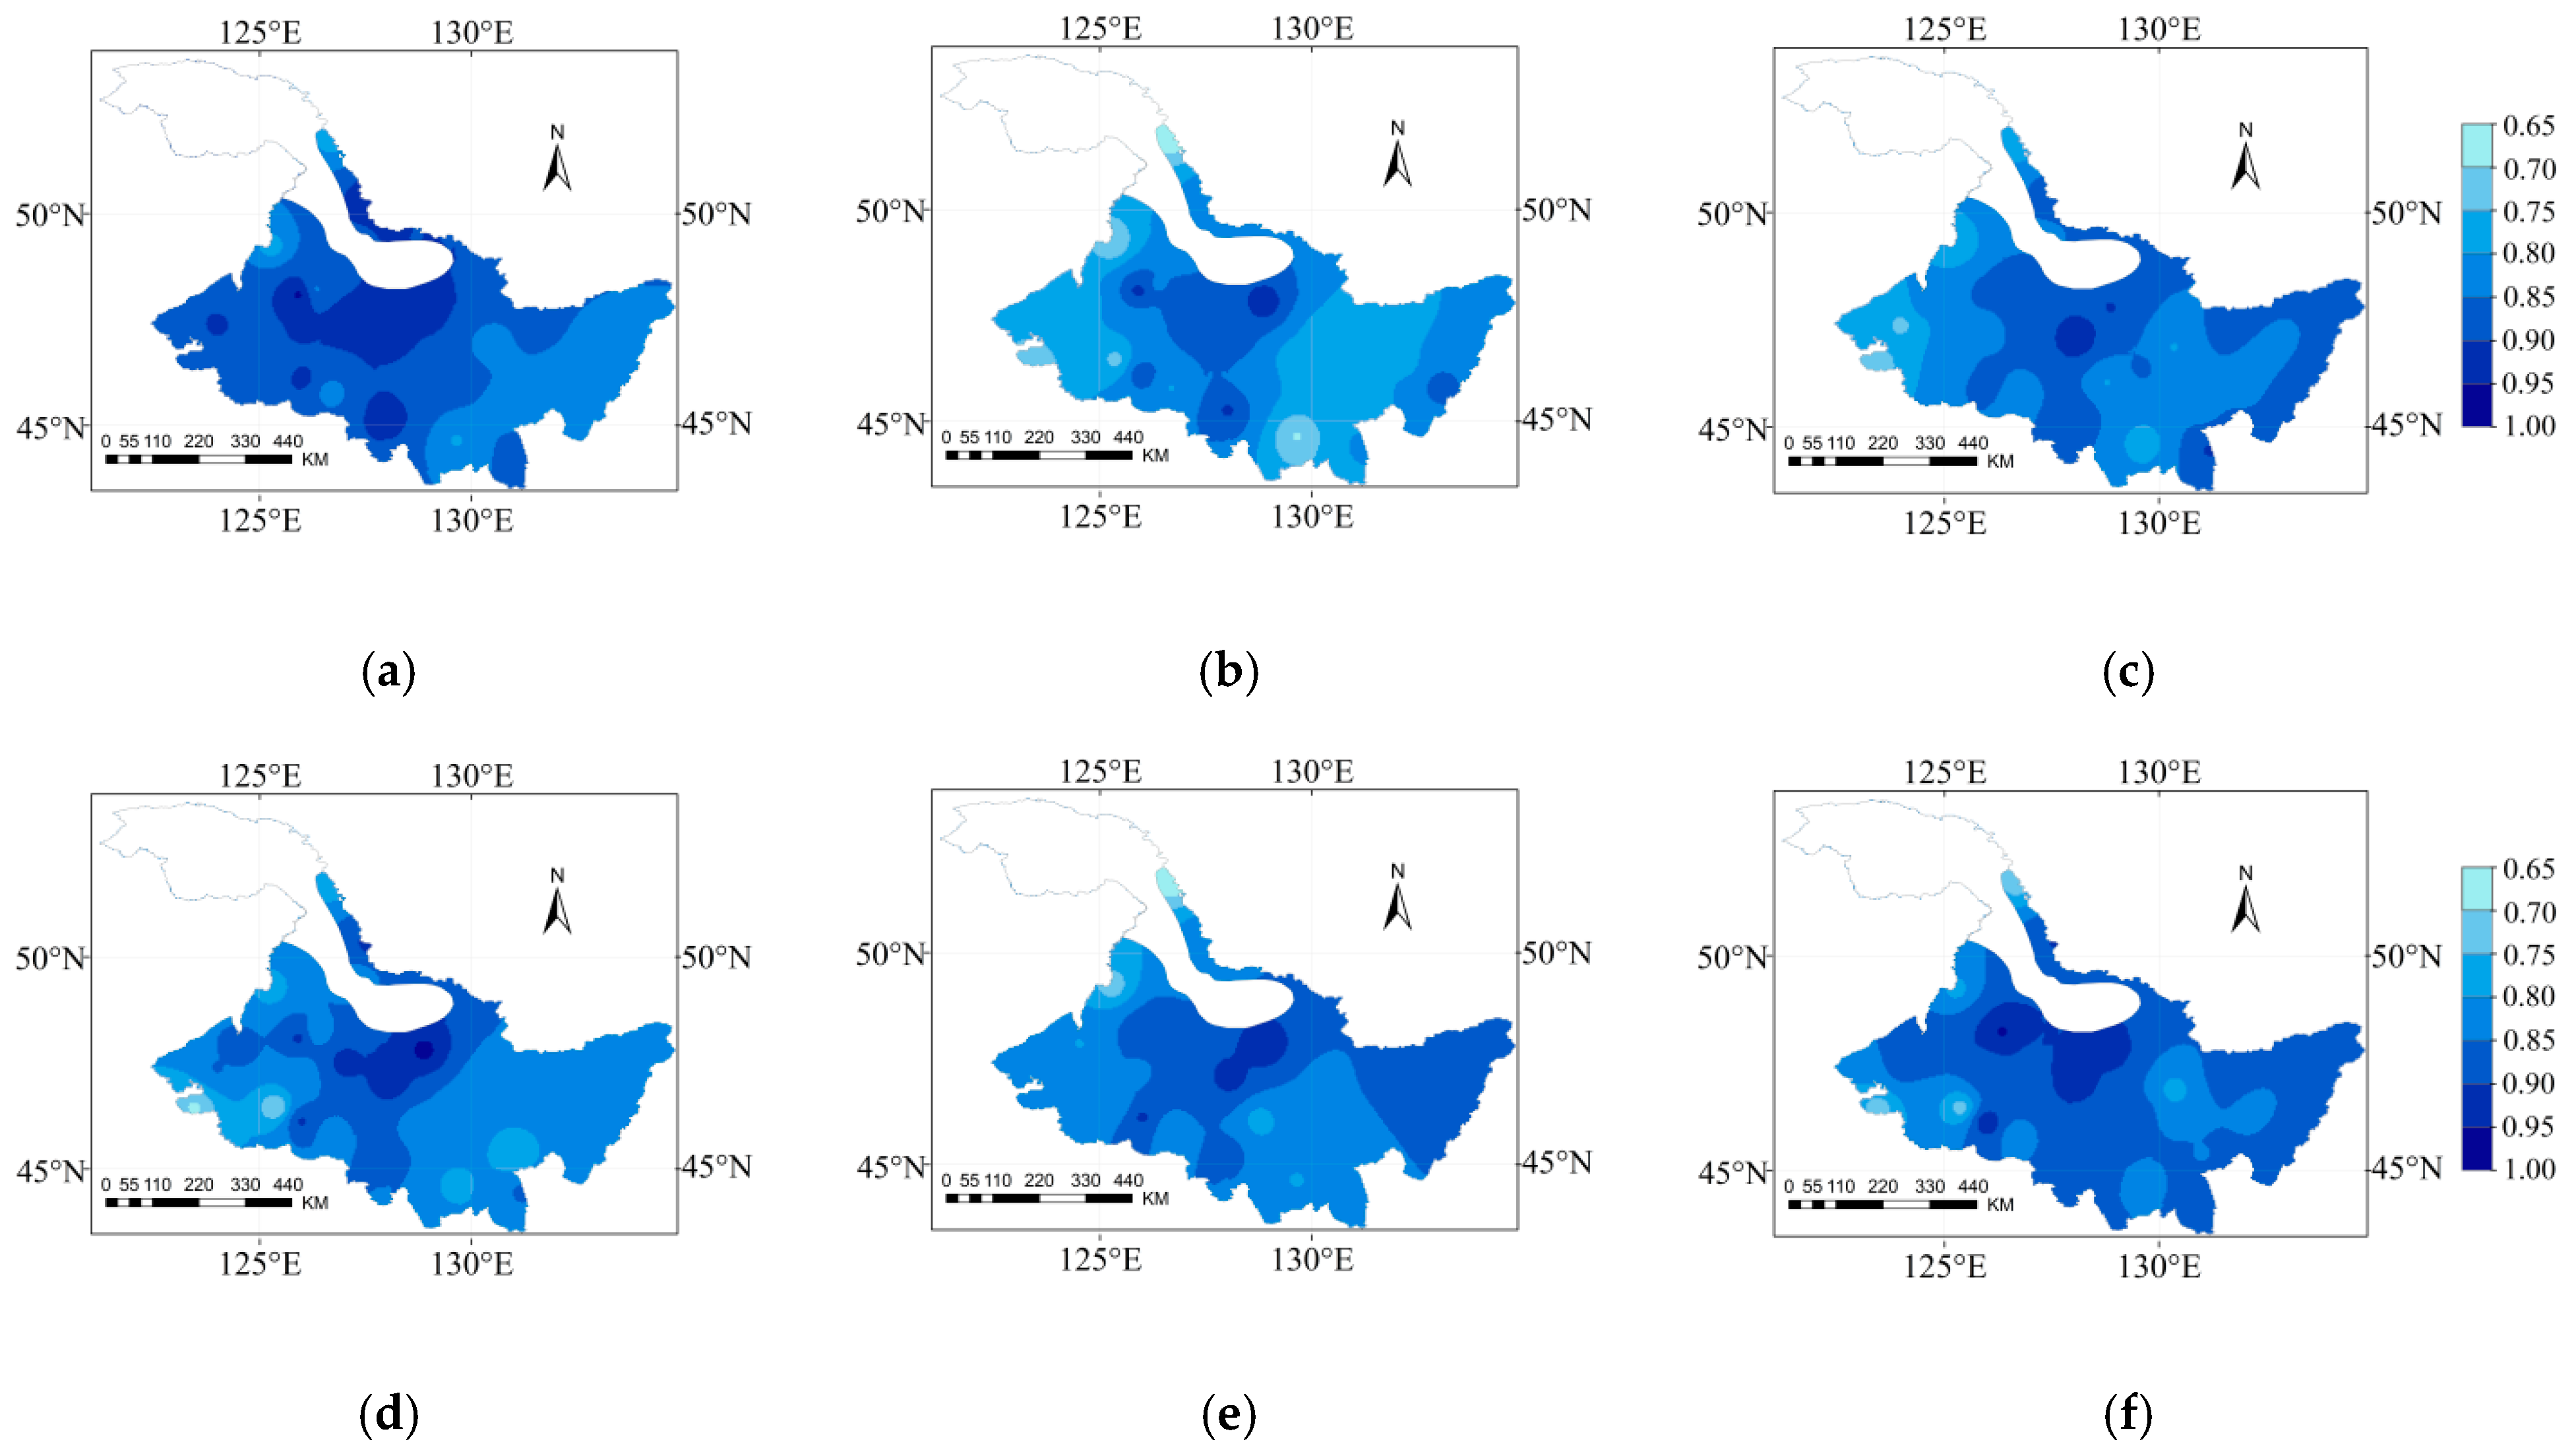
3.5. Spatial and Temporal Variation of CD

The CD values during the soybean growth period under RCP4.5 and RCP8.5 from 2021–2080 are shown in Figure 10. Under RCP4.5 and RCP8.5, the CD for 2021–2080 ranged from 0.66–0.95 and 0.66–0.96, with average values of 0.84 in both cases, showing a trend of first increasing and then decreasing in the study area.
The climate tendency rate of CD during the soybean growth period from 2021–2080 under the RCP4.5 was −0.036–0.014/(10 years), with an average value of −0.007/(10 years), showing an overall downward trend (Figure 11). Among them, Keshan and Qiqihar passed the significance test at α = 0.001, while Fuyu and Shangzhi passed the significance test at α = 0.05. However, under RCP8.5, the CD during the growth period of soybean ranged from −0.013 to 0.029/(10 years), with an average of 0.006/(10 years), showing an overall increasing trend. The climate tendency rates of CD at the 19 sites were greater than 0, among which Bei’an passed the significance test at α = 0.001, while Mudanjiang and Tonghe passed the significance test at α = 0.05.

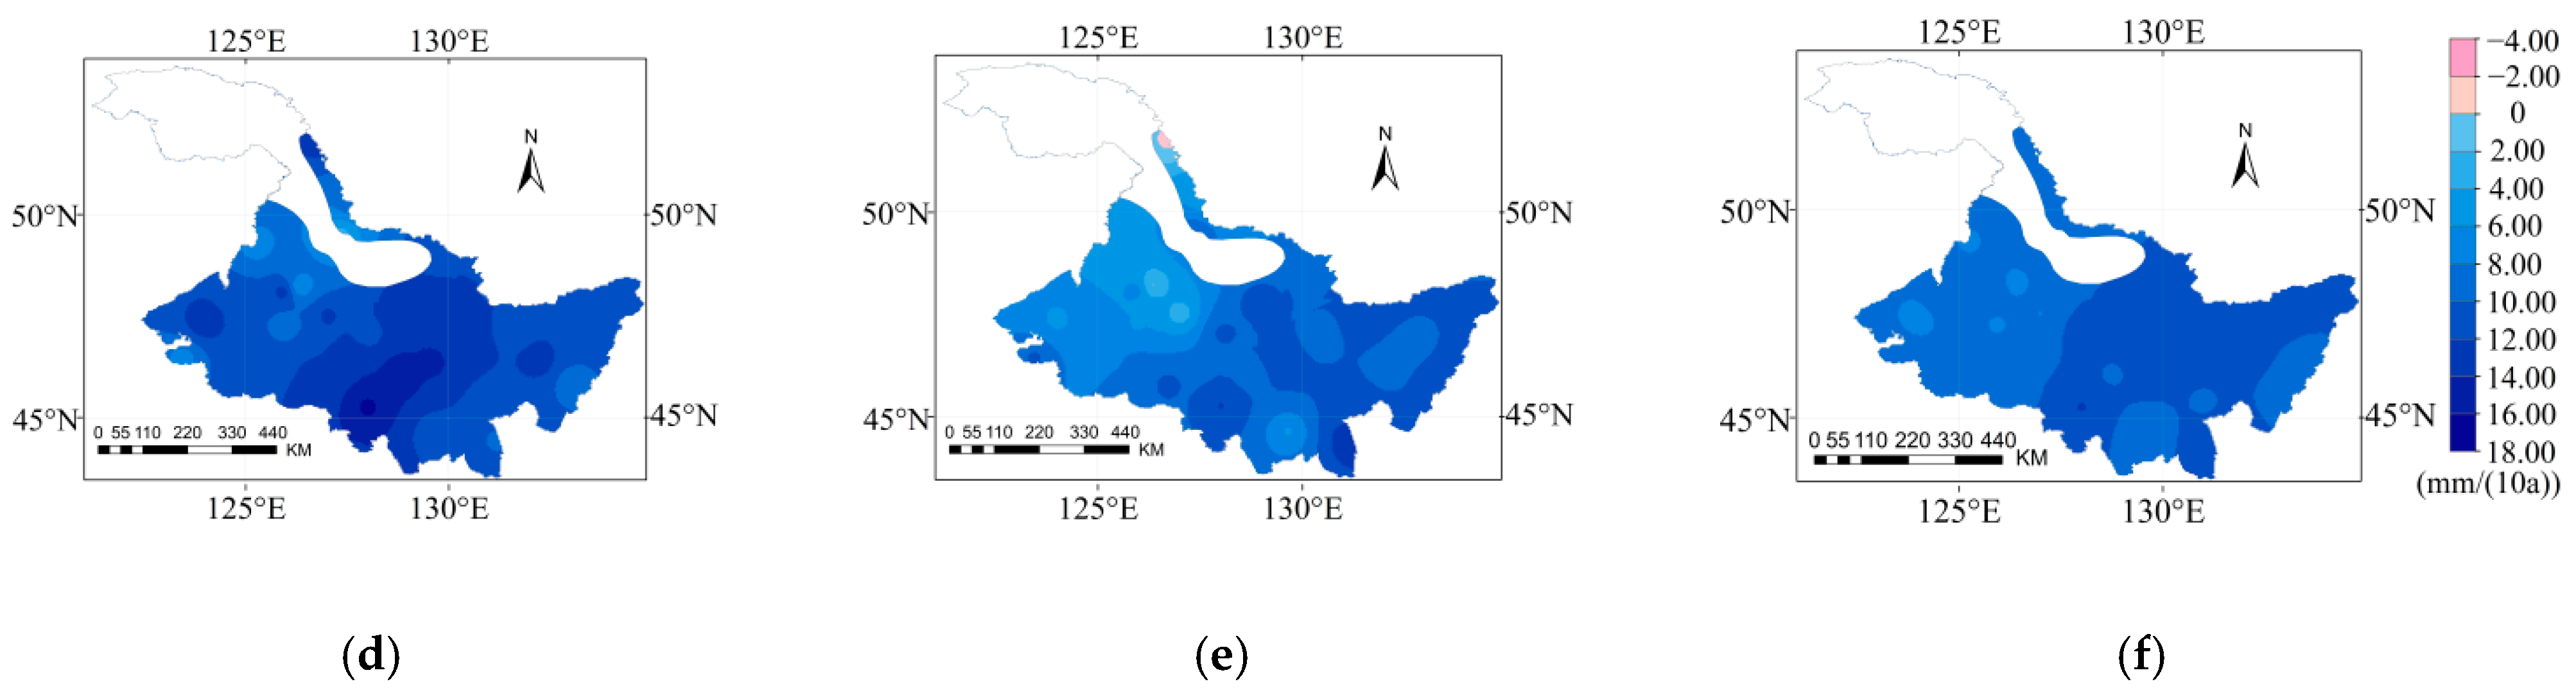
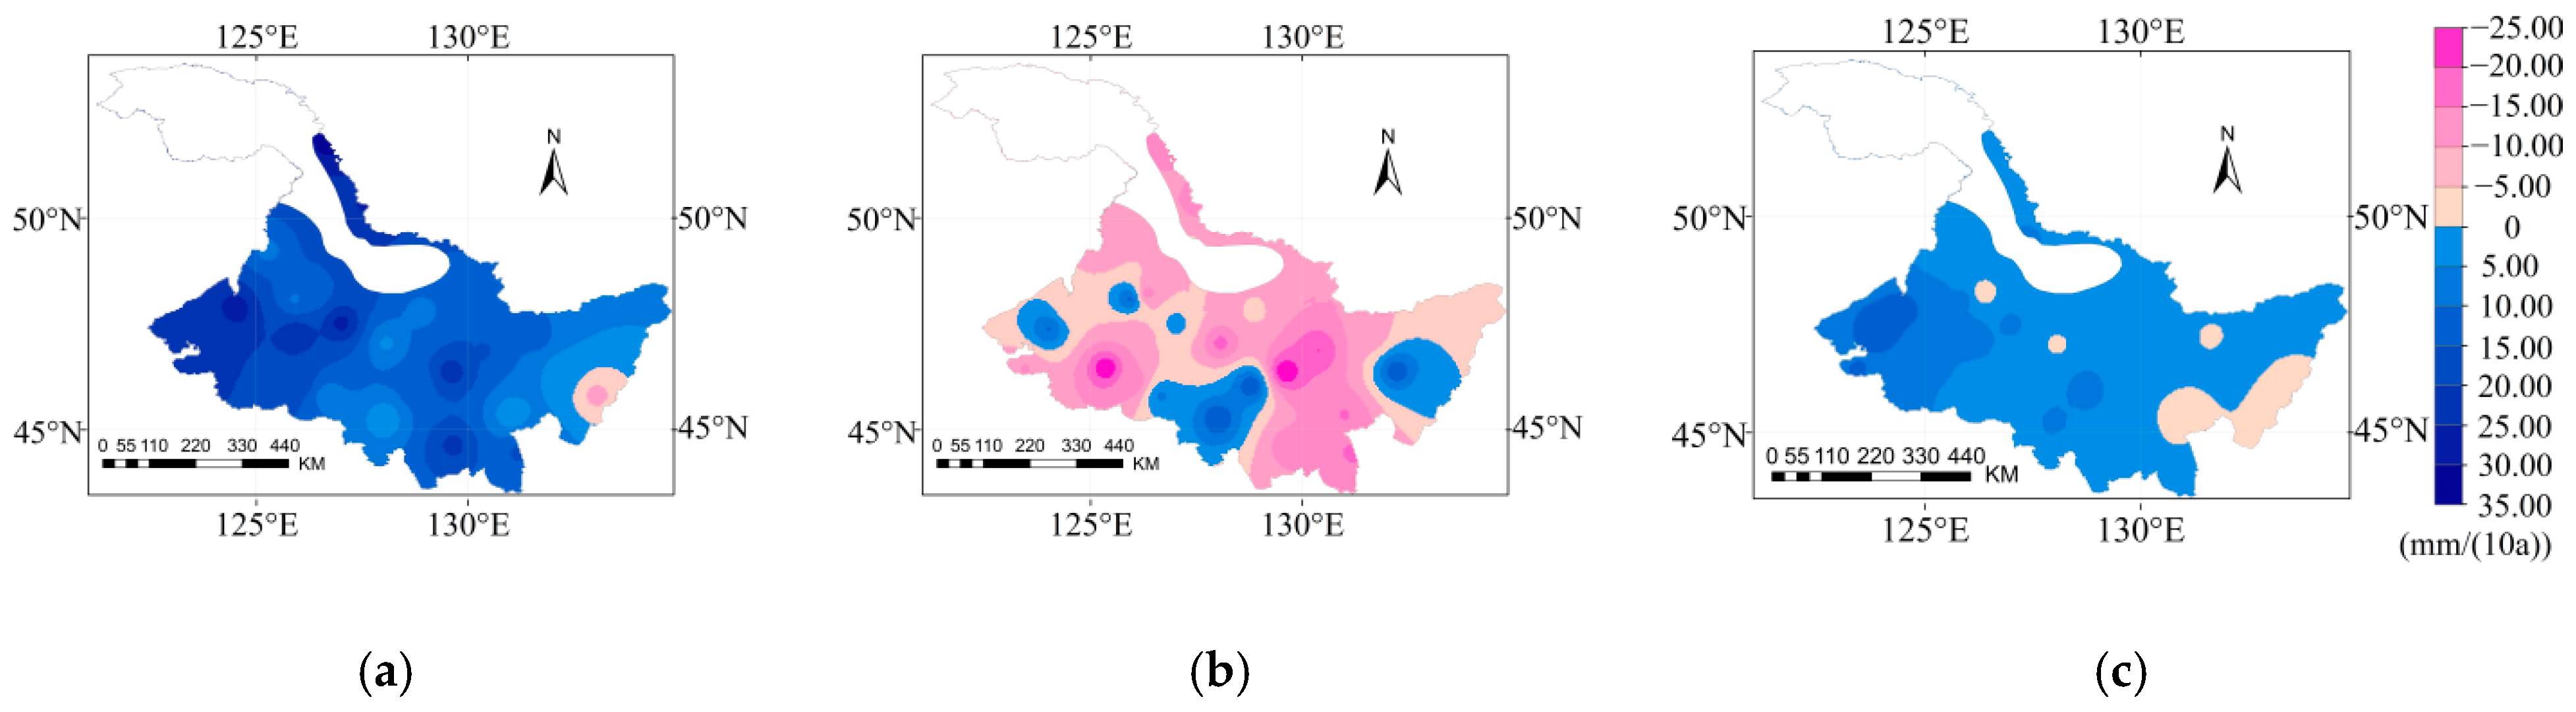
3.6. Spatial and Temporal Variation of Ir

The temporal and spatial distributions of Ir under RCP4.5 and RCP8.5 during the soybean growth period for 2021–2080 are shown in Figure 12. Under RCP4.5 and RCP8.5, the Ir values during 2021–2080 were 58.01–159.84 mm and 60.03–166.19 mm, with average values of 102.44 mm and 100.27 mm, respectively, which showed a trend of first decreasing and then increasing from west to east in the study area. Under RCP8.5, the greatest difference in Ir during the 2050s was as high as 43.32 mm, which was higher than that during the 2030s and 2050s (Figure 12d–f).
The average climate tendency rates of Ir during the growth period of soybean under RCP4.5 in 2021–2051, 2051–2080, and 2021–2080 were 14.88, −5.92, and 3.73 mm/(10 years), respectively (Figure 13). Among the 26 sites, Qiqihar increased at a significance of α = 0.001. Under RCP8.5, the average climate tendency rate of Ir for 2021–2080 was −0.067 mm/(10 years). Ir showed an overall downward trend (Figure 13d–f). During the whole period of the study, the climate tendency rates of Ir in 16 sites were negative, accounting for 61.54% of the total site number, among which, Bei’an decreased at a significance of α = 0.001.

3.7. Effect of Climate Change on Water Supply and Requirement

Under RCP4.5 and RCP8.5, soybean ETc was significantly positively correlated with Tmax and Rad and negatively correlated with RH (Table 2). Under RCP8.5, Pe was significantly negatively correlated with Tmax and Rad, significantly positively correlated with Tmin, and weakly correlated with RH. Under RCP4.5, Ir was significantly positively correlated with average Tmin, Tmax, and Rad, and significantly negatively correlated with average RH. The effects of meteorological factors on soybean ETc in the study area under RCP4.5 and RCP8.5 for 2021–2080 and the relationships among Pe, ETc, and Ir are shown in Figure 14. Under RCP4.5 and RCP8.5, soybean ETc was significantly correlated with average Tmin, Tmax, RH, and Rad. The increase in temperature and Rad led to an increase in ET0, further increasing ETc (Table 2). The correlation coefficient between ETc and Rad was greater than that of Tmax, indicating that the increasing soybean ETc was most influenced by Rad, followed by Tmax. The CD tended to decrease and then increase under RCP4.5; however, it tended to increase under RCP8.5 from the 2030s to 2070s. Under RCP4.5, ETc increased by 29.45 and 5.55 mm in the 2030s–2050s and 2050s–2070s, respectively, while Pe decreased by 12.21 mm in 2030s–2050s and then increased by 16.78 mm in 2050s–2080s. The combined effects of ETc and Pe led to a change in Ir, which first increased by 31.01 mm and then decreased by 13.65 mm from the 2030s to 2070s (Figure 14).

4. Discussion

4.1. Soybean ETc and Meteorological Factors

Soybean ETc showed an increasing trend from the 2030s to 2070s under RCP4.5 and RCP8.5 in Heilongjiang Province of China in this study. An upward trend in ETc was also observed in previous studies involving different crops under future climate change, including maize in Zimbabwe in the 2020s, 2050s, and 2090s [13], sugarcane in Pakistan in the 2020s, 2050s, and 2080s [45], rice in Kunshan in the 2020s–2080s [7], wheat, maize, and gram in India in the 2020s–2080s [28], wheat in three provinces of northeast China in the 2040s, 2070s, and 2100s [23], and summer maize in Huang-Huai-Hai Plain in 2016–2050 [46].
In the 60 year time series under RCP4.5 and RCP8.5 covered in this study, Tmin, Tmax, Rad, and RH were all strongly related to the increase in ETc. Yang et al. (2021) found that Rad, wind speed, and P had the strongest linear correlations with cotton ETc, with correlation coefficients of 0.410–0.789, 0.361–0.676, and −0.215–−0.410, for 1965–2016 in NCP, respectively. The correlation of ETc with RH and average temperature were weak, in the range of −0.189–−0.047 and −0.102–0.015, respectively [16]. In contrast, under RCP4.5 and RCP8.5, the decline rate of RH climate tendency rate in Heilongjiang Province was almost twice that of the NCP. The decreased RH in the air increased the evaporation rate, thus increasing ETc [47]. Nageen reported an increasing trend in ETc for sugarcane as well, which was due to the forecasted temperature rise in the future Pakistan region, while the increased Pe could not compensate for the increased ETc [45]. In addition, this study found that the increase in sunshine hours provided more radiation and light energy to the soybean [48], thus promoting the opening of stomata for plant transpiration and leading to an increase in transpiration [49]; accordingly, ETc showed an increasing trend. Li et al. [46] reported that the temperature would continue to rise in the future in the Huang-Huai-Hai Plain, while the summer maize evaporation would increase, resulting in increased ETc. However, this study focused more on the impact of the combined effects of Tmin, Tmax, RH, and Rad meteorological factors on the increase in ETc in soybean.

4.2. Soybean ETc, Pe, and Ir

In this study, the annual average ETc for the soybean growing season under RCP4.5 and RCP8.5 for 2021–2080 was higher than that of soybean in Heilongjiang Province for 1966–2015 reported by Li et al. [30]. The higher ETc indicated soybean in this study area may suggest the need for more water due to the increase in evapotranspiration derived from future climate conditions [50]. Oludare et al. (2020) reported that the average temperature and Rad increased, while soybean ETc increased slightly under RCP4.5 and RCP8.5 for 2021–2099 in the Ogun-Ona River Basin, Nigeria [50]. Similar to the results of this study, the ETc of soybean in different regions of the world also increased with the same trend of meteorological factors.
Under RCP4.5 and RCP8.5, the Pe and Ir of soybean were higher than reported by Li et al. [30]. Although a small increase in Pe was predicted in the future, more Ir was still needed, which probably increased the pressure on agricultural water, as well as drought frequency [51]. The highest ETc and Pe under RCP4.5 and RCP8.5 in this study were distributed in the south; however, Li et al. (2020) reported that the highest ETc and Pe were in the west [34]. Due to the increase in Tmin, Tmax, and Rad in the southern region and the decrease in RH, higher ETc is expected in the future. Moreover, in the historical period, Li et al. [34] did not consider the influence of Rad on ETc. In addition, ETc is also affected by the plant itself, such as plant canopy structure and plant physiology [52]. Under RCP4.5, the climate tendency rate of ETc was much greater in the west than that in the east; however, under RCP8.5, the climate tendency rate of ETc showed an opposite spatial distribution trend, which differed from the results of Hu et al. [37]. This might be due to the higher values of Rad under RCP8.5, resulting in an increase in the climate tendency rate of ETc in the east. On the other hand, the meteorological factors came from different meteorological stations and time series [53]. Under future climate change, their increasing or decreasing trends and magnitudes are also very different from the past [54]. This study provides long-term information for soybean water and irrigation requirements in Heilongjiang Province of China under future climate change [55].

4.3. Uncertainties and Limitations of the Study

This study indicated that there was a strong relationship among temperature, Pe variability, ETc, and Ir under climate change. Two limitations should be taken into account in this study. Firstly, due to political and socioeconomic factors, regional climate programs are unable to accurately predict the path of future greenhouse gas emissions [56]. We only considered the RCP4.5 and RCP8.5, in which the concentration of CO2 is fixed; however, in fact, the concentration of CO2 varies with time [2]. In addition, the “Special Report on Emission Scenarios” (SRES) also proposed that two other emission scenarios, A1 (emphasizing economic development) and B2 (emphasizing sustainable development), can also predict the future climate [23]. However, anthropogenic-based climate change scenarios are one-sided scenarios. Under the actual climate in the future, the biological and agricultural technological progress of soybean planting will certainly change to reduce the impact of climate change. Secondly, we adjusted the parameters of the CROPWAT crop model for Heilongjiang Province, but there were still some uncertainties in the simulation parameters. For example, Kc and crop phenology are expected to change under future climatic change [57]. Therefore, changes in all meteorological factors caused by global warming and the uncertainties and limitations of the model should be deeply considered in further study.

5. Conclusions

In 2021–2080, Tmin, Tmax, and Rad increased while RH decreased under RCP4.5 and RCP8.5. In particular, the climate tendency rates for Tmin, Tmax, and Rad were higher under RCP8.5. There was little difference in the climate tendency rate of RH between RCP4.5 and RCP8.5. Affected by the changes in climate factors in the future, the ET0, ETc, and Pe during soybean growth period in Heilongjiang Province showed an upward trend under RCP4.5 and RCP8.5. The climate tendency rates of annual ETc were 6.09 mm/(10 years) and 7.16 mm/(10 years), respectively. The climate tendency rate of annual Ir was 3.73 mm/(10 years) under RCP 4.5, while it was −0.067 mm/(10 years) under RCP 8.5. The results showed that the soybean in whole Heilongjiang province would face water shortage stress in the future, especially in the central and western regions. There would be more P and less ETc in the eastern region. Therefore, we should appropriately adjust the crop structure, change the planting system, and recommend increasing the soybean planting area in the eastern Heilongjiang Province. This study can guide future irrigation system planning and management policy in Heilongjiang Province.

Author Contributions

Conceptualization, T.N. and N.L.; methodology, T.N. and N.L.; validation, Y.T., Y.J. and Z.Z.; formal analysis, N.L. and T.N.; writing—original draft preparation, N.L. and T.N.; writing—review and editing, T.W., Z.Z., P.C., T.L., L.M. and K.C.; visualization, N.L., Y.T., D.L. and T.W.; supervision, T.N.; project administration, T.N.; funding acquisition, T.N. All authors have read and agreed to the published version of the manuscript.

Funding

This work was fund by Basic Scientific Research Fund of Heilongjiang Provincial Universities (grant number: 2021-KYYWF-0019), the Opening Project of Key Laboratory of Efficient Use of Agricultural Water Resources, Ministry of Agriculture and Rural Affairs of the People’s Republic of China in Northeast Agricultural University (grant number: AWR2021002), and the National Natural Science Foundation Project of China (grant number: 51779046).

Institutional Review Board Statement

Not applicable.

Informed Consent Statement

Not applicable.

Data Availability Statement

The data presented in this study are available on request from the corresponding author.

Acknowledgments

We thank the Chinese meteorological data sharing service (http://data.cma.cn, accessed on 22 May 2022) for providing the meteorological data. We thank all the members in the Lab of the Pumping, Hydraulic Teaching, and Experimental Center of Heilongjiang University. Lastly, we thank the anonymous reviewers and the editor for their suggestions, which substantially improved the manuscript.

Conflicts of Interest

The authors declare no conflict of interest.

References

  1. Chen, Y.Y. Impact of climate change on grain production in China. Chin. Agric. Sci. Bull. 2021, 12, 51–57. (In Chinese) [Google Scholar]
  2. Intergovernmental Panel on Climate Change (IPCC). Global Warming of 1.5 °C; Impacts of 1.5 °C of Global Warming on Natural and Human Systems. Contribution of Working Group I to the Sixth Assessment Report of the Intergovernmental Panel on Climate Change; Intergovernmental Panel on Climate Change (IPCC): Geneva, Switzerland, 2018; in press. [Google Scholar]
  3. Wang, T.; Du, C.; Nie, T.; Sun, Z.; Zhu, S.; Feng, C.; Dai, C.; Chu, L.; Liu, Y.; Liang, Q. Spatiotemporal analysis of maize water requirement in the Heilongjiang Province of China during 1960–2015. Water 2020, 12, 2472. [Google Scholar] [CrossRef]
  4. Tang, C.X. Influence of rainfall weather on agricultural production and countermeasures. Agric. Dev. Equip. 2019, 10, 68–69. (In Chinese) [Google Scholar]
  5. Bouras, E.; Jarlan, L.; Khabba, S.; Er-Raki, S.; Dezetter, A.; Sghir, F.; Tramblay, Y. Assessing the impact of global climate changes on irrigated wheat yields and water requirements in a semi-arid environment of Morocco. Sci. Rep. 2019, 9, 19142. [Google Scholar] [CrossRef]
  6. Ding, Y.; Wang, W.; Zhuang, Q.; Luo, Y. Adaptation of paddy rice in China to climate change: The effects of shifting sowing date on yield and irrigation water requirement. Agric. Water Manag. 2020, 228, 105890. [Google Scholar] [CrossRef]
  7. Wang, W.G.; Sun, F.Z.; Peng, S.Z.; Xu, J.Z.; Luo, Y.F.; Jiao, X.Y. Simulation of response of rice irrigation water demand to climate change. Trans. Chin. Soc. Agric. Eng. 2013, 14, 90–98. (In Chinese) [Google Scholar]
  8. Acharjee, T.K.; Ludwig, F.; van Halsema, G.; Hellegers, P.; Supit, I. Future changes in water requirements of Boro rice in the face of climate change in North-West Bangladesh. Agric. Water Manag. 2017, 194, 172–183. [Google Scholar] [CrossRef]
  9. Cheshmberah, F.; Zolfaghari, A.A. The Effect of Climate Change on Future Reference Evapotranspiration in Different Climatic Zones of Iran. Pure Appl. Geophys. 2019, 176, 3649–3664. [Google Scholar] [CrossRef]
  10. Ti, J.; Yang, Y.; Yin, X.; Liang, J.; Pu, L.; Jiang, Y.; Wen, X.; Chen, F. Spatio-Temporal Analysis of Meteorological Elements in the North China District of China during 1960–2015. Water 2018, 10, 789. [Google Scholar] [CrossRef] [Green Version]
  11. Nie, T.; Tang, Y.; Jiao, Y.; Li, N.; Wang, T.; Du, C.; Zhang, Z.; Chen, P.; Li, T.; Sun, Z.; et al. Effects of Irrigation Schedules on Maize Yield and Water Use Efficiency under Future Climate Scenarios in Heilongjiang Province Based on the AquaCrop Model. Agronomy 2022, 12, 810. [Google Scholar] [CrossRef]
  12. Lyu, J.; He, Q.-Y.; Chen, Q.-W.; Cheng, R.-R.; Li, G.; Otsuki, K.; Yamanaka, N.; Du, S. Distinct transpiration characteristics of black locust plantations acclimated to semiarid and subhumid sites in the Loess Plateau, China. Agric. Water Manag. 2022, 262, 107402. [Google Scholar] [CrossRef]
  13. Nkomozepi, T.; Chung, S.-O. Assessing the trends and uncertainty of maize net irrigation water requirement estimated from climate change projections for Zimbabwe. Agric. Water Manag. 2012, 111, 60–67. [Google Scholar] [CrossRef]
  14. Xiao, D.; Liu, D.L.; Wang, B.; Feng, P.; Bai, H.; Tang, J. Climate change impact on yields and water use of wheat and maize in the North China Plain under future climate change scenarios. Agric. Water Manag. 2020, 238, 106238. [Google Scholar] [CrossRef]
  15. Yang, X.; Jin, X.; Chu, Q.; Pacenka, S.; Steenhuis, T.S. Impact of climate variation from 1965 to 2016 on cotton water requirements in North China Plain. Agric. Water Manag. 2021, 243, 106502. [Google Scholar] [CrossRef]
  16. Chen, D.W. Advances in Prediction and Calculation of Crop Water Demand. Hydro Sci. Cold Zone Eng. 2021, 4, 171–174. (In Chinese) [Google Scholar]
  17. Wang, Y.; Shao, X.H.; Li, Y.H. Research progress on real-time prediction method of reference crop water requirement. J. Anhui Agric. Sci. 2008, 36, 13919–13920. (In Chinese) [Google Scholar] [CrossRef]
  18. Tavakoli, A.R.; Moghadam, M.M.; Sepaskhah, A.R. Evaluation of the AquaCrop model for barley production under deficit irrigation and rainfed condition in Iran. Agric. Water Manag. 2015, 161, 136–146. [Google Scholar] [CrossRef]
  19. FAO. OECD-FAO Agricultural Outlook; OECD Publishing, Food and Agriculture Organization of the United Nations: Rome, Italy, 2009; pp. 2011–2020. [Google Scholar]
  20. Lu, X.P.; Duan, S.Q.; Ma, X.Y.; Bai, S.M. Comparative Study on Calculation of Maize Water Demand by Single and Double Crop Coefficient Method. Water Sav. Irrig. 2012, 11, 18–21. (In Chinese) [Google Scholar]
  21. Zhang, L.; Tan, F.; Li, S.; Huo, Z. Potential dynamic of irrigation water requirement for rice across Northeast China. Theor. Appl. Climatol. 2020, 142, 1283–1293. [Google Scholar] [CrossRef]
  22. Wu, J.B.; Ma, Y.F.; Zheng, H.X.; Cao, X.S. Estimation of maize evapotranspiration in semi-arid region based on modified crop coefficient model. J. Water Resour. Archit. Eng. 2020, 18, 25–29. (In Chinese) [Google Scholar]
  23. Zhang, J.P.; Wang, C.Y.; Yang, X.G.; Zhao, Y.X.; Liu, Z.J.; Wang, J.; Chen, Y.Y. Prediction of the impact of future climate change on maize water demand in Northeast China. Trans. Chin. Soc. Agric. Eng. 2009, 25, 50–55. (In Chinese) [Google Scholar]
  24. Nie, T.Z.; Zhang, Z.X.; Qi, Z.J.; Chen, P.; Lin, Y.Y.; Sun, Z.Y. Spatial-temporal distribution characteristics of rice water demand in Heilongjiang Province from 1960 to 2015. Trans. Chin. Soc. Agric. Mach. 2019, 50, 279–290. (In Chinese) [Google Scholar]
  25. Jin, X. Application of Penman Formula in Crop Water Demand Calculation. Jianghuai Water Resour. Sci. Technol. 2018, 1, 28–30. (In Chinese) [Google Scholar]
  26. Awal, R.; Fares, A.; Bayabil, H. Assessing Potential Climate Change Impacts on Irrigation Requirements of Major Crops in the Brazos Headwaters Basin, Texas. Water 2018, 10, 1610. [Google Scholar] [CrossRef] [Green Version]
  27. Hong, E.-M.; Nam, W.-H.; Choi, J.-Y.; Pachepsky, Y.A. Projected irrigation requirements for upland crops using soil moisture model under climate change in South Korea. Agric. Water Manag. 2016, 165, 163–180. [Google Scholar] [CrossRef] [Green Version]
  28. Hossain, M.B.; Roy, D.; Maniruzzaman, M.; Biswas, J.C.; Naher, U.A.; Haque, M.M.; Kalra, N. Response of crop water requirement and yield of irrigated rice to elevated temperature in Bangladesh. Int. J. Agron. 2021, 2021, 9963201. [Google Scholar] [CrossRef]
  29. Sunil, A.; Deepthi, B.; Mirajkar, A.B.; Adarsh, S. Modeling future irrigation water demands in the context of climate change: A case study of Jayakwadi command area, India. Model. Earth Syst. Environ. 2021, 7, 1963–1977. [Google Scholar] [CrossRef]
  30. Goodarzi, M.; Abedi-Koupai, J.; Heidarpour, M. Investigating Impacts of Climate Change on Irrigation Water Demands and Its Resulting Consequences on Groundwater Using CMIP5 Models. GroundWater 2019, 57, 259–268. [Google Scholar] [CrossRef]
  31. Chen, P.; Nie, T.; Chen, S.; Zhang, Z.; Qi, Z.; Liu, W. Recovery efficiency and loss of 15N-labelled urea in a rice-soil system under water saving irrigation in the Songnen Plain of Northeast China. Agric. Water Manag. 2019, 222, 139–153. [Google Scholar] [CrossRef]
  32. Chen, P.; Xu, J.; Zhang, Z.; Wang, K.; Li, T.; Wei, Q.; Li, Y. Carbon pathways in aggregates and density fractions in Mollisols under water and straw management: Evidence from 13C natural abundance. Soil Biol. Biochem. 2022, 169, 108684. [Google Scholar] [CrossRef]
  33. Heilongjiang Provincial People’s Government. Heilongjiang Yearbook; Editorial Department: Harbin, China, 2020; pp. 244–245. ISSN 1008-0791.
  34. Li, J.Y.; Wang, X.L.; Wang, Z.B.; Nie, T.Z. Spatial and Temporal Distribution of Soybean Water Demand and Drought in Heilongjiang Province in Recent 50 Years. Trans. Chin. Soc. Agric. Mach. 2020, 51, 223–237. (In Chinese) [Google Scholar]
  35. Hu, H.J.; Wang, M.; Yin, X.G.; Jiang, Y.L.; Wen, X.Y.; Chen, F. Analysis on Temporal and Spatial Variation Characteristics of Soybean Water Demand in Northeast Agricultural Region under Climate Change. Zhongguo Nongye Daxue Xuebao 2017, 22, 21–31. (In Chinese) [Google Scholar]
  36. Accumulated Temperature Zone of Crop Varieties in Heilongjiang Province. Available online: http://www.hljagri.gov.cn/ (accessed on 2 September 2020).
  37. Area Layout Planning of High-Quality and High-yield Main Food Crops in Heilongjiang Province in 2015. Available online: http://dszz.hljagri.gov.cn/tjxxw/jrtj/tzgg/201501/ (accessed on 2 September 2020).
  38. Smith, M. CROPWAT: A Computer Program for Irrigation Planning and Management; FAO: Rome, Italy, 1992. [Google Scholar]
  39. FAO. Crop Evapotranspiration for Computing Crop Water Requirement; FAO Irrigation & Drainage Paper: Rome, Italy, 1998; p. 56. [Google Scholar]
  40. Gocic, M.; Trajkovic, S. Analysis of changes in meteorological variables using Mann-Kendall and Sen’s slope estimator statistical tests in Serbia. Glob. Planet. Change 2013, 100, 172–182. [Google Scholar] [CrossRef]
  41. Bahmani, S.; Bajic, I.V.; HajShirmohammadi, A. Joint Decoding of Unequally Protected JPEG2000 Bitstreams and Reed-Solomon Codes. IEEE Trans. Image Process. 2010, 19, 2693–2704. [Google Scholar] [CrossRef] [PubMed]
  42. Tsakmakis, I.D.; Zoidou, M.; Gikas, G.D.; Sylaios, G.K. Impact of Irrigation Technologies and Strategies on Cotton Water Footprint Using AquaCrop and CROPWAT Models. Environ. Process. 2018, 5, S181–S199. [Google Scholar] [CrossRef]
  43. Dubrau, A.W.; Hendren, L.J. Taming MATLAB. Acm Sigplan Notice 2012, 47, 503–522. [Google Scholar] [CrossRef]
  44. Xiao, Z.L. A comparative study of using MATLAB and SPSS software to solve regression analysis. Shanxi Youth 2016, 18, 58–59. (In Chinese) [Google Scholar]
  45. Farooq, N.; Gheewala, S.H. Assessing the impact of climate change on sugarcane and adaptation actions in Pakistan. Acta Geophys. 2020, 68, 1489–1503. [Google Scholar] [CrossRef]
  46. Li, Y.; Qu, H.J.; Su, W.Y.; Gao, Z.P.; Wu, J.M. Response of Crop Irrigation Water Demand in Typical Area of Huanghuai Plain under HadGEM2-ES Climate Model. Water Resour. Power 2017, 35, 119–122. (In Chinese) [Google Scholar]
  47. Jalota, S.K.; Sood, A.; Chahal, G.B.S.; Choudhury, B.U. Crop water productivity of cotton (Gossypium hirsutum L.)–wheat (Triticum aestivum L.) system as influenced by deficit irrigation, soil texture and precipitation. Agric. Water Manag. 2006, 84, 137–146. [Google Scholar] [CrossRef]
  48. Liu, B.; Zhang, D.; Zhang, H.; Asseng, S.; Yin, T.; Qiu, X.; Ye, Z.; Liu, L.; Tang, L.; Cao, W.; et al. Separating the impacts of heat stress events from rising mean temperatures on winter wheat yield of China. Environ. Res. Lett. 2021, 16, 124035. [Google Scholar] [CrossRef]
  49. Paul, M.; Dangol, S.; Kholodovsky, V.; Sapkota, A.R.; Negahban-Azar, M.; Lansing, S.L. Modeling the Impacts of Climate Change on Crop Yield and Irrigation in the Monocacy River Watershed, USA. Climate 2020, 8, 139. [Google Scholar] [CrossRef]
  50. Durodola, O.S.; Mourad, K.A. Modelling the Impacts of Climate Change on Soybeans Water Use and Yields in Ogun-Ona River Basin, Nigeria. Agriculture 2020, 10, 593. [Google Scholar] [CrossRef]
  51. Soares, D.; Rolim, J.; Fradinho, M.J.; Paço, T.A.D. Climate Change Impacts on Irrigation Requirements of Preserved Forage for Horses under Mediterranean Conditions. Agronomy 2020, 10, 1758. [Google Scholar] [CrossRef]
  52. Luo, X.; Xia, J.; Yang, H. Modeling water requirements of major crops and their responses to climate change in the North China Plain. Environ. Earth Sci. 2015, 74, 3531–3541. [Google Scholar] [CrossRef]
  53. Gao, J.; Yang, X.; Zheng, B.; Liu, Z.; Zhao, J.; Sun, S.; Li, K.; Dong, C. Effects of climate change on the extension of the potential double cropping region and crop water requirements in Northern China. Agric. For. Meteorol. 2019, 268, 146–155. [Google Scholar] [CrossRef]
  54. Mainuddin, M.; Kirby, M.; Chowdhury, R.A.R.; Shah-Newaz, S.M. Spatial and temporal variations of, and the impact of climate change on, the dry season crop irrigation requirements in Bangladesh. Irrig. Sci. 2015, 33, 107–120. [Google Scholar] [CrossRef]
  55. Bouregaa, T. Impact of climate change on yield and water requirement of rainfed crops in the Setif region. Manag. Environ. Qual. Int. J. 2019, 30, 851–863. [Google Scholar] [CrossRef]
  56. Chen, X.; Wang, L.; Niu, Z.; Zhang, M.; Li, C.a.; Li, J. The effects of projected climate change and extreme climate on maize and rice in the Yangtze River Basin, China. Agric. For. Meteorol. 2020, 282, 107867. [Google Scholar] [CrossRef]
  57. Ma, J.Q.; Li, P.F.; Liu, L. Experimental Study on Crop Coefficient of Summer Maize in Henan Province. Water Sav. Irrig. 2016, 4, 24–27. (In Chinese) [Google Scholar]
Figure 1. Study area and distribution of 26 meteorological stations in Heilongjiang Province.
Agriculture 12 01035 g001
Figure 2. Spatial distribution of average minimum temperature (Tmin), maximum temperature (Tmax), relative humidity (RH), and solar radiation (Rad) during soybean growth period under RCP4.5 and RCP8.5 in the study area in the 2030s, 2050s, and 2070s.
Agriculture 12 01035 g002aAgriculture 12 01035 g002b
Figure 3. Climate tendency rates of average minimum temperature (Tmin), maximum temperature (Tmax), relative humidity (RH), and solar radiation (Rad) during soybean growth period under RCP4.5 and RCP8.5 in the study area in 2021–2050, 2051–2080, and 2021–2080.
Agriculture 12 01035 g003aAgriculture 12 01035 g003b
Figure 4. Spatial distribution of reference crop evapotranspiration (ET0) during the (a) 2030s, (b) 2050s, and (c) 2070s under RCP4.5, and during the (d) 2030s, (e) 2050s, and (f) 2070s under RCP8.5 during the soybean growth period.
Agriculture 12 01035 g004
Figure 5. Climate tendency rates of ET0 in the periods (a) 2021–2050, (b) 2051–2080, and (c) 2021–2080 under RCP4.5, and in the periods (d) 2021–2050, (e) 2051–2080, and (f) 2021–2080 under RCP8.5 during the soybean growth period.
Agriculture 12 01035 g005aAgriculture 12 01035 g005b
Figure 6. Spatial distribution of crop water requirement (ETc) during the (a) 2030s, (b) 2050s, and (c) 2070s under RCP4.5, and during the (d) 2030s, (e) 2050s, and (f) 2070s under RCP8.5 during the soybean growth period.
Agriculture 12 01035 g006
Figure 7. Climate tendency rates of ETc in the periods (a) 2021–2050, (b) 2051–2080, and (c) 2021–2080 under RCP4.5, and in the periods (d) 2021–2050, (e) 2051–2080, and (f) 2021–2080 under RCP8.5 during the soybean growth period.
Agriculture 12 01035 g007
Figure 8. Spatial distribution of effective precipitation (Pe) during the (a) 2030s, (b) 2050s, and (c) 2070s under RCP4.5, and during the (d) 2030s, (e) 2050s, and (f) 2070s under RCP8.5 during the soybean growth period.
Agriculture 12 01035 g008aAgriculture 12 01035 g008b
Figure 9. Climate tendency rates of Pe in the periods (a) 2021–2050, (b) 2051–2080, and (c) 2021–2080 under RCP4.5, and in the periods (d) 2021–2050, (e) 2051–2080, and (f) 2021–2080 under RCP8.5 during the soybean growth period.
Agriculture 12 01035 g009
Figure 10. Spatial distribution of CD during the (a) 2030s, (b) 2050s, and (c) 2070s under RCP4.5, and during the (d) 2030s, (e) 2050s, and (f) 2070s under RCP8.5 during the soybean growth period.
Agriculture 12 01035 g010
Figure 11. Climate tendency rates of CD in the periods (a) 2021–2050, (b) 2051–2080, and (c) 2021–2080 under RCP4.5, and in the periods (d) 2021–2050, (e) 2051–2080, and (f) 2021–2080 under RCP8.5 during the soybean growth period.
Agriculture 12 01035 g011
Figure 12. Spatial distribution of irrigation water requirement (Ir) during the (a) 2030s, (b) 2050s, and (c) 2070s under RCP4.5, and during the (d) 2030s, (e) 2050s, and (f) 2070s under RCP8.5 during the soybean growth period.
Agriculture 12 01035 g012
Figure 13. Climate tendency rates of Ir in the periods (a) 2021–2050, (b) 2051–2080, and (c) 2021–2080 under RCP4.5, and in the periods (d) 2021–2050, (e) 2051–2080, and (f) 2021–2080 under RCP8.5 during the soybean growth period.
Agriculture 12 01035 g013aAgriculture 12 01035 g013b
Figure 14. Effects of changes in meteorological factors on soybean ETc and the relationships among Pe, ETc, and Ir under RCP4.5 and RCP8.5 for 2021–2080. Bars marked with different lowercase letters indicate significant differences between groups (p < 0.05), while those marked with the same lowercase letters indicate insignificant differences between groups (p > 0.05).
Agriculture 12 01035 g014
Table 1. Average soybean growth period data in 1994–2005.
Agrometeorological
Station
Lini (Days)Ldev (Days)Lmid (Days)LLate (Days)Total Growth Day (Days)Meteorological
Station
Qinggang24315916130Anda,
Suihua
Hulin27306017134Hulin
Boli35241616125Jixi,
Mudanjiang,
Suifenhe
Bayan29246223138Tonghe,
Shangzhi
Heihe32255917133Heihe,
Sunwu
Harbin34326717150Haerbin
Nenjiang29276017133Nenjiang
Longjiang20276322132Qiqihar,
Tailai
Huma33185717125Huma
Qingan28216328140Tieli
Tangyuan27286516136Yinlan
Beian28266515134Keshan,
Beian
Baiquan27275523132Mingshui
Jiayin30245716127Yichun
Hailun28296319139Hailun
Jiamusi28326217139Jiamusi
Fuyu32325714135Fuyu
Baoqing22286019129Baoqing
Fujin29256021135Fujin
Table 2. Correlation analysis among ET0, ETc, Pe, Ir, and meteorological factors during the soybean growth period.
ItemsScenariosPeriodsTminTmaxRHRad
ET0RCP4.52030s−0.176−0.522 *−0.769 **0.790 **
2050s0.0870.779 **−0.727 **0.892 **
2070s0.0570.926 **−0.863 **0.912 **
2030s–2070s0.898 **0.982 **−0.831 **0.908 **
RCP8.52030s−0.0590.405−0.450 *0.508 *
2050s−0.3860.852 **−0.924 **0.963 **
2070s−0.473 *0.854 **−0.885 **0.929 **
2030s–2070s0.971 **0.991 **−0.2260.697 **
ETcRCP4.52030s−0.2910.548 *−0.826 **0.849 **
2050s−0.0890.598 **−0.780 **0.892 **
2070s−0.0910.790 **−0.798 *0.823 **
2030s–2070s0.855 **0.960 **−0.873 **0.939 **
RCP8.52030s−0.2140.298−0.595 **0.649 **
2050s−0.3950.739 **−0.820 **0.884 **
2070s−0.489 *0.726 **−0.841 **0.890 **
2030s–2070s0.962 **0.984 **−0.851 **0.716 **
PeRCP4.52030s−0.240−0.3380.140−0.114
2050s0.3900.025−0.487−0.436
2070s−0.149−0.2230.255−0.208
2030s–2070s0.167−0.0210.387 **−0.306 *
RCP8.52030s0.2060.0810.136−0.142
2050s0.099−0.3440.375−0.339
2070s0.482 *−0.001−0.248−0.306
2030s–2070s0.810 **−0.793 **−0.110−0.324 *
IrRCP4.52030s0.1520.287−0.1840.167
2050s−0.2830.291−0.698 **0.693 **
2070s−0.0160.381−0.4340.419
2030s–2070s0.409 **0.590 **−0.841 **0.824 **
RCP8.52030s−0.232−0.078−0.2090.209
2050s−0.2310.434−0.547 *0.550 *
2070s−0.531 *0.268−0.489 *0.582 **
2030s–2070s−0.1400.094−0.400 **0.283 *
Note: * significant correlation at the 0.05 level; ** significant correlation at the 0.01 level.
Publisher’s Note: MDPI stays neutral with regard to jurisdictional claims in published maps and institutional affiliations.

