Article

Finite Element Model Construction and Cutting Parameter Calibration of Wild Chrysanthemum Stem

College of Mechanical and Electronic Engineering, Northwest A&F University, Xianyang 712100, China
*
Author to whom correspondence should be addressed.
Agriculture 2022, 12(6), 894; https://doi.org/10.3390/agriculture12060894
Submission received: 1 June 2022 / Revised: 17 June 2022 / Accepted: 19 June 2022 / Published: 20 June 2022
(This article belongs to the Special Issue Advances in Agricultural Engineering Technologies and Application)

Abstract

:
Due to a lack of an accurate model in finite element simulation of mechanized harvesting of wild chrysanthemum, the stem of wild chrysanthemum in the harvesting period is taken as the research object. ANSYS Workbench 19.0 software and LS-DYNA software (LS-PrePOST-4.3-X64) are used to calibrate the finite element simulation model of wild chrysanthemum stem cutting. The stem diameter distribution at the cutting height of the chrysanthemum is obtained. The maximum shear forces at different diameters (7 mm, 8 mm, 9 mm, 10 mm, and 11 mm) within the cutting range are determined as 120.0 N, 159.2 N, 213.8 N, 300.0 N, and 378.2 N, respectively, by using a biomechanical testing machine and a custom-made shear blade. The Plastic_Kinematic failure model is used to simulate the cutting process by the finite element method. The Plackett–Burman test is employed to screen out the test factors that significantly affect the results, namely, the yield stress, failure strain, and strain rate parameter C. The regression model between the shear force and significant parameters is obtained by central composite design experiments. To obtain the model parameters, the measured values are substituted into the regression equation as the simulation target values. In other words, the yield stress is 17.96 MPa, the strain rate parameter C is 87.27, and the failure strain is 0.0387. The maximum shear force simulation test is carried out with the determined parameters. The results showed that the maximum error between the simulated and the actual value of the maximum shear force of wild chrysanthemum stems with different diameters is 7.8%. This indicates that the calibrated parameters of the relevant stem failure model can be used in the finite element method simulation and provide a basis for subsequent simulations.

1. Introduction

Wild chrysanthemum is a common Chinese herbal medicine characterized by antibacterial and inflammatory effects that can be used to treat diseases such as influenza, cerebrospinal meningitis, and snake bite [1,2]. Its stem characteristics are characterized by a high degree of lignification and hardness. Most of the wild chrysanthemum harvest is artificial. Approximately 15–20 people are required per day per acre to harvest wild chrysanthemum, but the harvest cost is relatively high and rises every year. The mechanized harvest of wild chrysanthemum is in its initial stage. The main attempt is to harvest in sections. The existing windrowers (such as the rape windrower) are used for harvesting, but the efficiency is not high. About a third of the thick stems are difficult to cut. The finite element simulation method has been used in mechanical optimization in recent years [3]. The finite element method has the outstanding advantages of high efficiency, low costs, and shortening the research and the development cycles [4].
A series of finite element simulation cutting studies were carried out to explore the cutting performance of crops in agriculture. In the 1970s, Tay first used the finite element method to calculate orthogonal cutting tools [5]. In 2004, Yen et al. [6] analyzed the relationship between the cutting-edge shape and the cutting force during cutting via the finite element method. Meng et al. [7] used large CAE software ANSYS/LS-DYNA to perform dynamic simulation on small mulberry tree cutting circular saw blades. The results showed that, under the optimal parameter matching, the cutting section of the mulberry branch performed well, and the working efficiency was relatively high. Souza et al. [8] used finite element software to explore the influence of the harvester speed on the harvesting process in mechanized coffee harvesting. Yang et al. [9] established a sugarcane cutting system model based on the FEM (finite element method) and SPH (smoothed particle hydrodynamics) coupling algorithm. Moreover, the authors verified the rationality of the model with physical tests. The finite element simulation method was used to study the force on the sugarcane root, which is of great significance for reducing the cutting resistance. Fielke [10] predicted the influence of cutting edges with different geometric shapes on tillage force via FEM. Ibrahmi et al. [11] studied the influence of the cutting depth, cutting speed, and cutting angle on the tillage force of a template plow used in North Africa. The results showed that vertical force decreased linearly with an increase in the cutting angle. When the working depth was 150 mm, the speed was 1 m/s, the lifting angle was 20°, the cutting angle was 30° to 45°, and the energy consumption was minimized. In China, the use of finite element cutting started relatively late. Zhang et al. [12] used ANSYS/LS-DYNA software to establish the geometric and material models of the cutting device in sugarcane cutting machinery. Two unknown tensors of sugarcane were experimentally and numerically determined, namely, the radial elastic modulus of sugarcane Ex = Ey = 1934 MPa and the radial Poisson’s ratio of sugarcane Uxz = Uyz = 0.314. Guo et al. [13] obtained stress and energy changes in cutting tomato vine straw using LS-DYNA software. Xi et al. [14] conducted a display dynamics analysis on the process of cutting the stem with a rotor milling cutter. The results showed that the power consumption of the cutting stem was minimized when the rotor milling cutter speed was 1400 r/min, the blade thickness was 7 mm, and the blade angle was 25°. Huang et al. [15] used finite element technology to investigate the effect of the cutter angle and cutting speed on the cutting force and improve the performance of the sugarcane cutter. The results showed that the cutting force was minimized when the cutter angle was 0° and the cutter speed was 0.5–0.9 m/s.
Few simulation studies currently exist on the cutting of wild chrysanthemum stem. Furthermore, the simulation process lacks more accurate wild chrysanthemum stem material model parameters. Based on the maximum shear force, physical tests were employed to determine different diameters of wild chrysanthemum flower stalks. On this basis, the Plackett–Burman test and a central composite design experiment were carried out by using finite element simulation to calibrate the stem material parameters. Different diameters of wild chrysanthemum stem test values were compared with the simulation results to validate the accuracy of the calibration parameters. The proposed model will provide a reference for selecting finite element cutting material parameters of wild chrysanthemum stem.

2. Materials and Methods
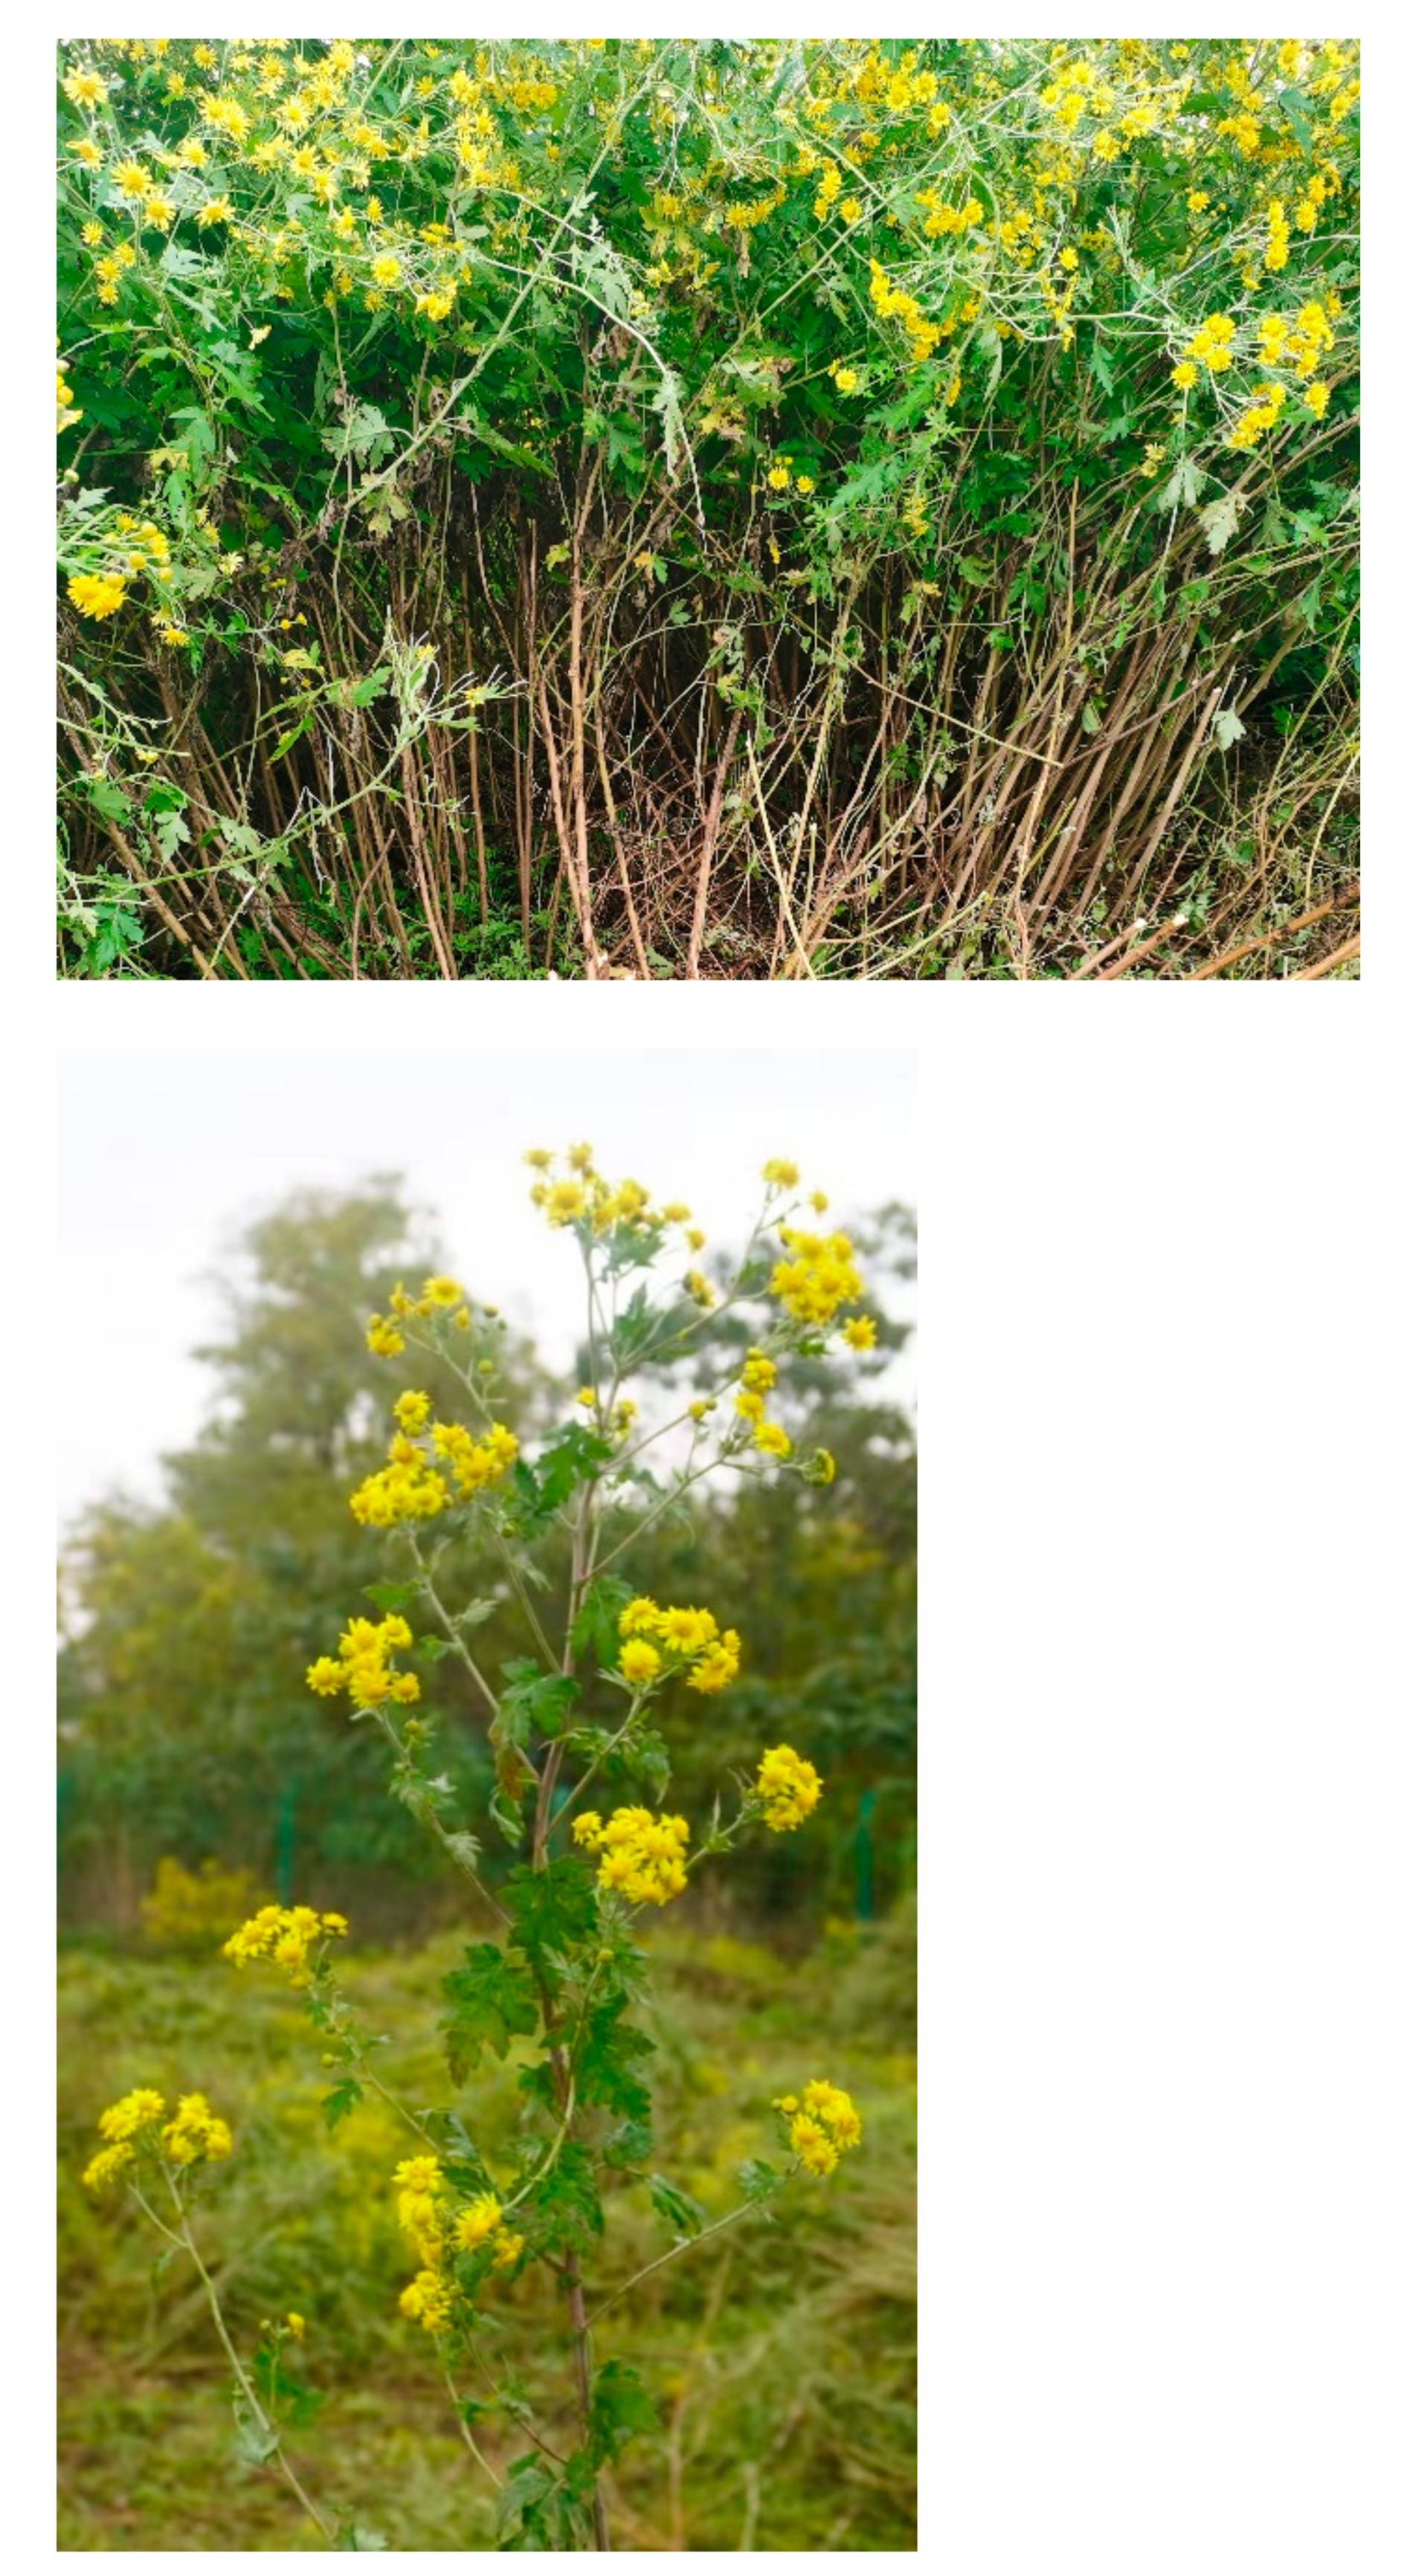
2.1. Materials

Wild chrysanthemum stems from the biennial wild chrysanthemum cultivation base in Qianxian county, Shaanxi (jointly cultivated by China Resources Sanjiu Medical & Pharmaceutical Co., Ltd. (Shenzhen, China), and Shaanxi Qintuonong Agricultural Technology Development Co., Ltd. (Xi’an, China)) were selected for the experiment. As shown in Figure 1, the row spacing was 60 cm and the plant spacing was 50 cm. The average moisture content was 48.98%. The test materials were randomly selected on 6 November 2021. Fresh plants with good growth and no disease and insect pests were selected, and mechanical damage to the stem was avoided as best as possible. The chrysanthemum stems were cut horizontally with respect to the ground.

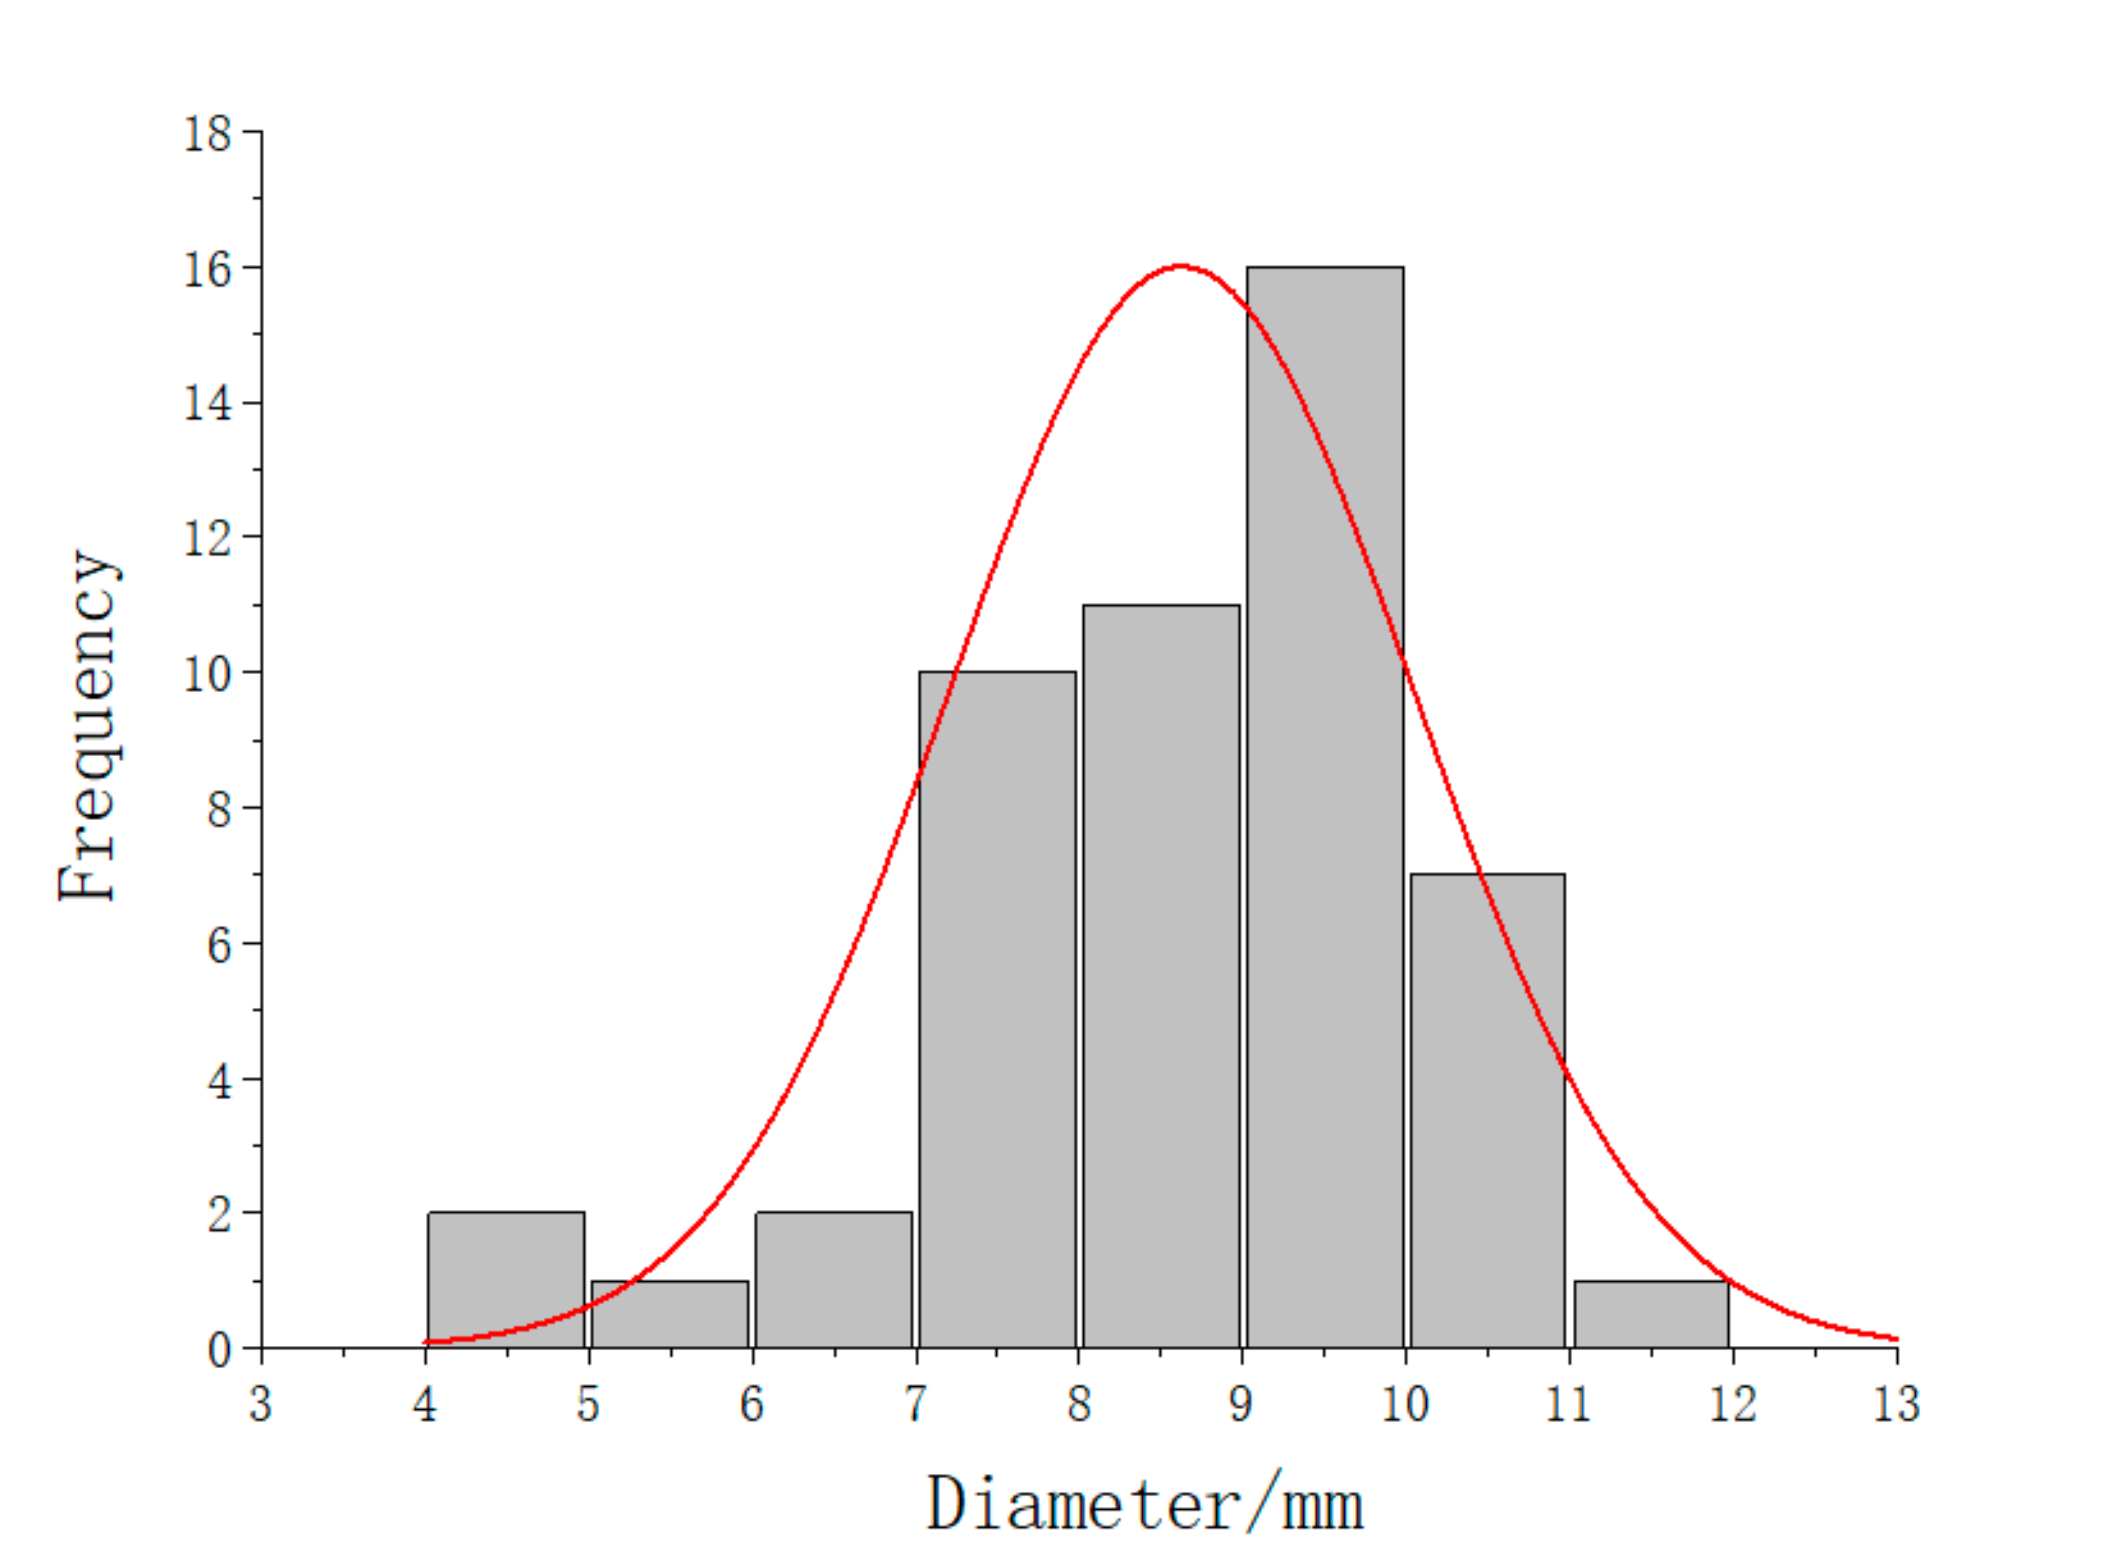
2.2. Wild Chrysanthemum Stem Diameter Distribution

Fifty wild chrysanthemum stems were randomly selected, and the diameter of each wild chrysanthemum stem at a height of 20 cm was measured with an electronic vernier caliper (Mitutoyo Co., Ltd., Kanagawa, Japan) with a precision of 0.01 mm (according to the wild chrysanthemum base measurement, the stubble height of wild chrysanthemum stem was roughly 20 cm). The stem of each wild chrysanthemum was measured three times and averaged. The fitting curve of the normal distribution of the obtained size is shown in Figure 2. The diameter of wild chrysanthemum stems mostly varied between 7 mm and 11 mm at the stubble height.

2.3. Shear Tests

The test samples were collected from the same base mentioned above. Wild chrysanthemum stems of 7–11 mm were divided into five grades to determine the cutting effect of wild chrysanthemum stems with different diameters. Six groups of experiments were conducted for each grade of stems, and a total of 30 wild chrysanthemum stem samples were made. A total of 25 mm lengths were taken upward and downward by taking the position of the stem at 20 cm as the midpoint, and the final length of each sample was 50 mm.
The main instrument used in this test is the experimental biomechanics machine (DDL10) with a custom-made blade, as shown in Figure 3. The blade is made of steel, and its size is shown in Table 1. The material parameters are shown in Table 2. The shear process that utilizes a biomechanical testing machine is shown in Figure 4. The distance between the two supports is 20 mm, the cutting speed is 100 mm/min, and the starting preload is less than 5 N.

2.4. Finite Element Model

According to the material and structural characteristics of wild chrysanthemum stem, the cuticle and lumen of the stem are defined as anisotropic, non-uniform, and non-linear viscoelastic materials, as shown in Figure 5. Compared with the cuticle, the lumen part of stem had a minor effect on cutting. The stem was regarded as a hollow cylinder, and its material model was defined as an isotropic elastic–plastic material model to facilitate modeling. After measurement, the average ratio of the inner to the outer diameter of the wild chrysanthemum stem was 0.41.

2.4.1. Selection of Stem Material Model in the LS-DYNA Software

LS-DYNA software is a display solution software that can solve the dynamic problem of highly nonlinear structure and effectively perform finite element analysis of the cutting process. In essence, the numerical analysis of the stem cutting process is the failure of the unit material defined after large deformation, or stress overload of the stem unit, i.e., stem cutting can be visually represented. The wild chrysanthemum stem was regarded as a whole, and its material model was defined as Plastic_Kinematic, i.e., an isotropic elastoplastic material model. The equivalent fracture strain defined by the model can be expressed as [16,17]:
σ y = 1 + ε 1 C P σ o + β E p ε p f ,
where ε 1 is the strain rate, C and P are strain rate parameters, E p is the plastic hardening modulus, and ε p f is the effective plastic strain.

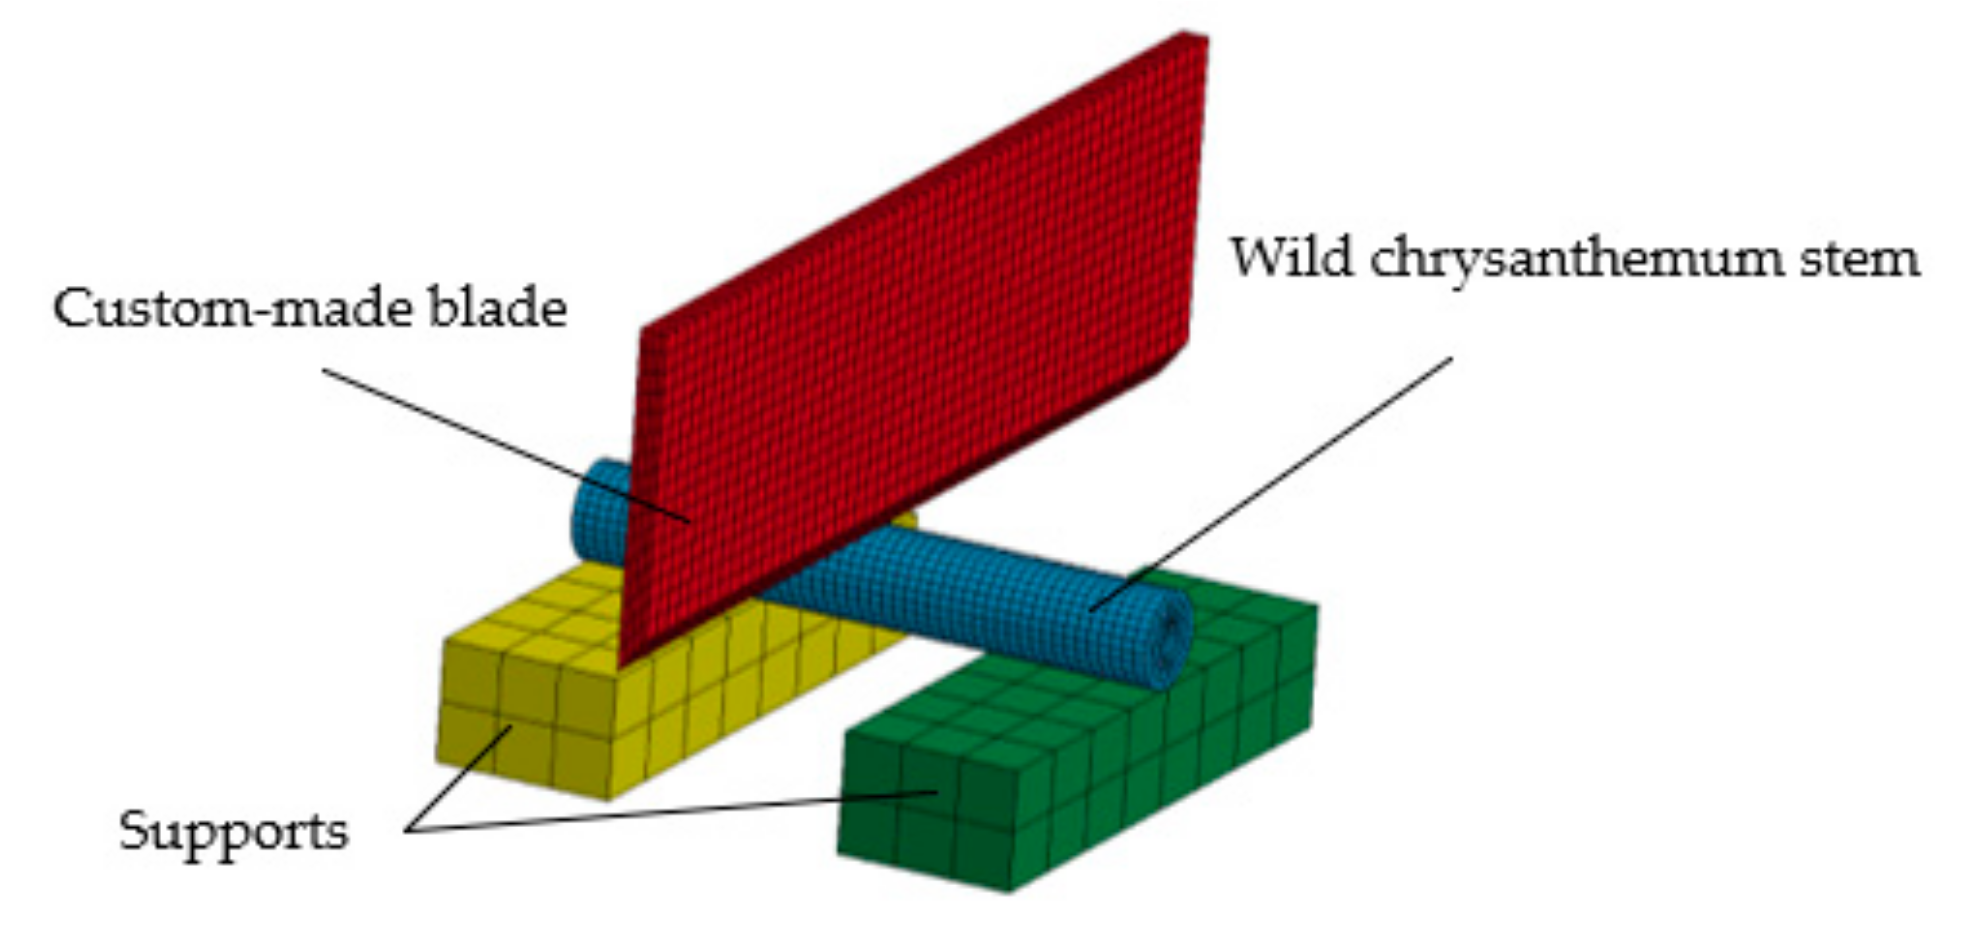
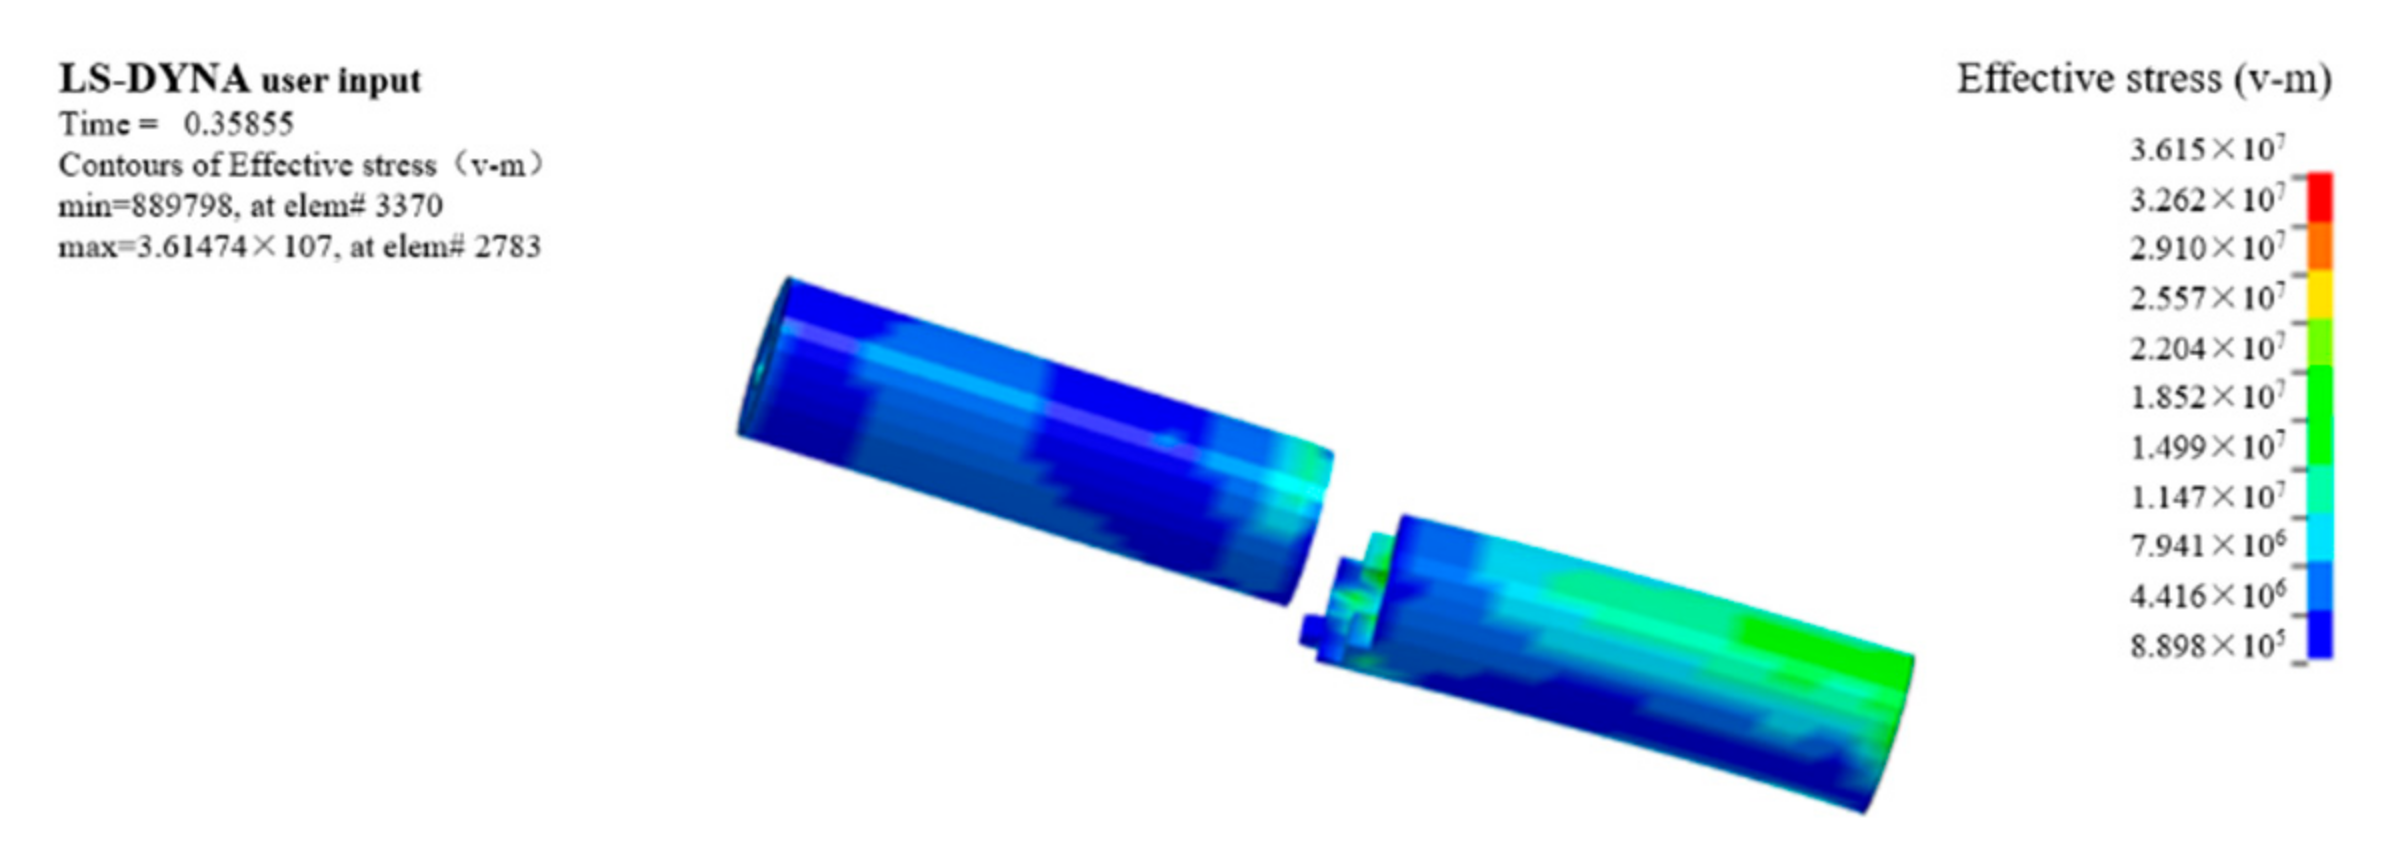
2.4.2. Modeling in Ansys Workbench and LS-DYNA Software

SOLIDWORKS 2018 software was used to establish a 3D model of a wild chrysanthemum cutting with a diameter of 8 mm. Then, the model was imported into the Explicit Dynamic (LS-DYNA Export) module in Ansys Workbench 19.0. The stem, the blade, and the supports were divided into grids. The grid size of the stem was set as 1 mm, and the final number of grids was 7624. The overall model is shown in Figure 6.
The following constraints were added to the model. The displacement of the blade model was constrained in the X- and Y-directions, whereas the rotation was constrained in the X-, Y-, and Z-directions. Displacement and rotation of the support base model were constrained in the X-, Y-, and Z-directions, but the stem model was not constrained. The blade speed loading direction was defined as the Z-direction, the constant loading speed was 100 mm/min, and the simulation time was set to 0.5 s. Other parameters were set in LS-DYNA post-processing software LS-PrePOST-4.3-X64. The material parameters were set as shown in Table 3, and the contact parameters [13,16] were set as shown in Table 4.
The stem and blade models should not come in contact when defining the contact mode. However, the distance between them should be as close as possible to reduce the calculation free time before shearing. Simulation fracture is shown in Figure 7.

2.5. Parameter Calibration Experimental Design

2.5.1. Plackett–Burman Experimental Design

The Plackett–Burman experiment was designed using Design-Expert (version 11.0.4.x64) software to screen the parameters that significantly affect the maximum shear force. The Plackett–Burman test was carried out on the density, elastic modulus, Poisson’s ratio, yield stress, shear modulus, hardening parameter, strain rate parameter C, strain rate parameter P, and failure strain as experimental factors. The research on mechanical and physical characteristics of wild chrysanthemum stem is not perfect, especially regarding the parameters of the finite element model. In this paper, parameter values of various stems in the literature were employed to determine the value or range of each parameter in the test [16]. Test parameters are shown in Table 5.

2.5.2. Central Composite Experimental Design

The central composite design experiments were carried out for the selected significance parameters. The middle value of the high and low level of non-significant factors was selected. The stem model of wild chrysanthemum was established to carry out simulation analysis of the maximum shear force, thus obtaining the regression model between the maximum shear force and significance parameters. The shear force value of the chrysanthemum stem was substituted into the regression equation as the simulation target to obtain the simulation model parameters.

3. Results and Discussion

3.1. Plackett–Burman Test

The test design and results are shown in Table 6. Design-Expert software was used for significance analysis and variance analysis of the data, and the results are shown in Table 7.
According to Table 7, X4 and X9 extremely significantly affected the maximum shear force of the stem (p < 0.01). X7 significantly affected the maximum shear force of the stem (p < 0.05), whereas the remaining parameters did not significantly affect the maximum shear force (p > 0.05). Therefore, yield stress (X4), failure strain (X9), and strain rate parameter C (X7) were selected as three key factors for the response surface optimization and design.

3.2. Central Composite Design Experiment

In the central composite test, all non-significant test parameters were adopted with high and low intermediate values, and the remaining significant factors were selected according to the test. The test factor coding is shown in Table 8, and the central composite experiment design and the simulation results are shown in Table 9. Multiple regression fitting was conducted on the data in Table 9, thus obtaining the wild chrysanthemum flower regression equation of the maximum shear force:
Y = 120.42 + 31.82X4 + 11.20X9 + 4.22X7 − 4.75X4X9 − 3.25X4X7 − 1.75X9X7 + 1.29X42 − 0.8292X92 − 2.88X72.
According to variance analysis (Table 10), the overall model fitting degree was extremely significant (p < 0.0001). X4, X9, and X7 extremely significantly affected the maximum shear force, whereas X4, X9, and X72 significantly affected the maximum shear force. X4, X7, X9X7, X42, and X92 had no significant effect on the maximum shear force, indicating that the influence of the test factors on the overall response value had a higher-power relationship. The p-value of the lack of fit was 0.3189, indicating that no other major factors affected this index. The determination coefficient R2 was equal to 0.99, indicating that the regression model agreed with the actual results and may be used to predict the maximum shear force of the stem.
The maximum shear force of experimentally measured wild chrysanthemum stem with a diameter of 8 mm was taken as the target value in the optimization module of the Design-Expert software. The optimization was carried out to seek the optimal solution for the regression model. The objectives and constraints equations can be expressed as:
Y X 4 , X 9 , X 7 = 159.2 s . t . 10 X 4 20 0.01 X 9 0.05 80 X 7 100 .
The calibration parameter results are shown in Table 11.

3.3. Validation Tests

In order to ensure the feasibility, accuracy, and universal applicability of the calibrated model parameters, stem cutting models with diameters of 7 mm, 9 mm, 10 mm, and 11 mm were established for verification. The models were set according to the calibrated parameters (Table 12), whereas the remaining setting conditions remained unchanged. The finite element model was established and the actual test results were compared.
The maximum shear force of wild chrysanthemum stem measured by physical tests and the one obtained by the simulation are shown in Table 13.
The maximum shear force error between the simulation and the actual test was less than 7.8%. Moreover, the maximum shear force had a good linear relationship with the stem diameter, indicating that the parameter calibration method was correct and the established finite element model was accurate.
The influence of physical parameters on the maximum shear force was not completely consistent for different crop stems. The yield stress significantly affected the maximum shear force of the wild chrysanthemum stem, which is consistent with Jiang’s [16] research on the rape stem. The remaining two significant factors were different, which might have been caused by the complex internal structure of different stems. Zheng et al. [18] constructed a finite element model of cotton rod and calibrated the cutting parameters. Contrary to the method proposed in this paper, the author regarded the cotton stalk as an anisotropic material. Through a series of physical tests, the author measured nine parameters that could represent the mechanical properties of an anisotropic material and complete the calibration. In this paper, the stem of wild chrysanthemum was regarded as an isotropic material. Plackett–Burman tests and a central composite design experiment were used to calibrate the stem parameters, and the physical cutting test was used to verify the calibration accuracy. Liao et al. [19,20] used discrete elements to calibrate stem parameters for the rape stalk shredding problem and obtained significant factors for the angle of repose. The difference occurred due to various types of problems and measurement indexes.

4. Conclusions

(1) According to the preliminary investigation, the cutting height of wild chrysanthemum stem was approximately equal to 20 cm. The diameter of the cutting height of the wild chrysanthemum stem was experimentally measured, and the diameter of the stem was mostly distributed between 7 mm and 11 mm within the cutting range.
(2) Through the Plackett–Burman test, the yield stress, failure strain, and strain rate parameter C, all of which significantly affected the results, were selected. The central composite design experiment was carried out by the finite element method to investigate the effects of yield stress, failure strain, and strain rate parameter C on the maximum shear force of the stem. Moreover, the regression model between the shear force and significance parameters was obtained. The measured values were substituted into the regression equation as simulation target values to obtain the following simulation model parameters: yield stress 17.96 Mpa, failure strain 0.0387, and strain rate parameter C 87.27.
(3) The calibration parameters were used to establish simulation models of stem cutting with different diameters. The highest error between the simulation and actual tests was 7.8%. In addition, the maximum shear force had a good linear relationship with stem diameter, indicating that the calibration parameters were accurate and reliable and that the established finite element model was correct and feasible.
In this paper, the physical shear test was used as a comparison to calibrate the failure model parameters of the stem of wild chrysanthemum, which filled the blank of finite element cutting model parameters of wild chrysanthemum stem.

Author Contributions

Conceptualization, T.W.; methodology, G.M.; software, S.L.; validation, S.Z. (Shilin Zhang); formal analysis, X.W. (Xun Wang); investigation, K.C.; resources, S.Z. (Shuo Zhang) and X.W. (Xiaopeng Wu); data curation, T.W.; writing—original draft preparation, T.W.; writing—review and editing, Z.L.; visualization, T.W.; supervision, X.Y.; project administration, Z.L.; funding acquisition, Z.L. All authors have read and agreed to the published version of the manuscript.

Funding

This research was funded by the National Natural Science Foundation of China youth Science Foundation project (No. 32101629), the Key Research and Development Program of Shaanxi Province, China (No. 2022NY-227), and the China Postdoctoral Science Foundation project (No. 2021M692657).

Institutional Review Board Statement

Not applicable.

Informed Consent Statement

Not applicable

Data Availability Statement

Not applicable.

Conflicts of Interest

The authors declare no conflict of interest.

References

  1. Li, G.; Chen, Y.; Wang, P.; Guan, R.; Ye, Y.; Zhao, J.; You, A.; Bi, Y. Protection of terpenes and flavonoids from Chrysanthemi Indici Flos on immunological liver injury. Chin. Tradit. Herb. Drugs 2013, 44, 3510–3514. [Google Scholar]
  2. Jiang, Z.; Li, X.; Luo, B. Anti-inflammatory and Analgesic Effects of Essential Oil from Chrysanthemi Indici Flos. Chin. J. Exp. Tradit. Med. Formulae 2015, 21, 124–127. [Google Scholar]
  3. Peng, W. The application of virtual reality technology in mechanical engineering. Sci. Technol. Innov. Her. 2015, 12, 39. [Google Scholar]
  4. Wu, Y.; Xie, W. Analysis of the development status and application direction of virtual design. Analysis of the development status and application direction of virtual design. Pop. Sci. Technol. 2010, 12, 18–19. [Google Scholar]
  5. Tay, A.O.; Stevenson, M.G.; De Vahl Davis, G.; Oxley, P.L.B. A numerical method for calculating temperature distributions in machining, from force and shear angle measurements. Int. J. Mach. Tool Des. Res. 1976, 16, 335–349. [Google Scholar] [CrossRef]
  6. Yen, Y.; Jain, A.; Altan, T. A finite element analysis of orthogonal machining using different tool edge geometries. J. Mater. Processing Technol. 2004, 146, 72–78. [Google Scholar] [CrossRef]
  7. Meng, Y.; Wei, J.; Wei, J.; Chen, H.; Cui, Y. An ANSYS/LS-DYNA simulation and experimental study of circular saw blade cutting system of mulberry cutting machine. Comput. Electron. Agric. 2019, 157, 38–48. [Google Scholar] [CrossRef]
  8. Souza, V.H.S.; Dias, G.L.; Santos, A.A.R.; Costa, A.L.G.; Santos, F.L.; Magalhães, R.R. Evaluation of the interaction between a harvester rod and a coffee branch based on finite element analysis. Comput. Electron. Agric. 2018, 150, 476–483. [Google Scholar] [CrossRef]
  9. Yang, W.; Zhao, W.; Liu, Y.; Chen, Y.; Yang, J. Simulation of forces acting on the cutter blade surfaces and root system of sugarcane using FEM and SPH coupled method. Comput. Electron. Agric. 2021, 180, 105893. [Google Scholar] [CrossRef]
  10. Fielke, J.M. Finite Element Modelling of the Interaction of the Cutting Edge of Tillage Implements with Soil. J. Agric. Eng. Res. 1999, 74, 91–101. [Google Scholar] [CrossRef]
  11. Ibrahmi, A.; Bentaher, H.; Hbaieb, M.; Maalej, A.; Mouazen, A.M. Study the effect of tool geometry and operational conditions on mouldboard plough forces and energy requirement: Part 1. Finite element simulation. Comput. Electron. Agric. 2015, 117, 258–267. [Google Scholar] [CrossRef]
  12. Zhang, Z.; Liang, S.; Lv, H.; Dai, X. Finite Element Analysis for Flexspline of Veer Machine in the Agricultural Manipulator by Using Harmonic Gearing. J. Agric. Mech. Res. 2010, 32, 64–67, 77. [Google Scholar]
  13. Guo, Q.; Zhang, X.; Xu, Y.; Li, P.; Chen, C. Mechanism and simulation analysis of efficient cutting for tomato straw. J. Agric. Mech. Res. 2017, 39, 11–24. [Google Scholar]
  14. Diao, P.; Yuan, C.; Zhang, D.; Lu, L.; Li, P. Experiment of the Rotor Cutter Chop Stalk on ANSYS/LS-DYNA. J. Agric. Mech. Res. 2011, 33, 57, 116–119. [Google Scholar]
  15. Huang, H.; Wang, Y.; Tang, Y.; Zhao, F.; Kong, X. Finite element simulation of sugarcane cutting. Trans. Chin. Soc. Agric. Eng. 2011, 27, 161–166. [Google Scholar]
  16. Jiang, Y. Design and Test of Key Equipments for Fodder Rapeseed Harvester. Ph.D. Thesis, Huazhong Agricultural University, Wuhan, China, 2019. [Google Scholar]
  17. Liu, P.; Shi, K.; Huang, H. 3D-numerical Simulation Acceleration of Projectile Penetrating Steel Target. J. Detect. Control 2006, 28, 25–28. [Google Scholar]
  18. Zheng, C.; Zhao, J.; Zhang, J.; Zhang, R.; Li, F. Construction of Finite Element Model of Cotton Pole and Calibration of Cutting Parameters. J. Agric. Mech. Res. 2021, 43, 198–203. [Google Scholar]
  19. Liao, Y.; Wang, Z.; Liao, Q.; Wan, X.; Zhou, Y.; Liang, F. Calibration of Discrete Element Model Parameters of Forage Rape Stalk at Early Pod Stage. Trans. Chin. Soc. Agric. Mach. 2020, 51, 236–243. [Google Scholar]
  20. Liao, Y.; Liao, Q.; Zhou, Y.; Wang, Z.; Jiang, Y.; Liang, F. Parameters Calibration of Discrete Element Model of Fodder Rape Crop Harvest in Bolting Stage. Trans. Chin. Soc. Agric. Mach. 2020, 51, 73–82. [Google Scholar]
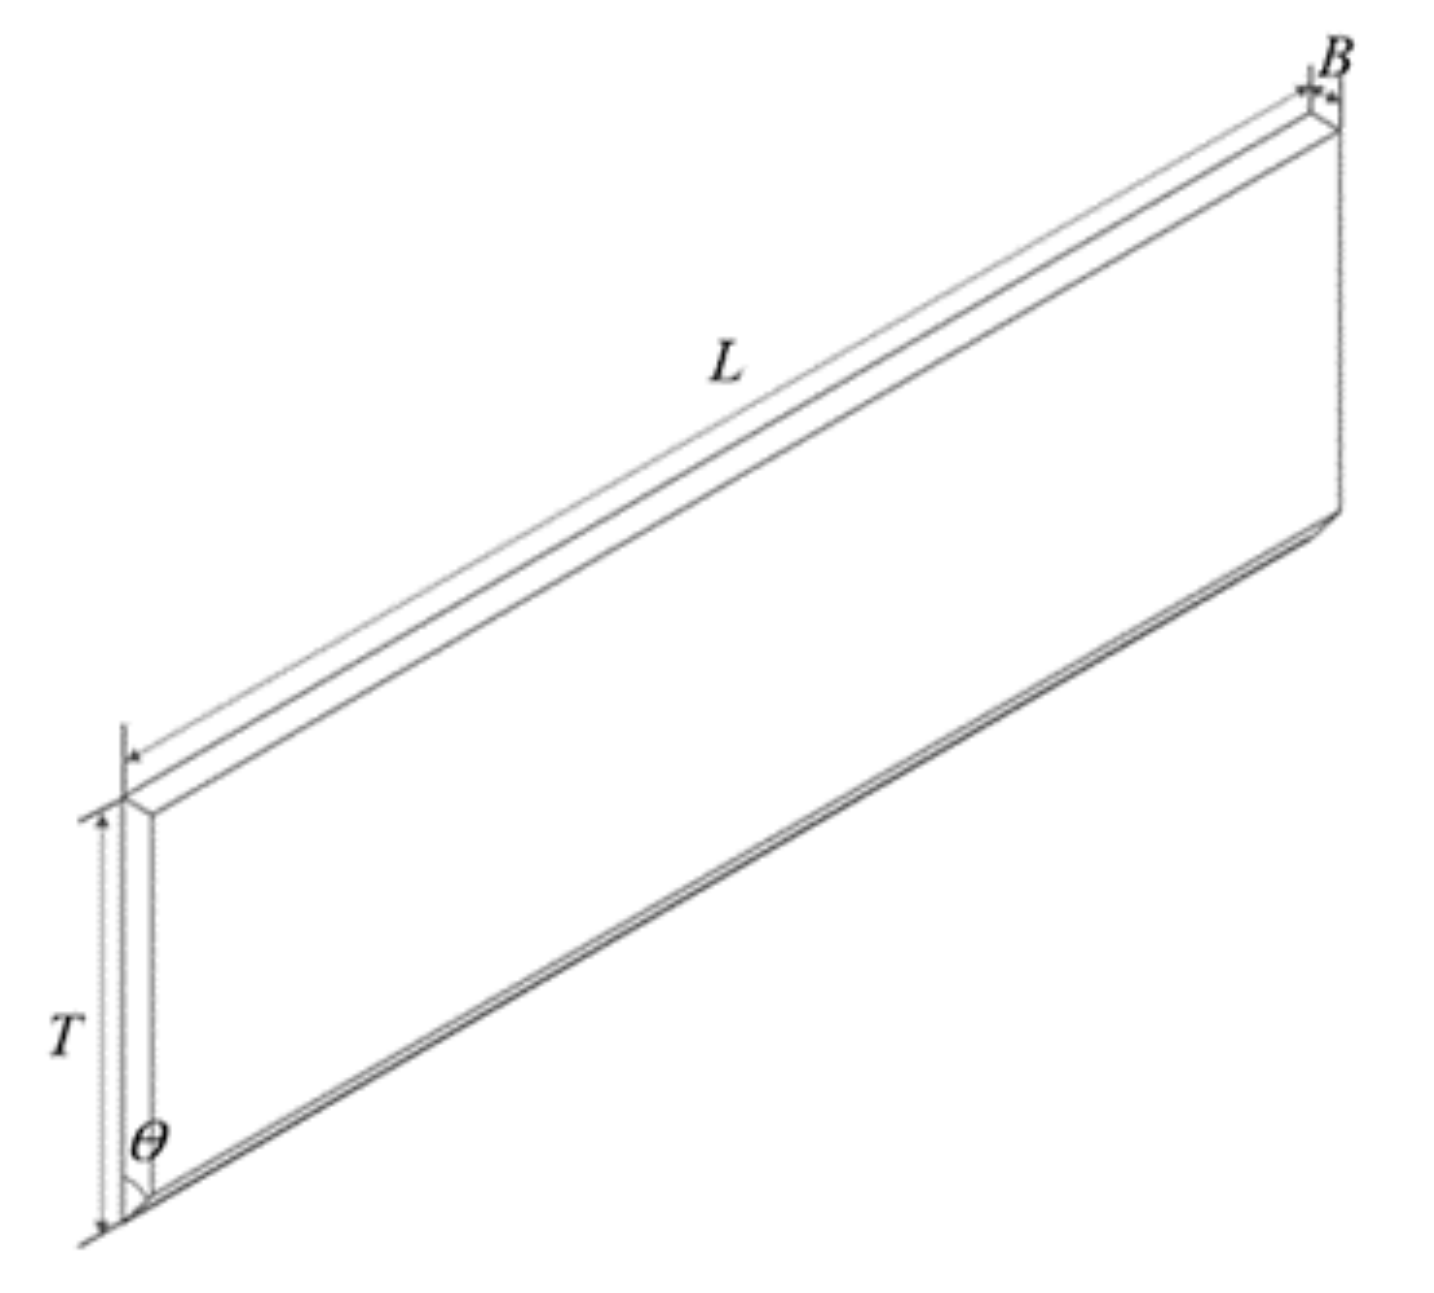
Figure 1. Wild chrysanthemum stem planting diagram.
Agriculture 12 00894 g001
Figure 2. Normal distribution of wild chrysanthemum stem diameter.
Agriculture 12 00894 g002
Figure 3. Custom-made cutting blade, where L is the length, T is width, B is the thickness, and ϴ is the edge angle.
Agriculture 12 00894 g003
Figure 4. Shear test site.
Agriculture 12 00894 g004
Figure 5. Structure of wild chrysanthemum stem.
Agriculture 12 00894 g005
Figure 6. Finite element cutting model.
Agriculture 12 00894 g006
Figure 7. Simulated fracture diagram.
Agriculture 12 00894 g007
Table 1. Custom-made blade size.
Physical CharacteristicsUnitsSize
Lmm90
Tmm28
Bmm2.3
ϴ°37.5
Table 2. Custom-made blade materials [16].
ParametersUnitsNumerical Value
Densitykg/m37800
Elasticity modulusGPa207
Poisson’s ratio10.3
Table 3. Material parameters.
PartMaterialsParameters
Blade and baseMAT_RIGIDSee Table 2
StemMAT_Plastic_KinematicScreening by test
Table 4. Contact parameters.
Contact PositionContact TypeFriction Coefficient
Blade and stemERODING_SURFACE_TO_SURFACEStatic friction coefficient 0.15, dynamic friction coefficient 0.1
Stem and baseAUTOMATIC_SURFACE_TO_SURFACE
Table 5. Plackett–Burman test parameters.
SymbolParametersLow LevelHigh Level
X1Density (kg/m3)10001200
X2Elastic modulus (Mpa)8001200
X3Poisson’s ratio0.20.4
X4Yield stress (Mpa)1020
X5Shear modulus (Mpa)0.40.6
X6Hardening parameter00.1
X7Strain rate (C)80100
X8Strain rate (P)412
X9Failure strain0.010.05
Table 6. Design scheme and results of the Plackett–Burman test.
No.X1X2X3X4X5X6X7X8X9Maximum Shear Force/N
110008000.4100.60.180120.0590.3
2120012000.4100.4010040.05100
310008000.2100.408040.0144.6
4100012000.2200.60100120.05180.3
512008000.4200.40.1100120.01123.9
6120012000.2100.40.180120.0581.6
7120012000.2200.60.18040.01101.4
8100012000.4200.4080120.01105.8
9100012000.4100.60.110040.0143
1012008000.2100.60100120.0158.7
1112008000.4200.608040.05182
1210008000.2200.40.110040.05201.3
Table 7. Significance analysis of Plackett–Burman test parameters.
ParametersEffectContribution/%Sum of SquaresF-Valuep-Value
X1−2.950.0826.110.61310.5156
X2−14.782.09655.6415.400.0592
X3−3.820.1443.701.030.4177
X479.4260.1918,921.02444.320.0022 **
X5−0.250.0010.18750.00440.9531
X6−4.980.2474.501.750.3169
X716.922.73858.5220.160.0462 *
X8−5.280.2783.741.970.2959
X959.683410,686.30250.950.0040 **
Note: ** represents extremely significant effect (p < 0.01), * represents significant effect (p < 0.05).
Table 8. Central composite design factor coding.
Factor LevelX4X9X7
1.68220.000.05100.00
117.980.0495.95
015.000.0390.00
−112.020.0284.05
−1.68210.000.0180.00
Table 9. Test results and scheme of central composite design experiment.
No.X4X9X7Maximum Shear Force/N
114.9950.0390122
212.020.0295.9584
314.9950.0390112
412.020.0495.95107
517.980.0284.05151
614.9950.046817990140
79.991670.039076
819.99830.0390175
917.980.0484.05162
1012.020.0284.0564
1114.9950.0390123
1214.9950.0390124
1312.020.0484.05102
1414.9950.0390121
1514.9950.0379.9933120
1614.9950.03100.007140
1717.980.0295.95150
1817.980.0495.95162
1914.9950.0390120
2014.9950.01318219099
Table 10. ANOVA of central composite design experiment.
SourceSum of SquaresdfMean SquareF-Valuep-Value
Model16,225.3591802.8275.48<0.0001 **
X413,823.69113,823.69578.77<0.0001 **
X91713.0411713.0471.72<0.0001 **
X7243.241243.2410.180.0096 **
X4X9180.501180.507.560.0205 *
X4X784.50184.503.540.0894
X9X724.50124.501.030.3350
X4224.07124.071.010.3392
X929.9119.910.41480.5340
X72119.791119.795.020.0490 *
Residual238.851023.88
Lack of fit145.51529.101.560.3189
Pure error93.33518.67
Core total16,464.2019
Note: ** represents extremely significant effect (p < 0.01), * represents significant effect (p < 0.05).
Table 11. Parameter calibration values.
ParameterNumerical Calibration
Yield stress17.96
Failure strain0.0387
Strain rate parameter C87.27
Table 12. Finite element simulation parameters of wild chrysanthemum stem.
ParametersValue
X11100
X21000
X30.3
X417.96
X50.5
X60.05
X787.27
X88
X90.0387
Table 13. Comparison of the maximum shear force of wild chrysanthemum stem.
Stem Diameter/mmMaximum Shear Force Measured/NMaximum Shear Force Simulation Value/NError/%
7120129.4−7.8
8159.2169−6
9213.8201.45.8
103002816.3
11378.2350−7.5
Publisher’s Note: MDPI stays neutral with regard to jurisdictional claims in published maps and institutional affiliations.

