Article

Spatial Evolution, Driving Mechanism, and Patch Prediction of Grain-Producing Cultivated Land in China

1
College of Agronomy, Northwest A&F University, Xianyang 712100, China
2
The Research Center of Recycle Agricultural Engineering and Technology of Shaanxi Province, Xianyang 712100, China
*
Author to whom correspondence should be addressed.
Agriculture 2022, 12(6), 860; https://doi.org/10.3390/agriculture12060860
Submission received: 31 May 2022 / Revised: 8 June 2022 / Accepted: 10 June 2022 / Published: 14 June 2022
(This article belongs to the Topic Sustainable Development and Food Insecurity)

Abstract

:
China has implemented strict policies for protecting cultivated land, and the Chinese government has focused on the non-grain production (NGP) of cultivated land. This study aimed to analyze the spatial evolution law of grain-producing cultivated land (GPCL) in China between 2000 and 2018, explore the mechanism of GPCL, and simulate the spatial characteristics of GPCL in 2036. We used the Geographic Information System (GIS) and a patch-generating land-use simulation model, a new model that proposes a land expansion analysis strategy by improving previous rule-mining methods. China’s grain production rate (GPrate) shows a gradual upward trend between 2000 (36.98%) and 2018 (47.18%). The mutual conversion of GPCL and non-grain-producing cultivated land (NGPCL) are the primary transfer types. The evolution of GPCL is driven by climatic, economic, and social factors, of which population density is the most important factor. GPCL expansion patches are distributed in densely populated, economically developed, and warm and humid plain areas. Further, the simulation results showed that the GPrate in 2036 is estimated to be 41.39%, with GPCL transfer-in significantly exceeding the amount transferred out. Our results further cultivated land evolution-associated research and provide a basis for formulating scientific land-use policies for cultivated land protection for other countries.

1. Introduction

As a large agricultural country, China uses less than 9% of the world’s arable land to feed 20% of the world’s population [1]. Cultivated land is the primary driver of food production, and China has always implemented a strict policy of cultivated land protection [2]. Recently, China has experienced rapid urbanization, thereby exhausting a large amount of cultivated land resources and converting them to construction land [3]. Simultaneously, the internal utilization mode of cultivated land has also undergone changes, and non-grain production (NGP) is attracting significant attention from the Chinese government [4].
Grain-producing cultivated land (GPCL) is transformed into non-grain-producing cultivated land (NGPCL), exempting cultivated land from food production and thereby posing great challenges to China’s food security [5]. Previous studies on the evolution of cultivated land have primarily studied the (1) extraction, spatiotemporal evolution, and driving mechanism of cultivated land based on remote sensing and GIS [6,7,8]; (2) relationship between cultivated land change and food production, urbanization, population, and terrain slope based on statistical and econometric models [9,10,11]; and (3) quality of cultivated land and its influencing factors, as well as the impact of long-term farming methods on the ecological environment and soil, based on experimental science [12,13]. However, most related studies have discussed the transformation process of cultivated land and its reasons as a whole, while ignoring the internal differences impacting the transformation of cultivated land. There are still gaps in the knowledge concerning the transformation of the internal utilization mode of cultivated land and its driving mechanism, especially the evolution of cultivated land for different crops. By studying the evolution process and mechanism of GPCL, the internal reasons for the evolution and differentiation of cultivated land at a larger scale will be better understood.
Currently, several models for predicting land-use changes exist, such as cellular automata (CA), a framework for simulating land-use transitions and their impacts, and future land-use simulation (FLUS) models [14,15,16,17]. However, existing studies lack a flexible mechanism for dealing with multi-type land use patch changes to simulate fine-scale land-use changes, which restricts their application in practical planning and land policy formulation. In this study, our technical implementation of land-use change prediction is based on a new model, the Patch-generating land-use simulation (PLUS) model. Unlike other models, this model proposes a new land expansion analysis strategy by improving previous rule mining methods, such as transfer analysis strategy or pattern analysis strategy. In addition, the PLUS model retains the advantages of existing models, avoiding the need to analyze transformation types that grow exponentially with the number of categories, and the ability to analyze land-use change mechanisms over a certain period of time. The PLUS model has been shown to be a more efficient model that provides more accurate simulation results [18].
Thus, we aimed to (1) map and analyze the evolution of GPCL in China, (2) explore the driving mechanism of the evolution of GPCL, and (3) evaluate the future GPCL based on the PLUS model. We comprehensively analyzed the evolution of NGPCL and GPCL in China and enriched scientific knowledge of cultivated land evolution to provide a basis for making rational policies for cultivated land use while demonstrating the idea of cultivated land protection for other countries at the same stage of development.

2. Materials and Methods

2.1. Patch-Generating Land-Use Simulation (PLUS) Model and Simulation Process

PLUS is a patch generation land-use change simulation model based on raster data. This model: (1) enables better excavation of the inducements of various land-use changes by applying a new analysis strategy; (2) contains a novel multi-class seed growth mechanism that can better simulate multi-class land use patch-level changes; and (3) coupled with multi-objective optimization algorithms, provides simulation results that can better support planning policies to achieve sustainable development.
The PLUS model comprises a (1) land expansion analysis strategy that extracts the various types of land use expansion part between two phases of land-use change; then, sampling from the increased part, the random forest algorithm is used to mine the factors of various types of land use expansion and driving forces one by one. The development probability and the contribution of driving factors to the expansion of various types of land use during this period can thus be obtained. This avoids conversion types that grow exponentially with the number of analyzed categories and retains the model for a certain period of time and the ability to analyze mechanisms of land-use change with better interpretability; (2) cellular automata (CA) model: combined with random seed generation and a threshold-decreasing mechanism, the PLUS model can dynamically simulate the automatic generation of patches in space and time under the constraint of a development probability [15,18].
In this study, we extracted data on the expansion of various types of land between 2000 and 2018 and used the random forest algorithm to obtain their development probabilities. We then used the CA model based on multi-type random patch seeds to predict the future landscape. First, according to the actual situation and the availability of data, 11 driving factors from three categories (natural factors, socio-economic factors, and accessibility) were selected. After rasterization, they were unified into the same projected coordinate system and spaced as the land cover data resolution. Secondly, the development probability of each land use type was obtained using the Land Use Expansion Analysis Strategy (LEAS) module. Finally, combined with relevant parameters, such as the number of target pixels of various types of land in the future, transfer cost matrix, probability of random patch seeds, and neighborhood factors, the CA model based on multiple types of random patch seeds simulated land-use change in 2036. In this study, the Markov model was used to forecast the demand for future landscape types. Based on the existing data, the trial-and-error method was used to repeatedly debug each parameter, and the Kappa coefficient and figure of merit (FOM) coefficient were selected to evaluate the accuracy of the simulation results. The Kappa coefficient and FOM coefficient were 0.812 and 0.152, respectively, indicating that the simulation results of the PLUS model were accurate.

2.2. Variable Description

2.2.1. Measurement of GPrate

According to the official document of the Chinese government, “Opinions on preventing the non-grain production of cultivated land and stabilizing grain production”, which includes the grain crops rice, wheat, and corn, the GPrate is calculated as follows:
GPrate = L/(C × I) × 100%
where L is the sum of the area of wheat, corn, and rice, C is the cultivated land area, and I is the multiple cropping index.

2.2.2. Drive Factor Determination

The change in cultivated land use is very complex and has non-linear characteristics. Different study areas and periods have different degrees of influence on driving factors, and the selection of driving factors affects the accuracy of spatial simulation models to a certain extent. Therefore, their selection should be based on the principles of comprehensiveness, data availability, and quantification. We comprehensively considered driving factors selected by previous researchers [19,20,21,22] and selected 11 factors in 3 categories (Table 1): climate and environmental factors, socioeconomic factors, and accessibility factors. Climate and environmental factors include elevation, slope, annual average temperature, annual precipitation, and potential evaporation; socioeconomic factors include population density and gross domestic product (GDP); accessibility factors include distance from expressways, railways, urban roads, and water systems. A few drivers for each category have been discussed below:
  • Slope: The gentler the slope, the greater the tendency to experience land-use change, regardless of the type of change. The transition of land use from agricultural land to urban and vice versa is more likely to occur on land with lower slopes [23,24].
  • Elevation: The difference in altitude distribution will affect the growth and environment of crops. The effect of elevation on land-use change is particularly obvious in areas with rough terrain and peaked altitude differences [25,26].
  • Population density: Labor productivity is the driving force for urban construction and development. In the process of urbanization, a large portion of the rural population drift to cities, and high population-density areas are often areas where construction land is rapidly expanding. Therefore, high population density becomes an increasingly attractive factor for the further development of a city [27,28].
  • Distance from various traffic arteries: Accessibility is an important factor affecting land use. It can be expressed as the ease in displacing from a starting point to a specified destination and is usually expressed by indicators such as the distance between the starting point and destination, travel cost, and time [29,30,31]. Advanced accessibility conditions are the driving force for investing, accelerating the construction of urban infrastructure, and attracting agricultural and industrial enterprises. Land use transits quickly to urban, alongside major transportation arteries, forming linear towns, thereby connecting urban areas.

2.3. Data Source

Data on land use, population density, GDP, elevation, aspect, and slope were obtained from the Chinese Academy of Sciences Resource and Environment Science Data Center (https://www.resdc.cn/, accessed on 16 March 2022). Annual precipitation and average temperature spatial interpolation datasets were obtained from the National Earth System Science Data Center (http://www.geodata.cn/, accessed on 16 March 2022). Road traffic data was obtained from the National Geographic Information Resource Directory Service System (https://www.webmap.cn/main.do?method=index, accessed on 16 March 2022).
The 2000–2018 annual spatial distribution data of China’s three major crops, wheat, rice, and corn, with a resolution of 1 km, was obtained from the study by Luo et al. [32]; the data is shared at https://data.mendeley.com/datasets/jbs44b2hrk/2 (accessed on 16 March 2022). The multiple cropping index data was obtained from a study by Liu et al. [33]; the data is shared at https://doi.org/10.6084/m9.figshare.14099402 (accessed on 16 March 2022). This dataset released the global, 250-m resolution annual multi-cropping index distribution map. All data were unified at a resolution of 1 km × 1 km.

3. Results

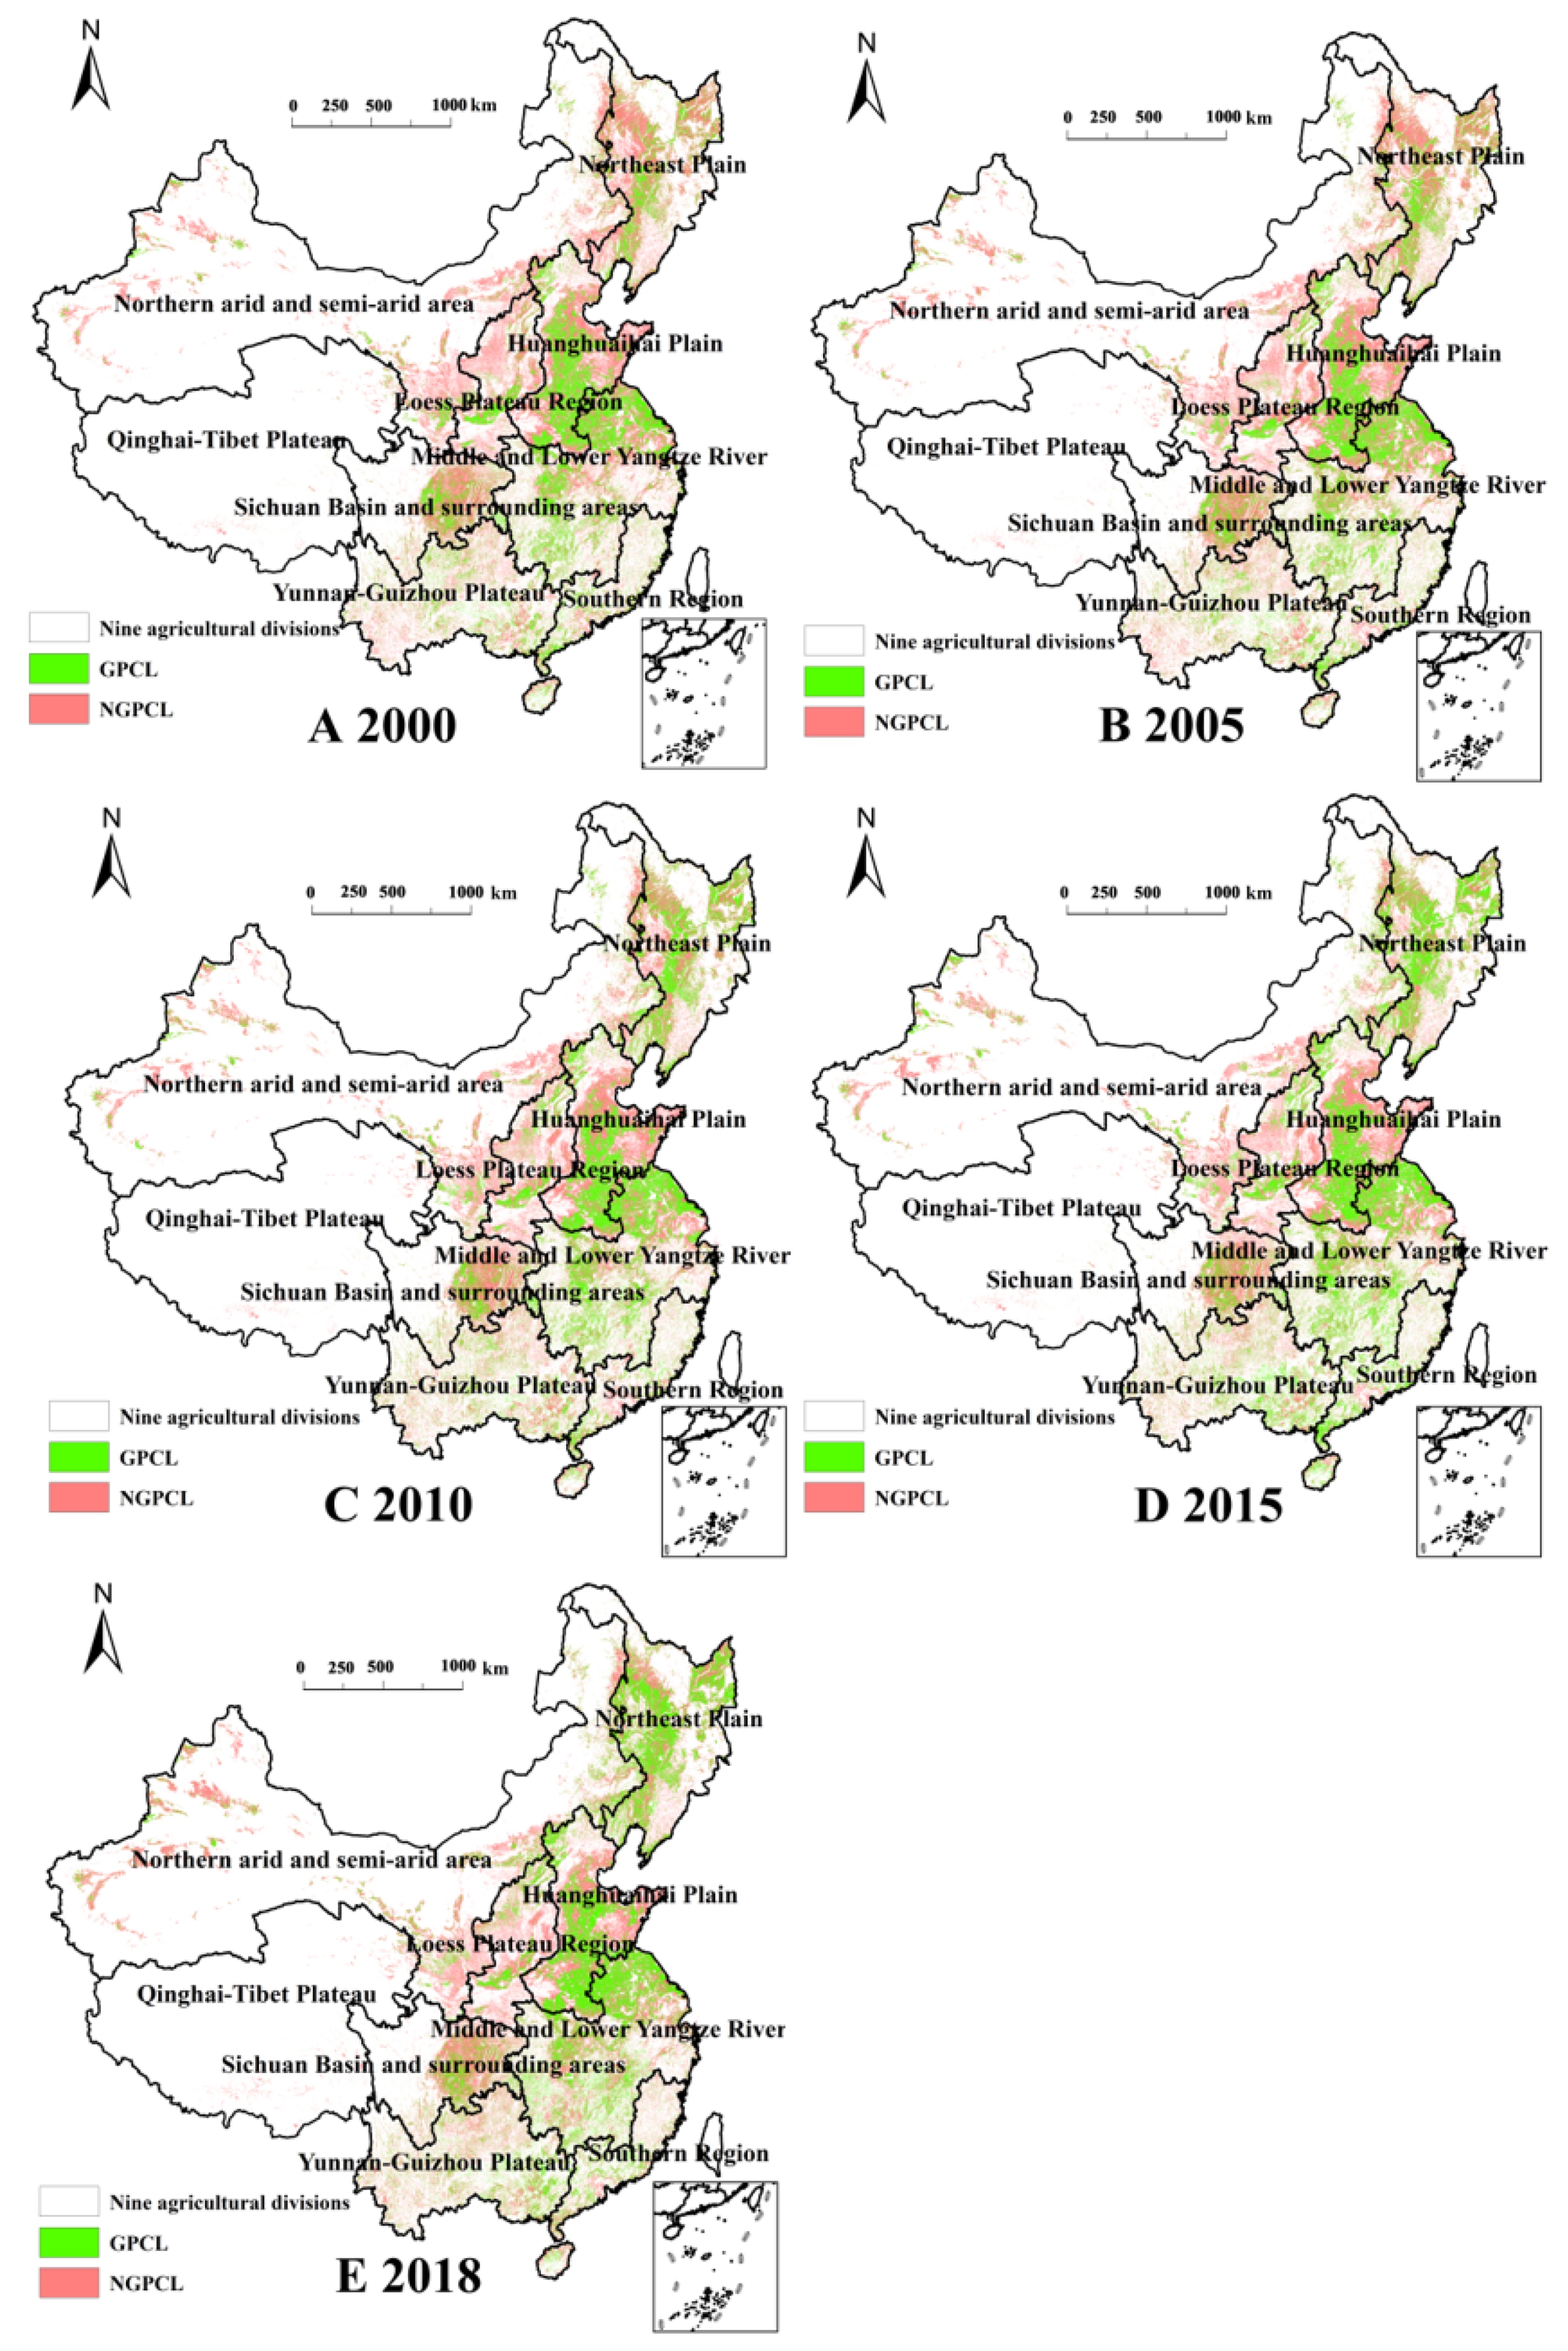
3.1. Spatial Evolution

The distribution map revealed that GPCL is mainly distributed in eastern China (Table 2, Figure 1). From 2000 to 2018, GPCL gradually spatially expanded to the northeast, and this spatial distribution was relatively stable.
Moreover, China’s GPrate demonstrates a gradually increasing trend from 36.98% in 2000 to 47.18% in 2018. Apart from the Qinghai-Tibet Plateau, which experienced a drastic drop in GPrate from 16.80% to 10.02%, the Sichuan Basin and its surrounding areas experienced a slight drop in GPrate from 33.40% to 31.62%, and the Southern Region remained basically stable (from 50.13% to 49.93%). The GPrate of the other regions increased in varying degrees. Among them, the Northeast Plain increased the most, from 29.10% to 59.26%.
In the metastatic map of GPCL from 2000 to 2018 (Figure 2), the spatial variation of GPCL is more intense. The GPCL that has remained unchanged for 18 years spans 2.71 × 10⁷ ha and is mainly distributed in Huanghuaihai Plain. The transferred GPCL was 3.91 × 10⁷ ha in the middle and lower reaches of the Yangtze River, Sichuan Basin and surrounding areas, and the Southern Region. The transferred GPCL was 5.65 × 10⁷ ha, with the largest distribution in the Northeast Plain and the rest of the eastern regions. Thus, in the past 18 years, the inflow of GPCL is greater than its outflow, showing an increase of 1.74 × 10⁷ ha. From the perspective of the type of transfer, we primarily observed the internal transformation of cultivated land, which is the mutual transformation of GPCL and NGPCL. In the past 18 years, 65.48% of the total transfer volume of GPCL was transferred to NGPCL, accounting for 51.23% of the increased area of NGPCL. Among the transfer types of GPCL, 52.33% of the transfers are attributed to NGPCL.

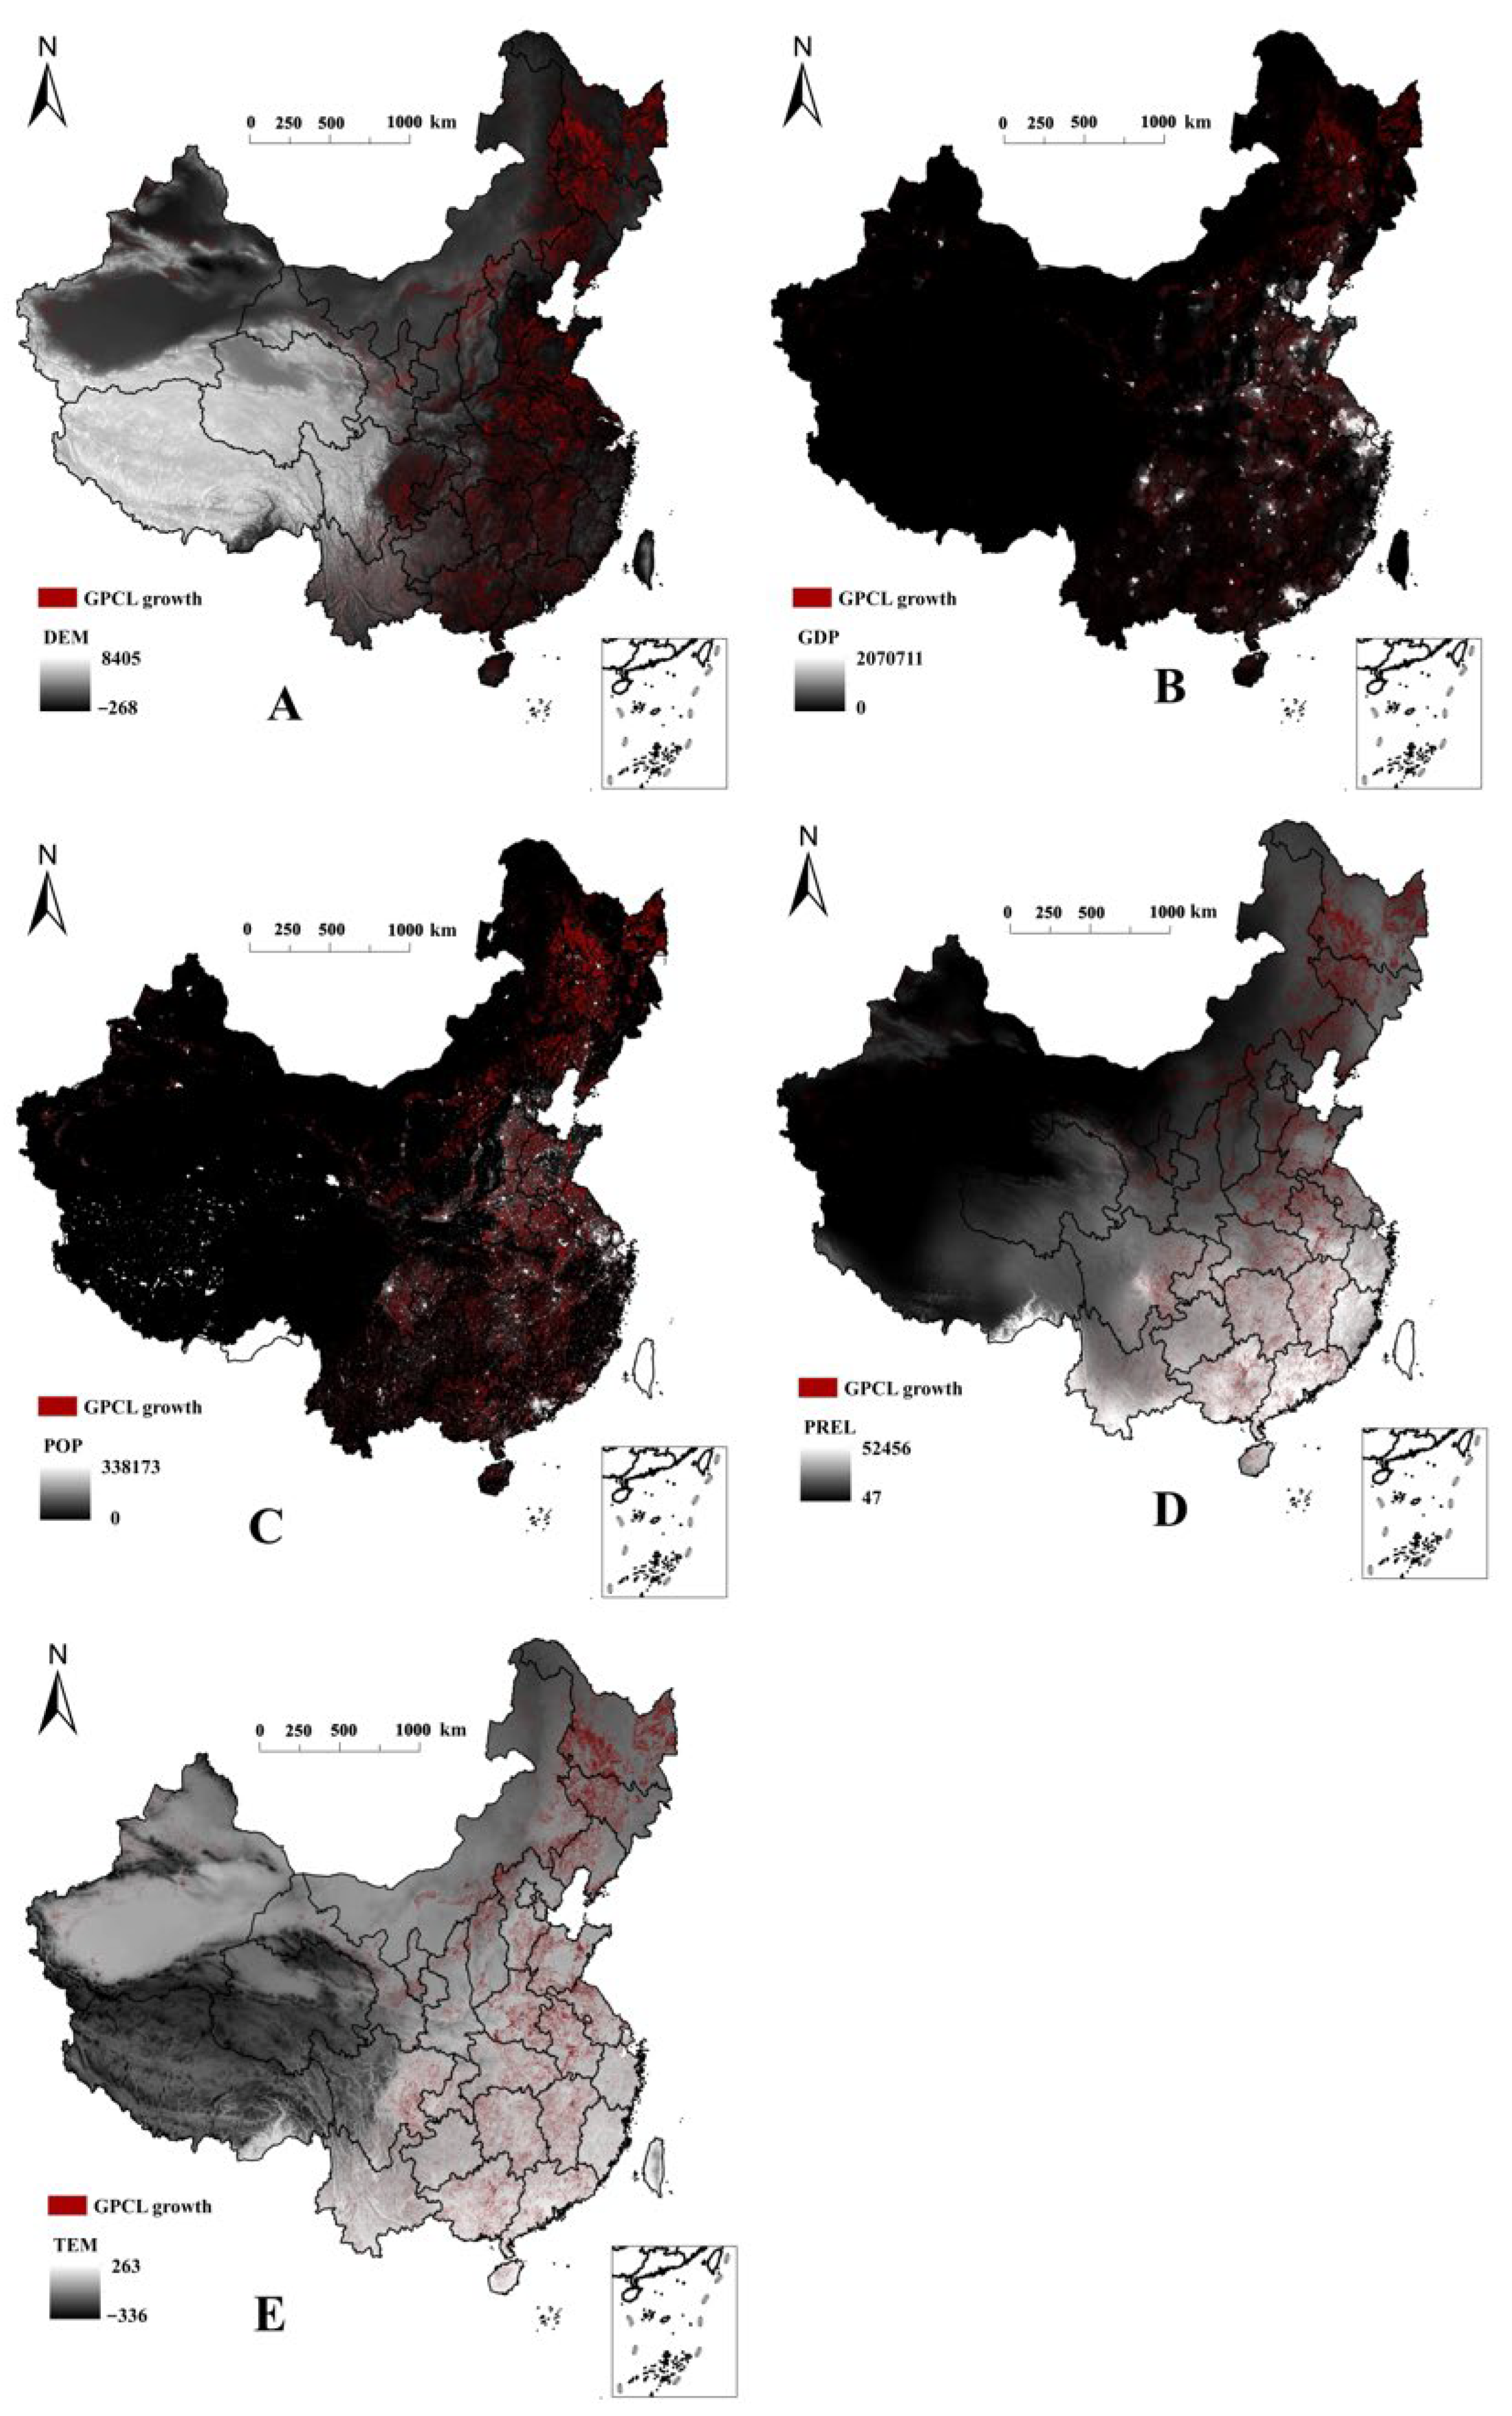
3.2. Driving Mechanism

From 2000 to 2018, the factors driving the changes in China’s GPCL can be attributed to socio-economic factors, such as population (POP), GDP, and accessibility, as well as natural environmental factors, such as slope, elevation, precipitation, and temperature. As demonstrated in Figure 3, the main drivers of GPCL expansion are POP, elevation (DEM), GDP, annual mean temperature (TEM), and annual precipitation (PREL).
On studying the GPCL expansion area and the five driving factors (Figure 4), we found that GPCL expansion patches are distributed in densely populated, economically developed, warm and humid plain areas. From the analysis of the individual factors influencing NGPCL, the top five driving factors were found to be population (POP), slope (SLOP), annual precipitation (PREL), distance to city road (WD), and DEM. We found that POP was the main factor affecting their expansion regardless of GPCL or NGPCL. China’s rapid urbanization has led to a large-scale population shift from rural to urban areas, with far-reaching impacts on China’s food production. To a certain extent, the evolution of the spatial pattern of GPCL and NGPCL is a result of China’s urbanization and continuous adaptation to the natural environment.

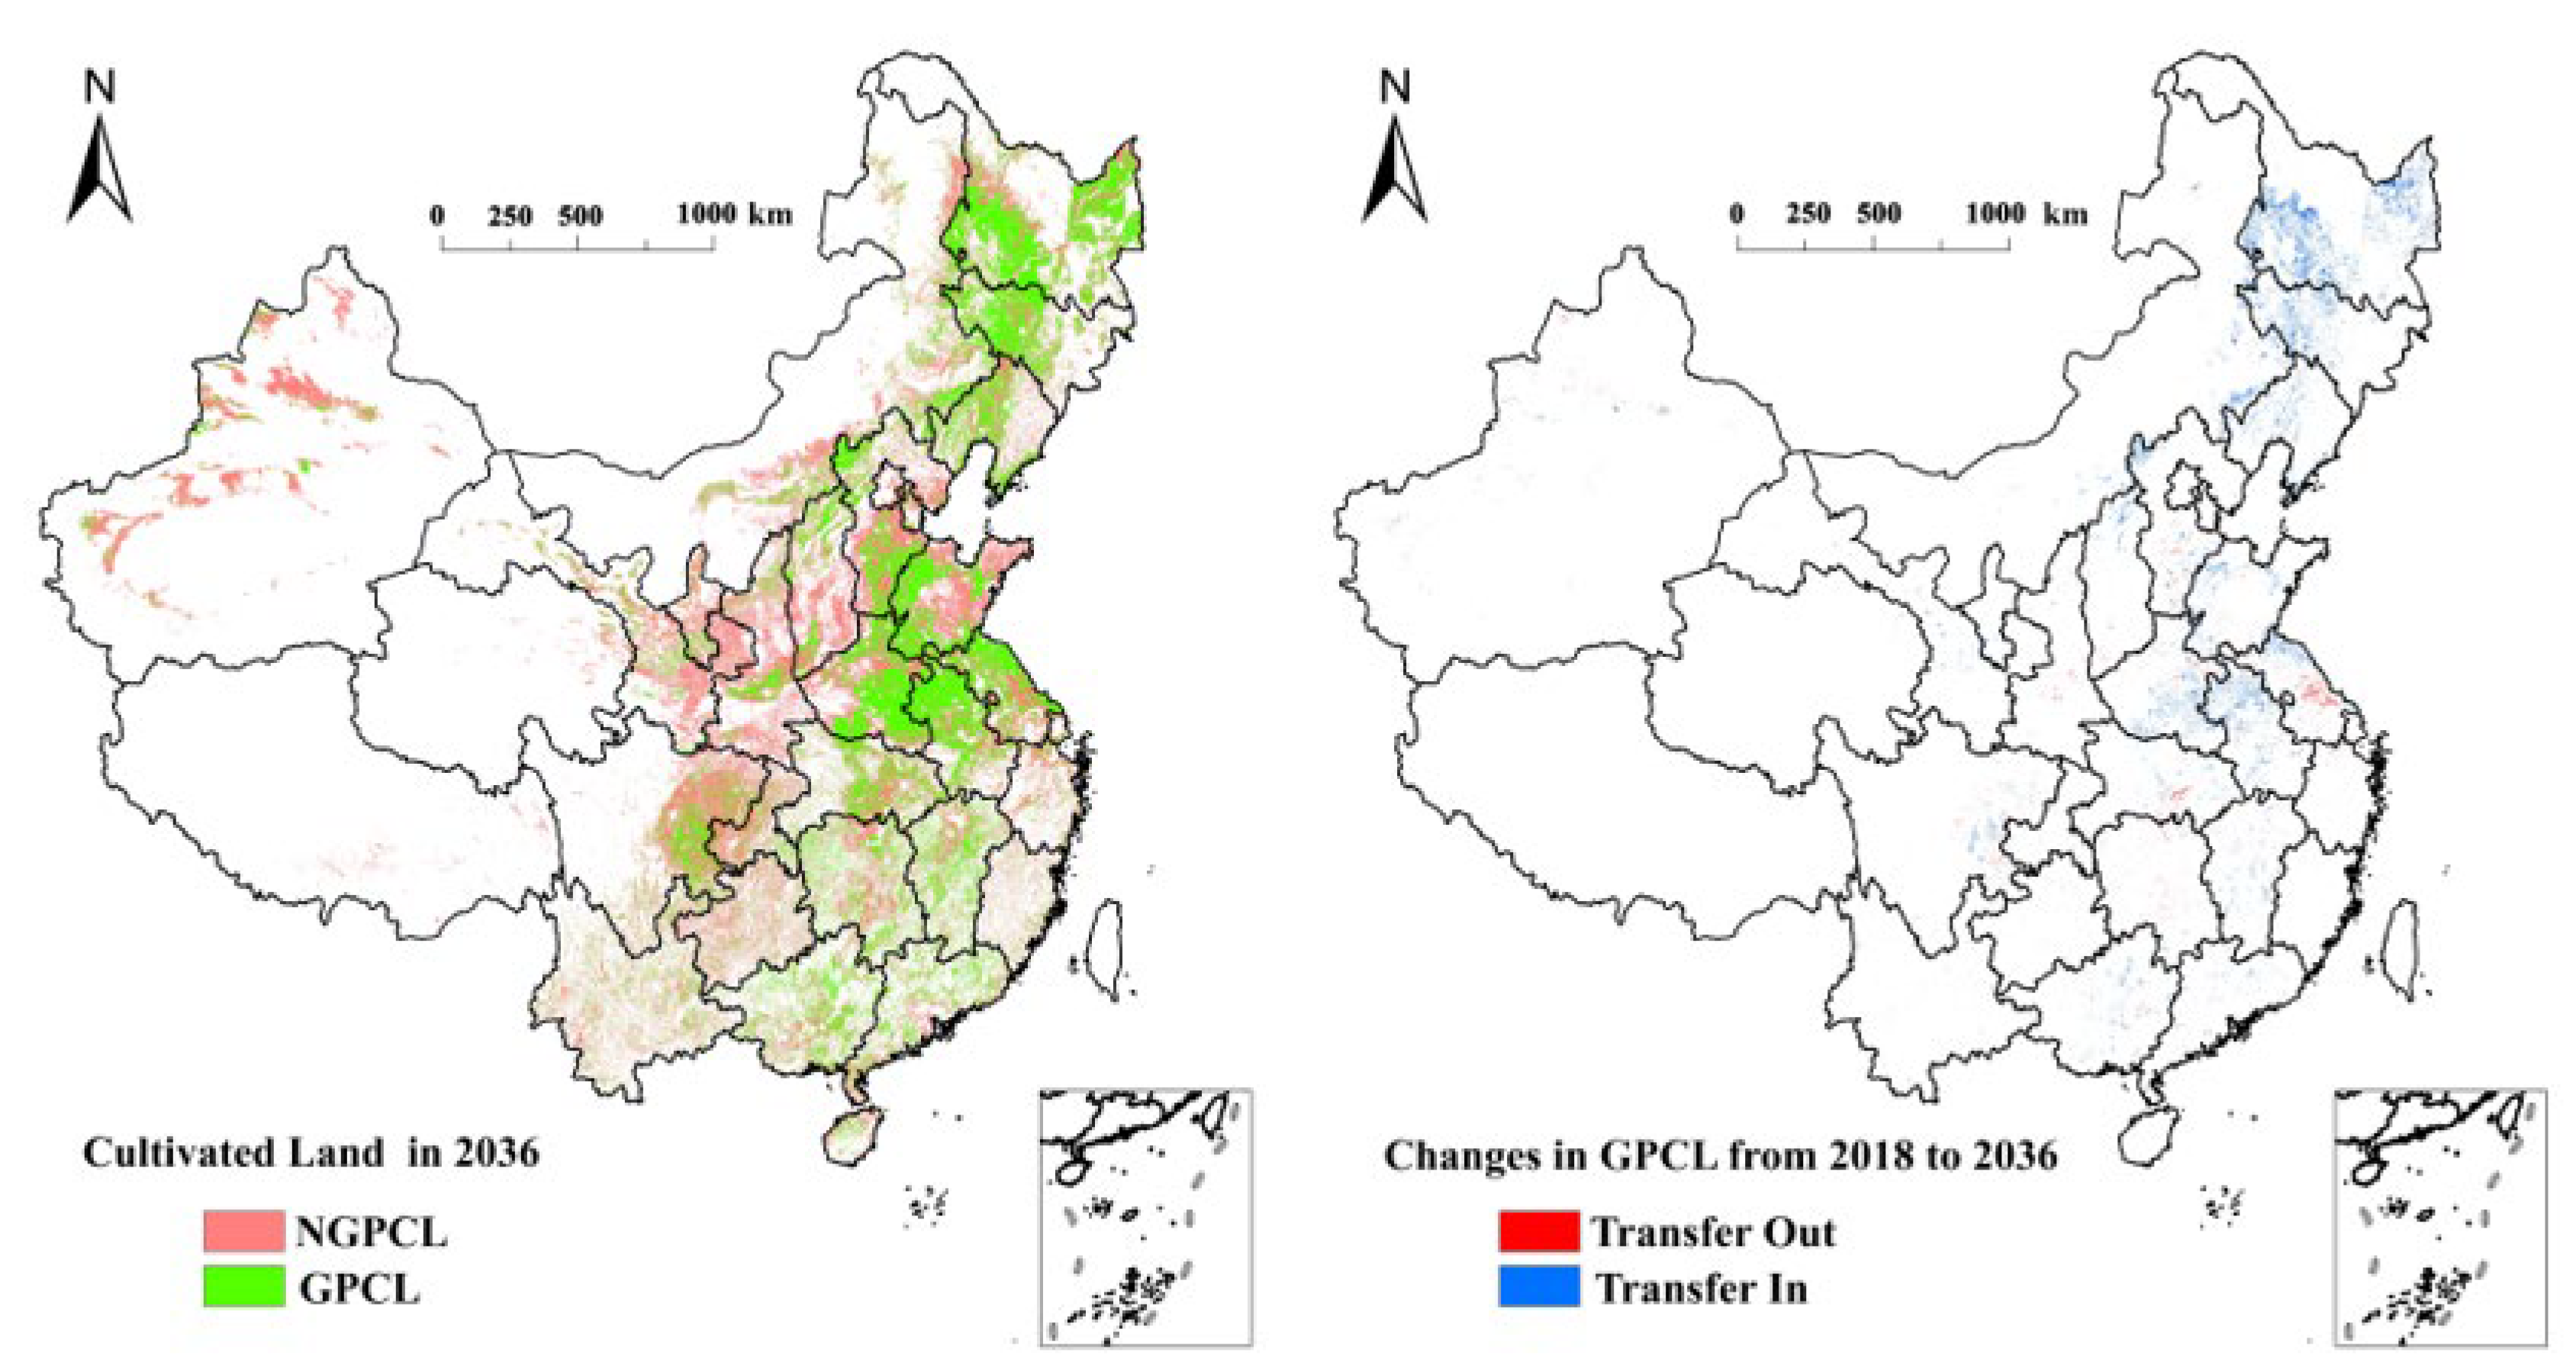
3.3. Patch Prediction

The patch simulation results showed that the spatial distribution of cultivated land predicted in 2036 is more consistent than that in 2018, and the GPrate in 2036 is predicted to be 41.39%. Analysis of the GPCL transfer map from 2018 to 2036 (Figure 5) revealed that the amount of transfer-in (9.72 × 10⁶ ha) is significantly greater than the amount of transfer out (1.78 × 10⁶ ha), with the unchanged and newly added GPCL being 8.18 × 10⁷ ha and 7.94 × 10⁶ ha concentrated in the Northeast Plain and Huanghuaihai Plain, respectively. From the perspective of transfer types, transfer can be primarily attributed to the mutual conversion of GPCL and NGPCL. The transferred GPCL primarily changed to NGPCL, accounting for 88.77%, and the transferred GPCL from NGPCL accounted for 75.55%.

4. Discussion and Policy Implications

4.1. Bottom Line of GPrate as a Deciding Factor in the Production Use of Cultivated Land

Guaranteeing the production of food rations, especially the three major staple crops, is the bottom line for the development of a country with a large population, such as China [34]. The Chinese government attaches great importance to food security and emphasizes the implementation of the strictest farmland protection policies. Studying how much food should be grown on arable land in order to ensure food security is of prime importance [3,35]. Our study reveals that from 2000 to 2018, China’s GPrate gradually increased from 36.98% to 47.18%, and the predicted value in 2036 was 41.39%, indicating that approximately 50% of the GPrate meet the needs of food production, and it is clear that cultivated land must be used to produce the three major crops. The remaining 50% of the cultivated land can be developed for multi-purpose functions and engaged in the development of other industries, such as cash crops or forest fruits [36].

4.2. Evolution Process of GPCL as a Result of the Natural Adaptation of China’s Agricultural Production Layout and as a Response to China’s Urbanization Development

For two decades, China’s economy and society have developed rapidly, and China’s grain production pattern has also undergone rapid changes. We demonstrated that the evolution of GPCL is driven by natural, economic, and social factors, of which population density was the most important factor, consistent with the conclusions of other studies [21,22,37]. China’s urbanization rate is increasing rapidly, with a large number of the rural population drifting to cities. The per capita arable land area in different regions has also changed significantly, and the transformation of GPCL and NGPCL is more obvious. The evolution process of GPCL is the natural adaptation result of China’s agricultural production layout and is also a response to China’s urbanization. One can predict that the spatial pattern of GPCL is relatively stable, and there will be no major changes in the pattern in the future.

4.3. Large Reserve of GPCL Backup Resources of China from NGPCL Allows Planning and Issue of Land Use Policies in the Future

The current NGP has aroused great concern in the government, especially regarding the “zero tolerance” attitude towards the conversion of GPCL to NGPCL [38]. Our study revealed that a large number of NGPCL is expected to get converted to GPCL in the future owing to a large number of NGPCL transforming into GPCL under strict restrictions in the future. At the same time, some researchers have demonstrated that in the future, as a large number of rural homesteads will be withdrawn into cultivated land [39], China’s GPCL may further increase. This requires the government to further strengthen planning, introduce reasonable land-use policies, conduct scientific research and judgment on the evolution of GPCL, and ensure China’s food security [40].

4.4. Policy Implications

  • Implementation of the action plan for the mapping of arable land: in the entire county, comprehensive mapping and investigation should be conducted to determine the type, area, and distribution of NGPCL, accurately determine the distribution of GPCL in space, and accurately analyze the spatial position.
  • Construction of NGPCL withdrawal account: The management platform for the withdrawal of NGPCL and data information has been set up in the entire province to strengthen on-the-spot verification, grasp the actual situation, and ensure the validity and accuracy of the survey data.
  • Formulating regional implementation plans for cultivated land: According to the comprising factors and the difficulty of withdrawal of NGPCL, the zoning plan of NGPCL shall be drawn up, and according to the plan, the withdrawal plan and timetable shall be drawn up to provide specific guidance for the withdrawal of NGPCL.

4.5. Limitation

This study was conducted on a national scale. It is worth noting that land use decisions are usually finer than the 1-km grid applied here, and the results will need to be described in more detail in the future by further taking small areas as research scales. It should be pointed out that, due to the scale and length of the study, the model assumes that temperature and precipitation are constant in the simulation of future evolution. With the complex changes in the global climate in the future, more complex models can be used in the future, with more variable models considered for further research.

5. Conclusions

We analyzed the spatial evolution law of GPCL in China from 2000 to 2018, then explored the driving mechanisms of GPCL, and finally simulated the spatial characteristics of GPCL in 2036. The following conclusions were drawn:
  • China’s GPrate has shown a gradually increasing trend, rising from 36.98% in 2000 to 47.18% in 2018. The transfer map of GPCL revealed that a GPCL of 2.71 × 10⁷ ha has remained unchanged for 18 years, and the amount of transfer-in is greater than that of transfer-out, with an increase of 1.74 × 10⁷ ha. The main transfer observed was the mutual conversion of GPCL and NGPCL. Concerning the transfer volume, 65.48% of GPCL were transferred to NGPCL, and among the transfer types of GPCL, NGPCL accounted for 52.33%.
  • The evolution of GPCL is driven by natural (such as climate), economic, and social factors, of which population density is the most important factor. The main drivers of GPCL expansion are POP, DEM, GDP, TEM, and PREL. GPCL expansion patches are distributed in densely populated, economically developed, warm, and humid plain areas.
  • The simulation results showed that the GPrate in 2036 is estimated to be 41.39%. From 2018 to 2036, the amount of GPCL transfer-in is significantly greater than the amount transferred out. The unchanged GPCL was 8.18 × 10⁷ ha, the transfer-out was 1.78 × 10⁶ ha, the transfer-in was 9.72 × 10⁶ ha, and the newly added GPCL was 7.94 × 10⁶ ha, mainly from the conversion of NGPCL.

Author Contributions

Conceptualization, Z.Z. and Y.F.; methodology, Z.Z.; software, Z.Z.; validation, J.D., R.L. and Z.Z.; formal analysis, J.D.; investigation, Z.Z.; writing—original draft preparation, Z.Z.; writing—review and editing, Z.Z.; funding acquisition, Y.F. All authors have read and agreed to the published version of the manuscript.

Funding

This work was supported by the Shaanxi Provincial Forestry Science and Technology Innovation Program Special Project [SXLK2020-0102], and the China Association for Science and Technology 2020 Postgraduate Science Popularization Ability Improvement Project [kxyjs202034].

Institutional Review Board Statement

Not applicable.

Informed Consent Statement

Not applicable.

Data Availability Statement

The data that support the findings of this study are available from the corresponding author upon reasonable request.

Conflicts of Interest

The authors declare no conflict of interest.

References

  1. Liu, Y.; Zhou, Y. Reflections on China’s food security and land use policy under rapid urbanization. Land Use Policy 2021, 109, 105699. [Google Scholar] [CrossRef]
  2. Bryan, B.A.; Gao, L.; Ye, Y.Q.; Sun, X.F.; Connor, J.D.; Crossman, N.D.; Stafford-Smith, M.; Wu, J.G.; He, C.Y.; Yu, D.Y.; et al. China’s response to a national land-system sustainability emergency. Nature 2018, 559, 193–204. [Google Scholar] [CrossRef] [PubMed]
  3. Deng, X.Z.; Huang, J.K.; Rozelle, S.; Zhang, J.P.; Li, Z.H. Impact of urbanization on cultivated land changes in China. Land Use Policy 2015, 45, 1–7. [Google Scholar] [CrossRef]
  4. Su, Y.; Qian, K.; Lin, L.; Wang, K.; Guan, T.; Gan, M. Identifying the driving forces of non-grain production expansion in rural China and its implications for policies on cultivated land protection. Land Use Policy 2020, 92. [Google Scholar] [CrossRef]
  5. Yang, Q.; Zhang, D. The influence of agricultural industrial policy on non-grain production of cultivated land: A case study of the “one village, one product” strategy implemented in Guanzhong Plain of China. Land Use Policy 2021, 108, 105579. [Google Scholar] [CrossRef]
  6. Cao, X.; Chen, X.H.; Zhang, W.W.; Liao, A.P.; Chen, L.J.; Chen, Z.G.; Chen, J. Global cultivated land mapping at 30 m spatial resolution. Sci. China Earth Sci. 2016, 59, 2275–2284. [Google Scholar] [CrossRef]
  7. Ma, L.; Cheng, L.; Han, W.Q.; Zhong, L.S.; Li, M.C. Cultivated land information extraction from high-resolution unmanned aerial vehicle imagery data. J. Appl. Remote Sens. 2014, 8, 083673. [Google Scholar] [CrossRef]
  8. Xu, W.Y.; Jin, J.X.; Jin, X.B.; Xiao, Y.Y.; Ren, J.; Liu, J.; Sun, R.; Zhou, Y.K. Analysis of Changes and Potential Characteristics of Cultivated Land Productivity Based on MODIS EVI: A Case Study of Jiangsu Province, China. Remote Sens. 2019, 11, 2041. [Google Scholar] [CrossRef] [Green Version]
  9. Chen, M.Q.; Zhong, T.Y.; Zhou, B.J.; Huang, H.S.; He, W.J. Empirical research on farm households’ attitude and behaviour for cultivated land transferring and it’s influencing factors in China. Agric. Econ. Zemed. Ekon. 2010, 56, 409–420. [Google Scholar] [CrossRef] [Green Version]
  10. Li, Q.Q.; Liu, G.L. Is land nationalization more conducive to sustainable development of cultivated land and food security than land privatization in post-socialist Central Asia? Glob. Food Secur. Agric. Policy Econ. Environ. 2021, 30, 100560. [Google Scholar] [CrossRef]
  11. Li, Y.Y.; Li, X.B.; Tan, M.H.; Wang, X.; Xin, L.J. The impact of cultivated land spatial shift on food crop production in China, 1990–2010. Land Degrad. Dev. 2018, 29, 1652–1659. [Google Scholar] [CrossRef]
  12. Vaccari, F.P.; Lugato, E.; Gioli, B.; D’Acqui, L.; Genesio, L.; Toscano, P.; Matese, A.; Miglietta, F. Land use change and soil organic carbon dynamics in Mediterranean agro-ecosystems: The case study of Pianosa Island. Geoderma 2012, 175, 29–36. [Google Scholar] [CrossRef]
  13. Zhuang, Q.W.; Shao, Z.F.; Huang, X.; Zhang, Y.; Wu, W.F.; Feng, X.X.; Lv, X.W.; Ding, Q.; Cai, B.W.; Altan, O. Evolution of soil salinization under the background of landscape patterns in the irrigated northern slopes of Tianshan Mountains, Xinjiang, China. Catena 2021, 206, 105561. [Google Scholar] [CrossRef]
  14. Jin, G.; Chen, K.; Wang, P.; Guo, B.S.; Dong, Y.; Yang, J. Trade-offs in land-use competition and sustainable land development in the North China Plain. Technol. Forecast. Soc. Change 2019, 141, 36–46. [Google Scholar] [CrossRef]
  15. Liang, X.; Liu, X.P.; Li, D.; Zhao, H.; Chen, G.Z. Urban growth simulation by incorporating planning policies into a CA-based future land-use simulation model. Int. J. Geogr. Inf. Sci. 2018, 32, 2294–2316. [Google Scholar] [CrossRef]
  16. Liu, X.P.; Liang, X.; Li, X.; Xu, X.C.; Ou, J.P.; Chen, Y.M.; Li, S.Y.; Wang, S.J.; Pei, F.S. A future land use simulation model (FLUS) for simulating multiple land use scenarios by coupling human and natural effects. Landsc. Urban Plan. 2017, 168, 94–116. [Google Scholar] [CrossRef]
  17. Sang, L.L.; Zhang, C.; Yang, J.Y.; Zhu, D.H.; Yun, W.J. Simulation of land use spatial pattern of towns and villages based on CA-Markov model. Math. Comput. Model. 2011, 54, 938–943. [Google Scholar] [CrossRef]
  18. Liang, X.; Guan, Q.F.; Clarke, K.C.; Liu, S.S.; Wang, B.Y.; Yao, Y. Understanding the drivers of sustainable land expansion using a patch-generating land use simulation (PLUS) model: A case study in Wuhan, China. Comput. Environ. Urban Syst. 2021, 85, 101569. [Google Scholar] [CrossRef]
  19. Dubroeucq, D.; Livenais, P. Land cover and land use changes in relation to social evolution—A case study from Northern Chile. J. Arid. Environ. 2004, 56, 193–211. [Google Scholar] [CrossRef]
  20. Li, H.; Wu, Y.Z.; Huang, X.J.; Sloan, M.; Skitmore, M. Spatial-temporal evolution and classification of marginalization of cultivated land in the process of urbanization. Habitat Int. 2017, 61, 1–8. [Google Scholar] [CrossRef] [Green Version]
  21. Liang, X.Y.; Jin, X.B.; Yang, X.H.; Xu, W.Y.; Lin, J.H.; Zhou, Y.K. Exploring cultivated land evolution in mountainous areas of Southwest China, an empirical study of developments since the 1980s. Land Degrad. Dev. 2021, 32, 546–558. [Google Scholar] [CrossRef]
  22. Liu, Y.X.; Liu, S.L.; Sun, Y.X.; Wang, F.F.; Li, M.Q. Driving forces of cultivated land evolution in agro-pastoral areas on the Qinghai-Tibet Plateau based on ecological niche theory. J. Clean. Prod. 2021, 313, 127899. [Google Scholar] [CrossRef]
  23. Setyawan, C.; Lee, C.Y.; Prawitasari, M. Investigating spatial contribution of land use types and land slope classes on soil erosion distribution under tropical environment. Nat. Hazards 2019, 98, 697–718. [Google Scholar] [CrossRef]
  24. Zimmer, H.C.; Thi, H.L.; Lo, D.; Baynes, J.; Nichols, J.D. Why do farmers still grow corn on steep slopes in northwest Vietnam? Agrofor. Syst. 2018, 92, 1721–1735. [Google Scholar] [CrossRef]
  25. Ruan, X.F.; Qiu, F.; Dyck, M. The effects of environmental and socioeconomic factors on land-use changes: A study of Alberta, Canada. Environ. Monit. Assess. 2016, 188, 1–31. [Google Scholar] [CrossRef] [PubMed]
  26. Xu, E.Q.; Zhang, H.Q.; Yao, L.N. An Elevation-Based Stratification Model for Simulating Land Use Change. Remote Sens. 2018, 10, 1730. [Google Scholar] [CrossRef] [Green Version]
  27. Liu, Y.Y.; Yamauchi, F. Population density, migration, and the returns to human capital and land: Insights from Indonesia. Food Policy 2014, 48, 182–193. [Google Scholar] [CrossRef] [Green Version]
  28. Tan, M.H.; Li, X.B.; Lu, C.H.; Luo, W.; Kong, X.B.; Ma, S.H. Urban population densities and their policy implications in China. Habitat Int. 2008, 32, 471–484. [Google Scholar] [CrossRef]
  29. Huang, Z.H.; Du, X.J.; Castillo, C.S.Z. How does urbanization affect farmland protection? Evidence from China. Resour. Conserv. Recycl. 2019, 145, 139–147. [Google Scholar] [CrossRef] [Green Version]
  30. Song, X.Q.; Huang, Y.; Wu, Z.F.; Ouyang, Z. Does cultivated land function transition occur in China? J. Geogr. Sci. 2015, 25, 817–835. [Google Scholar] [CrossRef]
  31. Tan, Y.Z.; Chen, H.; Lian, K.; Yu, Z.N. Comprehensive Evaluation of Cultivated Land Quality at County Scale: A Case Study of Shengzhou, Zhejiang Province, China. Int. J. Environ. Res. Public Health 2020, 17, 1169. [Google Scholar] [CrossRef] [PubMed] [Green Version]
  32. Luo, Y.; Zhang, Z.; Li, Z.; Chen, Y.; Zhang, L.; Cao, J.; Tao, F. Identifying the spatiotemporal changes of annual harvesting areas for three staple crops in China by integrating multi-data sources. Environ. Res. Lett. 2020, 15, 074003. [Google Scholar] [CrossRef]
  33. Liu, X.; Zheng, J.; Yu, L.; Hao, P.; Chen, B.; Xin, Q.; Fu, H.; Gong, P. Annual dynamic dataset of global cropping intensity from 2001 to 2019. Sci. Data 2021, 8, 283. [Google Scholar] [CrossRef] [PubMed]
  34. Foley, J.A.; Ramankutty, N.; Brauman, K.A.; Cassidy, E.S.; Gerber, J.S.; Johnston, M.; Mueller, N.D.; O’Connell, C.; Ray, D.K.; West, P.C.; et al. Solutions for a cultivated planet. Nature 2011, 478, 337–342. [Google Scholar] [CrossRef] [PubMed] [Green Version]
  35. D’Amour, C.B.; Reitsma, F.; Baiocchi, G.; Barthel, S.; Guneralp, B.; Erb, K.H.; Haberl, H.; Creutzig, F.; Seto, K.C. Future urban land expansion and implications for global croplands. Proc. Natl. Acad. Sci. USA 2017, 114, 8939–8944. [Google Scholar] [CrossRef] [PubMed] [Green Version]
  36. Chen, G.Z.; Li, X.; Liu, X.P.; Chen, Y.M.; Liang, X.; Leng, J.Y.; Xu, X.C.; Liao, W.L.; Qiu, Y.A.; Wu, Q.L.; et al. Global projections of future urban land expansion under shared socioeconomic pathways. Nat. Commun. 2020, 11, 1–12. [Google Scholar] [CrossRef] [Green Version]
  37. Wu, Y.Z.; Shan, L.P.; Guo, Z.; Peng, Y. Cultivated land protection policies in China facing 2030: Dynamic balance system versus basic farmland zoning. Habitat Int. 2017, 69, 126–138. [Google Scholar] [CrossRef]
  38. Li, Y.; Zhao, B.; Huang, A.; Xiong, B.; Song, C. Characteristics and Driving Forces of Non-Grain Production of Cultivated Land from the Perspective of Food Security. Sustainability 2021, 13, 14047. [Google Scholar] [CrossRef]
  39. Wang, S.T.; Bai, X.M.; Zhang, X.L.; Reis, S.; Chen, D.L.; Xu, J.M.; Gu, B.J. Urbanization can benefit agricultural production with large-scale farming in China. Nat. Food 2021, 2, 183–191. [Google Scholar] [CrossRef]
  40. Zhou, Y.; Li, X.H.; Liu, Y.S. Cultivated land protection and rational use in China. Land Use Policy 2021, 106. [Google Scholar] [CrossRef]
Figure 1. Spatiotemporal distribution of grain-producing cultivated land (GPCL) and non-grain-producing cultivated land (NGPCL) in China from 2000 to 2018.
Agriculture 12 00860 g001
Figure 2. Grain-producing cultivated land (GPCL) changes from 2000 to 2018.
Agriculture 12 00860 g002
Figure 3. Expansion contribution factors of (A) non-grain producing cultivated land (NGPCL) and (B) grain-producing cultivated land (GPCL).
Agriculture 12 00860 g003
Figure 4. Superposition of grain-producing cultivated land (GPCL) expanding plaques and major contributors. (A) Superposition of grain-producing cultivated land (GPCL) expanding plaques and DEM. (B) Superposition of grain-producing cultivated land (GPCL) expanding plaques and GDP. (C) Superposition of grain-producing cultivated land (GPCL) expanding plaques and population (POP). (D) Superposition of grain-producing cultivated land (GPCL) expanding plaques and annual precipitation (PREL). (E) Superposition of grain-producing cultivated land (GPCL) expanding plaques and annual mean temperature (TEM).
Agriculture 12 00860 g004
Figure 5. Estimated grain-producing cultivated land (GPCL) distribution and changes in 2036.
Agriculture 12 00860 g005
Table 1. Driver Indicators.
CodeVariableData TypeSpatial Resolution
Climatic and environmental factors
PETPotential EvaporationRaster1 km
PRELAnnual PrecipitationRaster1 km
SLOPSlopeRaster30 m
TEMAnnual Mean TemperatureRaster1 km
DEMElevationRaster30 m
Accessibility factors
HWDdistance to highwayRaster1 km
RWDdistance to railwayRaster1 km
WDdistance to city roadRaster1 km
RVDdistance to riverRaster1 km
Socioeconomic factors
POPPopulationRaster1 km
GDPGDPRaster1 km
Table 2. GPrate for nine agricultural sub-regions.
Agricultural Zoning20002005201020152018
Northeast Plain29.10 32.65 45.98 54.32 59.26
Northern arid and semi-arid 18.65 19.77 24.21 29.31 27.15
Huanghuaihai Plain44.36 42.50 44.55 46.61 52.72
Loess Plateau Region24.23 23.86 28.04 30.51 27.91
Qinghai-Tibet Plateau16.80 10.65 11.54 11.76 10.02
Middle and lower reaches of the Yangtze River53.36 54.93 58.90 62.55 63.46
Sichuan Basin and surrounding areas 33.40 32.31 32.82 32.77 31.62
Yunnan-Guizhou Plateau38.96 39.98 40.10 51.58 47.28
Southern Region50.13 45.90 43.07 64.95 49.93
Nationwide36.98 37.35 41.60 46.93 47.18
Publisher’s Note: MDPI stays neutral with regard to jurisdictional claims in published maps and institutional affiliations.

