Article

A Rice Security Risk Assessment Method Based on the Fusion of Multiple Machine Learning Models

School of Artificial Intelligence, Beijing Technology and Business University, Beijing 100048, China
*
Author to whom correspondence should be addressed.
Agriculture 2022, 12(6), 815; https://doi.org/10.3390/agriculture12060815
Submission received: 28 March 2022 / Revised: 31 May 2022 / Accepted: 3 June 2022 / Published: 5 June 2022
(This article belongs to the Section Digital Agriculture)

Abstract

:
With the accelerated digital transformation, food security data is exponentially growing, making it difficult to process and analyze data as the primary challenge for food security risk regulation. The promotion of “big data + food” safety supervision can effectively reduce supervision costs and improve the efficiency of risk detection and response. In order to improve the utilization of testing data and achieve rapid risk assessment, this paper proposes a rice security risk assessment method based on the fusion of multiple machine learning models, and conducts experimental validation based on rice hazard detection data from 31 provinces in China excluding Hong Kong, Macao and Taiwan in 2018. The model comparison verifies that the risk assessment model shows better performance than other mainstream machine learning algorithms, and its evaluation accuracy is as high as 99.54%, which verifies that the model proposed in this paper is more stable and accurate, and can provide accurate and efficient decision-making basis for regulatory authorities.

1. Introduction

The frequent occurrence of food security incidents in recent years has placed higher demands on food security regulation, and countries around the world have introduced a series of stringent food security regulation policies. To further strengthen risk monitoring, risk assessment and supply chain management, and to improve the efficiency of risk detection and response, government departments at all levels are vigorously promoting the digitalization of food safety, strengthening “big data + food” regulation, and bringing into play the advantages of big data, artificial intelligence and other technologies in the areas of food security risk assessment and regulation.
Currently, food security risk assessment methods include qualitative assessment methods, quantitative assessment methods, and comprehensive risk assessment methods [1]. Qualitative assessment methods are mainly based on the knowledge and experience of the assessor to analyze risk indicators, among which, single expert-based assessment methods are relatively mature, including the Index Scoring Method [2], the Analytic Hierarchy Process (AHP) [3], Decision-Making Trial and Evaluation Laboratory (DEMATEL) [4]. The methods based on multiple experts are mainly divided into two categories: subjective weighting methods and objective weighting methods [5,6]. Subjective weighting methods are mostly based on an expert priori information to classify expert weights, such as reputation and knowledge, and calculate the risk values based on the results of the expert weights. There are many advanced subjective weighting methods in the existing literature, among which the more pioneer or outstanding research are as follows. (1) Combining D-S evidence theory and multi-objective planning theory, Du et al. investigated a weighting method based on expert knowledge structure analysis, which effectively took into account the opinions of various experts and improved the consensus of the cluster [7]. (2) Combined with the probabilistic language dominance scoring method, Wan et al. proposed a weighting method based on the individual semantics and psychological behavior of decision makers, and verified the effectiveness of the method through examples [8]. Objective weighting methods are mostly based on the degree of consistency of the experts’ assessment results to classify expert weights, and the risk values are also calculated based on the results of the expert weights. A large amount of literature has been presented to solve the multi-attribute group decision-making problems with objective weighting methods, among which the more pioneer or outstanding research are as follows. (1) Based on the results of online reviews of customers, Darko et al., presented a weighting method for probabilistic linguistic dominance scores based on the Latent Dirichlet Allocation model, and constructed an index evaluation system in an objective manner [9]. (2) Based on the possibility degree and the divergence degree, Wang et al. proposed an interval-valued intuitionistic fuzzy MAGDM method to derive decision makers’ weights [10]. (3) Based on the similarity degree-based clustering method, Gou et al. established a consensus building process with double hierarchy hesitant fuzzy linguistic preference relations to advise the identified experts to adjust their assessments [11]. In practical decision-making, qualitative assessment methods based on multiple experts are more credible and more widely used [12].
Quantitative assessment methods are based on the data to establish a mathematical model and use the mathematical model to calculate the risk value of the index [13]. Commonly used methods include Fuzzy Comprehensive Evaluation Method (FCE) [14], Grey Relational Analysis (GRA) [15], Support Vector Machine (SVM) [16], Back-Propagation Network (BP) [17], Long Short-Term Memory (LSTM) [18], Extreme Gradient Boosting (XGBoost) [19] and the Light Gradient Boosting Machine (LightGBM) [20]. The machine learning algorithms have strong adaptive learning capabilities and are widely used in food security risk assessment. Among them, the more advanced research are as follows. (1) Combined red cabbage anthocyanin labels and back propagation (BP) neural network, Fang et al. proposed a smartphone application to form a simple system for quickly scanning tags and identifying fish freshness in real-time [21]. (2) Based on artificial neural network, Saeed et al. proposed a multisensor monitoring and water quality prediction method for live ornamental fish transportation, and the effectiveness of the method is verified by an example [22]. (3) Carlo et al. based on artificial intelligence model predicted optimal food structures, which has been proposed and applied to pasta, in particular using descriptions of the structural changes that occur when cooking [23].
The comprehensive risk assessment method is a combination of qualitative and quantitative assessment methods [24], which constructs an index system through qualitative assessment methods, and builds a risk assessment model based on the index system and quantitative assessment methods, thereby achieving accurate and efficient risk assessment. Among them, the more advanced research are as follows. (1) Based on the agglomerative hierarchical clustering-radial basis function (AHC-RBF) neural network, Geng et al. proposed an improved early warning approach for assessing and controlling food safety risk [25]. (2) Lin et al. proposed an improved interpretative structural modeling (ISM) method based on the grey relational analysis (GRA-ISM) to hierarchical analyze influencing factors of food safety [26]. (3) Combined semi-quantitative scoring method, Li et al. proposed a fuzzy comprehensive analysis models based on metrics system and ranking mode to evaluate typical chemical hazards in specific foods and rank risks across multiple foods [27].
Table 1 shows a comparison of the advantages and disadvantages of mainstream risk assessment methods.
Based on the comparison of the advantages and disadvantages of the risk assessment methods in Table 1, qualitative assessment methods have higher labor costs and a longer assessment process, while quantitative assessment methods have problems such as lower accuracy of indicators or weaker overfitting performance, making the accuracy of the risk assessment results low and time costs high, resulting in the lack of the ability to pinpoint risk values. Therefore, this paper selects a comprehensive risk assessment method that combines subjective and objective methods to build a rice security risk assessment method, using the more mature AHP algorithm in qualitative assessment methods to statistically summarize the results of expert scoring for each indicator, and combining unsupervised clustering algorithms for high-dimensional data to construct a set of weighting model of group decision making based on indicator weight distribution, in order to build a rice hazard risk assessment index system in a more objective way. In addition, in the construction of the rice security risk assessment model, machine learning algorithms have faster risk identification capability than traditional mathematical models. Thus, this paper constructs an assessment model based on machine learning. In addition, considering the low accuracy of single machine learning model assessment, in order to further improve the accuracy of the assessment model, this paper integrates the advantages of integration, classification and optimization algorithms, and constructs a rice security risk assessment method based on the fusion of multiple machine learning models.

2. Materials and Methods

2.1. Data Cleaning

This article uses the data of rice hazards testing in 31 provinces of China excluding Hong Kong, Macao and Taiwan in 2018 as the basis for example analysis, this data includes provinces, test time, test element and results, etc. The test element includes chromium, benzo[α]pyrene, lead, inorganic arsenic, aflatoxin B, etc.; the different types of hazards are divided into heavy metal hazards, mcotoxin hazards, pollutant hazards, etc. [28,29]; the results are divided into specific values, less than a specific data or not detected; the results are judged as qualified or unqualified. A sample of rice hazards testing data is shown in Table 2.
In order to extract valid information from the multivariate data, noise filtering, data integration and data normalization are performed sequentially on the test data.
(1)
Noise filtering. Noise in this paper refers to statistical errors caused by errors in the recording of units, as the hazard test results, test units and result are separate from each other, and noise filtering means removing data where the sample test results are determined to be inconsistent with the test results.
(2)
Data integration and data normalization. As the different formats of detection results are not conducive to subsequent risk assessment model construction, the detection data format is unified as floating point and the unified hazard detection results are standardized using a trapezoidal membership function, as shown in Equation (1).
C ( x i ) = { 0 x i x min x i x min x max x min x min < x i x max 1 x i x max }

2.2. Construction of a Risk Assessment Index System for Rice Hazards

Considering that experts have different levels of knowledge, experience and familiarity with rice hazard indicators, this paper constructs a rice hazard risk assessment index system based on the scoring results of experts in order to combine the scoring characteristics of different experts. Firstly, an unsupervised classification of the expert scores is carried out, and a weighting model of group decision making based on the weight assignment of the indicators is constructed by combining the unsupervised clustering algorithm applicable to high-dimensional data, so as to construct the rice hazard risk assessment index system in a more objective way.The specific process is shown in Figure 1.

2.2.1. Calculation of Assessment Index Weights Based on AHP Algorithm

Analytic Hierarchy Process is a systematic analysis method that enables multi-objective decision analysis to be carried out scientifically [30]. In the process of calculating the index weights, AHP hierarchically identifies the rice hazards to be analyzed according to the different types of hazards, and assigns the corresponding weights to each hazard index based on the expert scoring results. In this paper, a total of 50 valid expert scoring questionnaires are collected, and a judgment matrix A k × k as shown in Equation (2), is constructed based on the expert scoring results, where k is the number of hazard indicators.
A k × k = [ a 11 a 12 a 1 k a 21 a 22 a 2 k a k 1 a k 2 a k k ]
The maximum characteristic roots λ max and the weight of each expert’s evaluation index W = [ w 1 , w 2 , , w k ] T are calculated based on the judgment matrix A k × k , as shown in Equations (3)–(5).
A W = λ max W
w i = j = 1 k a i j k i = 1 k j = 1 k a i j k
λ max = i = 1 k ( A W ) i n w i

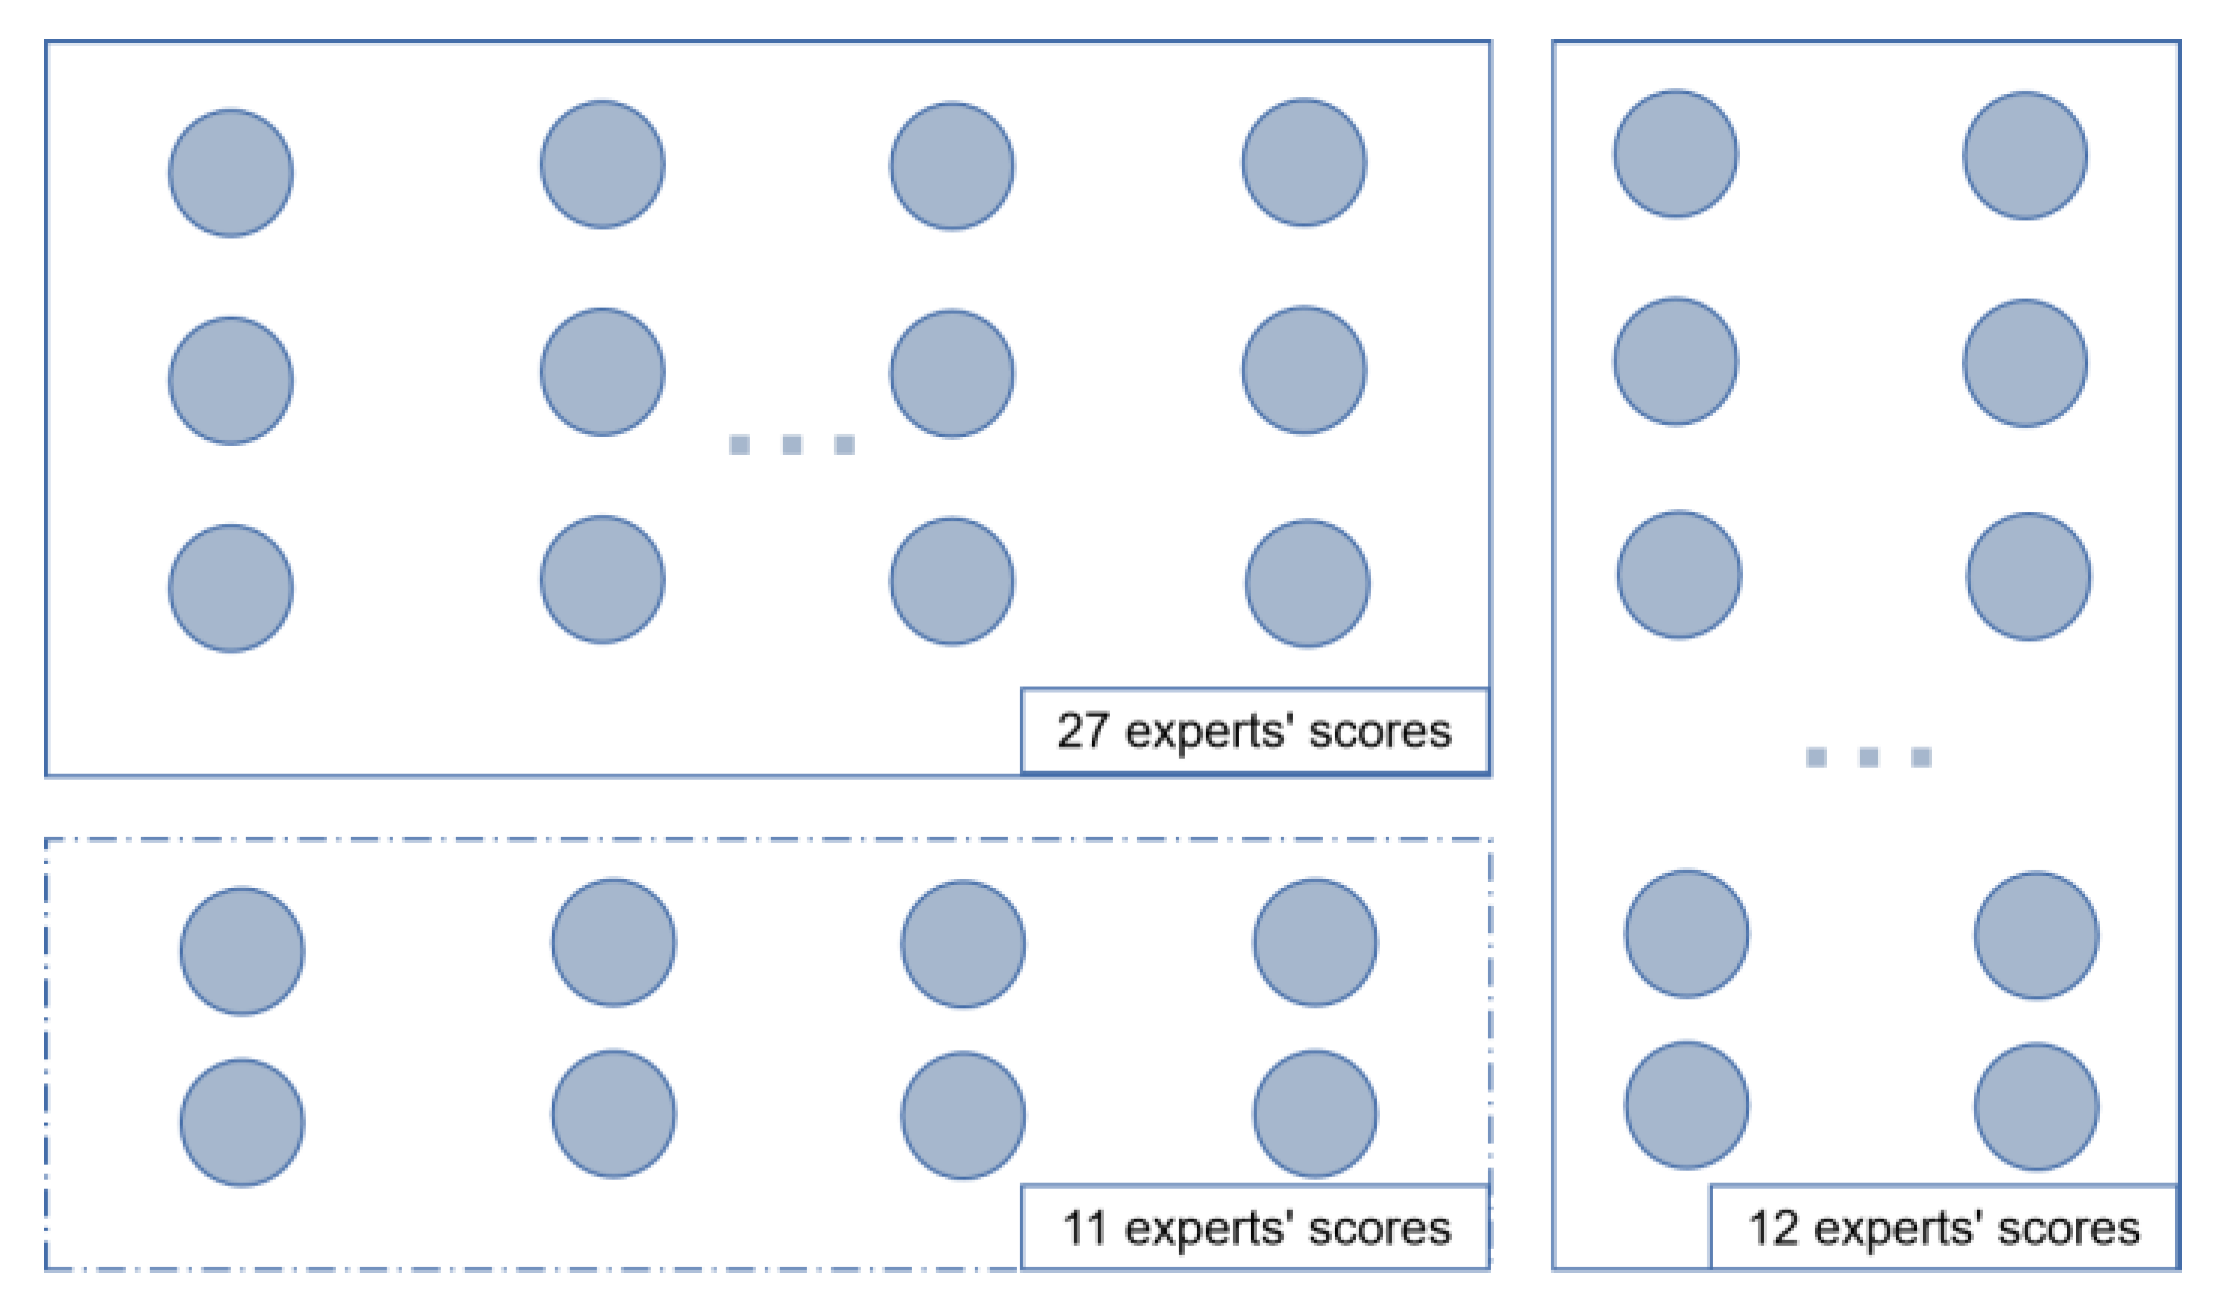
2.2.2. Calculation of Assessment Index Weights Based on SC Algorithm

In order to improve the objectivity of index weights and reduce subjective errors, this paper adopts the Spectral Clustering algorithm (SC) [31], which is suitable for high-dimensional clustering, adaptable to data distribution and has excellent clustering effect, is used to unsupervisedly classify the expert scoring results by combining the scoring characteristics of different experts. In terms of SC algorithm parameter selection, in order to achieve optimal clustering results, Calinski_Harabaz_score (CH_score) was chosen to evaluate the clustering effect, and the sample points were clustered into clusters C ( C = { c 1 , c 2 , c h } ) by comparing the size of CH_score as shown in Equation (6).
CH _ score = tr ( B K ) tr ( W K ) × n E k k 1
In Equation (6), Bk is the intra-class distance and Wk is the inter-class distance, C q indicating the class q where the current point is located. According to the principle of Spectral Clustering, the larger the CH_score, the better the clustering effect, and the parameters are chosen according to Table 3.
As can be seen from the size of CH_score in Table 3, the expert scoring results are divided into 10 classes, with random numbers chosen as 12, and the Figure 2 shows the SC algorithm clustering results.
As the number of experts in categories 3 to 10 is relatively small, they are combined into one category under the premise of ensuring minority rule. In summary, the 50 experts’ scores are divided into 3 categories, the first category contains 27 experts’ scores, the second category contains 12 experts’ scores, and the third category contains 11 experts’ scores.

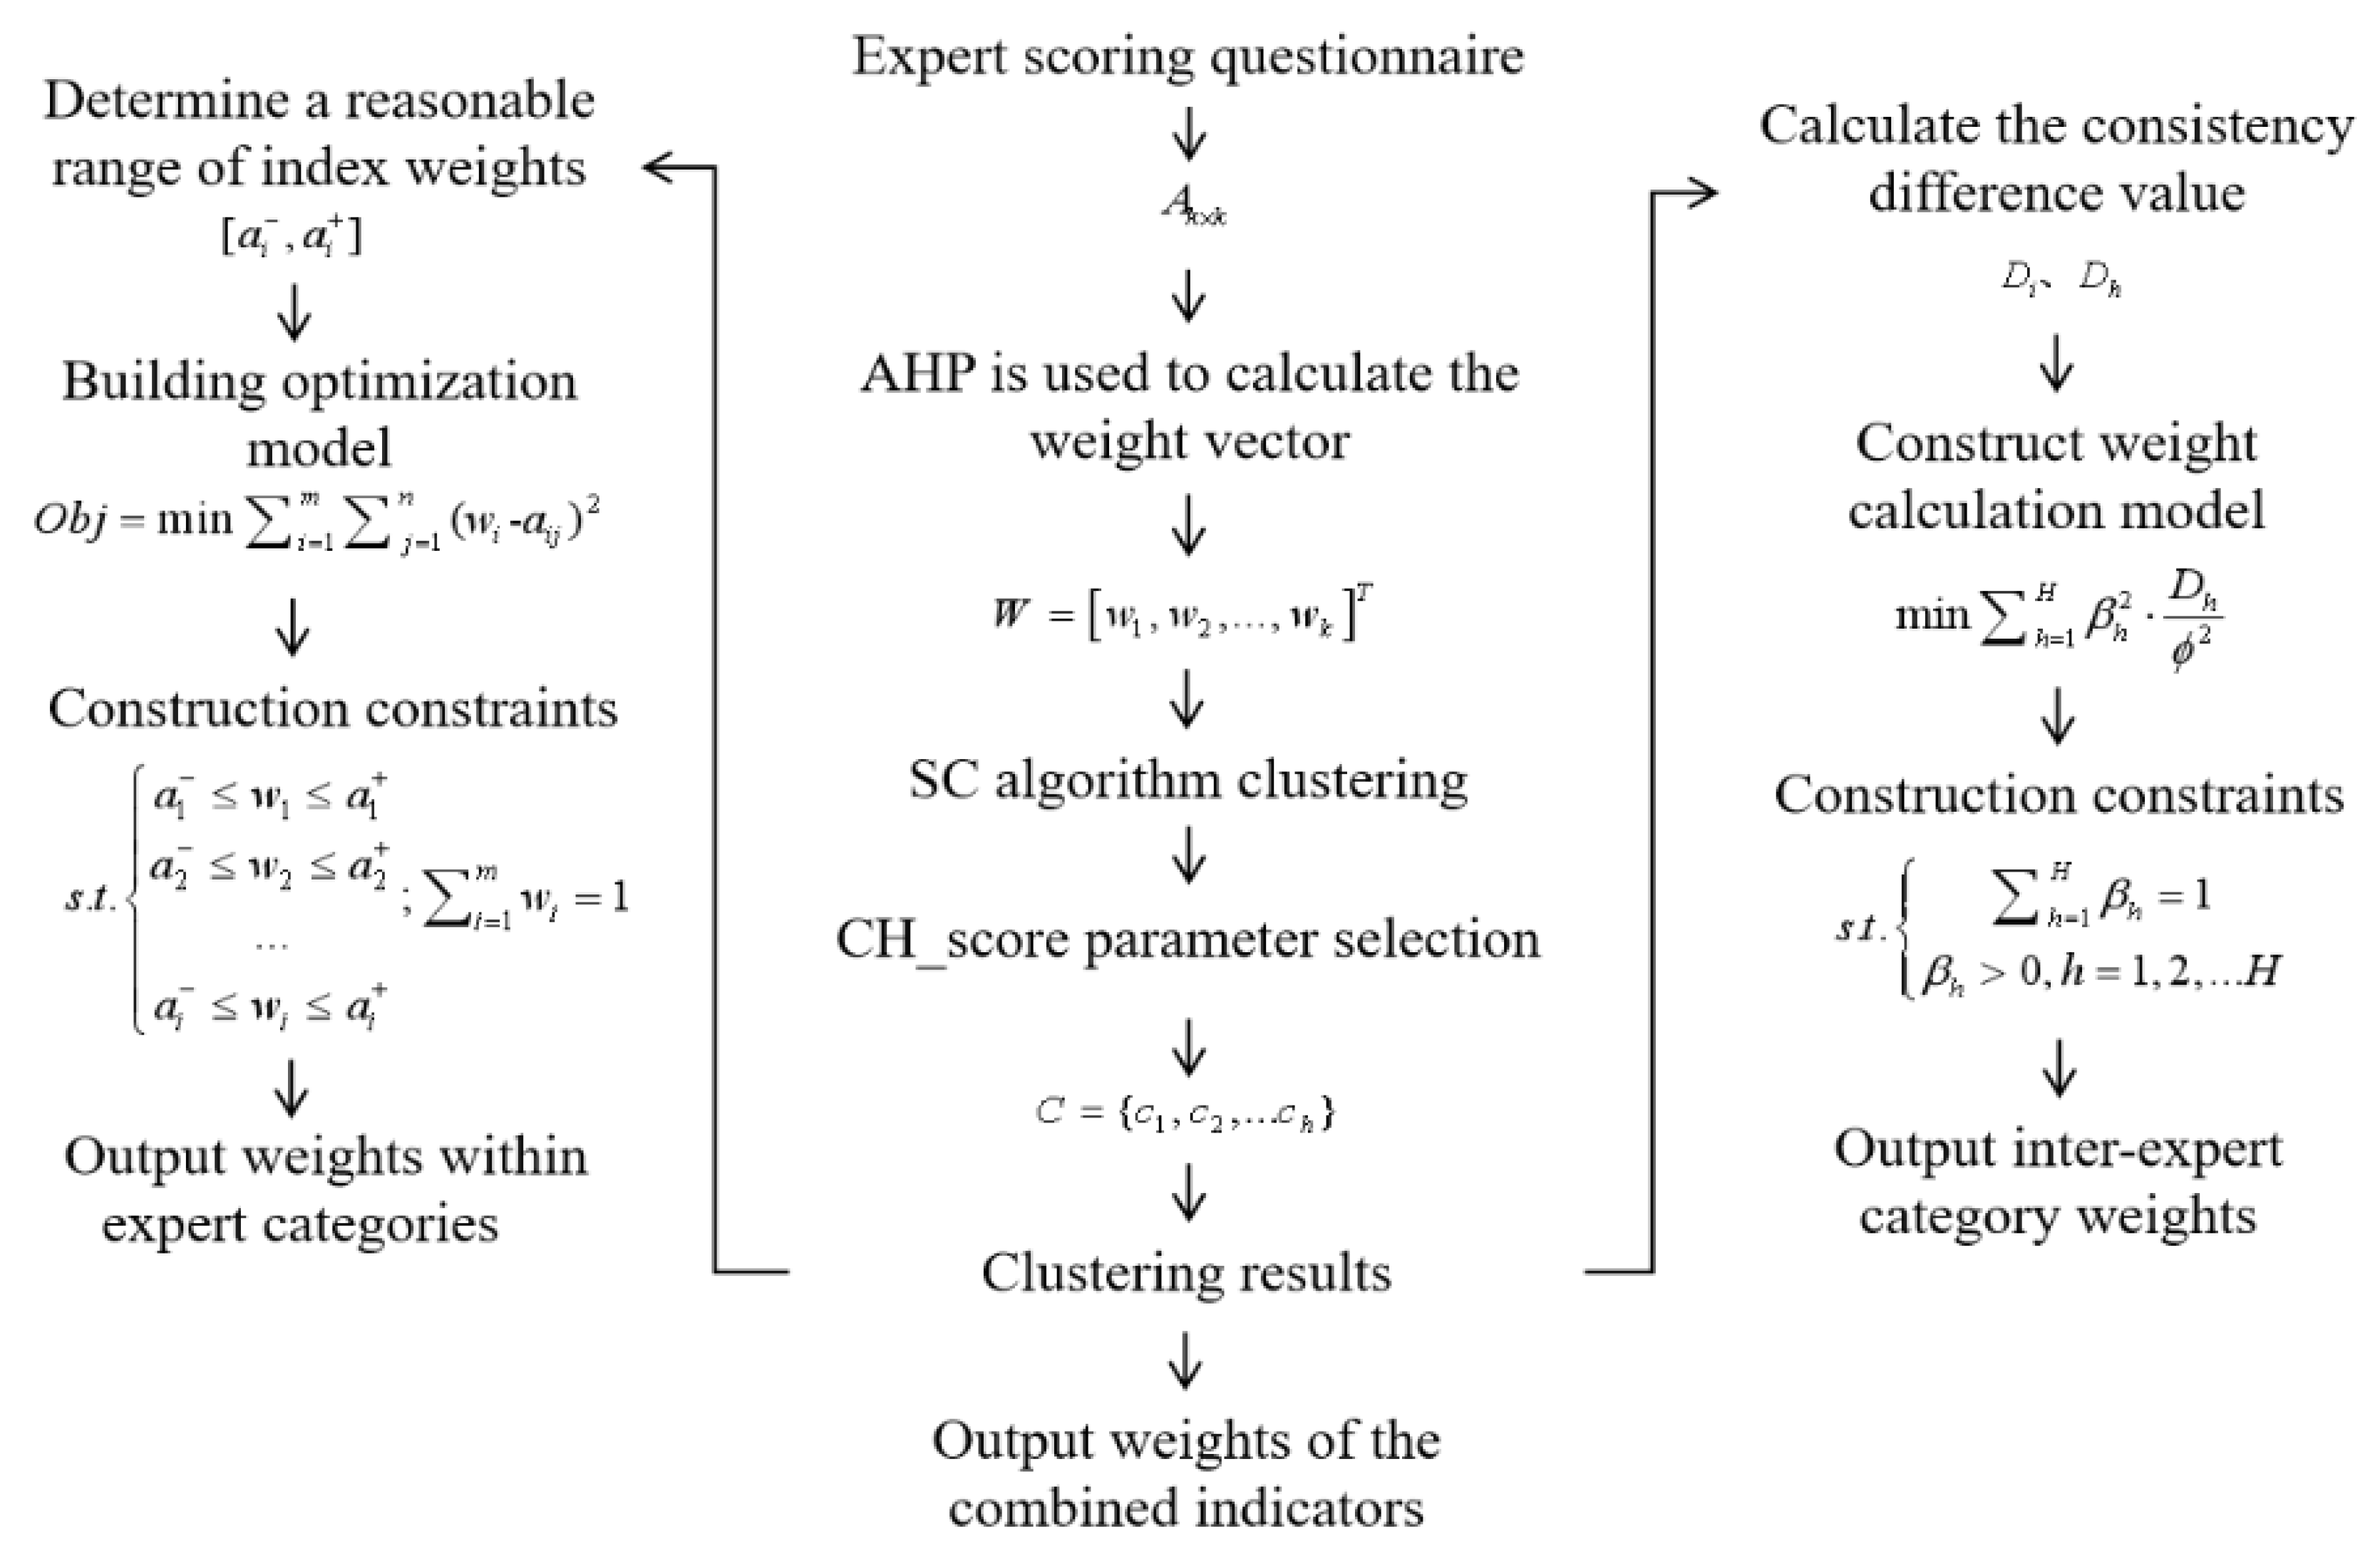
2.2.3. Calculation of Combined Risk Values Based on Indicator Weights

In order to maximize the useful information of all experts and ensure the effectiveness of group decision making [32], this paper starts from the indicator layer and constructs a weighting model of group decision making based on the calculation results of the indicator weights of the experts, so as to solve the combination assignment problem in group decision making in an objective way.

2.2.3.1. Calculation of Weighting between Specialist Categories

For the calculation of indicator weights between expert categories, this paper is based on the Section 2.2.2. expert classification results. m experts are assigned to score the results into H categories, where H = { h 1 , h 2 , h k } . In each cluster h i , the greater the number of experts within the category and the smaller the consistency difference value. The h i relatively high weight value is assigned. The specific principle is shown as follows.
Let the assessment result of the i -th expert be w i , which belongs to the category h i , and h i contains the assessment results of ϕ experts. The consistency weight difference value of w i and the assessment results of other experts is D i as shown in Equation (7), and the consistency weight difference value between the category h experts and the category of other experts is D h as shown in Equation (8).
D i = i = 1 m j = 1 , i j m ( w i w j ) 2 , { i = 1 , 2 , , m ; j = 1 , 2 , , m }
D h = 1 ϕ i = 1 m D i , ( i H h )
Based on a comprehensive consideration of the number of experts and consistency difference value, the model and constraints for calculating the weight among experts are obtained, as shown in Equations (9) and (10).
min h = 1 H β h 2 D h ϕ 2
s . t . { h = 1 H β h = 1 β h > 0 , h = 1 , 2 , H
The formula gives the inter-expert category weights β h , as shown in Equation (11).
β h = ϕ 2 D h 1 h = 1 H ϕ 2 D h

2.2.3.2. Calculation of Weights within Expert Categories

In terms of calculating weights within expert categories, this paper also starts from expert indicator weights, conducts consistency tests on expert assessment results, eliminates indicator weights that do not pass the consistency tests, determines reasonable intervals for indicators, and constructs an optimization model for weights within expert categories, with the following principles.
(1)
Determine the reasonable interval of indicators. Let a cluster contain the weight information given by n experts, then each risk indicator has n weight values, using the density distribution of n weights of the indicators, to determine the reasonable interval of indicators. Where a i j is the j -th expert for the i -th indicator to give the weight value, for the indicator i , all experts can accept the indicator value range is [ a i * , a i * + ] , meet a i * = min ( a i 1 , a i 2 , , a i n ) ; a i * + = max ( a i 1 , a i 2 , , a i n ) ; indicator value of the interval length is d , meet d i = a i * + a i * . Let δ = d i / 2 , and δ is the consistency test criteria. If a i j does not contain other indicator values in δ field, then a i j is a singularity. By traversing all indicator values and removing all singularities, a reasonable interval [ a i , a i + ] for each indicator is determined.
(2)
The optimization model of weights within expert categories is constructed. In order to maximize the integration of expert opinions within a reasonable interval, the objective function O b j as shown in Equation (12), in the model satisfies the minimum deviation of the combined weight value w i within the expert categories and the weight value of each expert indicator a i j ; the constraint in the model is w i to be within a reasonable interval of indicators and the sum of the weight values of i indicators is 1, as shown in Equation (13).
O b j = min i = 1 m j = 1 n ( w i a i j ) 2
s . t . { a 1 w 1 a 1 + a 2 w 2 a 2 + a i w i a i + ; i = 1 m w i = 1
(3)
Based on the results of the optimization model for weighting within expert categories, Section 2.2.2. the results of the section clustering and the results of the Section 2.2.3.1. inter-expert category weighting, the weights within expert categories and the weights of the combined elements are obtained as shown in Table 4.

2.3. A Fusion Algorithm-Based Model for Rice Safety Risk Assessment

As an integrated fusion algorithm, the Stacking model first decomposes the original input data set into several subsets, which are input to each base learner, and each base learner outputs its own classification results and serves as the input of the second layer of meta-learner, so as to achieve the purpose of correcting the error of the first layer of classification prediction model, thus improving the accuracy of the model classification prediction [33]. To ensure the accuracy of the fusion model evaluation, the choice of learners should ensure that each learner has good independent prediction capability [34]. At the same time, considering that the machine learning algorithm has many tuning hyperparameters, it is time-consuming and inaccurate to adjust the model parameters manually or to iterate through the values of all parameters, so it is necessary to optimize the model tuning parameters according to the principle of the algorithm combined with the corresponding tuning hyperparameters to make the model performance reach the best.

2.3.1. Learners

XGBoost Algorithm

XGBoost [35] is a decision tree model that supports parallel computing based on the Gradient Boosting Decision Tree (GBDT) algorithm, optimized by Dr. Tianqi Chen of the University of Washington, USA. In the model training, XGBoost introduces a function regularizer in order to prevent the number of leaf nodes in the decision tree from growing infinitely and speed up the model. To reduce model complexity and the risk of model overfitting, the iterative addition tree of the objective function in XGBoost is combined with a regularization term; to speed up the gradient descent of the objective function and further increase the speed of the model run, XGBoost performs a Taylor expansion of the objective function. To speed up the splitting of leaf nodes and again improve the efficiency of the model run, XGBoost uses the greedy algorithm to seek the optimal partitioning solution, which improves the model run speed while preventing overfitting.

LightGBM Algorithm

LightGBM is a decision tree integration algorithm based on the GBDT algorithm by the Microsoft DMTK team, combined with the Leaf wise algorithm, Gradient-based One-Side Sampling (GOSS), Exclusive Feature Bundling (EFB) and Histogram algorithms. (1) Leaf wise algorithm. LightGBM differs from most decision trees in that it does not simply grow the leaf nodes in a hierarchical order for the splitting of leaf nodes, but instead finds the leaf node with the greatest splitting gain from all the nodes in the current decision tree and splits it in a circular fashion to produce the tree. Leaf-wise algorithm greatly reduces the calculation of splitting the leaf nodes with lower gain, and when the number of splits is the same, Leaf-wise can effectively reduce the error and improve the accuracy; (2) Histogram algorithm. In the division point selection, LightGBM uses the Histogram algorithm to discretize continuous features into k features to construct a histogram. When traversing the data, Histogram relies on the discretized value as the index, and finds the optimal division point based on the cumulative statistics of the index. Due to k < < data , the Histogram algorithm reduces the time complexity from o ( data × f e a t u r e ) to o ( k × f e a t u r e ) , effectively reducing the running memory usage; (3) GOSS algorithm. LightGBM uses the GOSS algorithm for sample sampling optimization on the basis of the Histogram algorithm division, while retaining all large gradient samples, sampling small gradient samples, i.e., gradient sorting of the training data. a % data samples with the largest gradient are retained, the data samples with lower a % gradient are randomly selected b % , and the information gain of the small gradient data is multiplied by a correction factor when calculating the information gain, thus amplifying the information gain of the small gradient samples; (4) EFB algorithm. To further improve the efficiency of LightGBM, the EFB algorithm is used to bind mutually exclusive features in the dataset together to form a low-dimensional feature set. In the operation of the algorithm, a corresponding table recording non-zero-value features is created for each feature indicator, and the calculation of 0 value features is avoided by scanning the data in the table, thus effectively saving the time and space overhead in the operation of the algorithm.

LSTM Algorithm

Recurrent Neural Networks (RNN) is a deep learning network with a chain structure, which can make information flow between layers at each layer of the network. Therefore, the characteristics make RNN have the function of information memory. In the model training, LSTM [36] is based on RNNwith the addition of three kinds of gates: forgetting gate, input gate and output gate, where the input gate is responsible for the stimulus intensity of the new input to the memory unit, the forgetting gate is responsible for the memory intensity of the information at the previous time, and the output gate is responsible for the content intensity of the memory unit output to the outside. These three “gate” adopt different activation functions and calculation methods, effectively overcome the problems of network paralysis caused by RNN gradient explosion, and play an advantage in long-time sequence modeling. Meanwhile, compared with other algorithms, LSTM is insensitive to the interval length requirement and can maintain good memory for longer historical data information.

2.3.2. Optimization Algorithms

BOA Algorithm

Bayesian optimization algorithm [37] (BOA) is an approximate approximation algorithm based on probability distribution, which uses an agent function to fit the relationship between tuning hyperparameters and model evaluation, establishes an initial set of candidate solutions, finds the next point that is likely to be the extreme value according to the points in the set, and adds that point to the set, repeats the steps until the iteration terminates, and the combination of hyperparameters that works best is obtained by the iteration results, and can therefore be seen mathematically as a globally optimal solution to an unknown objective function, and is mostly suitable for optimization of algorithms with a large number of tuning hyperparameters.

GWO Algorithm

Grey Wolf Optimization Algorithm [38] (GWO) is an algorithm inspired by the hunting behavior of grey wolf packs. The process of GWO to find the optimal solution of the model can be regarded as grey wolves under the leadership of α , β , δ wolves, through mutual collaboration and feedback of each rank to ensure the correctness of the decision and increase the probability of successful hunting. The GWO algorithm can therefore be abstracted to solve combinatorial optimization problems on continuous spaces, and has the advantages of simple algorithm structure and convergence speed, and is therefore widely used in practical engineering optimization problems.

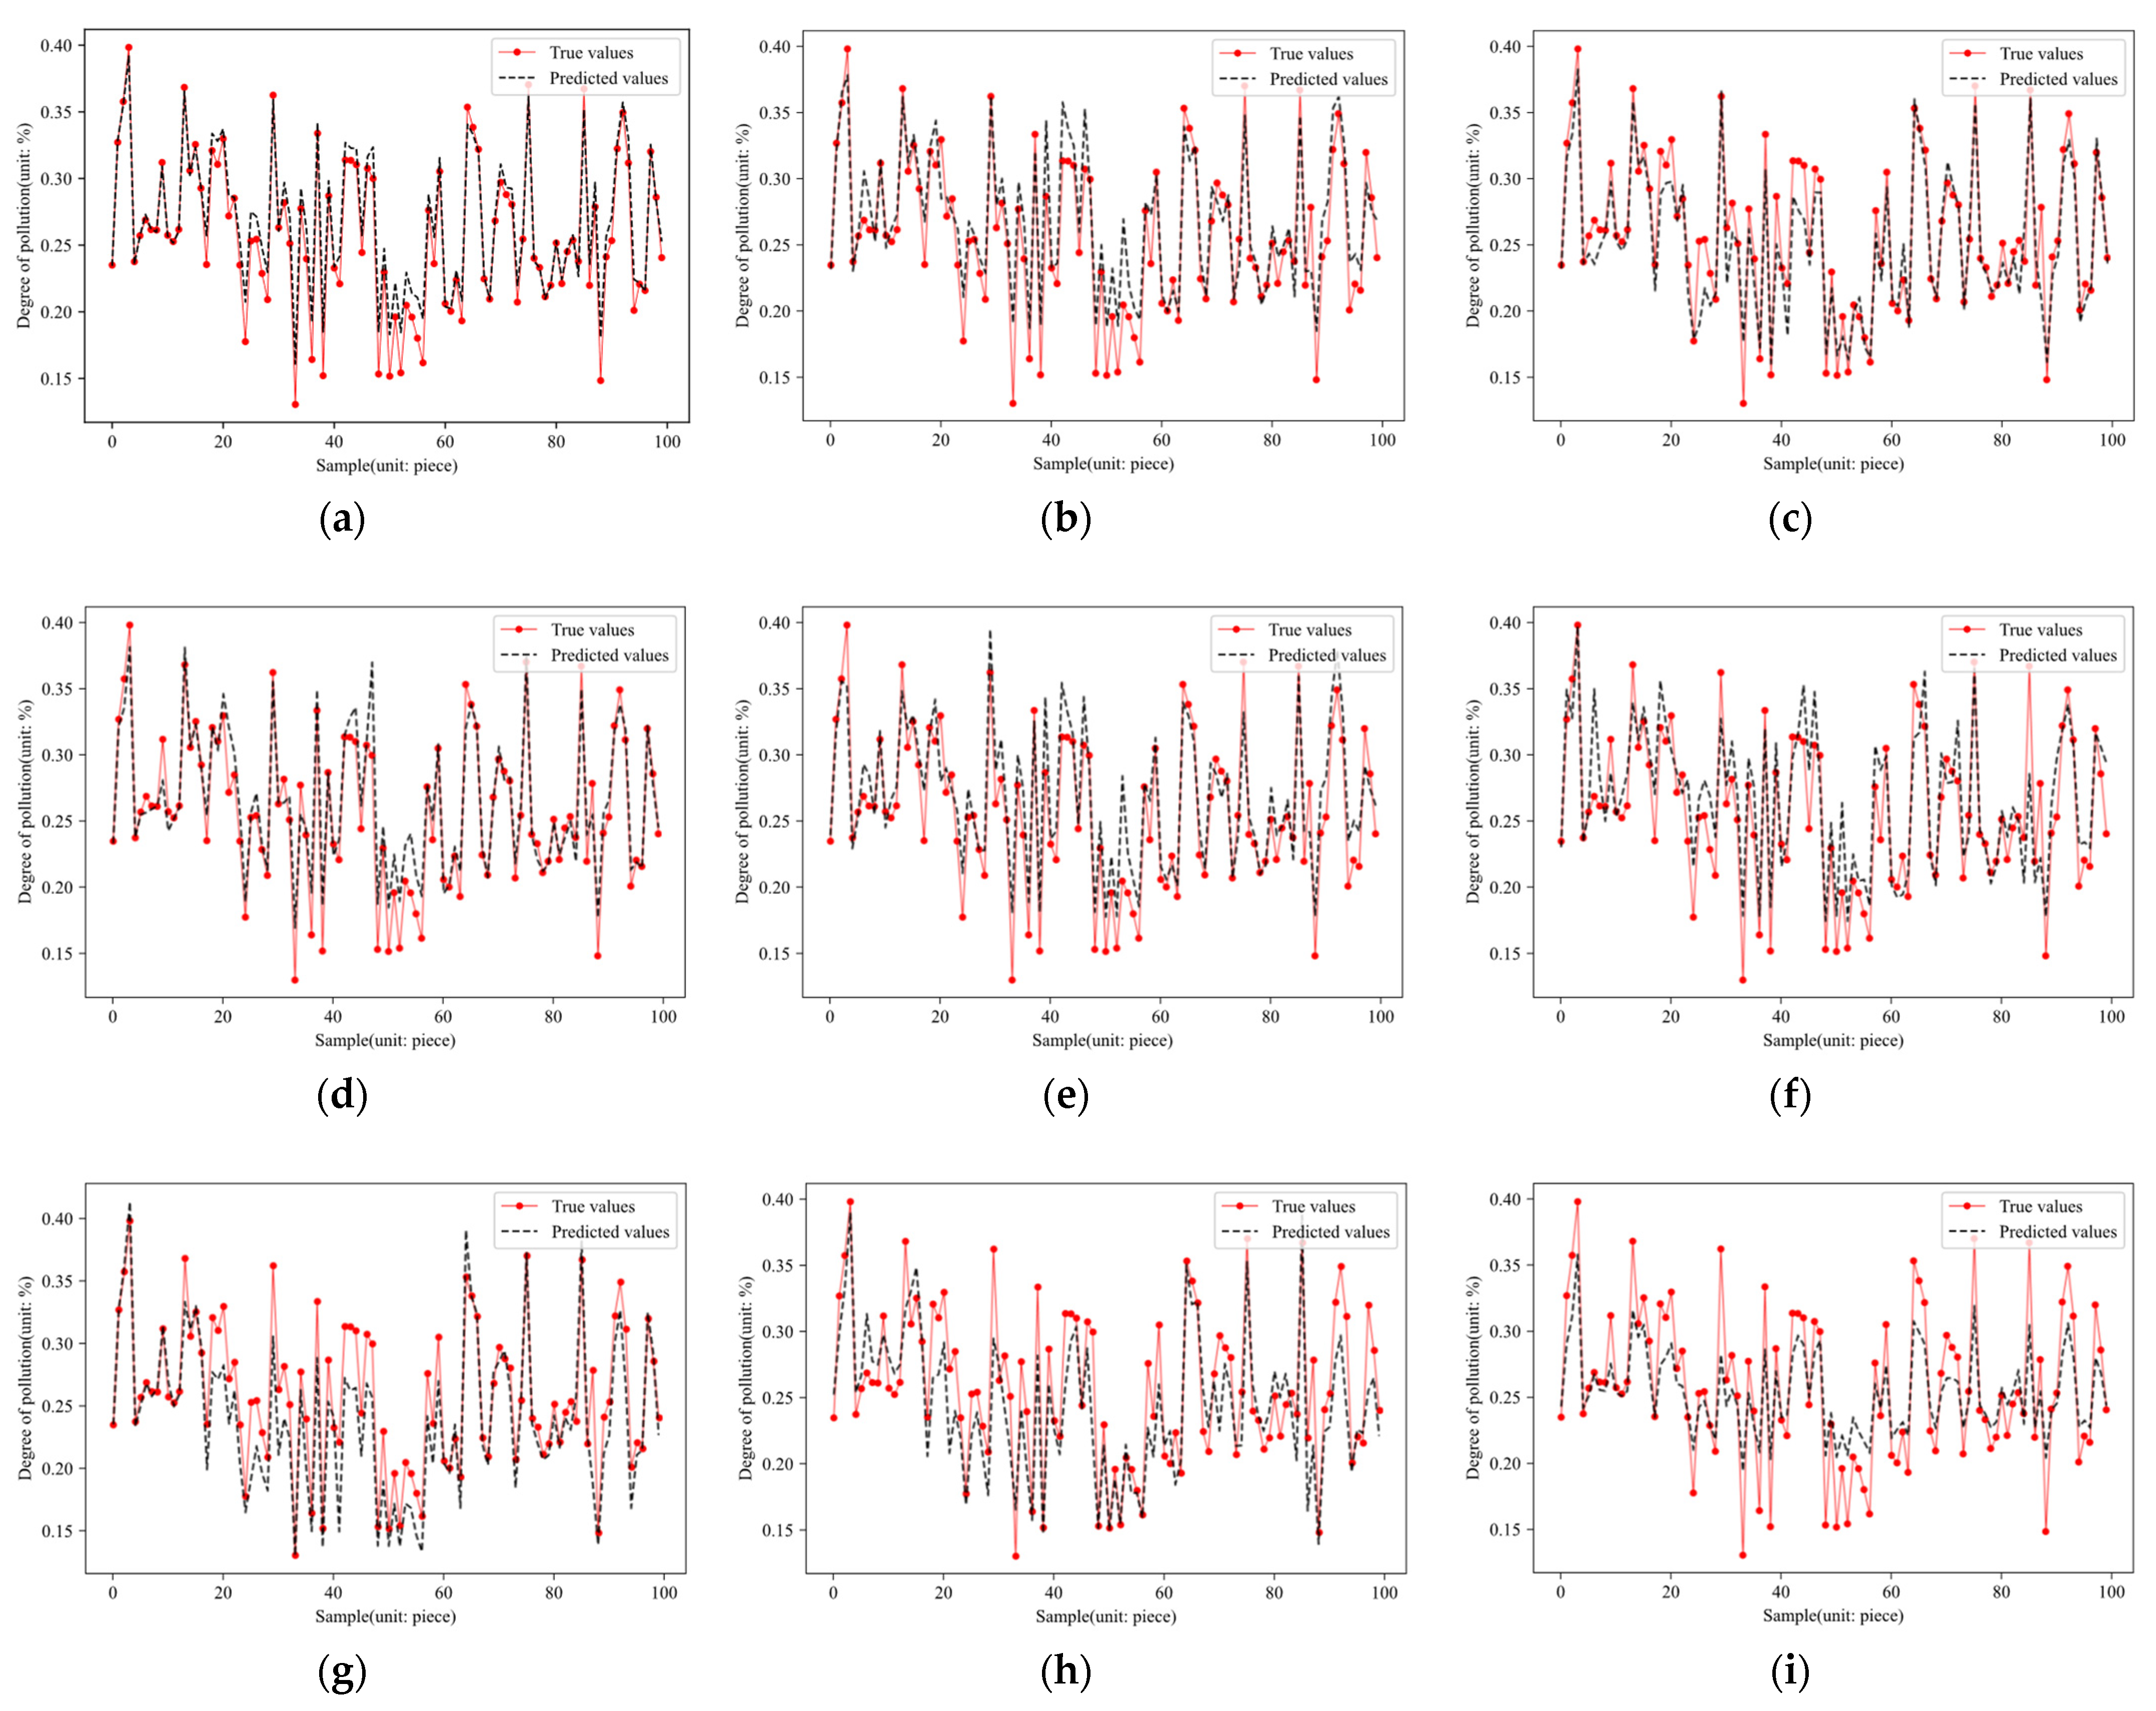
Fusion Model Architecture

This paper constructs a multi-machine learning model fusion method for rice security risk assessment based on the Stacking model and selects XGBoost and LightGBM with strong generalization ability as the base learners; in order to achieve effective complementation of information between algorithms, LSTM, which differs greatly from the principle of the base learners, is selected as the meta-learner to build the fusion model. In order to improve the accuracy of the model operation and save the time of manual tuning, for the tree model with more tuning hyperparameters, the BOA algorithm is chosen to rate the parameters of XGBoost and LightGBM models; for the neural network algorithm with slow training speed, the GWO with fast convergence speed is chosen to automatically find the initial weights, thresholds and the number of hidden layer neurons of the LSTM algorithm, and the fusion model (BXGB -BLGB-GLSTM) architecture is shown in Figure 3.

3. Results

The experimental environment in this paper is Windows 11 operating system with AMD Ryzen 5 5500U with Radeon Graphics produced by AMD and 8G RAM, relying on the Jupyter Notebook platform implemented through Python 3.9.7. Based on this computer configuration, using the risk assessment model mentioned above, under the condition that the training times of each algorithm are 200 times, the comparison between the combined risk values of the hazards and the predicted values of the different models is obtained in Figure 4, where the axes represents the sample numbers; the axes indicates the level of degree of pollution.
As can be seen from the 9 individual model comparison curves in Figure 4, when y ( 0.2 , 0.35 ) , the accuracy of each model prediction was relatively high; when y ( 0 , 0.2 ) ( 0.35 , + ) , some of the models fit generally well, i.e., they are prone to overestimation (underestimation) of pollution levels at higher (lower) hazard contamination levels.
In order to compare the experimental results of each model more clearly, this paper uses the indexes of R-Square R 2 , mean absolute error M A E and mean squared error M S E to evaluate the models, and the calculation of each index is shown in Equations (14)–(16).
R 2 = ( i = 1 n ( y o i y ¯ o ) × ( y m i y ¯ m ) ) 2 i = 1 n ( y o i y ¯ o ) 2 × i = 1 n ( y m i y ¯ m ) 2
M A E = i = 1 n | y o i y m i | n
M S E = i = 1 n ( y o i y m i ) 2 n
In Equations (14)–(16), n is the sample data volume; y o and y m represent the true and predicted values of the level of degree of pollution; y o and y m represent the mean and average predicted values of the level of degree of pollution, respectively. The magnitude of R 2 is positively correlated with the degree of curve fit; M A E and M S E are important indicators of the accuracy of the variables and are negatively correlated with the accuracy of the model. A comparison of the parameters of each algorithm is shown in Table 5.
From the comparison of the evaluation indicators of each algorithm in Table 5, it can be seen that the model fusion has indeed improved the accuracy of evaluation and prediction to a certain extent, and the greater the principle difference between algorithms, the higher the evaluation accuracy. Among them, the BXGB-BLGB-GLSTM fusion model outperforms the other evaluation models validated by the comparison in terms of R 2 , M A E , M S E three evaluation indicators, with the mean absolute error is 0.0114, the mean squared error is 0.0002, and the R-Square is 93.17% This further confirms that the fusion model constructed in this paper can intuitively and accurately assess the risk value of comprehensive food safety hazards.

4. Discussion

Although the risk assessment method of rice hazards constructed in this paper has improved the accuracy and efficiency of risk assessment to a certain extent, there are still some shortcomings in the method, for example, in the process of constructing the hazards index system, although the subjectivity of the hazards index weights has been reduced based on the objective expert assignment of group decision making, the subjectivity of the source of the hazards index scoring still cannot be avoided. Therefore, the focus of my subsequent research will be on unsupervised scoring, based on big data processing techniques to assist in extracting relevant potential information and further enhance the objectivity of risk assessment.

5. Conclusions and Future Prospects

5.1. Conclusions

In the process of large-scale and digital transformation of agriculture, in order to strengthen the advantages of big data and artificial intelligence technology in food safety risk assessment and supervision, a rice security risk assessment method is designed based on the fusion of multiple machine learning model. In the construction of the index system, aiming at the problem that the qualitative assessment methods are greatly affected by the prior information such as expert knowledge and experience, this paper reduces the impact of a single expert on the index system by integrating the evaluation opinions of experts in different fields. The method starts from the hazard index level, implement expert classification based on the AHP algorithm and SC algorithm, and construct an optimization model to solve the intra-expert category weights and inter-expert weights results, respectively, by combining the consistency weight differences of expert assessment results, effectively considering the opinions of all experts while ensuring that the minority follows the majority, and lay a foundation for the subsequent con-struction of the risk assessment model. Then, in terms of risk assessment model construction, aiming at the problem that the risk assessment model constructed by a single algorithm is difficult to fully mine multiple and complex hazard detection data, this paper constructs a BXGB-BLGB-GLSTM risk assessment model based on algorithm fusion, which strengthens the advantages of each algorithm to a greater extent, so as to provide more accurate risk assessment results. The results show that the BXGB-BLGB-GLSTM fusion model has higher evaluation accuracy and stability, which can provide accurate and efficient decision-making basis for food safety supervision departments.

5.2. Discussion and Future Work

In the process of the digital transformation of agriculture, in order to promote “big data +food” safety supervision, and give full play to the advantages of big data and artificial intelligence in the fields of food safety risk assessment and supervision. This paper proposes a rice safety risk assessment method based on multi machine learning model fusion, and the simulation experiments show that this method improves the accuracy of risk assessment to a certain extent and can provide technical support for relevant regulatory authorities. However, there are still some deficiencies that need to be further improved. On the one hand, in the construction of hazard index system, this paper constructs a rice hazard risk assessment index system based on the scoring results of experts in order to combine the scoring characteristics of different experts. Although this method improves the objectivity of the index system, but the subjectivity of the scoring source of experts is still unavoidable. Therefore, the follow-up research can focus on the unsupervised score method instead of traditional AHP algorithm to enhance the objectivity of risk assessment.
On the other hand, this paper uses cutting-edge machine learning algorithms and optimization algorithms to build an accurate and stable risk assessment model through model fusion. However, for the fusion assessment model with high accuracy, its model depth and complexity are too high, so non-professionals cannot understand the reasons and process of assessment decision-making. It is difficult to distinguish the logic behind the “model black box”. In addition, it also makes the risk assessment model difficult to be trusted and understood by decision makers. Therefore, the follow-up research can focus on reducing the depth and complexity of the model, improving the interpretability of the model and deepening the understanding and application of the risk assessment model under the condition of ensuring the accuracy of the model.

Author Contributions

Conceptualization, J.X. and Z.Z.; methodology, J.X.; software, Z.W.; validation, Y.Z. and X.Z.; formal analysis, J.X.; investigation, J.Y.; resources, Z.Z.; data curation, X.C.; writing—original draft preparation, J.X.; writing—review and editing, J.X. and Z.W.; visualization, X.Z.; supervision, Z.Z.; project administration, Z.Z.; funding acquisition, Z.Z. All authors have read and agreed to the published version of the manuscript.

Funding

This research was partly funded by Beijing Natural Science Foundation (4222042), and National Natural Science Foundation of China (61903008).

Institutional Review Board Statement

Not applicable.

Informed Consent Statement

Not applicable.

Data Availability Statement

Not applicable.

Conflicts of Interest

The authors declare there is no conflict of interest.

References

  1. Chen, Q.; Zhao, Z.Y.; Wang, X.Y.; Xiong, K.; Shi, C. Microbiological predictive modeling and risk analysis based on the one-step kinetic integrated Wiener process. Innov. Food Sci. Emerg. Technol. 2022, 75, 102912. [Google Scholar] [CrossRef]
  2. Rosander, A.C. A simple method of scoring and interpreting sequential responses. J. Educ. Res. 2014, 3, 168–177. [Google Scholar] [CrossRef]
  3. Ma, B.; Han, Y.M.; Cui, S.Y.; Geng, Z.Q.; Li, H.D.; Chu, C. Risk early warning and control of food safety based on an improved analytic hierarchy process integrating quality control analysis method. Food Control 2020, 108, 106824. [Google Scholar] [CrossRef]
  4. Maduekwe, V.C.; Oke, S.A. Novel Taguchi scheme-based DEMATEL methods and DEMATEL method for the principal performance indicators of maintenance in a food processing industry. Int. J. Intell. Comput. Cybern. 2021, 3, 363–397. [Google Scholar] [CrossRef]
  5. Rathore, R.; Thakkar, J.J.; Jha, J.K. A quantitative risk assessment methodology and evaluation of food supply chain. Int. J. logist. Manag. 2017, 28, 1272–1293. [Google Scholar] [CrossRef]
  6. Li, S.L.; Rodríguez, R.M.; Wei, C.P. Two-stage consensus model based on opinion dynamics and evolution of social power in large-scale group decision making. Appl. Soft Comput. 2021, 111, 107615. [Google Scholar] [CrossRef]
  7. Du, Y.W.; Chen, Q.; Sun, Y.L.; Li, C.H. Knowledge structure-based consensus-reaching method for large-scale multiattribute group decision-making. Knowl.-Based Syst. 2021, 219, 106885–106899. [Google Scholar] [CrossRef]
  8. Wan, S.P.; Zou, W.C.; Dong, J.Y.; Martínez, L. A probabilistic linguistic dominance score method considering individual semantics and psychological behavior of decision makers. Expert Syst. Appl. 2021, 184, 115372–115386. [Google Scholar] [CrossRef]
  9. Darko, A.P.; Liang, D.C. Modeling customer satisfaction through online reviews: A flowsort group decision model under probabilistic linguistic settings. Expert Syst. Appl. 2022, 195, 116649–116660. [Google Scholar] [CrossRef]
  10. Wang, F.; Wan, S.P. Possibility degree and divergence degree based method for interval-valued intuitionistic fuzzy multi-attribute group decision making. Expert Syst. Appl. 2020, 141, 112929. [Google Scholar] [CrossRef]
  11. Gou, X.; Xu, Z.; Herrera, F. Consensus reaching process for large-scale group decision making with double hierarchy hesitant fuzzy linguistic preference relations. Knowl.-Based Syst. 2018, 157, 20–33. [Google Scholar] [CrossRef]
  12. Morente-Molinera, J.A.; Kou, G.; Samuylov, K.; Cabrerizo, F.J.; Herrera-Viedma, E. Using argumentation in expert’s debate to analyze multi-criteria group decision making method results. Inf. Sci. 2021, 573, 433–452. [Google Scholar] [CrossRef]
  13. Zhao, Z.Y.; Zhou, Y.Q.; Wang, X.Y.; Wang, Z.Y.; Bai, Y.T. Water quality evolution mechanism modeling and health risk assessment based on stochastic hybrid dynamic systems. Expert Syst. Appl. 2022, 193, 116404. [Google Scholar] [CrossRef]
  14. You, G.D.; Xu, B.; Su, H.L.; Zhang, S. Evaluation of aquaculture water quality based on improved fuzzy comprehensive evaluation method. Water 2021, 8, 1019. [Google Scholar] [CrossRef]
  15. Abdollahi, P.; Aslam, M.; Yazdi, A.A. Choosing the best facility layout using the combinatorial method of gray relation analysis and nonlinear programming. JSMS 2019, 6, 1143–1161. [Google Scholar] [CrossRef]
  16. Zhang, Q.F.; Chen, S.; Fan, Z.P. Bearing fault diagnosis based on improved particle swarm optimized VMD and SVM models. Adv. Mech. Eng. 2021, 6, 1–12. [Google Scholar] [CrossRef]
  17. Zhou, Y.L.; Li, Y.; Jin, J.L.; Zhou, P.; Zhang, D.; Ning, S.W.; Cui, Y. Stepwise identification of influencing factors and prediction of typhoon precipitation in Anhui province based on the back propagation neural network model. Water 2021, 4, 550. [Google Scholar] [CrossRef]
  18. Liao, C.W.; Wang, I.C.; Lin, K.P.; Lin, Y.J. A fuzzy seasonal long short-term memory network for wind power forecasting. Mathematics 2021, 11, 1178. [Google Scholar] [CrossRef]
  19. Qiu, B.; Fan, W. (David) Machine learning based short-term travel time prediction: Numerical results and comparative analyses. Sustainability 2021, 13, 7454. [Google Scholar] [CrossRef]
  20. Gan, M.; Pan, S.Q.; Chen, Y.P.; Cheng, C.; Pan, H.D.; Zhu, X. Application of the machine learning LightGBM model to the prediction of the water levels of the lower columbia river. J. Mar. Sci. Eng. 2021, 5, 496. [Google Scholar] [CrossRef]
  21. Fang, S.L.; Guan, Z.H.; Su, C.; Zhang, W.S.; Zhu, J.; Zheng, Y.W.; Li, H.B.; Zhao, P.P.; Liu, X.H. Accurate fish-freshness prediction label based on red cabbage anthocyanins. Food Control 2022, 138, 109018. [Google Scholar] [CrossRef]
  22. Saeed, R.; Zhang, L.W.; Cai, Z.Z.; Ajmal, M.; Zhang, X.S.; Akhter, M.; Hu, J.Y.; Fu, Z.T. Multisensor monitoring and water quality prediction for live ornamental fish transportation based on artificial neural network. Aquac. Res. 2022, 53, 2833–2850. [Google Scholar] [CrossRef]
  23. Kudashkina, K.; Corradini, M.G.; Thirunathan, P.; Yada, R.Y.; Fraser, E.D.G. Food structure, function and artificial intelligence. Trends Food Sci. Technol. 2022, 123, 376–381. [Google Scholar] [CrossRef]
  24. Luo, T.Y.; Wu, C.; Duan, L.X. Fishbone diagram and risk matrix analysis method and its application in safety assessment of natural gas spherical tank. J. Clean. Prod. 2018, 174, 296–304. [Google Scholar] [CrossRef]
  25. Geng, Z.Q.; Liu, F.F.; Shang, D.R.; Han, Y.M.; Shang, Y.; Chu, C. Early warning and control of food safety risk using an improved AHC-RBF neural network integrating AHP-EW. J. Food Eng. 2021, 292, 110239. [Google Scholar] [CrossRef]
  26. Lin, X.Y.; Cui, S.Y.; Han, Y.M.; Geng, Z.Q.; Zhong, Y.H. An improved ISM method based on GRA for hierarchical analyzing the influencing factors of food safety. Food Control 2019, 99, 48–56. [Google Scholar] [CrossRef]
  27. Li, Y.; Liang, G.X.; Zhang, L.; Liu, Z.P.; Yang, D.J.; Li, J.W.; Sun, G.J.; Zhou, P.P. Development and application of a comparative risk assessment method for ranking chemical hazards in food. Food Addit. Contam. A 2022, 38, 1–14. [Google Scholar] [CrossRef]
  28. Sun, Y.; Zhang, L.L.; Zhang, H.; Zhang, Y.Y.; Sun, B.G. Effects of two sterilization methods on the taste compositions of sweet and sour spare ribs flavor. J. Food Compost. Anal. 2021, 104, 104143. [Google Scholar] [CrossRef]
  29. Sun, Y.; Huang, Y.; Wang, X.Y.; Wu, Z.Y.; Weng, Y.X. Kinetic analysis of PGA/PBAT plastic films for strawberry fruit preservation quality and enzyme activity. J. Food Compost. Anal. 2022, 108, 104439. [Google Scholar] [CrossRef]
  30. Papapostolou, A.; Karakosta, C.; Apostolidis, G.; Doukas, H. An AHP-SWOT-Fuzzy TOPSIS approach for achieving a cross-border RES cooperation. Sustainability 2020, 7, 2886. [Google Scholar] [CrossRef] [Green Version]
  31. Qin, H.M.; Pang, Q.Q.; Yu, B.H.; Wang, Z.F. Analysis on cruising process for on-street parking using an spectral clustering method. IET Intell. Transp. Syst. 2020, 14, 2113–2121. [Google Scholar] [CrossRef]
  32. Wu, L.H.; Liu, P.P.; Lv, Y.X.; Chen, X.J.; Tsai, F.S. Social co-governance for food safety risks. Sustainability 2018, 11, 4246. [Google Scholar] [CrossRef] [Green Version]
  33. Mao, Z.H.; Xia, M.X.; Jiang, B.; Xu, D.Z.; Shi, P. Incipient fault diagnosis for high-speed train traction systems via stacked generalization. IEEE Trans. Cybern. 2020, 99, 1–10. [Google Scholar] [CrossRef] [PubMed]
  34. Mahfuzur, R.; Chen, N.S.; Ahmed, E.; Monirul, I.S.; Mehtab, A.; Reza, P.H.; Wang, T.; Jun, Z.; Tian, S.F.; Hamid, F.; et al. Application of stacking hybrid machine learning algorithms in delineating multi-type flooding in Bangladesh. J. Environ. Manag. 2021, 295, 113086. [Google Scholar]
  35. Hu, L.Y.; Wang, C.; Ye, Z.R.; Wang, S. Estimating gaseous pollutants from bus emissions: A hybrid model based on GRU and XGBoost. Sci. Total Environ. 2021, 783, 146870. [Google Scholar] [CrossRef] [PubMed]
  36. Zhu, R.; Lv, Y.; Wang, Z.M.; Chen, X. Prediction of the hypertension risk of the elderly in built environments based on the LSTM deep learning and bayesian fitting method. Sustainability 2021, 10, 5724. [Google Scholar] [CrossRef]
  37. Zhiteneva, V.; Carvajal, G.; Shehata, O.; Hübner, U.; Drewes, J.E. Quantitative microbial risk assessment of a non-membrane based indirect potable water reuse system using Bayesian networks. Sci. Total Environ. 2021, 780, 146462. [Google Scholar] [CrossRef]
  38. Meng, A.B.; Zeng, C.; Wang, P.; Chen, D.; Zhou, T.M.; Zheng, X.Y.; Yin, H. A high-performance crisscross search based grey wolf optimizer for solving optimal power flow problem. Energy 2021, 225, 120211. [Google Scholar] [CrossRef]
Figure 1. Flow of the construction of the index system.
Agriculture 12 00815 g001
Figure 2. SC algorithm clustering results.
Agriculture 12 00815 g002
Figure 3. The fusion model (BXGB-BLGB-GLSTM) architecture.
Agriculture 12 00815 g003
Figure 4. Comparison curves for each model: (a) Combined hazard risk values and BXGB-BLGB-GLSTM model predictions; (b) Combined hazard risk values and XGB-LGB model predictions; (c) Combined hazard risk values and XGB-LSTM model predictions; (d) Combined hazard risk values and XGB-LSTM model predictions; (e) Combined hazard risk values and XGBoost model predictions; (f) Combined hazard risk values and LightGBM model predictions; (g) Combined hazard risk values and LSTM model predictions; (h) Combined hazard risk values and BP model predictions; (i) Combined hazard risk values and SVM model predictions.
Agriculture 12 00815 g004
Table 1. Comparison of the advantages and disadvantages of mainstream risk assessment methods.
Risk Assessment MethodologyExpertsExamples of TechniquesAdvantagesDisadvantages
Qualitative
assessment
methods
Single expert
assessments
Index scoring methodQuantitative indicators are clear and easy to followIndicator weights are
difficult to define reasonably
AHPA clear hierarchy of indicators and a wide range of
applications
Reliance on the accuracy of expert assessment results
DEMATELRelatively simplified relationships of system elementsNot conducive to
multi-indicator system
analysis
Multiple expert
assessments
Subjective weighting methodsThe calculation of indicator weights is relatively simpleIndicator weights are heavily influenced by an expert
priori information
Objective weighting methodsIndicator weights are less
influenced by an expert priori information
The calculation of indicator weights is relatively complex
Quantitative
assessment
methods
FCEEasy to implement, suitable for multiple indicator classificationIndicator weights are
difficult to define reasonably
GRASimple data calculationOptimal values for some
indicators are difficult to
determine
Machine
learning
SVMHigh generalization abilityNot suitable for classification of large data samples
BPHigh non-linear mapping
capability
Prone to local
miniaturization problems
LSTMSolve the problem of gradient disappearance and gradient
explosion during long sequence training
Disadvantages in parallel processing
XGBoostInsensitive to missing values, simple and easy to understandEasy over-fitting
LightGBMHigh operational efficiency and less overfittingRelatively low model
accuracy
Comprehensive risk assessment methodsQualitative assessment methods to construct index systems;
Quantitative assessment methods to construct risk assessment models
A combination of subjective and objective, comprehensive and accurate analysisComputationally complex
Table 2. Sample of rice hazards testing data.
Provinces TestedTest TimeTest ElementContentUnitResult
Jiangsu2018.06.07Chromium0.11mg/kgQualified
Henan2018.06.27Benzo[α]pyrene1.00μg/kgQualified
Heilongjiang2018.07.01Lead0.15μg/kgQualified
Anhui2018.10.24Inorganic arsenic0.075mg/kgQualified
Liaoning2018.06.07Aflatoxin B<0.01μg/kgQualified
Table 3. Basis for selection of SC algorithm parameters.
n_clustersrandom_stateCH_scoren_clustersrandom_stateCH_score
2110.151610521.5342
3111.1254268.2844
6217.7012101221.9540
7218.036551313.4442
Table 4. Weights within expert categories and combined elements weights.
ElementWeighting within the First Category of
Experts
Weighting within the
Second
Category of Experts
Weighting within the Third Category of ExpertsCombined Element Weights
Lead0.09600.19050.05260.1027
Cadmium0.13230.13690.12890.1324
Chromium0.08100.08090.07250.0799
Inorganic arsenic0.09200.09790.07880.0910
Total mercury0.08100.05000.05590.0738
Aflatoxin B0.18390.12470.18240.1760
Ochratoxin A0.06470.06640.08960.0681
Deoxynivalenol0.05540.04700.08030.0575
Zearalenone0.04790.06220.07950.0538
Benzo[α]pyrene0.10100.08760.11910.1016
Aluminium phosphide0.06490.05580.06040.0632
Table 5. Comparison of evaluation metrics by algorithm.
ModelsR2MAEMSE
BXGB-BLGB-GLSTM0.93170.01140.0002
XGB-LGB0.83160.01880.0006
XGB-LSTM0.88220.01440.0004
LGB-LSTM0.89860.01290.0003
XGBoost0.82710.01940.0006
LightGBM0.76110.02250.0008
LSTM0.76270.02130.0008
BP0.70390.02480.0010
SVM0.74460.02300.0008
Publisher’s Note: MDPI stays neutral with regard to jurisdictional claims in published maps and institutional affiliations.

