Article

Food Losses in Consumer Cereal Production in Poland in the Context of Food Security and Environmental Impact

1
Institute of Environmental Protection—National Research Institute (IEP—NRI), Krucza Street 5/11D, 00-548 Warsaw, Poland
2
Department of Food Technology and Assessment, Institute of Food Sciences, Warsaw University of Life Sciences, 159c Nowoursynowska Street, 02-787 Warsaw, Poland
3
Department of Cereal Crop Production, Institute of Soil Science and Plant Cultivation—State Research Institute, 8 Czartoryskich Street, 24-100 Pulawy, Poland
*
Author to whom correspondence should be addressed.
Agriculture 2022, 12(5), 665; https://doi.org/10.3390/agriculture12050665
Submission received: 20 March 2022 / Revised: 27 April 2022 / Accepted: 30 April 2022 / Published: 5 May 2022
(This article belongs to the Special Issue Agricultural Food Security and Economic Analysis)

Abstract

:
Food loss is a serious global problem, particularly in developed countries; in the European Union, approximately 20% of the food produced each year is wasted. Food losses occur in the entire agri-food chain, starting from primary production, through post-harvest operations and storage, processing, distribution and consumption. The paper presents the results of studies on the evaluation of food losses at the stage of primary production (agricultural production) of consumer cereals in Poland in the context of their impact on the environment and ensuring food security. It was shown that the amount of food losses in the first link of the agri-food chain in the cereal sector in 2017–2018 was on average 219.6 thousand tonnes per year. The level of losses per farm averaged 0.91 tonnes, which accounted for 1.7% of total production. The weight of consumer grain waste at the primary production stage, calculated on the basis of the results of food losses and taking into account the grain management methods, amounted to an average of 117.24 thousand tonnes/year, which accounted for 23.08% of all food waste generated at the primary production stage. By relating the amount of food losses in the primary production of consumer cereals in Poland to the assumed emission factor, it was calculated that food losses at the stage of production of consumer cereals during a year are responsible for the emission of 0.608 million tonnes of CO2.

1. Introduction

Food losses should be treated as a global problem, occurring throughout the food chain, from primary production, through processing, distribution and consumption in households or catering establishments, i.e., “from field to table”. Food losses significantly reduce the economic efficiency of agriculture and the food industry [1,2,3,4]. They represent a loss of economic (business) value for operators involved in food production and supply chains. Representing food losses in terms of economic value is important for population nutrition policy and decision making related to ensuring food security [5]. Economic costs include not only costs related to the loss of value of the products themselves (expenses for raw materials, prefabrication, energy, transport and distribution costs), but also environmental costs such as those incurred for waste storage and disposal [6]. From an environmental point of view, the phenomenon of wasting and wasting food means inefficiency in the management of natural resources such as land, water and energy, access to which is becoming increasingly limited. Moreover, it contributes to the aggravation of such environmental problems as global warming through the additional emission of greenhouse gases and other harmful substances produced during the manufacture of products which will not ultimately be consumed [7,8].
The Food and Agriculture Organization of the United Nations (FAO) estimated that 931 million tonnes of edible food were wasted globally in 2019, accounting for 17% of the food that was available to consumers, while 868 million people suffered from malnutrition and hunger during this period [9]. Food waste is becoming an increasingly serious problem, not only in developed countries such as the USA and Europe, but it is a growing problem in developing countries, especially at the stage of food production and processing [1,2,4,8,9,10,11,12]. According to estimates, 88 million tonnes of food are wasted annually in the European Union, with an average of 173 kg per inhabitant. This quantity is the equivalent of 20% of all food production in the European Union. The economic losses amount to EUR 143 billion per year [13].
In Poland, in order to obtain reliable and up-to-date data concerning losses and wastage of food, research was conducted within the PROM project (“Development of a system for monitoring wasted food and an effective programme for rationalisation of losses and reduction of food waste”). The amount of wasted food was estimated in the whole food chain in specific links and sectors, and the causes and directions of waste management were also examined. On the basis of these studies, it was calculated that in Poland, 4,840,946 tonnes of food are wasted annually. Most of the food thrown away, i.e., 60%, originated from households; primary production (agricultural) also had a significant share in food losses, amounting to 15% of the total losses and food wastage in the whole food chain. The entities responsible for food losses at this stage of the food chain include crop and/or livestock farms [11].
Agriculture is one of the basic branches of the economy of any country of strategic importance. Its role results from the scale and value of turnover and its share in the country’s economy. The basic task of agriculture is to ensure national food security through systematic supply of agricultural products in appropriate quantity, quality and assortment. One of the basic directions of agricultural activity is the production of cereals. Cereals are considered to be the most important group of crops in economic terms, and cereal grain is one of the main raw materials for the food and feed industry. Adequate supply of the domestic market with cereals and their products has a significant impact on the nutrition level of the population based on cereal products [12]. Ensuring cereal self-sufficiency is a cornerstone of Poland’s food security [14]. Poland is one of the largest producers in the European Union, second (after France) among the Member States in terms of acreage under cereal crops and third (after France and Germany) in terms of harvested crops [15]. In Poland, cereals occupy about 74% of the total area used for agriculture. In 2014–2018, the cereal harvest was at the level of 26.5–31.8 million tonnes. The share of cereals in the value of agricultural output is at the level of 20%, and in the value of agricultural commodity production at the level of 15% [15]. As cereal grains are one of the most important plant raw materials used in food production, it is important to develop effective strategies that minimise grain losses from the first stage of the food chain.
The aim of this study was to determine the volume of losses and wastes of consumer cereals in Poland which occur at the stage of primary production (agriculture) and to mark their impact on the environment and food security in Poland. This is the first comprehensive study in Poland carried out on such a large scale on monitoring the scale of losses and wastes of consumer cereals. The motivation for undertaking the research was to determine the initial situation of the scale of food losses and waste in the context of the need to reduce them by 50% by 2030. Investigating and analysing the causes and directions of waste management will allow government agencies and producers to develop practices and tools to help reduce waste and manage waste for the benefit of the environment and society. Quantitative data were determined using the mass balance method, and quantitative-qualitative data were collected through direct surveys (questionnaire surveys).

2. Materials and Methods

2.1. Definitions

A necessary condition for appropriate assessment of the scale of food losses at particular stages of the food chain is correct definition of the notions: food, food losses, food waste and defining boundaries of particular links of the food chain. Unfortunately, in the literature on the subject, the terms losses and food waste are often used interchangeably, which is a mistake [4]. According to the legislation adopted in the European Union countries [16], waste is part of the resulting food losses. According to Article 2 of the above-mentioned regulation (EC), “food” (or “foodstuff”) means any substance or product, whether processed, partially processed or unprocessed, intended to be, or reasonably expected to be, ingested by humans. The definition of “food” in the above-mentioned regulation covers food as a whole, along the entire food chain, from production to consumption. It also covers non-edible parts where these have not been separated from the edible parts during food production. Accordingly, food waste may contain elements that include food parts intended for consumption and food parts that are not intended for consumption (Motive of Preamble 2 to the Delegated Decision 2019/1597) [17].
“Food waste” according to FAO [18] means “a reduction in the quantity or deterioration of the quality of the food”. Losses are a reduction in the weight or quality of the edible part of the food resulting from mismanagement, errors and irregularities in the processes at all stages of the food chain, excluding households and catering.
According to Article 3 (4a) of the Waste Framework Directive [19] “food waste” is any food as defined in Article 2 of Regulation (EC) No 178/2002 that has become waste, that is to say any substance or object which the holder discards or intends or is required to discard. However, it does not include losses occurring at stages of the food chain before certain products become food, such as parts of edible plants which have not yet been harvested. This interpretation of the non-disposal of pre-harvest plants as food waste is in line with the principles of the Protocol on Loss and Waste of Food [20], to harmonise reporting across EU countries and define the term of “food waste” under the FUSIONS project [21], which considers food waste from the moment of “when crops are ripe for harvesting”.
According to the FUSIONS [22] definition, food waste is all food and inedible food parts excluded from the food supply chain for recovery or landfilling (which includes composting, ploughed or unharvested crops, anaerobic digestion, bioenergy production, co-generation, incineration, discharge to sewer or landfill). The status of waste, i.e., whether it will be classified as food waste, is determined by its destination. If, for example, raw cereal, originally intended for consumption purposes, due to unfavourable weather conditions or improper storage conditions resulting in a decrease in its processing quality, is intended for the production of animal feed, it will not qualify as waste, let alone as food waste. However, if it is sent for composting, it shall be included in the food waste stream.
The next concept to be defined is “primary production”. According to Article 3 (17) of Regulation (EC) No 178/2002 [16], primary production includes the production, cultivation or breeding of primary products. For the purpose of this study, in accordance with the FUSIONS methodology [13], the point at which the raw material becomes food is taken as the starting point of the primary production link. Primary production involves the extraction of the raw material (cereal cultivation) and the transport of the harvested crop to the point of sale or its storage on the farm and transport. The starting point is when the grain is ripe for harvest; the pre-harvest (harvest) stage does not enter into the system for measuring and monitoring food losses. The end point of primary production is when the raw material enters the processing stage, i.e., the reception of the raw material at the processing plant gate.

2.2. Methodology

In order to know the scale and estimate the amount of loss and food waste generated, it is necessary to use an appropriate research methodology that takes into account the specificities of the sector and the individual links. On 3 May 2019, the European Commission adopted a Delegated Act establishing a common methodology for measuring food loss. It aims to support Member States in quantifying waste and food loss [23].
The estimation of food losses in the production of consumer cereals in Poland was carried out on the basis of a mass balance and the results of primary research (questionnaire survey). The choice of research methods was guided by the recommendations of the EC in delegated decision 2019/1597 [17]. According to its provisions, Member States, in order to ensure the reliability and accuracy of food waste measurement, should conduct measurements on a representative sample of the population to which the results apply, using appropriately selected methods taking into account the specificity of a given sector and individual links in the food chain. The methods recommended by the EC for the measurement of food losses in primary production include mass balance, questionnaires and interviews.

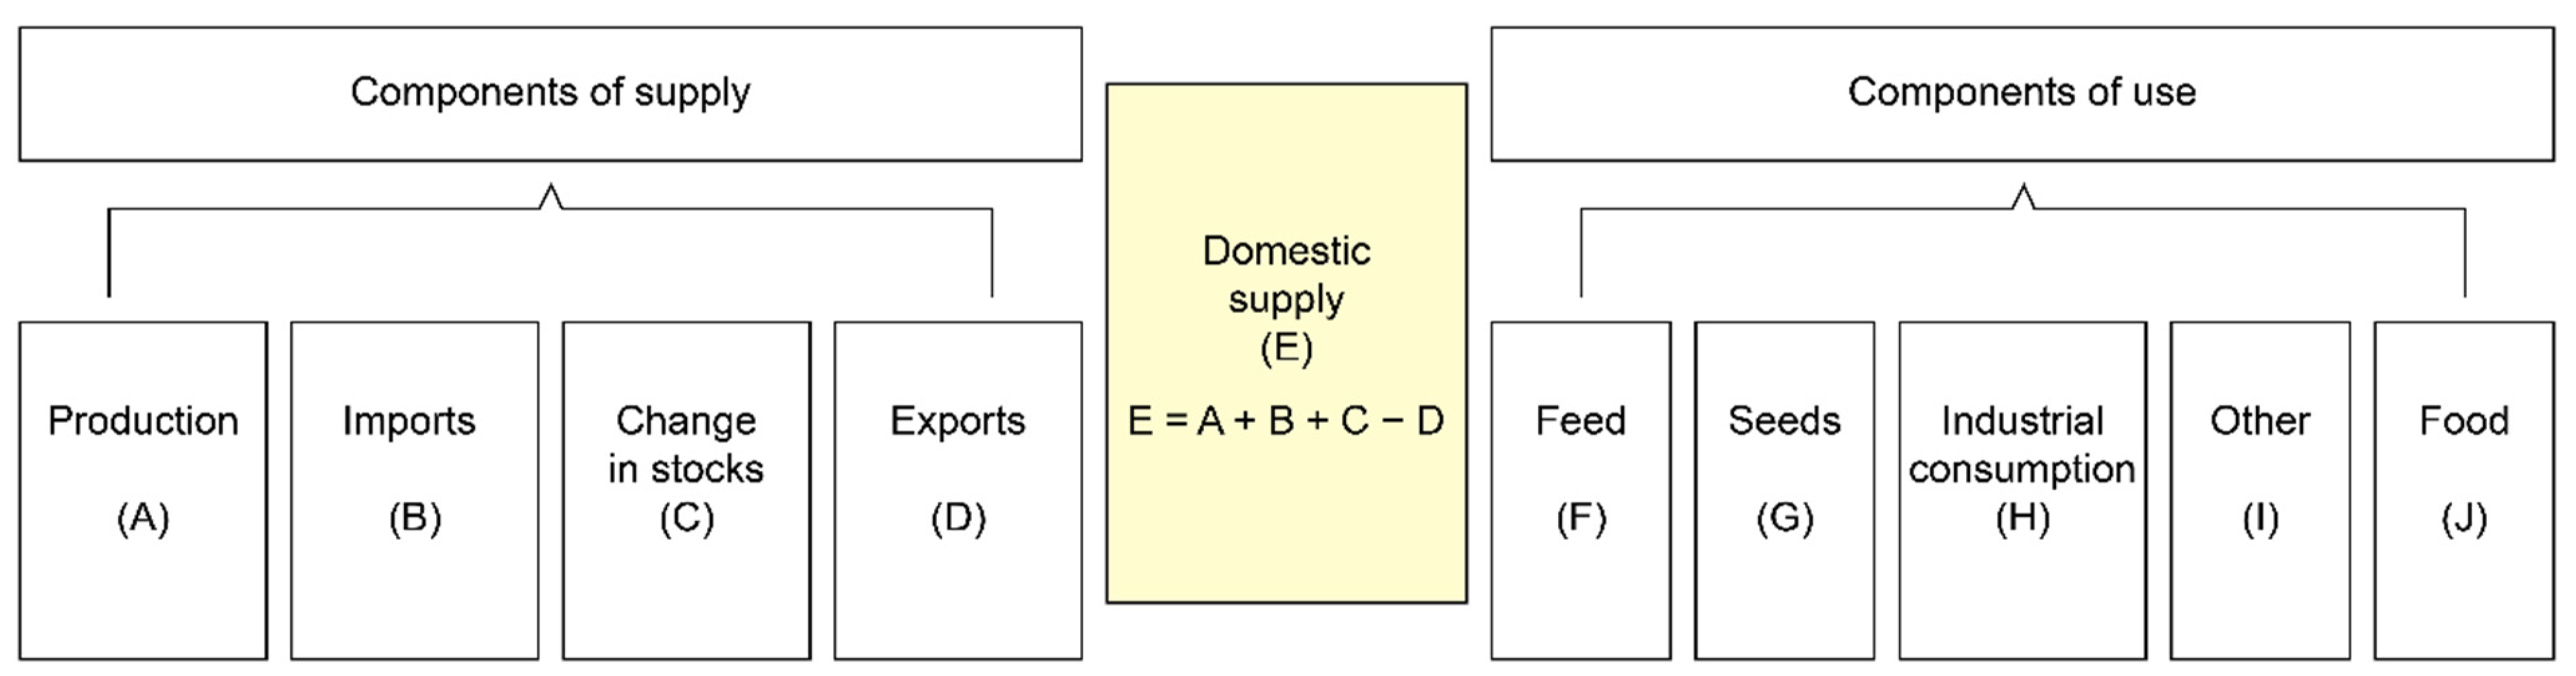
2.2.1. Mass Balance Method

The estimation of losses of cereals in Poland was carried out on the basis of the mass balance of cereal grains at different stages of the food chain, according to the methodology developed by Gustavsson et al. [2] for the Food and Agriculture Organization of the United Nations (FAO). The study included: wheat, rye, barley, oats, maize, i.e., cereals used in Poland for consumption purposes. Triticale and cereal mixtures, i.e., cereals grown in this region exclusively for fodder purposes, were not included.
The study used cereal balances from the CSO and IERiGŻ-PIB databases [24,25]. An exception was oats, which in the available balances are included together with cereal mixtures. Due to the lack of some of the data necessary for the mass balance, direct CSO data on the quantity of oat grain processed for food purposes were used to calculate oat losses [25].
The food balance represents the pattern of domestic food supply, e.g., cereal grains, over a period of one year. The volume of domestic grain supply is equal to the sum of the supply components: production, imports, stock changes and exports (negative value). Food for human consumption is obtained after deducting from the domestic supply of grain the components used for other purposes: feed, seeds, industrial consumption. The scheme of grain mass flow in the food balance is presented in Figure 1.
The study used the percentage estimates of grain losses and wastage determined by Gustavsson et al. [2] at different stages of the food chain in Europe. To calculate the magnitude of grain losses during transport from the field, post-harvest treatments and storage losses, a percentage loss estimate of 4% was adopted, according to the guidelines of the Institute of Agricultural and Food Economics—National Research Institute in Warsaw [26].
Allocation coefficients (AC), which determine the share of grains used for food production in relation to domestic production, were calculated from the formula:
AC = J A
where:
J—grains used for food production; A—production.
The average values of the allocation coefficient for the years 2014–2018 were used for the calculations. They were, respectively: for wheat 0.36, for rye 0.35, for barley 0.04, and for oats and maize 0.01.
Data from food balances of the CSO and IERiGŻ [24,25], together with percentage estimates of losses and allocation coefficients, were used to calculate the scale of losses and wastage of individual types of consumer cereals at the primary production stage in Poland in 2014–2018.

2.2.2. Direct Research—Survey Questionnaires

The face-to-face surveys covered the years 2017 and 2018 and were conducted between March–May 2019 throughout Poland on a representative sample of 246 respondents (consumer cereal farms) using survey questionnaires using the PAPI (Paper & Pen Personal Interview) method—interviewers conducted face-to-face questionnaire interviews [11]. The scope of the study was to determine the size and type of consumer cereal losses on farms, as well as to determine the causes of losses and the directions of their management.
In the conducted research, before obtaining empirical data, the size and structure of the research sample was determined, i.e., agricultural holdings supplying cereals for consumption purposes. Farms were the random unit. A decision was made to select a random sample of an assumed number of 250 treatments. In selecting the number of farms, a stratified selection scheme was applied with proportional allocation determined according to voivodships grouped into NUTS 1 Macroregions, which ultimately constituted the sampling strata [27]. Proportions were determined according to the share of the number of farms in particular macro-regions, taking into account the occupied area. The list of the number of farms from particular macro-regions participating in the questionnaire research is presented in Table 1. Adjustments made in the number of questionnaires as a result of impossibility to implement the assumed quotas of questionnaires for a given macro-region did not cause greater disproportions, thanks to which particular macro-regions were represented in a similar proportion.
The sample size of 246 farms constituted 0.019% of all farms registered in Poland in 2010 as producing cereals both for consumption and fodder. The survey process was conducted directly by interviewers—employees of voivodeship, field Agricultural Advisory Centres (ODR). Respondents (farm owners) answered questions from interviewers who manually completed a paper survey questionnaire (sample attached in Supplementary File).
The results of the survey in primary production were collected in paper form and, after checking and verifying, were entered and aggregated in a properly prepared MS Excel database in a way that facilitates their verification and subsequent analysis.

2.2.3. Estimation of Food Waste Weight

The weight of food waste generated in the primary production of consumer cereals was estimated on the basis of the results obtained from the PROM project surveys, taking into account management options such as composting, biofuel production, transfer to biogas plants and landfill, excluding use for consumption or animal feed.
The calculated weight of food waste in the cereal sector in the primary production cell was related to the production volume in the study sample of farms in 2017 and 2018. The obtained percentage of food waste was related to the national production volume, published by the Central Statistical Office [24]. In order to determine the amount of grain of each type of cereal produced for consumption purposes, the calculations took into account the average allocation coefficients given in Section 2.2.1.

2.2.4. Calculation of Carbon Footprint

The environmental impact of produced food can be determined by the so-called carbon footprint by calculating the total greenhouse gas emissions during the full product life cycle. It is expressed as CO2 equivalent per functional unit of the product [28], i.e., per weight of wasted food (CO2 eq./functional unit).
In order to determine the impact of wasted food on the environment, a simplified indicator was developed to calculate the level of greenhouse gas emissions in Poland generated annually by food waste cereals. The indicator was determined on the basis of calculated emissions for 2011 at 3.6 Gt CO2 eq., and the level of food loss and waste in the world in that same year of 1.3 billion tonnes, amounting to 2.769 Gt CO2 eq./billion tonnes.
By relating the amount of food losses in the primary production of consumer cereals in Poland to the assumed emission factor, the level of greenhouse gas emissions generated annually from the losses of consumer cereals was calculated.

3. Results and Discussion

3.1. Level of Losses of Food Grains on The Basis of Mass Flow Balance

The domestic supply of cereals consists of initial stocks, production (grain harvest) and imports and exports [25]. The mass flow balances of wheat, rye, barley, oats and maize in Poland in 2014–2018 are presented in Table 2. In the analysed period, the production of wheat and maize was the highest (averages: 10,980 thousand tonnes and 3971 thousand tonnes, respectively), and oats was the lowest (1352 thousand tonnes). On average, exports of most consumer cereals, with the exception of barley, exceeded imports. Directions of grain utilization depended on the type of grain. In Poland, grains of these cereals are basic raw materials for the production of various types of flour. In the analysed period, the average consumption of wheat and rye grains for food purposes was, respectively: 3906 thousand and 814 thousand tonnes per year, which in the case of wheat accounted for almost 45% and in the case of rye for 40% of the domestic supply of these cereals. The consumption of barley for food purposes amounted to less than 4% of the domestic supply of this cereal; it was even lower in the case of maize and oats (less than 1%). The accumulation of cereal stocks is very important for food security. According to Szczepańska [14], a safe level of end-of-year stocks is deemed to be 10% of annual consumption. A lower share of ending stocks in annual consumption may cause disruptions in the work of the cereal, milling and feed industries, which could disrupt the continuity of supply of products to the market. During the analysed period, there was no reduction in cereal stocks below safe levels.
Total consumer cereal grain losses during transport of the harvested crop to the point of sale or its storage on farms and subsequent transport to the point of sale or processing plant varied in the years analysed (2014–2018) (Table 3). The highest grain losses occurred in 2014 and 2017. They amounted to, respectively, 214.2 and 213.7 thousand tonnes of grain. The lowest losses, at 178.6 thousand tonnes of grain, were recorded in 2018, in which the grain harvest due to unfavourable weather conditions (drought) was much lower than in other years. The highest level of consumer grain losses at the primary production stage was recorded for wheat (average 158.1 thousand tonnes of grain per year), which accounted for 79.6% of total consumer grain losses. The losses of rye grain were significantly lower—on average 33.2 thousand tonnes per year (16.7% of total losses of consumer cereals). Average losses of barley grain amounted to 5.3 thousand tonnes per year, while losses of maize and oats were at the level of, respectively, 1.6 and 0.5 thousand tonnes.
THE conducted balance of losses of consumer cereals in Poland in 2014–2018 shows that grain losses at the stage of primary production (transport from the field, post-harvest treatments, storage in the holding, transport to the purchase point or processing plant) were differentiated depending on the type of cereal, which resulted from differences in the volume of production and the amount of grain of a given cereal type intended for food purposes. In the analysed years, the greatest quantitative losses of grain at the stage of primary production concerned wheat and then rye, which are in Poland basic cereal raw materials used for processing for consumption purposes.

3.2. Level of Consumer Cereal Losses Based on Surveys

The survey collected information from 246 farms from 7 macro-regions, all of which reported cereal production in both years under assessment (2017 and 2018). The total cultivated area of the surveyed farms was more than 4 thousand ha, of which more than half was occupied by cereal crops (Table 4). The total weight of grain harvest was about 13 thousand tons of cereals, such as wheat, rye, barley, triticale, oats, maize, buckwheat, millet and others, which was on average about 50 tonnes per farm, of which were about 40 tonnes of basic cereals (wheat, rye, barley). The harvested crops were mostly stored in warehouses (67%) and also in silos (about 20%), mainly in dry form. On the basis of the data obtained, it was calculated that the amount of cereal losses at the first link of the food chain, i.e., in primary production, averaged 219.6 thousand tonnes per year. The average loss per farm was 0.91 tonnes, and the share of losses in relation to total cereal production was estimated at 1.7%.
The total level of consumer cereal losses in 2017 on the surveyed group of farms was 238.90 tonnes, which represented an average of 1.8% in relation to the total cereal production on these farms. In 2018, lower losses were reported, at 206.99 tonnes, representing 1.6% of the total cereal production of the surveyed group of farms. Average losses per farm were estimated at almost one tonne in 2017 and 0.84 tonnes the following year [29].
Of all the farms surveyed (246), 154 farms declared grain losses in 2017 and 155 farms in 2018, representing more than 60% of the respondents. The data obtained showed that cereal losses occurred during all on-farm activities, from the transport of grain from the field, handling, preparation for storage and warehousing to transport to the collection point or processing plant.
The study shows that the greatest losses occurred during grain storage on farms and accounted for 80.5% of the losses reported in the sample, 11.5% were losses resulting from unsuccessful deliveries (mainly due to inadequate quality of the raw material) and the remaining 8% were losses occurring during grain transport.

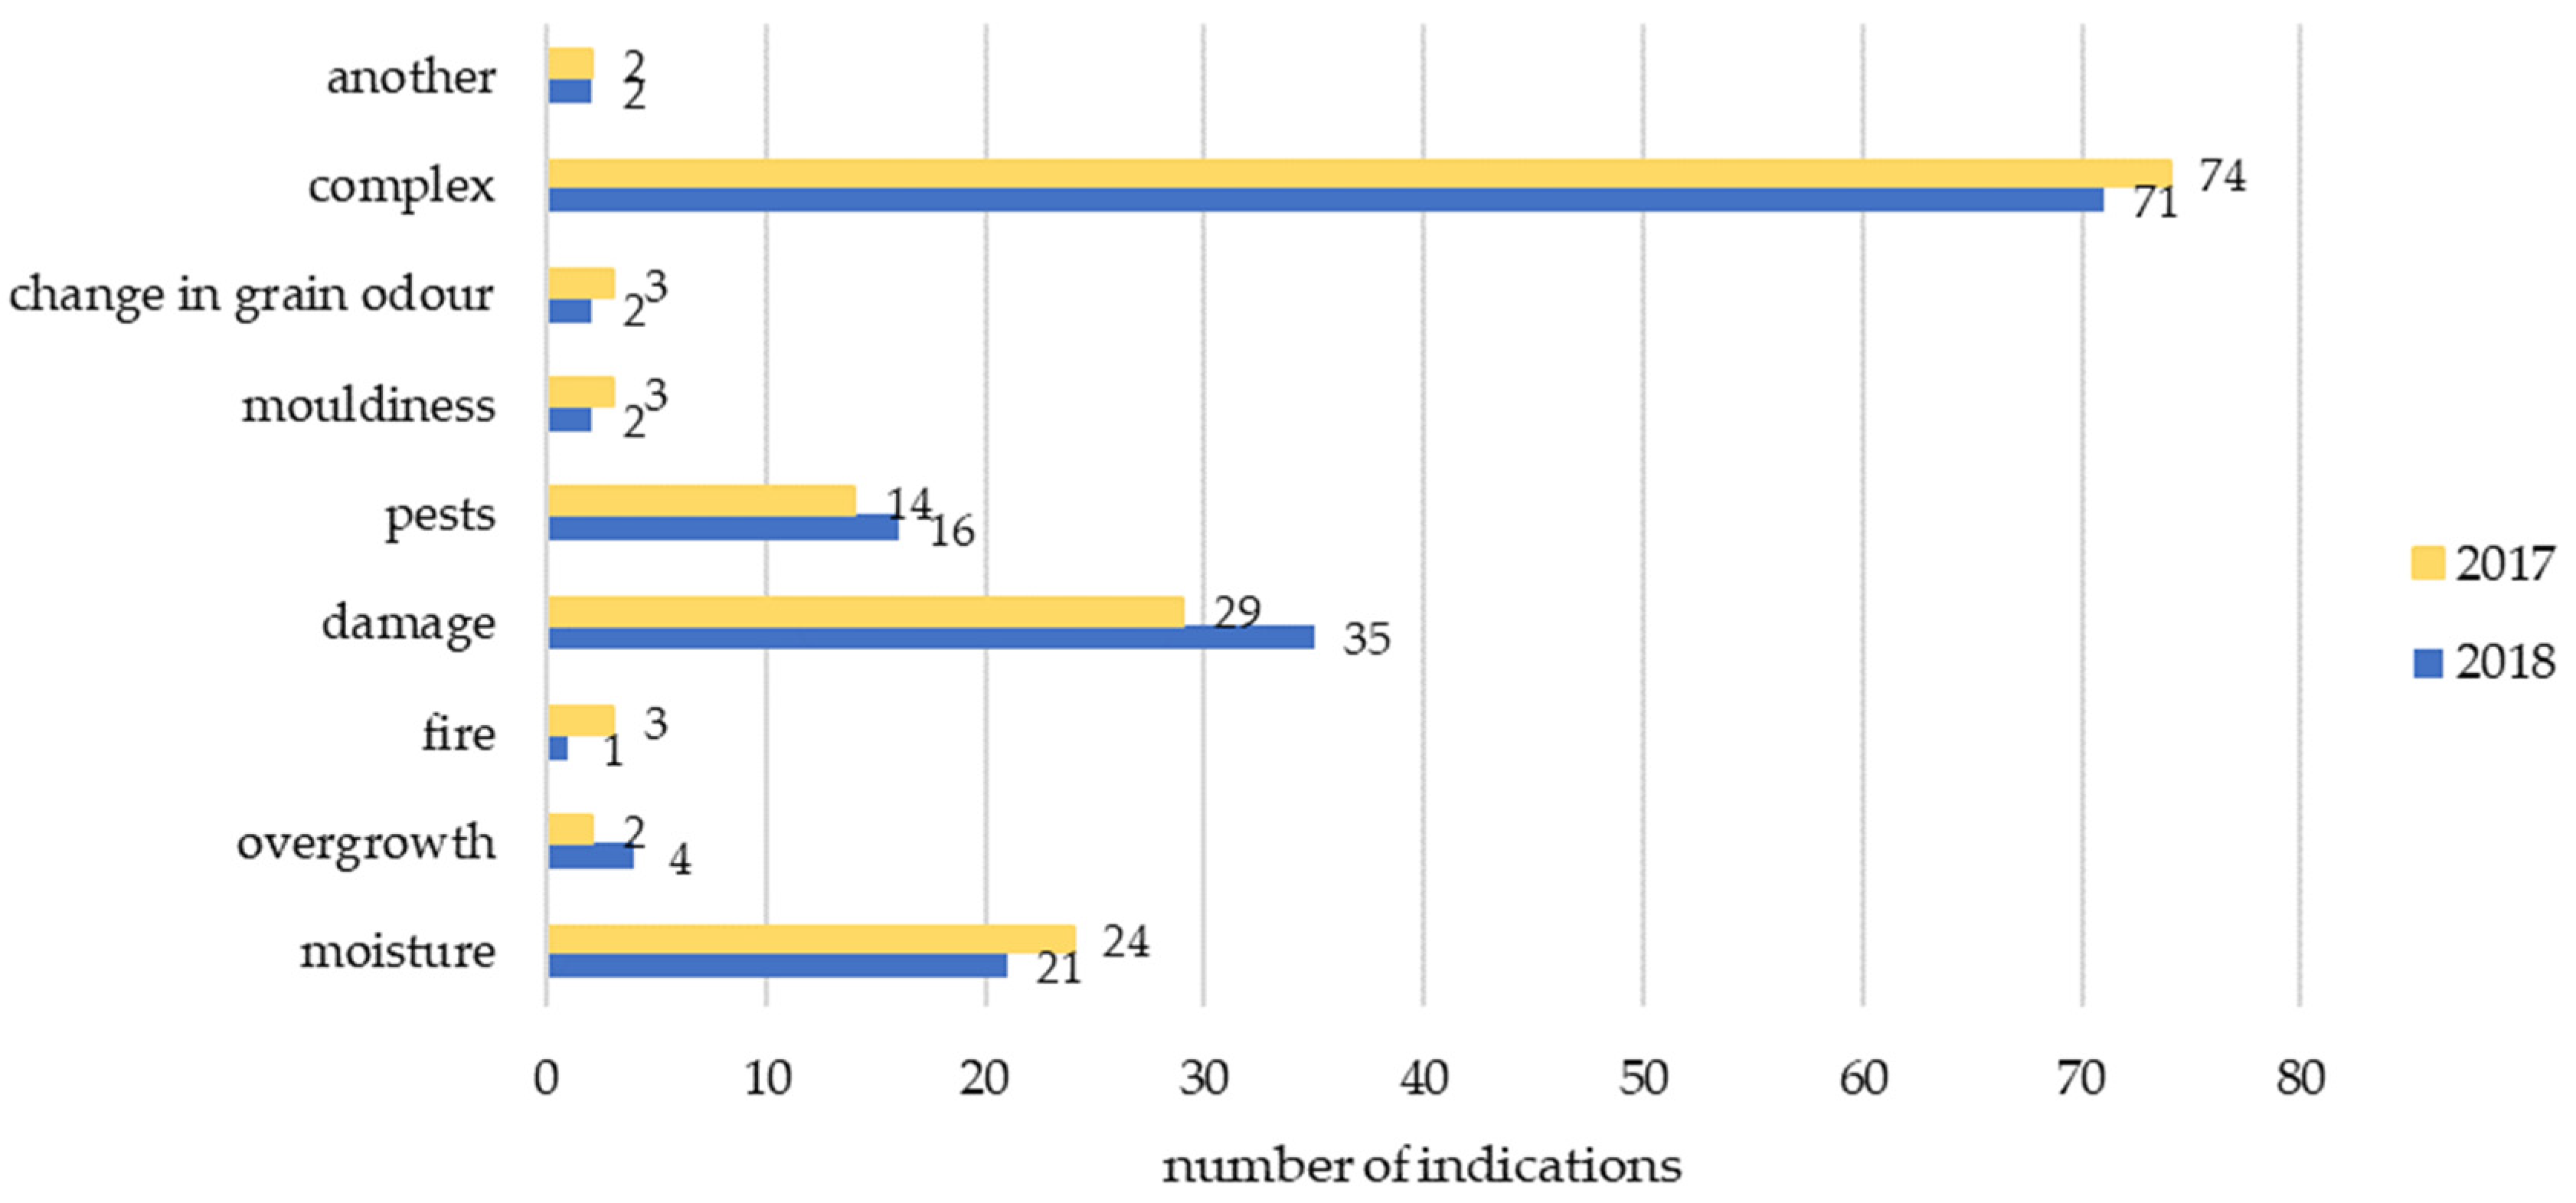
3.2.1. Causes of Food Losses in Consumer Cereal Production and Opportunities for Their Reduction

Losses of cereals at the primary production stage are difficult to estimate, and this is mainly due to the fact that agricultural production is highly dependent on variable and unpredictable weather conditions. The timing and yield of cereals vary from one year to the next, and the quality of the grain also varies, being strongly influenced by weather conditions [30,31,32,33,34]. Market demand for grains is also changing, influenced by many economic and non-economic factors [35]. In the primary production of cereals, factors that contribute to losses are also constraints related, inter alia, to the agricultural techniques used and the infrastructure facilities used in production [26].
Cereals at the stage of cultivation and harvest are not treated as food; however, already at these stages, unfavourable quality changes may occur, reducing their storage and processing quality, which are the cause of further losses, at further stages of the food chain, when grain is treated as food. The cause of quantitative and qualitative losses of grain may be unfavourable weather conditions during the vegetation of plants and grain harvest (e.g., long-lasting rain, floods, hail, drought, frost), the occurrence of diseases (e.g., fusariosis and pests (insects, rodents, birds), improper use of plant protection products (pesticides) in cultivation which may cause chemical contamination (pollution), the use of too-high temperatures during grain drying (thermal damage), as well as the impact of working parts of machines and devices used during harvest, transport and cleaning, resulting in mechanical damage [30,36].
In temperate climates, cereals are harvested once a year. Much of the grain harvested from the field is stored for later processing and strategically stored in case of crop failures, natural disasters or other events [30,31,34]. Grain is stored from several weeks to several months, and sometimes even a few years. The amount of quantitative and qualitative losses of grain that may occur during that time is influenced by the condition of grain directed to the store (first of all, maturity, humidity, temperature, cleanliness, degree of damage) and storage conditions. The condition for maintaining full technological usefulness and nutritional value of grain is proper preparation for storage (cleaning, drying) and constant monitoring of storage conditions [31,37,38,39,40].
Surveys conducted as part of this study indicate that the primary causes of grain losses during storage in both 2017 and 2018 were moisture, grain damage and pest outbreaks (Figure 2). Less frequently, respondents indicated other causes such as overgrowth, mouldiness, change in grain odour or occurrence of fire in the warehouse. The highest share in the list of causes of grain losses had multiple (complex) answers, indicating more than one reason; among the complex answers, the most frequent were moisture and development of pests, but also mouldiness, resulting from increased humidity of grain. One of the most important factors determining proper condition of grain during storage is maintaining proper humidity and temperature of grain, conducting air exchange (active ventilation) and constant monitoring of grain pest presence and in case of their occurrence, proper control [35,41,42,43,44]. A survey conducted by Olejarski et al. [44] shows that the condition of warehouses and the conditions in which cereal grain is stored in Poland is satisfactory. In most of the surveyed grain warehouses, periodic measurement of temperature and humidity of stored cereals and monitoring of the presence of cereal pests was conducted. According to Rajendran [45], up to several hundred different species of living organisms may be present in grain storage facilities. Various pest species have been found in grain storage facilities in Poland [44,46,47]. Among insects, the most frequent were beetles of the bean weevil (Sitophilus granarius L.), flour beetle (Tribolium spp.), hooded beetle (Rhyzopertha dominica F.) and butterflies of the mealy bug (Ephestia kuhniella Zell). Quite often, mites are also found in stored cereal grain lots (Acarina). The feeding of storage pests in cereal grains is a global problem, contributing to losses due primarily to weight loss, but also to contamination by excreta and secretions, moisture and heating [42,43,46,48]. Hagstrum and Subramanyam [42] report that the grain weevil eats on average 86 mg and the wheat borer up to 154 mg of wheat grain in its lifetime. Therefore, this species may soon become a more dangerous primary pest of cereal grains in temperate zones than the grain weevil [46]. According to Świerczyński et al. [48], grain weevil can cause up to 5% of stored grain weight losses. In the early stages of development, this pest is difficult to detect because the larvae develop inside the grain (hidden development). The presence of the pest and the life processes occurring cause an increase in humidity and temperature of the stored grain. These conditions favour the development of fungi, as a result of which the grain turns mouldy.

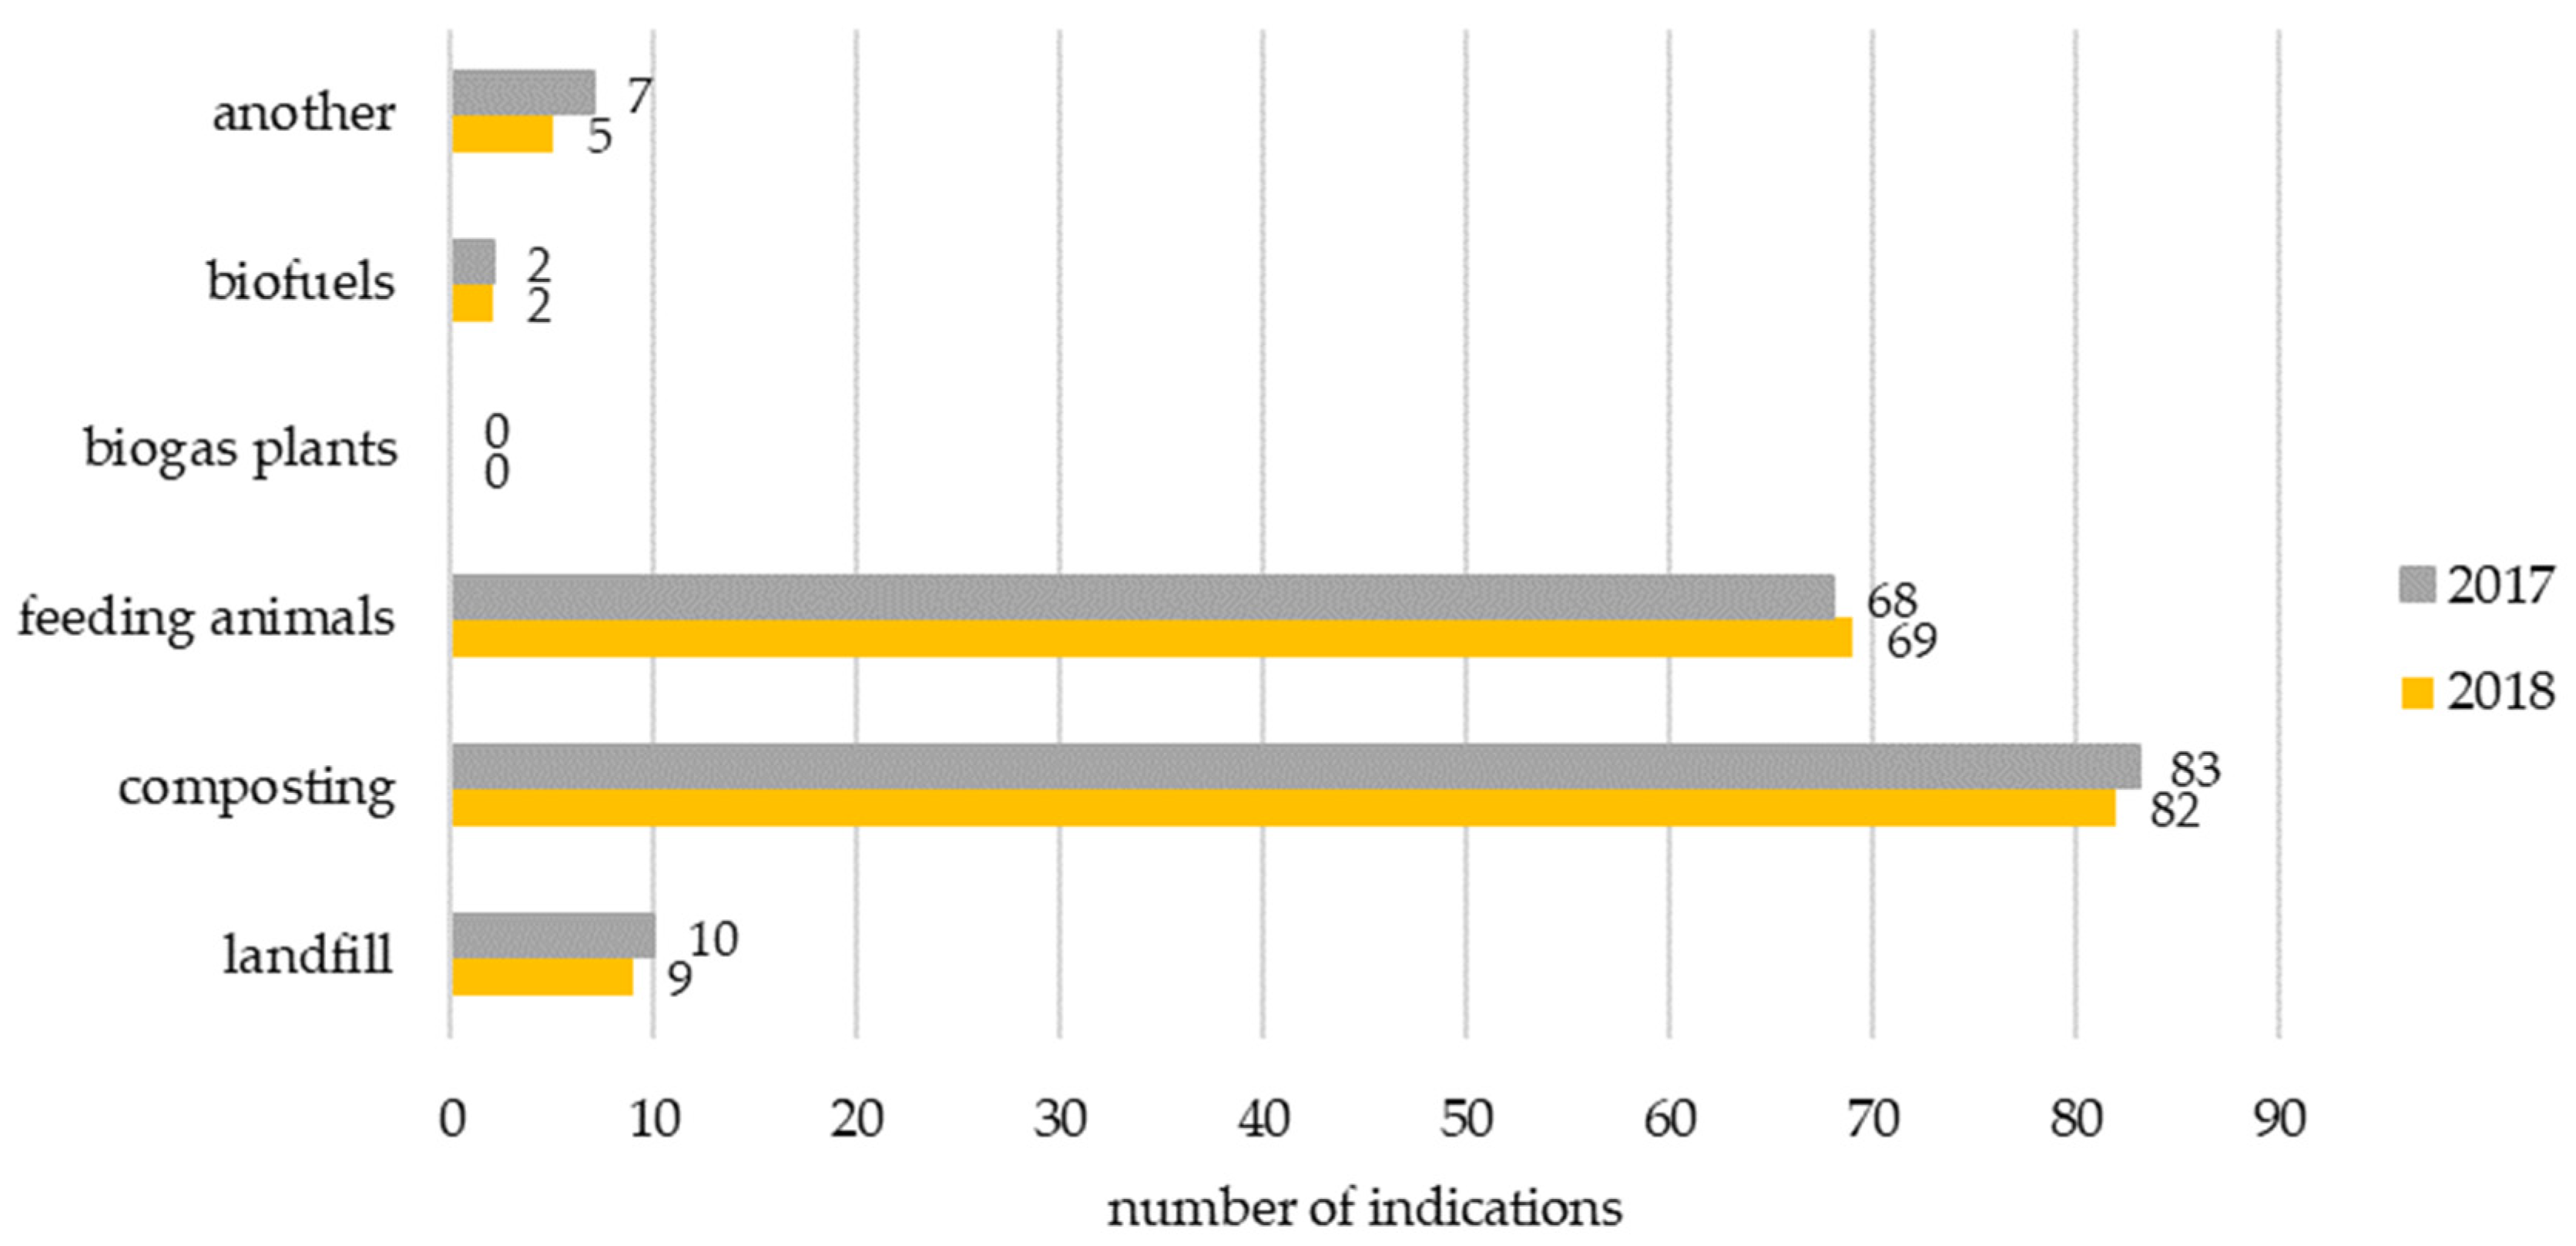
3.2.2. Ways of Waste Management

The management methods indicated by respondents for cereal grain losses in both years of the survey were the same (Figure 3). Grain of poor quality was most often composted (83 indications in 2017 and 82 indications in 2018) or used for animal feeding (68 and 69 indications in 2017 and 2018, respectively). Grain was occasionally taken to landfill (10 and 9 indications in 2017 and 2018, respectively) or used as raw material for biofuel production (2 indications in each year), while none of the farms used a biogas plant. In the category other (7 and 5 indications in 2017 and 2018, respectively), sales to other farmers for fodder were indicated, as well as lining as a baiting ground for wild animals.
In this sector, agricultural products which are not marketed for human consumption are used for processing into non-food products, animal feed, bioenergy purposes or enhancing soil fertility [49,50]. In taking a positive view of these activities, the aim should be to improve efficiency in the use of food production resources and to address the problem of reducing food losses at the farm level.
Some food losses occurring in primary production are unavoidable and should therefore be managed appropriately. The waste hierarchy generally establishes a priority order of what is the best overall solution from an environmental point of view with regard to waste legislation and policy, and deviations from the waste hierarchy may be necessary for specific waste streams, where this is justified by, inter alia, technical feasibility, economic viability and environmental protection [19].

3.3. Food Waste

On the basis of collected data concerning food losses in primary production and their management, it was calculated that in Poland in the analysed period at the first stage of the food chain, on average 507.94 thousand tonnes of food waste were generated annually (Table 5). The share of food waste in relation to the volume of production intended for consumption constituted 1.03% on average. In the production of consumer cereals, the weight of food waste was calculated at 117.24 thousand tonnes per year, which is 23.08% of all waste generated in the primary production link. The share of food waste relative to the volume of consumer cereal production was 1.12%.
The research carried out showed that the most frequently used methods of managing cereal losses were: feeding animals, composting, production of biofuels and returning to landfills. In accordance with the definitions quoted above, food losses which are used for feeding animals, which is often practised at this stage, return to circulation, while all other losses, irrespective of the method of their management, constitute food waste. To sum up, the weight of food waste in relation to food losses in consumer cereal production was lower by 46.6%, i.e., by the part of losses which was transferred to animal feed, while 53.4.% of losses which were managed in another way became waste. The way in which cereal losses are managed is closely related to their causes and the resulting defects. In the case of defects disqualifying feed use, they can be processed into non-food products or used for bioenergy purposes (bioethanol production) or compost (soil nutrient enrichment), but sometimes they have to be disposed of [49,50]. Mouldy grain cannot be used for fodder because, in addition to changes in taste and smell, it can have harmful/toxic effects on the body. Under unfavourable weather conditions, mycotoxins can accumulate in the grain even before harvesting. These are metabolites of moulds of the genus Fusarium [51,52,53]. The mycotoxins they produce include trichothecenes (e.g., deoxynivalenol, nivalenol, HT-2 toxin, T-2 toxin) and zearalenone. During storage, ochratoxin A is considered one of the most dangerous mycotoxins and produced by certain strains of fungi of the genera Aspergillus, Penicillium as well as aflatoxins B1, B2, G1, G2 produced by certain strains of fungi of the genus Aspergillus [52].

3.4. Environmental and Food Security Impacts of Consumer Cereal Losses

In order to produce the food that was wasted, investments were made, among others, in the form of means of production, as well as water and energy, whose resources are increasingly limited. According to Chen et al. [10], the environmental footprints of the average person’s daily food waste include 124 g eq. CO2, 58 L of fresh water, 0.36 m2 of arable lands, 2.9 g nitrogen and 0.48 g phosphorus. Wasting food contributes to global warming through the additional emission of greenhouse gases and other harmful substances [7,8,10]. According to Scherhaufer et al. [8], in Europe, food waste is responsible for atmospheric emissions 186 Mt CO2 eq., 1.7 Mt eq. SO2 and 0.7 Mt eq. PO4. The food industry is the third largest source of greenhouse gas emissions, after construction and transport [54,55]; therefore, food losses and wastage must be prevented at every stage of the food chain. The majority of negative environmental impacts occur at the primary production stage, with animal production being more damaging to the environment than plant production [8]. The production of consumer cereals, like other plant raw materials, has an impact on the environment through the deterioration of soil, water and air quality (reduction in soil fertility, contamination of groundwater and surface water mainly with nitrogen and phosphorus compounds, emission of greenhouse gases into the atmosphere) [7]. Reducing the negative impact of cultivation on the environment requires the introduction of more environmentally friendly cultivation practices and methods and the prevention of loss and waste of agricultural raw materials, as well as the proper management of food losses and waste at each stage of the food chain. Such a production model is presented by a closed-loop economy, in which resources/raw materials are not wasted but used more, and waste is minimised and used as secondary raw materials [6,56].
The United Nations has quantified the environmental footprint of wasted food and natural resources, in particular the carbon footprint [57]. Carbon footprint calculations based on an assessment of the volume of food wasted in 2011 and emission factors taken from the 2007 Life Cycle Assessment study were estimated at 3.3 Gt CO2 eq. (without change in land use). Based on the 2011 food balances, this figure has been updated to 3.6 Gt CO2 eq., which does not cover 0.8 Gt CO2 eq. of deforestation [58].
Global food loss and waste, including land use change, generates annually 4.4 Gt CO2 eq., or about 8% of total anthropogenic greenhouse gas emissions [59]. This means that the contribution of food waste emissions to global warming is almost equivalent to global emissions from road transport [60].
Relating the amount of food losses in the primary production of consumer cereals in Poland to the assumed emission factor of 2.769 Gt CO2 eq./billion tonnes, it was calculated that food losses at the cereal production stage during the year are responsible for 0.608 mln tonnes CO2. Total wasted food in all cells in Poland during the year is responsible for 13.406 mln tonnes CO2, of which 2.074 mln tonnes CO2 comes from losses at the primary production stage. Greenhouse gas emissions in terms of CO2 equivalents from wasted consumer cereal production account for 29.32% of emissions at the primary food production stage and 4.54% of emissions from wasted food throughout the food chain in Poland. Food wastage is a serious problem for a planet which has limited water and energy resources, but which also has an ever-increasing population and, therefore, demand for food.
On the one hand, there is overproduction of food and food waste, and on the other, there is the growing problem of hunger, which has been further exacerbated by the Covid-19 pandemic. Globally, about 1 billion tonnes of food are wasted annually, while 868 million people suffer from hunger. Therefore, halving food waste by 2030 is among the UN’s top 17 Sustainable Development Goals. Ensuring food security, which includes food self-sufficiency, economic availability of food and food safety, has also become an important aspect. The first prerequisite for ensuring food security at the state level is the physical availability of food, which means that the national food economy guarantees the coverage of at least a minimum physiological demand, while imports provide food above this minimum demand [61]. As part of the European Green Deal, the European Commission adopted the Farm to Fork Strategy for a fair, healthy and environmentally friendly food system, which aims, among other things, to ensure food security and to guarantee that consumers have access to sufficient, wholesome food that meets both safety and quality standards [42]. The strategy will contribute to sustainable production and consumption and reduce food waste.
In Poland, cereals are a basic foodstuff, and the results of this study show that we are a country with cereal production surpluses, both of basic consumer cereals (wheat, rye) and of cereals used mainly for feed purposes, which does not mean that we should not aim to reduce cereal losses at every stage of the food chain.

4. Conclusions

Poland is one of the leading cereal producers in Europe. Primarily wheat and rye grain are used for consumption purposes. The conducted research shows that in the years 2017–2018, losses of consumer cereals in Poland at the primary production stage averaged 219.6 thousand tonnes per year, which accounted for 1.7% of total consumer cereal production. Food waste generated at this stage was calculated at 117.24 thousand tonnes per year, which accounted for 53.4% of the resulting losses. The primary causes of consumer cereal grain losses at the production and storage stages were moisture, grain damage and pest incidence.
These losses do not threaten Poland’s food security, but they do reduce the economic efficiency of agriculture and contribute to environmental degradation through additional water and energy consumption and greenhouse gas emissions to the atmosphere, which have been estimated at 0.608 million tonnes CO2 eq.
The grain losses that occur at the cereal production and storage stage are to a large extent related to weather conditions, which are beyond human control.
Cereal production affects the environment through consumption of soil nutrients, water resources, fertilizers and plant protection products, and energy for agrotechnical operations. The environment is also adversely affected by the transport and processing of raw materials in the cereal sector. Limiting this impact requires, on the one hand, the introduction of more environmentally friendly practices and production methods and, on the other hand, prevention of losses and waste of agricultural raw materials and finished products made of them, and, in case of waste generation, their appropriate management.
Measures should be taken to reduce the loss of food grains through the application of good practices or elimination of the causes of losses, resulting in better economic, social and environmental indicators. By applying innovative good practices to the use of cereals that cannot be consumed by humans despite their original purpose, for feed, composting or bioenergy, environmental degradation can be reduced.
Food loss and waste is also an ethical problem, which will be exacerbated by hunger and malnutrition in many countries of the world and a predicted increase in the human population of 2 billion by 2050. As cereals are a basic raw material for food, reducing loss at the cereal production stage is particularly important in the context of ensuring food security, protecting the environment and natural resources, and for ethical and social reasons. In addition, halving food waste by 2030 is among the UN’s 17 key Sustainable Development Goals.

Supplementary Materials

The following supporting information can be downloaded at: https://www.mdpi.com/article/10.3390/agriculture12050665/s1. A questionnaire for the crop production farm—consumer cereals.

Author Contributions

Conceptualization, S.Ł. and G.C-P.; methodology, S.Ł., R.Ł. and G.C-P.; software, K.S. and R.Ł.; validation, R.Ł. and A.S.; formal analysis, S.Ł. and R.Ł.; investigation, S.Ł. and G.C.-P.; resources, S.Ł., G.C.-P. and A.S.; data curation, R.Ł.; writing—original draft preparation, S.Ł.; writing—review and editing, G.C.-P., S.Ł., R.Ł. and A.S.; visualization, S.Ł.; supervision, S.Ł. and K.S.; project administration, K.S. and R.Ł.; funding acquisition, K.S. All authors have read and agreed to the published version of the manuscript.

Funding

This research was funded by the National Centre for Research and Development grant number Gospostrateg1/385753/1/NCBR/2018 for carrying out a project called “Developing a system for monitoring wasted food and an effective program to rationalize losses and reduce food wastage” (acronym PROM).

Institutional Review Board Statement

Not applicable.

Informed Consent Statement

Not applicable.

Data Availability Statement

Not applicable.

Conflicts of Interest

The authors declare no conflict of interest.

References

  1. Hodges, R.J.; Buzby, J.C.; Bennett, B. Postharvest losses and waste in developed and less developed countries: Opportunities to improve resource use. J. Agric. Sci. 2010, 149, 37–45. [Google Scholar] [CrossRef] [Green Version]
  2. Gustavsson, J.; Cederberg, C.; Sonesson, U.; Van Otterdijk, R.; Meybeck, A. The Metheodology of the FAO Study: Global Food Losses and Food Waste-Extent, Causes and Prevention; SIK Report No. 857; FAO: Rome, Italy, 2011. [Google Scholar]
  3. Scholz, K.; Eriksson, M.; Strid, I. Carbon footprint of supermarket food waste. Resour. Conserv. Recycl. 2015, 94, 56–65. [Google Scholar] [CrossRef]
  4. Redlingshofer, B.; Coudurier, B.; Georget, M. Quantyfying food loss during primary production and processing in France. J. Clean. Prod. 2017, 164, 703–714. [Google Scholar] [CrossRef]
  5. FAO. Global Food Losses and Food Waste-Extent, Causes and Prevention; FAO: Rome, Italy, 2011. [Google Scholar]
  6. Belc, N.; Mustatea, G.; Apostol, L.; Iorga, S.; Vladut, V.N.; Mosoiu, C. Cereal supply chain waste in the context of circular economy. E3S Web Conf. 2019, 112, 03031. [Google Scholar] [CrossRef]
  7. European Court of Auditors. Combating Food Waste—An Opportunity for the EU to Improve the Resource Efficiency of the Food Supply Chain; Special Report; European Court of Auditors: Luxemburg, 2016; p. 34.
  8. Scherhaufer, S.; Moates, G.; Hartikainen, H.; Waldron, K.; Obersteiner, G. Environmental impacts of food waste in Europe. Waste Manag. 2018, 77, 98–113. [Google Scholar] [CrossRef]
  9. UNEP Food Waste Index; Report 2021; United Nations Environment Programme: Nairobi, Kenya, 2021.
  10. Chen, C.; Chaudhary, A.; Mathys, A. Nutritional and environmental losses embedded in global food waste. Resour. Conserv. Recycl. 2020, 160, 104912. [Google Scholar] [CrossRef]
  11. Łaba, S.; Bilska, B.; Tomaszewska, M.; Łaba, R.; Szczepański, K.; Tul-Krzyszczuk, A.; Kosicka-Gębska, M.; Kołożyn-Krajewska, D. Attempt to estimate food losses and wastage. Food Ind. 2020, 74, 10–18. [Google Scholar] [CrossRef]
  12. Goryńska-Goldmann, E.; Gazdecki, M.; Rejman, K.; Łaba, S.; Kobus-Cisowska, J.; Szczepański, K. Magnitude, Causes and Scope for Reducing Food Losses in the Baking and Confectionery Industry—A Multi-Method Approach. Agriculture 2021, 11, 936. [Google Scholar] [CrossRef]
  13. FUSIONS. Recommendations and Guidelines for a Common European Food Waste Policy Framework. Manual-Food Use for Social Innovation by Optimising Waste Prevention Strategies. Available online: http://www.eu-fusions.org/index.php/about-food-waste/280-food-waste-definition (accessed on 10 January 2022).
  14. Szczepańska, J. Grain market. In Selected Markets of Agri-Food Products after Poland’s Accession to the European Union; Olszańska, A., Kowalska, A., Eds.; Wydawnictwo UE: Wrocław, Poland, 2021; pp. 9–24. (In Polish) [Google Scholar]
  15. KOWR. (National Center for Agriculture Support). Grain Market in Poland. 2020. Available online: https://www.kowr.gov.pl/uploads/pliki/wydawnictwa/2020/Broszura_Rynek_zboz_w_Polsce_12.2020.pdf (accessed on 7 March 2022).
  16. Regulation (EC) No 178/2002; Laying Down the General Principles and Requirements of Food Law, Establishing the European Food Safety Authority and Laying Down Procedures in Matters of Food Safety. European Parliament: Strasbourg, France, 2002.
  17. Commission Delegated Decision (EU) C(2019)3211; Supplementing Directive 2008/98/EC of the European Parliament and of the Council with Regard to a Common Method and Minimum Quality Requirements for the Uniform Measurement of Food Waste Levels. European Commission: Brussels, Belgium, 2019.
  18. FAO. The State of Food Security and Nutrition in the World (SOFI): Safeguarding Against Economic Slowdowns and Downturns; FAO: Rome, Italy, 2019. [Google Scholar]
  19. Document 32008L0098; Directive 2008/98/EC of the European Parliament and of the Council of 19 November 2008 on Waste and Repealing Certain Directives. European Parliament: Strasbourg, France, 2008.
  20. FLW (Food Loss and Waste) Protocol 2016. Food Loss and Waste Accounting and Reporting Standard. Available online: https://flwprotocol.org/wp-content/uploads/2017/05/FLW_Standard_final_2016.pdf (accessed on 20 December 2021).
  21. FUSIONS Estimates of European Food Waste Levels. FUSIONS Reducing Food Waste through Social Innovation. In Food Use for Social Innovation by Optimising Waste Prevention Strategies (FUSIONS); FUSIONS: Stockholm, Sweden, 2016; ISBN 978-91-88319-01-2.
  22. FUSIONS. Definitional Framework for Food Waste Full Report. Reducing Food Waste through Social Innovation. European Commission. 2014. Available online: https://www.eu-fusions.org/phocadownload/Publications/FUSIONS%20Definitional%20Framework%20for%20Food%20Waste%202014.pdf (accessed on 21 December 2021).
  23. Łaba, S.; Niedek, M.; Szczepański, K.; Łaba, R.; Kamińska-Dwórznicka, A. Regulation of the food waste measuring in the EU in the light of the need of counteracting the food wastage. Environ. Prot. Nat. Resour. 2019, 30, 1–7. [Google Scholar] [CrossRef]
  24. GUS (Central Statistical Office). Statistical Yearbook of Agriculture; GUS: Warsaw, Poland, 2019.
  25. Łopaciuk, W. Polish cereal market. Grain Mark. Status Prospect. 2019, 56, 15–34. (In Polish) [Google Scholar]
  26. Kwasek, M.; Borowski, M.; Kowalewska, M.; Obiedzińska, A. Analysis of food losses and wastage in the world and in Poland. In Monographs of the Multiannual Program; Kwasek, M., Ed.; IERiGŻ-PIB: Warsaw, Poland, 2016. (In Polish) [Google Scholar]
  27. Niedek, M.; Łaba, S.; Szczepański, K.; Krajewski, K. Quantitative methods in the study of food losses and wastage in the primary production sector. Quant. Methods Econ. 2019, 20, 263–279. (In Polish) [Google Scholar]
  28. Kulczycka, J.; Wernicka, M. Methods and Results of Calculating the Carbon Footprint of the Activities of Selected Entities in the Energy and Mining Industry; Institute of Mineral and Energy Economy of the Polish Academy of Sciences: Kraków, Poland, 2015. (In Polish) [Google Scholar]
  29. Łaba, S.; Cacak-Pietrzak, G.; Szczepański, K.; Sułek, A. Food Loss and Waste in the Production of Consumer Cereals. Przegl. Zboż-Młyn. 2020, 1, 24–29. (In Polish) [Google Scholar]
  30. Neethirajan, S.; Karunakaran, C.; Jayas, D.S.; White, N.D.G. Detection techniques for stored-product insects in grain. Food Control 2007, 18, 157–162. [Google Scholar] [CrossRef]
  31. Bencze, S.; Balla, K.; Varga, B.; Veisz, O. Effect of climate extremes on the grain yield and quality of cereals. Acta Agron. Hung. 2010, 58, 115–120. [Google Scholar] [CrossRef]
  32. Rozbicki, J.; Ceglińska, A.; Gozdowski, D.; Jakubczak, M.; Cacak-Pietrzak, G.; Mądry, W.; Golba, J.; Piechociński, M.; Sobczyński, G.; Stadnicki, M.; et al. Influence of the cultivar, environment and management on the grain yield and bread-making quality in winter wheat. J. Cereal Sci. 2015, 61, 126–132. [Google Scholar] [CrossRef]
  33. Sułek, A.; Cacak-Pietrzak, G. The influence of production technology on yielding of grain quality of spring wheat cultivars. Res. Rural Dev. 2018, 2, 42–48. [Google Scholar] [CrossRef]
  34. Ben Mariem, S.; Soba, D.; Zhou, B.; Loladze, I.; Morales, F.; Aranjuelo, I. Climate Change, Crop Yields, and Grain Quality of C3 Cereals: A Meta-Analysis of [CO2], Temperature, and Drought Effects. Plants 2021, 10, 1052. [Google Scholar] [CrossRef]
  35. Kwasek, M.; Łaba, S. Loss and food waste in primary production (agriculture) in Poland. In Food Losses and Waste in Poland. The Scale and Causes of the Problem; Instytut Ochrony Środowiska—Państwowy Instytut Badawczy: Warsaw, Poland, 2020; pp. 53–72. [Google Scholar]
  36. Jurga, R. Just about everything about grain damage to cereals. Przegl. Zboż. Młyn. 2011, 6, 34–37. (In Polish) [Google Scholar]
  37. Bryś, Z. Safe storage of cereal grains. In Training Materials. The Newest Methods of Growing and Storing Cereals for Consumption; IUNG-PIB: Puławy, Poland, 2010. [Google Scholar]
  38. Katagi, A.; Malashetti, I. Use of plant products for safe and economic storage of food grains. Adv. Res. J. Crop Improv. 2014, 5, 53–56. [Google Scholar]
  39. Klejdysz, T.; Mrówczyński, M. Methodology of Integrated Grain Storage Protection for Advisers; IOR-PIB: Poznań, Poland, 2017. (In Polish) [Google Scholar]
  40. Loganathan, M.; Akash, U.; Durgalakshmi, R.; Anandharamakrishnan, C. Constraints in Grain quality management: A warehouse journey. In Proceedings of the 12th International Working Conference on Stored Product Protection (IWCSPP), Berlin, Germany, 7–11 October 2018; pp. 98–100. [Google Scholar]
  41. Brader, A.; Lee, R.C.; Plarre, R.; Burkholder, W.; Kitto, G.B.; Kao, C.; Polston, L.; Dorneanu, E.; Szabo, I.; Mead, B.; et al. A comparison of screening methods for insect contamination in wheat. J. Stored Prod. Res. 2002, 38, 75–86. [Google Scholar] [CrossRef]
  42. Hagstrum, D.W.; Subramanyam, B. Fundamentals od Stored-Product Entomology; AACC International: St. Paul, MN, USA, 2006; p. 322. Available online: https://www.consilium.europa.eu/pl/policies/from-farm-to-fork/ (accessed on 15 February 2022).
  43. Stejskal, V.; Hubert, J.; Aulicky, R.; Kucerova, Z. Overview of present and past and pest-associated risks in stored food and feed products: European perspective. J. Stored Prod. Res. 2015, 64, 122–132. [Google Scholar] [CrossRef]
  44. Olejarski, P.; Węgorek, P.; Zamojska, J. Monitoring and control of stored grain insect pest in grain stores in Poland. Prog. Plant Prot. 2013, 53, 455–461. [Google Scholar]
  45. Rajendran, S. Postharvest pest losses. In Encyklopedia of Pest Management; Pimentel, D., Ed.; Marcel-Dekkert: New York, NY, USA, 2002; pp. 654–656. [Google Scholar]
  46. Nietupski, M. Competition or cooperation?—The concurrent development of grain weevil (Sitophilus granarius L.) and lesser grain borer (Rhyzopertha dominica F.) on barley grain. Prog. Plant Prot. 2020, 60, 149–156. [Google Scholar] [CrossRef]
  47. Nietupski, M.; Kwiatkowski, J.; Kosewska, A. Physicochemical properties of achenes of different buckwheat genotypes affecting thedevelopment of grain weevil (Sitophilus granarius L.) and lesser grain borer (Rhyzopertha dominica F.). Zemdirbyste-Agriculture 2017, 104, 311–320. [Google Scholar] [CrossRef] [Green Version]
  48. Świerczyński, K.; Olejarski, P.; Boniecki, P. Using of artificial neuronal networks in identification process of granary weevils. J. Res. Appl. Agric. Eng. 2008, 53, 73–75. [Google Scholar]
  49. Paritosh, K.; Kushwaha, S.K.; Yadav, M.; Pareek, N.; Chawade, A.; Vivekanand, V. Food Waste to Wnergy: An Overview of Sustainable Approaches for Food Waste management and Nutrient Recycling. BioMed Res. Int. 2017, 2017, 2370927. [Google Scholar] [CrossRef]
  50. Melikoglu, M.; Turkmen, B. Food waste to Energy: Forecasting Tyrkey’s bioethanol generation potential from wasted crops and cereals till 2030. Sustain. Energy Technol. Assess. 2019, 36, 100553. [Google Scholar] [CrossRef]
  51. Stanciu, O.; Banc, O.; Cozma, A.; Filip, L.; Miere, D.; Mañes, J.; Loghin, F. Occurence of Fusarium mycotoxins in wheat from Europe—A review. Acta Univ. Cibiniensis Ser. E Food Technol. 2015, XIX, 35–60. [Google Scholar] [CrossRef] [Green Version]
  52. Bryła, M.; Waskiewicz, A.; Podolska, G.; Szymczyk, K.; Jędrzejczak, R.; Damaziak, K.; Sułek, A. Occurrence of 26 Mycotoxins in the Grain of Cereals Cultivated in Poland. Toxins 2016, 8, 160. [Google Scholar] [CrossRef] [Green Version]
  53. Ji, F.; He, D.; Olaniran, A.O.; Mokoena, M.P.; Xu, J.; Shi, J. Occurence, toxicity, production and detection of Fusarium mycotoxin: A review. Food Prod. Proc. Nutr. 2019, 1, 6. [Google Scholar] [CrossRef]
  54. Papargyropoulou, E.; Lozano, R.K.; Steinberger, J.; Wright, N.; Bin Ujang, Z. The food waste hierarchy as a framework for the management of food surplus and food waste. J. Clean. Prod. 2014, 76, 106–115. [Google Scholar] [CrossRef]
  55. Wielicka-Regulska, A.; Mitmańska, Ż.; Kiss, M. The role and activity of food banks in reducing food losses and malnutrition in Poland. Handel Wew. 2018, 3, 395–405. (In Polish) [Google Scholar]
  56. Stahel, W. The Circular Economy: A User’s Guide; Routledge: London, UK; New York, NY, USA, 2019. [Google Scholar]
  57. FAO. Food Wastage Footprint: Impacts on Natural Resources; Summary Report; FAO: Rome, Italy, 2013. [Google Scholar]
  58. FAO. Food Wastage Footprint: Full-Cost Accounting; Final Report; FAO: Rome, Italy, 2014. [Google Scholar]
  59. Olivier, J.G.J.; Bouwman, A.F.; Van Der Maas, C.W.M.; Berdowski, J.J.M. Emission database for global atmospheric research (Edgar). Environ. Monit. Assess. 1994, 31, 93–106. [Google Scholar] [CrossRef] [PubMed]
  60. IPCC. Transportation. In Fifth Assessment Report; IPCC: Geneva, Switzerland, 2014. [Google Scholar]
  61. Kapusta, F. Evolution of the food security of Poland and its inhabitants at the beginning of the 21st century. Zagadnienia Ekon. Rolnej 2017, 1, 161–178. [Google Scholar] [CrossRef]
Figure 1. Mass flow diagram of cereal grains in the food balance. Source: own compilation based on Gustavsson et al. [2]. Production (A)—expressed in weight of cereal grains; Imports (B)—all flows of raw materials/products of cereals into Poland; Change in stocks (C)—difference between stocks of cereal grains at the beginning and end of year; Exports (D)—all movements of raw materials/cereal products out of Poland; Domestic supply (E)—E = A + B + C − D; Feed (F)—quantity of cereal grains used for animal feed; Seeds (G)—quantity of cereal grains used for reproduction (seed); Industrial consumption (H)—industrial consumption, excluding food production; Other (I)—the quantity of cereal grains lost, e.g., during storage, transport between production and distribution and the quantity of grain used for non-food purposes, e.g., for biofuel production; Food (J)—raw materials/cereal products available for human consumption, such as: flours, groats, flakes.
Agriculture 12 00665 g001
Figure 2. Primary causes of losses during cereal grain storage in 2017 and 2018.
Agriculture 12 00665 g002
Figure 3. Methods of managing cereal losses by number of indications in 2017 and 2018.
Agriculture 12 00665 g003
Table 1. Number of farms surveyed, total number of cereal farms by NUTS 1 macro-region for cereal production sector in 2017 and 2018.
Macroregion NUTS 1Number of FarmsNumber of Farms
(Poland)
Sample Share in Population
(%)
Central39199,4820.020
Southwest1579,4840.019
South31174,8600.018
Northwest33161,1150.020
West29128,1930.023
Mazowieckie
voivodeship
31177,8120.017
East68375,7360.018
Total2461,296,6820.019
Table 2. Mass balance of basic cereals (thousand tonnes) in Poland in 2014–2018.
SpecificationCereals
WheatRyeBarleyOatsMaize
Components of supply
Production (A)10,9802369330413523971
Imports (B)10673036133714
Stocks initial (Zp)1808615549 2084
Closing stocks (Zk)1487505433 1706
Change in state stocks (C)16071101154 1892
Exports (D)3666494234841093
Domestic supply (E)870220163547 3970
Components of use
Feed (F)30305502391 3021
Seeds (G)548159181 23
Consumption industrial (H)6643737358688
Other554121126 216
Food (J)39068141131422
Source: own elaboration based on CSO and IERiGŻ-PIB database [24] and Łopaciuk [25].
Table 3. Consumer cereal grain losses (thousand tonnes) in Poland in 2014–2018 during transport from the field, post-harvest treatments and storage.
Type of Cereal20142015201620172018Mean from Years 2014–2018
Wheat167.5157.8155.9168.0141.4158.1
Rye39.128.230.837.430.333.2
Barley5.24.75.56.14.95.3
Oats0.60.50.50.60.50.5
Maize1.81.31.71.61.51.6
Total214.2192.5194.4213.7178.6
Source: own study.
Table 4. Cultivated area and weight of cereal harvest per year for each NUTS 1 macro-region in 2017–2018.
NUTS 1 Macro-RegionNumber of FarmsTotal Surface Area
Crops (ha)
Area Under Cereals (ha)Total Weight of Cereals Harvested (t)Weight of Total Cereal Harvest, Average Per Farm (t)Harvested Weight of Basic Cereals (t)Weight of Harvested Basic Cereals, on Average Per Farm (t)
201720182017201820172018201720182017201820172018
Central39742.98772.21287.15297.731850.751847.447.4647.371552.431547.839.8139.69
Southwest15286.86301.25184.09172.841315.251126.7587.6875.121143.25991.2576.2266.08
South31307.34300.78191.41194.521188.11167.1938.3337.65691.9805.6422.3225.99
Northwest33655.38652.57412.09413.311902.131665.0757.6450.461644.571503.3549.8445.56
North29762.58805.90415.2486.212487.612680.885.7892.441500.311750.851.7360.37
Mazowieckie Voiv.31497.89497.00262.02269.251615.81457.3552.1247.011205.11099.9538.8735.48
Eastern68930.42933.73566.74581.822849.122852.5841.9041.952350.122368.2634.5634.83
Total2464183.454263.442318.702415.6813,208.7612,797.1453.6952.0210,087.6810,067.0541.0140.92
Source: own study.
Table 5. Weight of food waste in total primary production in Poland and in the consumer cereal sector in 2017–2018.
Share of Food Waste in the Volume of Production on Surveyed Farms (%)Production Volumes in Poland
for Consumption *
(Thousand Tonnes)
Weight of Food Waste in Primary Production
(Thousand Tonnes)
20172018
Total primary production1.0341,564.3540,299.2507.94
Of which cereals sector is1.1211,333.389506.9117.24
* on the basis of market analyses carried out by IERiGŻ—PIB. Source: compiled on the basis of data of IOŚ-PIB.
Publisher’s Note: MDPI stays neutral with regard to jurisdictional claims in published maps and institutional affiliations.

