Article

Research on the Disturbance Sources of Vegetable Price Fluctuation Based on Grounded Theory and LDA Topic Model

1
College of Public Administration, Huazhong Agricultural University, Wuhan 430070, China
2
School of Art and Design, Wuhan Institute of Technology, Wuhan 430205, China
3
Faculty of Arts, Hiroshima City University, Hiroshima 7313194, Japan
*
Author to whom correspondence should be addressed.
Agriculture 2022, 12(5), 648; https://doi.org/10.3390/agriculture12050648
Submission received: 4 March 2022 / Revised: 18 April 2022 / Accepted: 27 April 2022 / Published: 29 April 2022
(This article belongs to the Section Agricultural Economics, Policies and Rural Management)

Abstract

:
Vegetables are an important element in people’s dietary structure, and the price fluctuation of vegetables has attracted more and more attention. The disturbance sources of vegetable price fluctuations are characterized by uncertain risks, environmental complexity, nonlinearity, self-organization and mutation. Analyzing the disturbance sources that affect vegetable price fluctuation is helpful to the establishment of early warning and regulation mechanisms of vegetable price risk. To address the problem that existing studies have not comprehensively and objectively clarified the disturbance sources of vegetable price fluctuations, this paper proposes a method of combining the LDA (Latent Dirichlet Allocation) topic model with grounded theory, constructs a system of vegetable price volatility disturbance source indicators and relationship matrix by improved conceptual lattice-weighted cluster method, obtains 23 disturbance sources indicators affecting vegetable price fluctuations in four aspects of supply, demand, natural environment and economic policy environment, and identifies six key factors through calculation and analysis. Through the research of this paper, a system of disturbance source indicators affecting vegetable price fluctuations is constructed, the internal connection of many disturbance sources of vegetable price fluctuations in a complex and uncertain environment is clarified, and key influencing factors are selected, thus facilitating the establishment of vegetable price risk warning models and regulation mechanisms.

1. Introduction

China is the world’s largest vegetable producer and consumer, with a large import and export volume of vegetables. According to data from 2017, China’s vegetable output was 5.44 million tons, ranking first among the major vegetable producing countries in the world. With a large population base, China has naturally become the largest vegetable consumer (Data source: http://www.stats.gov.cn/, accessed on 1 February 2022). China has a large import and export volume of vegetables. Since China’s reform and opening up, the Chinese vegetable industry has developed rapidly and its production scale has continued to expand [1]. From the supply side, in 2019, the vegetable planting area was more than 300 million acres, and the annual production exceeds 72 million tons, with foreign exports exceeding 11 million tons, creating huge foreign exchange income. From the demand side, the national vegetable consumption reached 709.8954 million tons in 2019. Compared with the average annual compound growth rate of 0.46% of the population, the compound growth rate of vegetable consumption reached 2.06%. Affected by many factors, such as increased costs, extreme weather, information asymmetry and market environment, vegetable price volatility is increasing (national vegetable industry development plan 2015–2020). In 2019, typhoon “lichima” caused a severe rainstorm in Shouguang City, Shandong Province, which affected many vegetables, and the prices of some vegetables in Beijing increased by as much as 30%. The frequent and violent fluctuation of vegetable prices not only brings huge losses to producers and consumers but also puts pressure on the government’s market regulation. In the complex domestic and international environment, it increases the uncertainty of the vegetable market, which also makes it difficult to study the influencing factors of vegetable price fluctuation in complex and uncertain environments. This is the significance of this paper, in order to find the infection source of vegetable price fluctuation in complex and uncertain environments.
Regarding the sources of disturbances in vegetable price fluctuations, domestic and foreign scholars have mainly studied three aspects: demand, supply, and circulation. From the demand side, Gilbert studied the impact of demand growth, currency expansion and exchange rate changes on agricultural product prices [2]. Using the ARCH and GARCH models, the inherent logic of the fluctuation of vegetable prices and the money supply was found [3]. Some scholars have found that people prefer fresh vegetables, therefore, the fluctuation of vegetable prices will be affected by their quality [4]. The reason is that vegetables are perishable, which also leads to the rapid transmission of their decline, which directly leads to changes in vegetable supply [5].
In addition to demand factors, supply-related factors may also lead to the volatility of vegetable prices, and scholars have conducted studies from the perspective of the vegetable supply chain [6], of which production cost is the most important factor [7]. Additionally, the quality of fertilizers, pesticides, seeds and other production materials can constitute a source of production risk for agricultural products. In addition, through the research on the policy reform of supply chain regulations in fresh fruit and vegetable market in Turkey, scholars found that after reducing the number of middlemen, the wholesale price of fresh vegetables was effectively reduced [8]. In addition, the supply level is also related to the export system between importing countries, and seasonal tariff quotas also lead to fluctuations in vegetable prices [9].
Risks may also arise at the circulation level, with many scholars focusing on the transmission of vegetable prices at the wholesale and marketing levels [10]. Transaction costs are an important source of risk in fresh produce markets, and capital market shocks can amplify risks following a reduction in the production of storage-resistant vegetables; Ward, R. found that wholesale prices fluctuate first, followed by changes in retail and point-of-shipment prices [11]. There are also studies showing that online public opinion will have a potential impact on vegetable price fluctuations [12], and media hype and government macro-control will aggravate vegetable price fluctuations [13]; in addition, scholars have made a knowledge map of vegetable price research at home and abroad by combing a large number of vegetable price literature [14].
From the existing literature, domestic and foreign scholars have done some research on the interference sources of vegetable price fluctuation, which provides a certain reference for this study, but there are some deficiencies. The research on the risk sources of vegetable price fluctuation is generally considered from a single factor, such as supply, demand and weather. However, the environment affecting vegetable price fluctuation is often uncertain, complex and diverse. Firstly, most scholars consider the single variables that affect vegetable prices, such as quality factors, seasonal replacement factors, natural disaster factors, etc., when studying vegetable price fluctuations from a single perspective they often ignore the influence of other factors and variables, resulting in the lack of scientificity of the results; secondly, even if some studies involve several factors, their standards are different, which makes the verification results lack unity and unconvincing. Then, few scholars study the influencing factors of vegetable price fluctuation in extremely uncertain environments; finally, some studies use the form of a questionnaire, which has great subjectivity. Based on this, this paper aims to solve two problems: one is to select vegetable price interference sources by using an objective quantitative method which can adapt to the chaotic nature; second, to take the vegetable price under complex and uncertain environment as the research object and establish the early warning index system of vegetable price risk. Therefore, different from the traditional expert consultation method or literature review method, the data source of this paper is to collect the text data of network platforms, industry consultation websites and academic literature websites, extract the subject words by LDA method, select the initial interference source of vegetable price fluctuation, and then code and sort through grounded theory to establish the interference source index system of vegetable price fluctuation. The key influencing factors are selected by the concept lattice weighted group method.

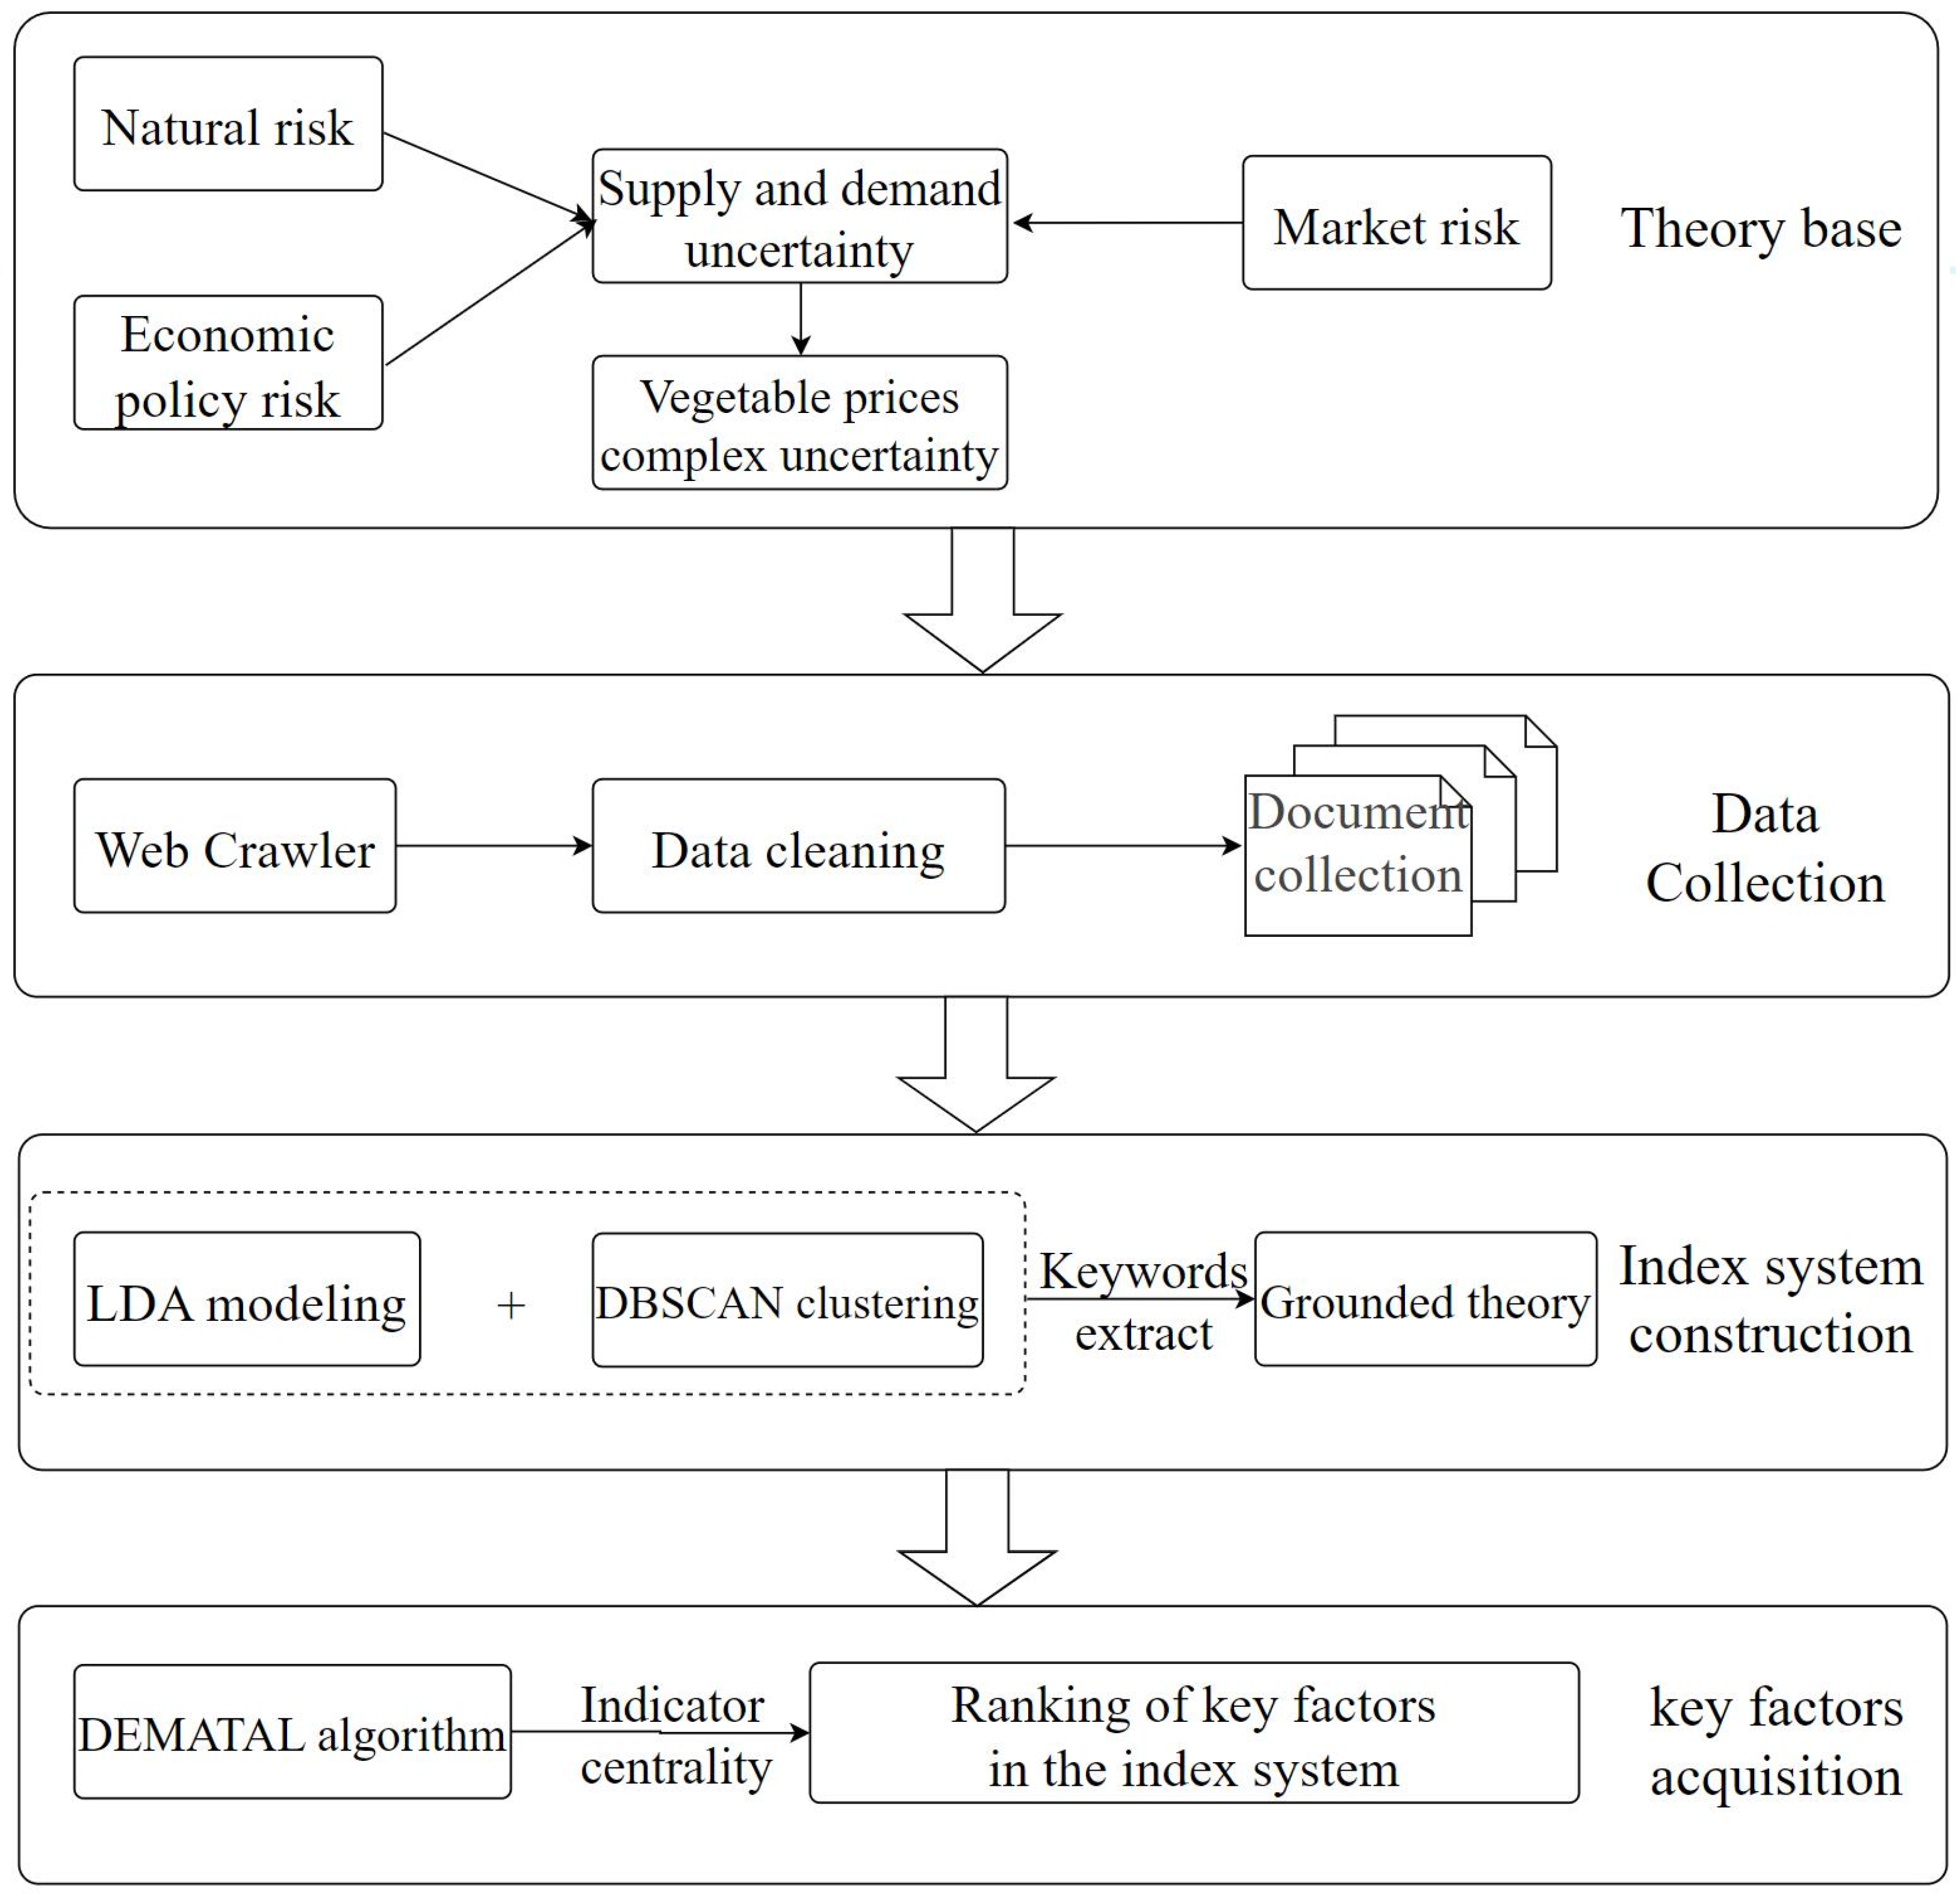
2. Theoretical Framework and Method Selection

2.1. Theoretical Framework

The realistic and complex economic environment is full of unknowns, and every subject in economic activities will inevitably face the uncertainty of the probability distribution that cannot be fully known in the decision-making process. Lack of market information, storage facility problems, and lack of processing industries are all problems facing the development of the vegetable industry [15]. In China, the vegetable market is frequently threatened by natural risks, economic policy risks, and market risks [16], which are manifested in the uncertainty of the supply relationship in the Chinese vegetable market. From the Equilibrium Price Theory and Cobweb Theory, supply and demand in the market is the basis for the formation of product prices; when the market supply and demand change, product prices will also change accordingly, and the uncertainty of the supply relationship leads to the complex uncertainty of vegetable prices. In terms of natural risks, unpredictable and unexpected factors, such as extreme weather and insect pests will reduce the quantity of vegetables supplied, leading to violent fluctuations in vegetable prices in a short period of time. In terms of economic policy risks, producers in the vegetable market are susceptible to policy adjustments to adjust vegetable production and planting varieties, which will affect vegetable supply. In addition, the gradual decline of the demographic dividend in the development of China’s economy and the upward pressure on agricultural production crowding out profit margins may have an impact on the market’s supply and demand. In terms of market risks, fluctuations in the prices of related substitutes affect the demand for products, and thus lead to fluctuations in the prices of vegetables. As the marketization of vegetables and other agricultural products continues to deepen, the production and circulation of their industrial chains are more transparent and more vulnerable to online public opinion, food safety issues, etc., resulting in rapid fluctuations in vegetable prices in a short period of time. In order to clarify the interference sources of vegetable price fluctuations in a complex and uncertain environment, we train the obtained vegetable price-related network text data based on the LDA topic model to obtain the document-topic distribution of the data samples [17]. DbSCAN (Density-Based Spatial Clustering of Applications with Noise) clustering algorithm is applied to achieve text clustering, clustering similar corpora into one class, and generating core corpus and subject words by computationally sorting the text data in each class [18]. The grounded theory method is used to encode the extracted topic words [19]. After three coding stages, namely, open coding, main axis coding and selective coding, an index system of interference sources that affect vegetable price fluctuations is initially obtained. The key influencing factors are identified by applying the subjective and objective comprehensive weighting method based on the concept lattice-weighted group DEMATEL technology to determine the importance ranking of the interference source indicators of vegetable price fluctuations [20]. The model framework of this article is shown in Figure 1.

2.2. Research Methodology

2.2.1. LDA Topic Mining

Based on the assumption of the bag of word model, the LDA topic model assumes that the text set is D , and w l d is the l th word in the corpus d , z l d is the topic to which the l th word in corpus d belongs, θ l d represents the vector composed of the probability of the topic t in the corpus d . θ l d = [ t 1 , t 2 , ] ,   t 1 , t 2 is the probability of being in the corpus d . ψ υ t represents the probability that the topic t contains the participle υ , and ψ t represents the vector composed of the probabilities of the participle υ contained in the topic t [21]. The generation of the LDA topic model is mainly divided into two processes:
(1)
Generate topic distribution θ d for a piece of corpus d from the distribution of D i r i c h l e t ( α ) , and then assign a topic z d , n to the word according to θ d for the n th word in corpus d .
(2)
Generate K topic-word distribution ψ υ t from the distribution of D i r i c h l e t ( β ) , select ψ z d , n with number z d , n and generate ω d , n according to this distribution.
α , β are the parameters involved in the model, and K is the number of topics. The topic of each word is determined by Gibbs sampling, and then θ d and ψ υ t are calculated by counting the information of the word and topic. Input corpus data into the LDA topic model [17], training can obtain K topics. Meanwhile, each corpus is represented as a probability vector distribution of K topics, realizing the topic vectorized representation of the corpus. Then the obtained probability vector distribution matrix is used as the input of the DBSCAN clustering algorithm to divide the data into different categories [18]. Finally, the topic words are extracted in the central corpus by selecting the corpus with a higher importance in the representative corpus as the central corpus. Based on the assumption of the TextRank model: a corpus can be considered an important corpus if it has high similarity with another corpus. If there are two sentences S i and S j , the similarity calculation formula is Equation (1).
Similarity ( S i , S j ) = | { t k t k S i t k S j } | log | S i | + log | S j |
t k represents candidate keywords. Calculate the similarity of the next sentence of each classification topic according to the formula, extract the most important T sentences as the core corpus and extract topic words from it. The evaluation indicators selected by the DBSCAN clustering algorithm in this paper are Calinski–Harabasz (CH coefficient) to calculate the compactness of each cluster, the Davies–Bouldin Index (DB coefficient) to calculate the average maximum similarity of each cluster [22], and the Silhouette Coefficient (SC Coefficient) to calculate the degree of cohesion and separation of each cluster class [23].

2.2.2. Grounded Theory

Application of Grounded Theory to construct an indicator system for sources of disturbances in vegetable price fluctuations. Grounded theory is a qualitative research method that constructs an initial theory through three-level coding of collected data and returns to the original data and actual scenarios to be tested for theoretical saturation to revise and refine the constructs [19]. Grounded theory can effectively avoid the limitations of the data paradigm, which relies only on empirical formulas or a priori theoretical models to conduct “programmatic” research on the collected data. Currently, this approach is mostly used in the field of management, including the exclusion of influencing factors and the construction of models of influencing factors for a phenomenon or behavior [24].

2.2.3. Improved Concept Lattice-Weighted Group DEMATEL Algorithm

To address the shortcomings of previous studies on vegetable price volatility in terms of indicator evaluation and inter-factor information mining, this study introduces a comprehensive subjective and objective weighting method based on the conceptual lattice-weighted group DEMATEL technique, evaluating a system of indicators of disturbance sources of vegetable price fluctuations derived from rooting theory and exploring the interactions among the factors [20]. The subjective-objective assignment method can not only fully reflect the evaluator’s subjective perception degree of different indicators, but also objectively process known information, thus making up for the shortcomings of the traditional assignment algorithm in the accuracy and objectivity of determining the relationship between factors. The calculation formula of the relationship coefficient between the factors in the improved concept lattice-weighted group DEMATEL algorithm is Equation (2).
z i j = l = 1 p λ l · z i j
z i j is the initial matrix obtained after the expert scoring method is used to determine the influence relationship between factors, λ l is the weight coefficient after clustering experts with the same judgment, and z i j represents the influence matrix of all expert opinions. According to the steps of the traditional DEMATEL algorithm, the centrality and cause of each factor can be calculated, centrality represents the importance of the factor in the system, and cause represents the interaction of the factor with other factors. The weight value ω j of each factor in the probability vector distribution matrix of the LDA topic model and the centrality r j calculated by the concept lattice-weighted group DEMATEL algorithm can be weighted average to obtain the final weighted centrality G j of each factor, and then leads to the identification of key factors and their interactions, the calculation formula is as follows:
G j = r j ω j j = 1 n r j ω j

3. Data Sources and Data Processing

3.1. Data Sources

The data sources of this article are news, analytical articles, and academic articles related to vegetable prices. Head Internet platforms, industry consulting websites, and academic literature websites are selected as the main data collection websites. The specific data sources are shown in Table 1.
The crawled data set contains 85,216 articles related to the fluctuation of vegetable prices from 2010 to 2020, each of which includes title, text content, publishing time and publisher. In addition, there were 950 articles on CNKI, spanning 2010 to 2020, each of which includes a title, abstract, author and text. The data source selected in this paper is based on the top six people with high attention. Based on China’s web page’s clicks and dispatch volume, the top six websites are Baidu, Weibo, WeChat subscription accounts, Consultation huinong, The China agriculture information network, and China National Knowledge Infrastructure (CNKI). In addition, they rank in seventh place and differ greatly from sixth place. Therefore, this article selects only the first six websites as data sources. Ignore other URLs. At the same time, the high-precision crawler is used to only focus on the articles and comments on the fluctuation of vegetable prices under complex uncertainty. After multiple screenings, the data with less relevance are deleted. After later testing, the data is highly representative.

3.2. Data Processing

In order to facilitate the model construction, data cleaning, word separation and deactivation are needed for the raw text data. After removing punctuation marks and network tags from the text, there are still more high-frequency prepositions, adverbs, conjunctions and tone words in the data that do not contribute substantially to the results, such as “the”, “and”, “do”, etc. These will have inhibitory effects on other words and reduce the processing efficiency and accuracy of the text data, so the data need to be deactivated, and this step requires a deactivation word lexicon. In this paper, we choose a list of commonly used deactivated words and additionally add some deactivated words related to this study by manual screening method. Since the original text will also contain many vegetable nouns as well as grain and meat nouns, which are less useful for studying the sources of disturbances in vegetable price fluctuations, they are also added to the deactivation word list (Table 2).

3.3. Descriptive Statistical Analysis of Text Data

There are 7002 documents in this research data set. After data preprocessing, the text data set contains 85,216 paragraphs, with a total of 106,273 words.
The statistics in Table 3 show that vegetable price-related web articles have variability, in terms of the total number of words in individual documents, the mean value of the dataset is 1064 with a standard deviation of 155, and from the number of paragraphs in individual documents, it can be seen that each article has an average of 12 paragraphs with a standard deviation of 37, indicating that the length of different vegetable price-related web articles and their relevance to the content of the study have some variability. From the number of words per paragraph, it can be seen that the average number of words with a certain meaning in each paragraph is 6, and the standard deviation is 5, indicating that there is variability in the structure and content of different paragraphs in vegetable price-related web articles.

4. Model Calculation Results and Analysis

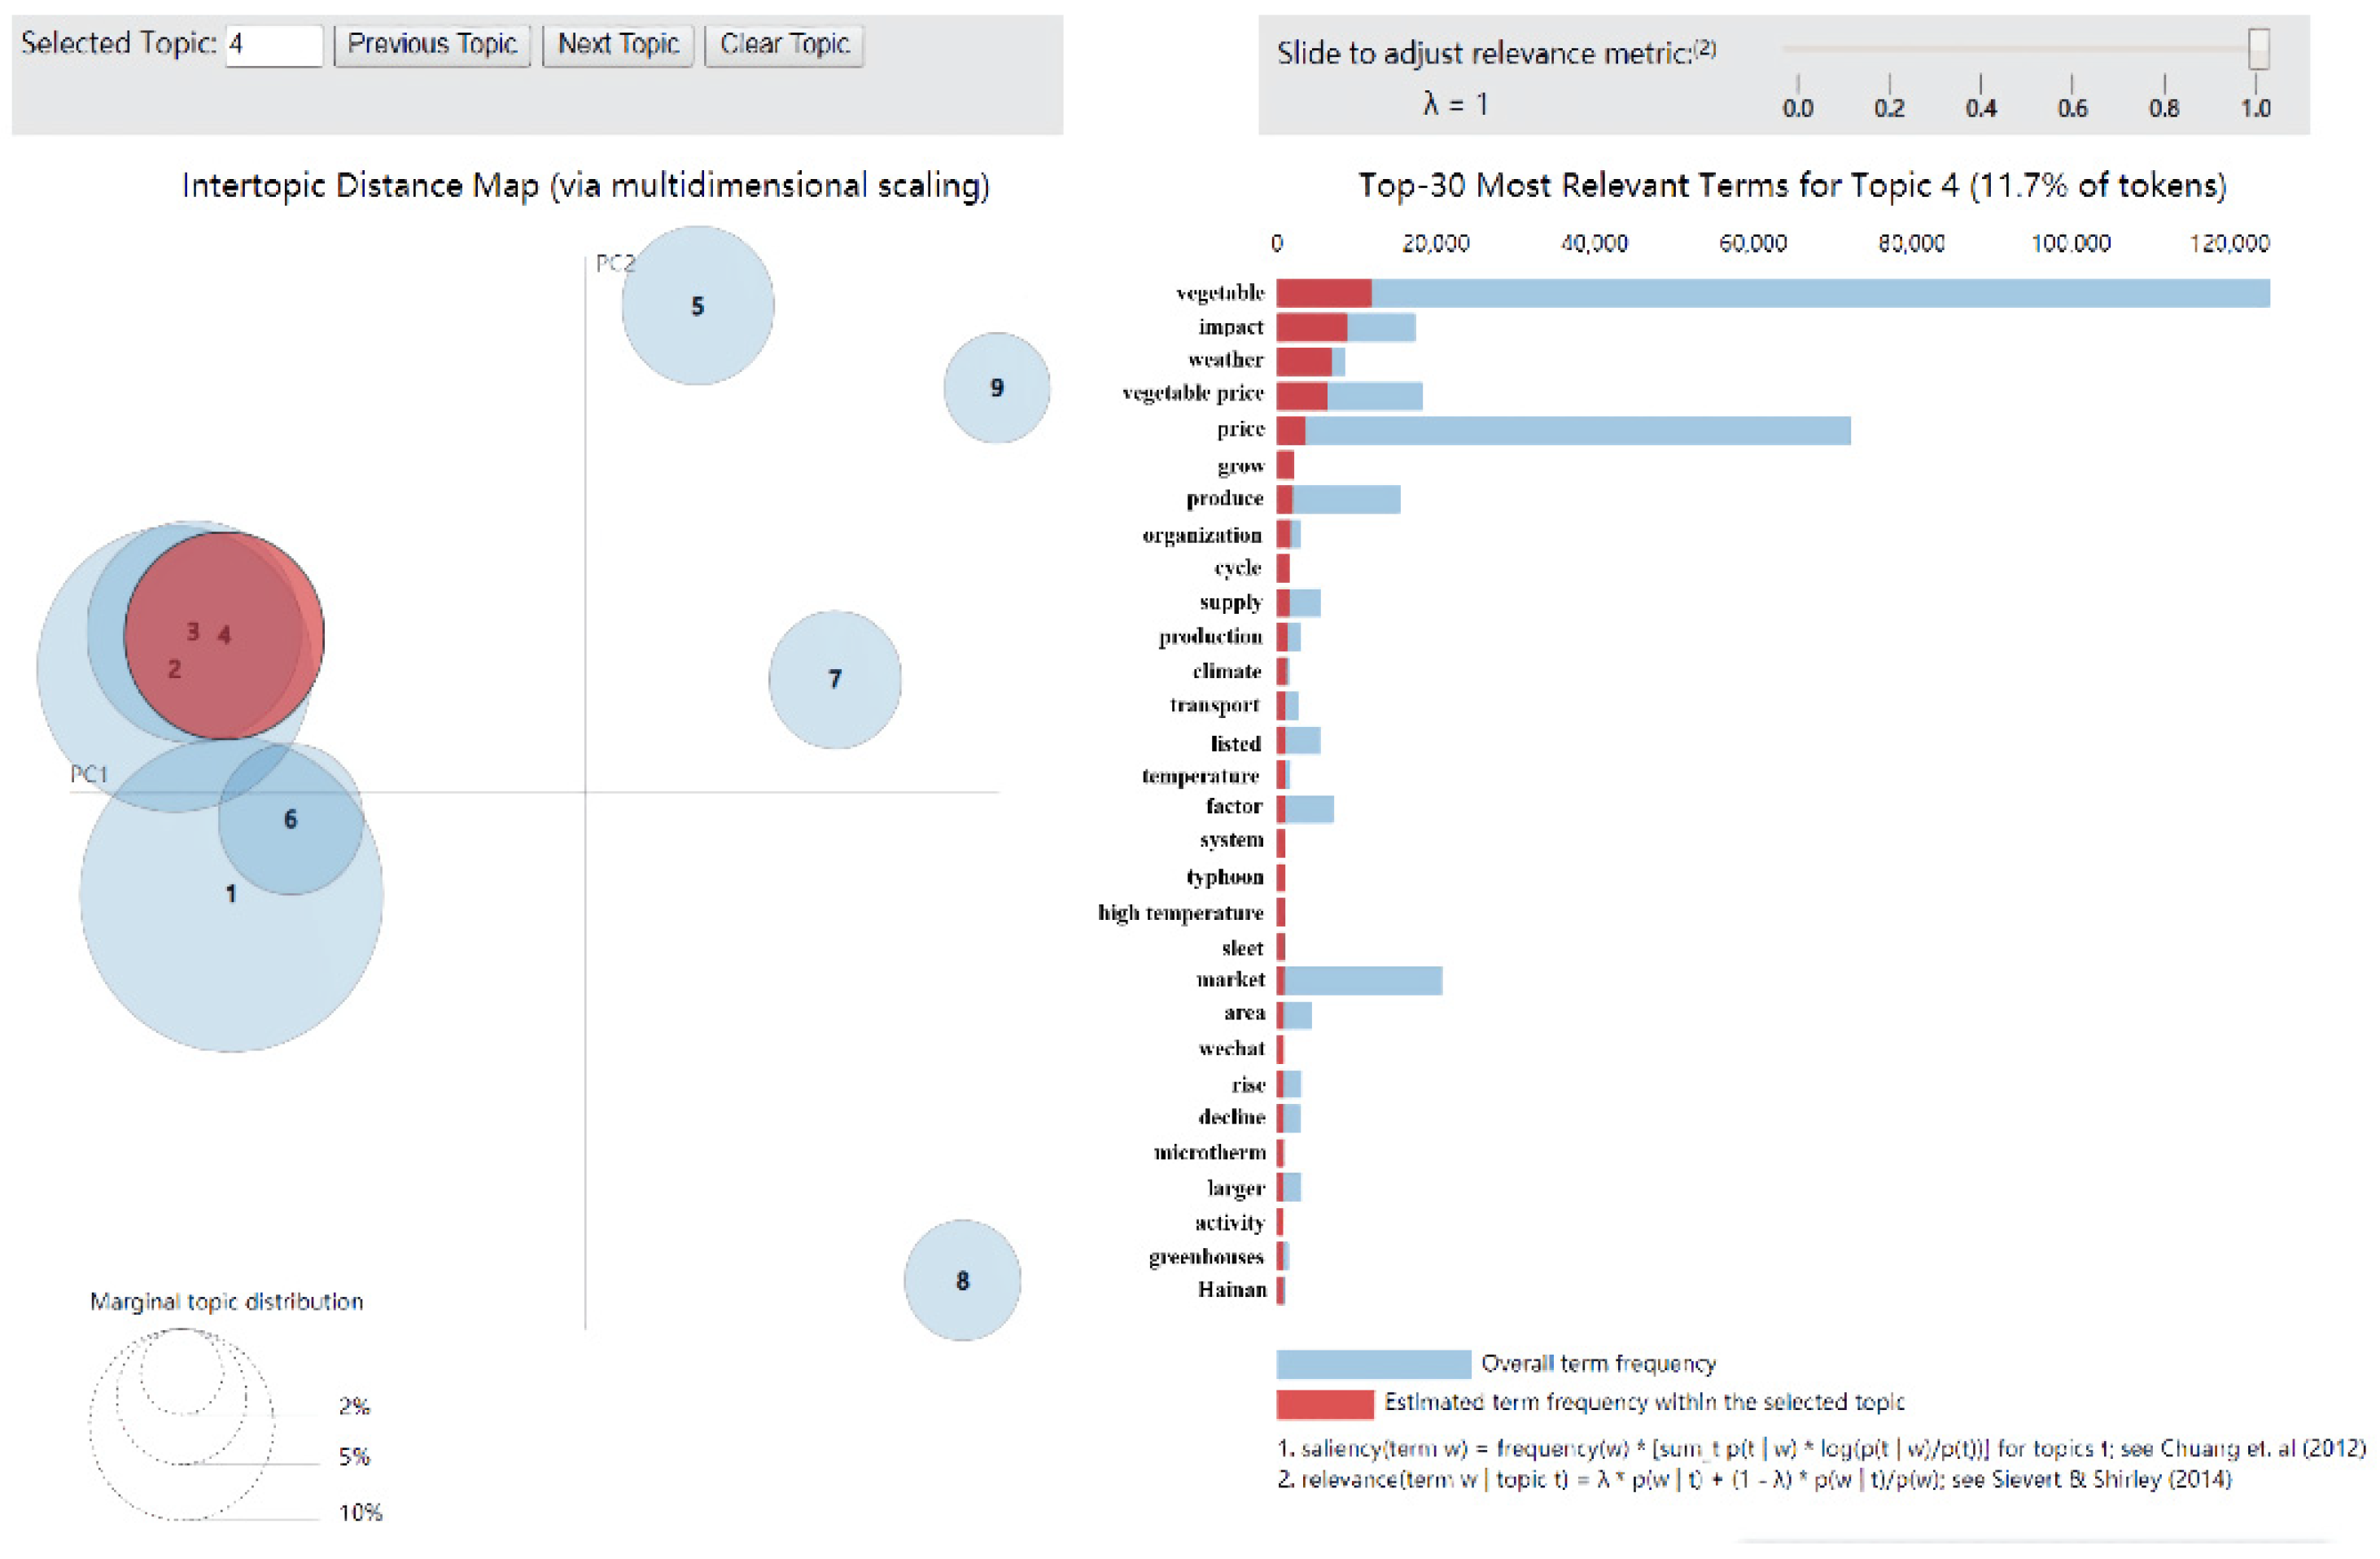
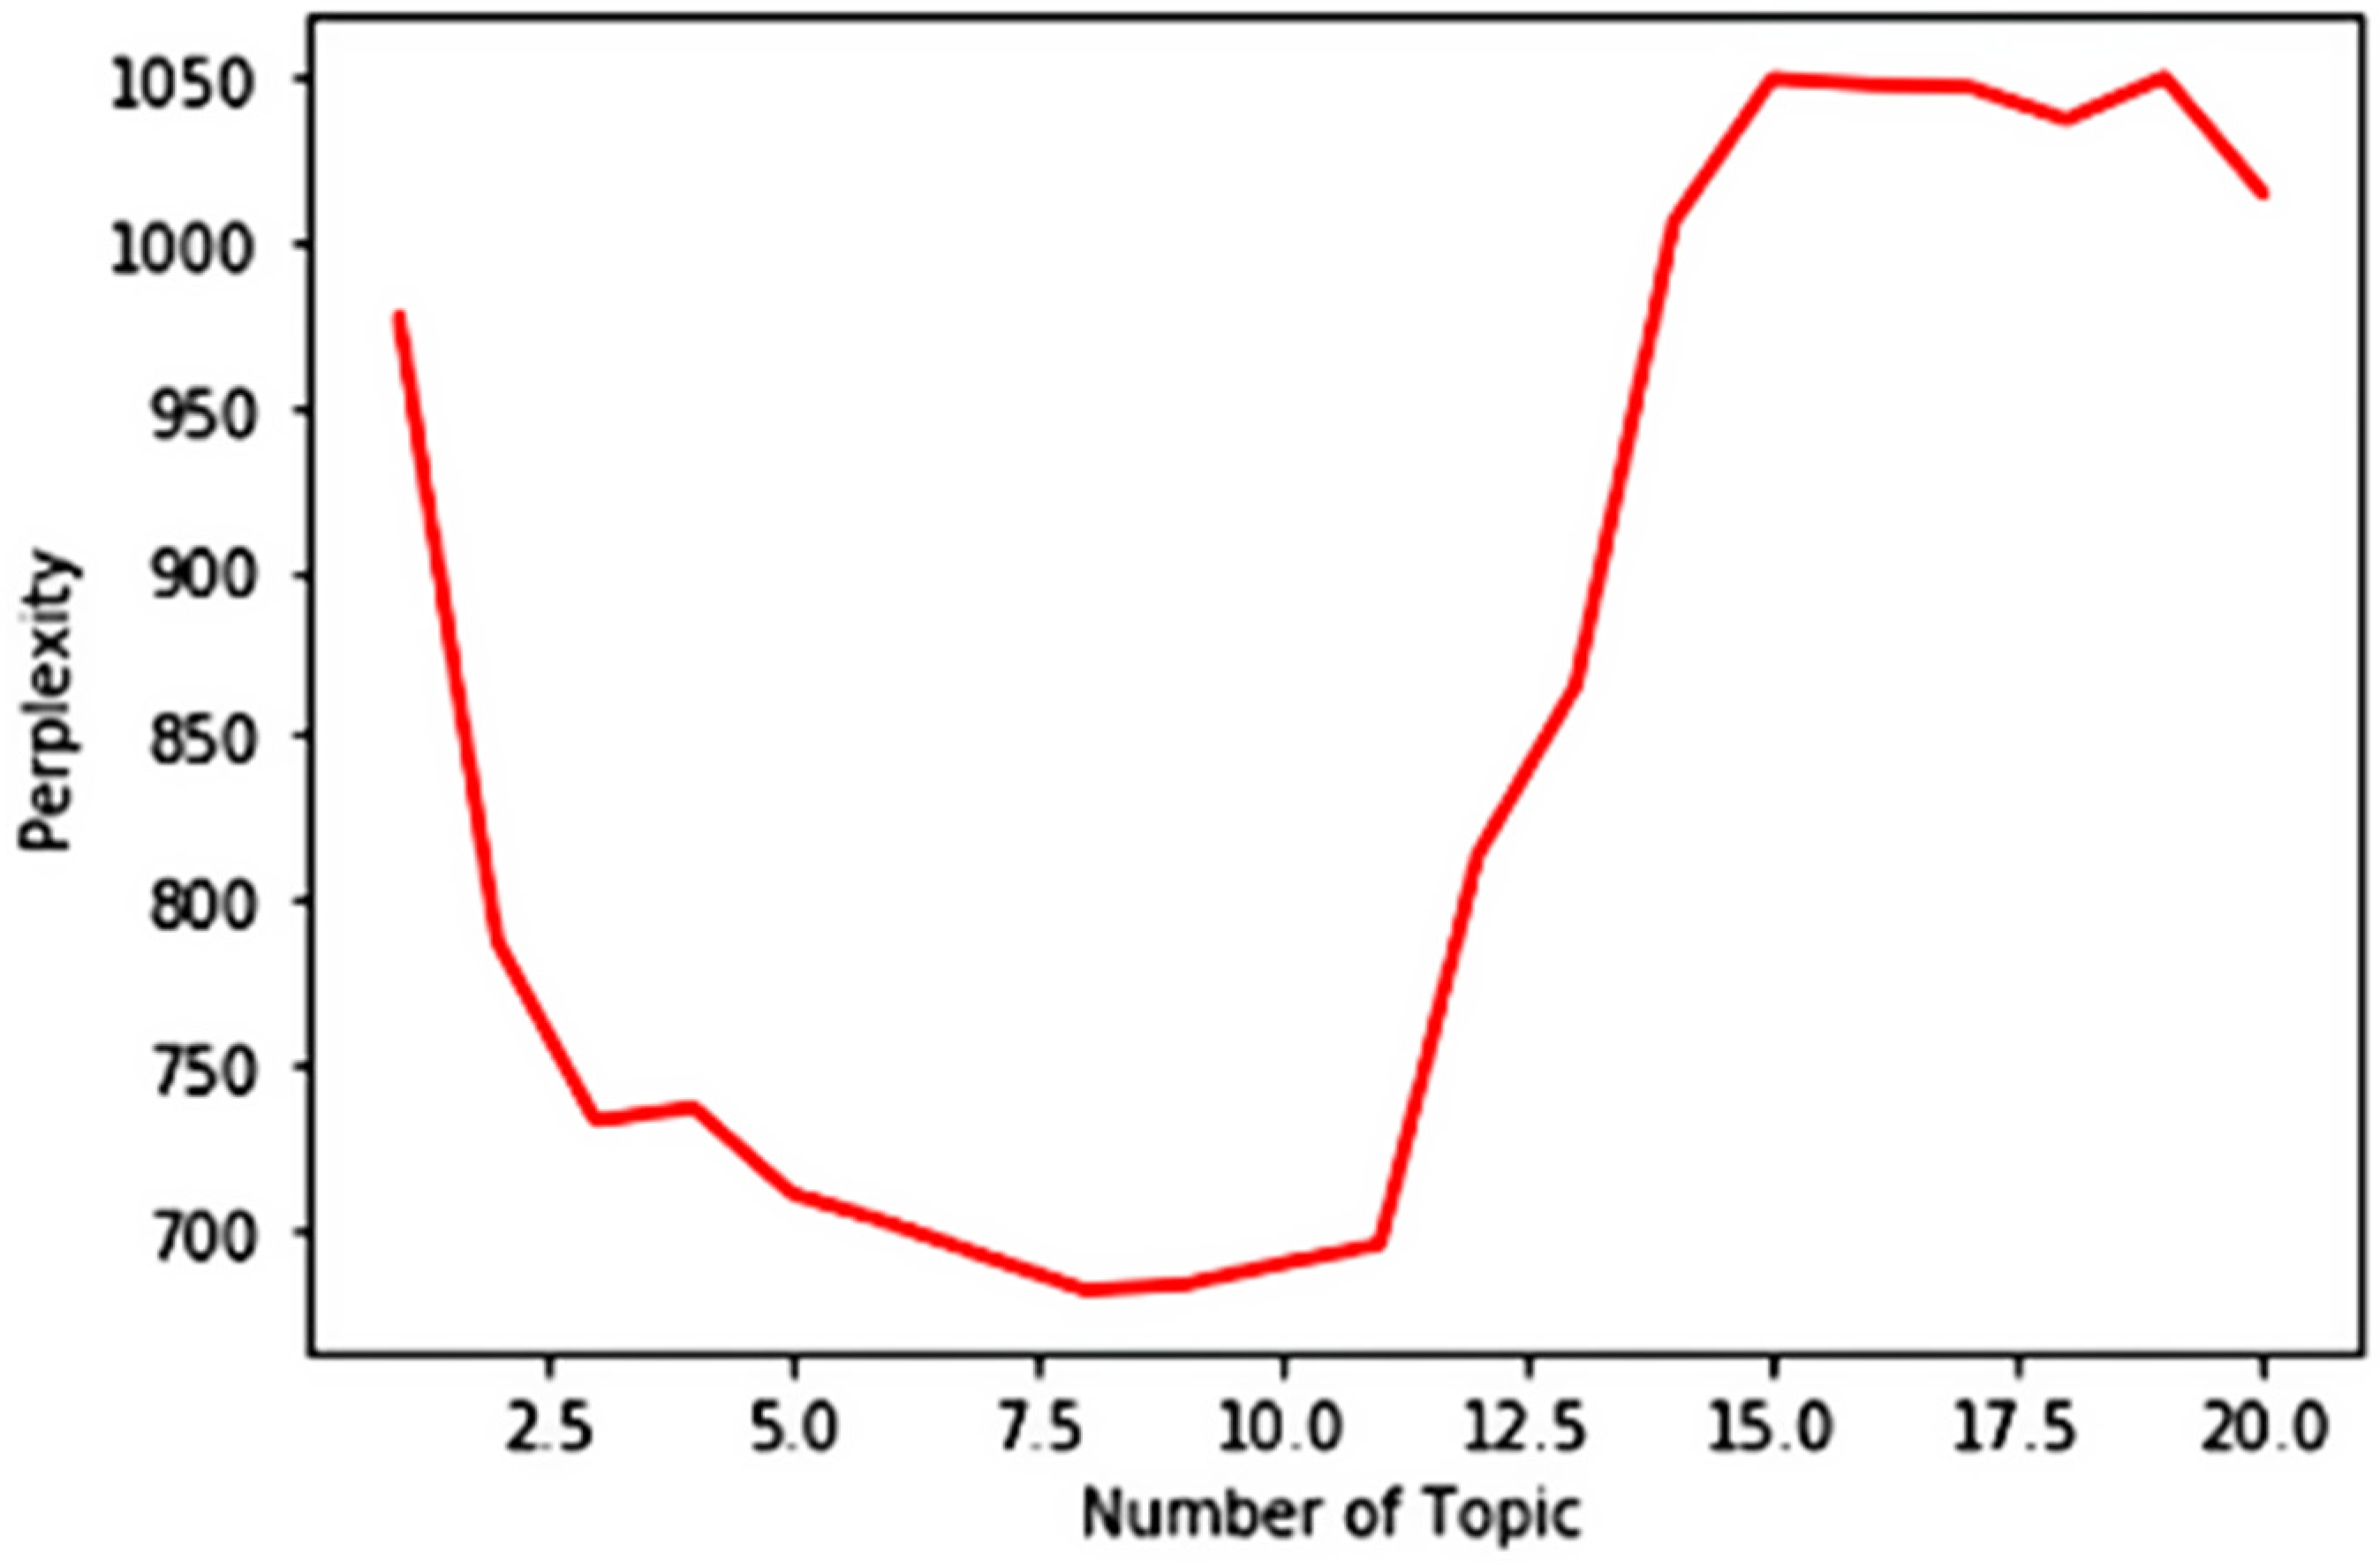
4.1. Keyword Extraction Based on LDA Topic Model

(1) LDA topic modeling results analysis. The LDA topic model is an unsupervised machine learning algorithm that can be used to mine the implicit topic information in large-scale document sets. The number of topics T is a very important parameter in LDA, and the selection of T is directly related to the extraction and analysis of topics afterward. When the number of topics is small, the information between topics is more scattered and cannot extract information effectively; when the number of topics is large, the degree of correlation between topics will increase and the topics have a high overlap. It has been shown that the model quality is better for α = 50/T and β = 0.01. The LDA model tends to assign few words to each topic and prefers to describe the document with fewer topics. In general, the number of topics in a text set is related to the size of the text set, the larger the size of the text set, the higher the number of topics [17].
In this paper, we used the degree of confusion to select the number of topics. The number of topics selected ranges from 1 to 20 for iteration. The results are shown in Figure 2.
From the calculation results, it can be seen that as the number of topics increases, the perplexity shows a trend of first decreasing and then increasing, and the perplexity reaches the lowest value when the number of topics is taken to 9. Therefore, the model performance reaches the optimum when the number of topics is 9. Afterward, the probability vector distribution matrix of about nine topics can be obtained by training the LDA model with the collected corpus, and the training results are also visualized to obtain Figure 3. From Figure 3, we can see that the nine themes obtained from the training have a high degree of similarity and overlap, such as “reduction” and “drop”, “price increase” and “mark up”, “production and sales” and “sales”, etc. We can find the central corpus by further clustering to extract the theme words with a high degree of relevance, so as to reduce the redundancy of the data.
(2) Analysis of DBSCAN clustering results. The calculation results of evaluation indexes are CH = 45,747.1824, DB = 0.84441, SC = 0.6934. According to the analysis of characteristic words extracted from the core corpus of cluster 1, the topic is mainly related to the factors affecting the planting, circulation and holidays of vegetable prices. The topic of cluster 2 is mainly related to the cost and transportation factors affecting vegetable prices. The topic words of cluster 3 mainly include vegetable production and consumer income. The topic of Cluster 4 mainly includes vegetable varieties and substitutes. The topic of Cluster 5 mainly includes labor force, planting area, CPI, economy and other factors. The topic of the central corpus of cluster 6 is the weather. Therefore, the weather is one of the important factors affecting vegetable prices, and there are many reports and concerns on the Internet.

4.2. Construction of Vegetable Price Fluctuation Index System Based on Grounded Theory

Through the keywords obtained earlier, nouns or noun phrases are extracted from them as feature words, and the feature words are coded and analyzed and modeled by using the rooting theory [25].
(1) Open coding. This process performs open coding of the collected information with feature words as concept words, and the open coding is completed with two key steps, a conceptualization step, and a categorization step, in accordance with the principles of objective science.
Through constant comparative analysis, 32 categories were summarized.
(2) Spindle coding. In the open coding results, 32 categories were integrated and grouped together to obtain five main categories and corresponding 27 sub-categories. The sales cost, transportation cost, profit, pesticide, sowing area, technology level, resource, variety, industry chain, processing, infrastructure, and vegetable production were grouped into the supply category, the festival, car, substitute, network environment, population size, vegetable consumption, price index, and people’s livelihood were grouped into the demand category, the weather, month, and geographic location were grouped into the natural environment category, the government policy and market economy were grouped into the economic policy environment category, and vegetable price as vegetable price category. The spindle coding results are shown in Table 4.
(3) Selective coding. The typical relationship structure of the main category is shown in Table 5.
By analyzing and comparing the five main categories and 27 corresponding subcategories, “vegetable prices” can be used as the core category of this study. Based on this core category, various variables related to the sources of disturbance of vegetable price volatility in a complex and uncertain environment are grouped into a theoretical framework.
The storyline that unfolds is that four aspects: supply, demand, natural environment, and economic policy environment have an impact on vegetable price fluctuations, with supply playing an intermediate role in the process of the natural environment’s impact on vegetable prices and the economic policy environment playing a moderating role in the process of supply’s impact on vegetable prices.
(4) Construction of vegetable price fluctuation index system. This paper constructs a preliminary system of indicators of vegetable price fluctuation disturbance sources under complex uncertainty conditions based on the three-level coding of rooting theory and optimizes the indicator system by using the literature research method and expert consultation method. Drawing on relevant literature and consulting relevant experts and scholars, the indicators that are difficult to measure are split or combined to ensure that the indicators follow the combination of quantitative and qualitative. The index system constructed after optimization is shown in Table 6.

4.3. Identification of Key Influencing Factors Based on Improved Concept Lattice-Weighted Group DEMATEL

Then, experts in the field of agricultural economics were invited to determine the interaction between the factors, and the evaluation degree of the influence relationship was set as strong = 4, strong = 3, average = 2, weak = 1, and none = 0. The results were clustered by the conceptual lattice-weighted group method. The direct influence matrix of the pooled four experts’ opinions was obtained.
According to the formula in the traditional DEMATEL method M = Z m a x ( j = 1 n z i j ) , we obtain the standardized influencing factor matrix M. Furthermore, according to the formula N = l i m k ( M + M 2 + + M K ) = M ( I M ) 1 , we can obtain the comprehensive influence matrix N.
Finally, we use formula a i = i = 1 n n i j and formula b i = j = 1 n n j i to obtain the influence degree a i and affected degree b i in the vegetable price fluctuation index system. Then, according to the formula r i = a i + b i and s i = a i b i , we obtain the centrality r i and cause degree s i . Since the probability vector distribution matrix based on the LDA theme model objectively reflects the influence proportion of each index in the vegetable price fluctuation system, it is used as the basis for measuring the importance of the index, while the concept lattice weighted group DEMATEL method more comprehensively considers the interaction between each index. Therefore, we calculate the weighted centrality of each indicator according to Formula (4) to ensure the scientific and rigor of the data results. The calculation results are shown in Table 7.
From the results of the calculation of the impact degree and the impacted degree of each indicator in Table 7, the indicators with higher influence degree include the level of economic development, the level of social development, the soundness of the vegetable industry chain, vegetable planting area, and the soundness of price regulation policy, which have relatively higher influence degree on other factors and belong to the “origin type” factors. In terms of the degree of being influenced, the indicators with a higher degree of being influenced include vegetable planting area, annual vegetable production, prices of related substitutes, vegetable consumption of rural residents, and cost profitability. These influencing factors are influenced by other factors to a greater extent and belong to the “result type” factors.
The magnitude of centrality and causality of each indicator in the complex uncertainty system reflect the importance of the indicator in the system and the correlation with other indicators, respectively. The relatively important factors among the 23 indicators of disturbance sources of vegetable price fluctuations are annual vegetable production, the soundness of the vegetable industry chain, and the prices of related substitutes. Meanwhile, the factors affecting vegetable price fluctuations can be divided into 11 causal factors (causal degree > 0) and 12 consequential factors (causal degree < 0) according to the size of the causal degree of each indicator. The factors with larger cause factors are social development level, economic development level and soil conditions, which indicate that these factors are not easily influenced by other factors in the system, but can actively influence other factors. The factors with larger outcome factors are annual vegetable production, vegetable planting area, material cost inputs, etc., which are mainly reflected in the supply category, which indicates that supply level factors are more susceptible to other factors in the vegetable price fluctuation system, but have a weaker ability to influence other factors. Therefore, attention should be paid to the differences between the cause-and-effect factors in the implementation of vegetable price regulation.

5. Conclusions and Suggestions

This paper uses web crawlers to obtain 86,166 pieces of text data related to vegetable price fluctuations over a 10-year period, uses the LDA topic model and DBSCAN clustering algorithm for topic analysis and key corpus research, uses the rooting theory qualitative research method for three-level coding, constructs a system of disturbance source indicators affecting vegetable price fluctuations, and finally applies the improved concept lattice. The DEMATEL algorithm with an improved concept lattice-weighted cluster technique was applied to deeply explore the interactions among the factors and select the key influencing factors: annual vegetable production, the soundness of the vegetable industry chain, the price of related substitutes, the soundness of price regulation policy, vegetable planting area, and climatic conditions. Compared with the previous research, the indicators obtained in this paper subdivide the urban and rural dimensions of vegetable consumption, household Engel coefficient and population number of urban and rural residents [26]. In the dimension of the natural environment, the network of public opinion related to soil conditions and climatic conditions was introduced, and the impact of social media public opinion on vegetable prices was refined [12,13]. In the dimension of the economic and social environment from the macro perspective, the connotation of the indicators is extended at the four levels of price regulation and control policies, industrial chains, and economic and social development levels, which are more objective and comprehensive than the previous system, and enrich and improve the risk warning indicators for vegetable price fluctuations.
According to the conclusions of this paper, the following policy recommendations are put forward:
(1) Ensure the steady growth of vegetable production, and achieve a healthy market supply. Ensure adequate quantity, variety and balanced supply of vegetables to prevent drastic fluctuations in vegetable prices Relevant departments should start to solve the production difficulties from the supply side of funds, technology, innovation and other elements in all aspects, promote the rapid development of new production models, and promote the steady increase in vegetable production and the sustainable and healthy development of related industries. At the same time establishing and improving the relevant incentives and support policies to encourage relevant practitioners and R & D personnel in the vegetable industry to actively explore and improve the level of technical planting at the source of vegetable production.
(2) Promote the construction of the whole industrial chain of vegetables. At present, China’s vegetable production and operation has a certain degree of fragmentation, a single-family scattered planting and operation mode leads to vegetable production and circulation and sales cannot be effectively docked. Therefore, the government should promote the scale production of vegetables as well as the model of agricultural super-connection to improve the vegetable industry chain, realize the standardization of the whole industry chain, and promote the high-quality development of the vegetable industry.
(3) Implement and improve the price control policy of agricultural products, using a variety of regulatory instruments to stabilize price fluctuations. At present, due to the special nature of vegetable production and circulation, the market sometimes fails in the development of the vegetable industry thus hindering the development of the vegetable economy. Price authorities can further improve the price control mechanism from the perspective of the construction of the early warning mechanism for vegetable price fluctuations, the improvement of the vegetable price adjustment fund system, and the maintenance of market supervision norms.
(4) Develop a new model of rural land transfer to protect the vegetable planting area. At present, with the increasing level of urbanization in China’s rural areas, a considerable portion of agricultural land has been expropriated by industrial and commercial industries, bringing some resistance to the large-scale production of vegetables. Therefore, the relevant departments around the minimum vegetable planting area should be set by the “red line” and actively introduce other policies to promote the reasonable and healthy transfer of rural land to insure vegetable planting areas around the country, which are important for the maintenance of stable vegetable prices around China.
(5) Strengthen early warning of natural disasters to reduce the adverse effects of climatic conditions in vegetable production. Disaster factors in climatic conditions have an important impact on vegetable cultivation status and total production. Therefore, it is necessary to vigorously develop the facility vegetable industry chain to alleviate the seasonal contradictions of vegetable price fluctuations; encourage the introduction and research and development of new technologies related to bulk vegetable varieties to mitigate the adverse effects of price fluctuations. At the same time to do a good job of meteorological warning, and achieve early prevention, to minimize the risk and loss.
(6) Promote the construction of a vegetable big data service platform to promote the development of the vegetable industry driven by the internet and big data and reduce the uncertainty of vegetable price fluctuation. This paper suggests integrating market data with meteorological data to provide a data basis for the subsequent vegetable price warning and vegetable quality evaluation. At the same time, it provides vegetable price inquiry and analysis services for vegetable industry operators and consumers to reduce the unreasonable allocation of resources caused by the asymmetry of information between market supply and demand and promote the healthy economic development of the vegetable industry.

Author Contributions

Conceptualization, Y.L. (Youzhu Li) and M.Z.; methodology, J.L.; software, B.S.; validation, X.L.; formal analysis, Y.L. (Youzhu Li); investigation, Y.B.; resources, J.L.; data curation, S.Y.; writing original draft preparation, M.Z.; writing review and editing, Y.L. (Yuxuan Liang), J.L.; visualization, M.Z. and J.Z.; supervision, S.Y.; project administration, Y.L. (Youzhu Li); funding acquisition, S.Y. All authors have read and agreed to the published version of the manuscript.

Funding

This work was supported partly by the National Social Science Foundation of China (Project No. 21BGL168), the MOE (Ministry of Education in China) Project of Humanities and Social Sciences (Project No. 20YJC790069) and the Earmarked Fund for Modern Agro-industry Technology Research System (Project No. CARS-23-F01 and No. CARS-21).

Institutional Review Board Statement

Not applicable.

Informed Consent Statement

Not applicable.

Data Availability Statement

The data presented in this study are available on request from the corresponding author.

Conflicts of Interest

The authors declare no conflict of interest.

References

  1. Zhen, H.Y.; Gao, W.Z.; Yuan, K.; Ju, X.H.; Qiao, Y.H. Internalizing externalities through net ecosystem service analysis-A case study of greenhouse vegetable farms in Beijing. Ecosyst. Serv. 2021, 50, 101323. [Google Scholar] [CrossRef]
  2. Gilbert, C.L. How to Understand High Food Prices. J. Agric. Econ. 2010, 61, 398–425. [Google Scholar] [CrossRef]
  3. Shen, C.; Mu, Y. Study on vegetable’s vertical price transmission in China based on SVAR model. J. China Agric. Univ. 2015, 20, 271–278. [Google Scholar]
  4. Waugh, F.V. Quality Factors Influencing Vegetable Prices. J. Farm. Econ. 1928, 10, 185–196. [Google Scholar] [CrossRef]
  5. Durborow, S.L.; Kim, S.-W.; Henneberry, S.R.; Brorsen, B.W. Spatial price dynamics in the US vegetable sector. Agribusiness 2020, 36, 59–78. [Google Scholar] [CrossRef]
  6. Cao, Y.; Mohiuddin, M. Sustainable Emerging Country Agro-Food Supply Chains: Fresh Vegetable Price Formation Mechanisms in Rural China. Sustainability 2019, 11, 2814. [Google Scholar] [CrossRef] [Green Version]
  7. Al-Kadi, A.F.S.; Al-Sweity, R.; Tabieh, M.A.S.; Al-Zubeidi, K. Econometric analysis for cost of production of vegetables raised under plastic houses in high land areas in Jordan. Dirasat Agric. Sci. 2000, 27, 79–86. [Google Scholar]
  8. Aysoy, C.; Kirli, D.H.; Lumen, S. How does a shorter supply chain affect pricing of fresh food? Evidence from a natural experiment. Food Policy 2015, 57, 104–113. [Google Scholar] [CrossRef]
  9. Loginova, D.; Portmann, M.; Huber, M. Assessing the effects of seasonal tariff-rate quotas on vegetable prices in Switzerland. J. Agric. Econ. 2021, 72, 607–627. [Google Scholar] [CrossRef]
  10. Gao, J.; Li, X.; Xie, P.; Liu, Y. On Vertical Transmission Mechanism of Urban Vegetable Supply Chain Price an Empirical Analysis of Chongqing. J. Southwest Univ. Nat. Sci. Ed. 2016, 38, 147–154. [Google Scholar]
  11. Ward, R.W. Asymmetry in retail, wholesale, and shipping point pricing for fresh vegetables. Am. J. Agric. Econ. 1982, 64, 205–212. [Google Scholar] [CrossRef]
  12. Chen, J.; Zhou, H.; Hu, H.; Song, Y.; Gifu, D.; Li, Y.; Huang, Y. Research on agricultural monitoring system based on convolutional neural network. Future Gener. Comput. Syst. Int. J. Esci. 2018, 88, 271–278. [Google Scholar] [CrossRef]
  13. Li, Y.; Zhou, H.; Lin, Z.; Wang, Y.; Chen, S.; Liu, C.; Wang, Z.; Gifu, D.; Xia, J. Investigation in the influences of public opinion indicators on vegetable prices by corpora construction and WeChat article analysis. Future Gener. Comput. Syst. Int. J. Esci. 2020, 102, 876–888. [Google Scholar] [CrossRef]
  14. Li, Y.; Liu, J.; Yang, H.; Chen, J.; Xiong, J. A Bibliometric Analysis of Literature on Vegetable Prices at Domestic and International Markets-A Knowledge Graph Approach. Agric. Basel 2021, 11, 951. [Google Scholar] [CrossRef]
  15. Kumar, A.; Sumit; Yadav, M.K.; Rohila, A.K. Constraints faced by the farmers in production and marketing of vegetables in Haryana. Indian J. Agric. Sci. 2019, 89, 153–160. [Google Scholar]
  16. Wang, H.H.; Zhang, Y.; Wu, L. Is contract farming a risk management instrument for Chinese farmers? Evidence from a survey of vegetable farmers in Shandong. China Agric. Econ. Rev. 2011, 3, 489–504. [Google Scholar] [CrossRef]
  17. Rasiwasia, N.; Vasconcelos, N. Latent Dirichlet Allocation Models for Image Classification. IEEE Trans. Pattern Anal. Mach. Intell. 2013, 35, 2665–2679. [Google Scholar] [CrossRef] [Green Version]
  18. Jie, Z.; Liu, Y. The Improvement and Implementation of dBscan Clustering Algorithm. Microelectron. Comput. 2009, 26, 189–192. [Google Scholar]
  19. Glaser, B.G.; Strauss, A.L.; Strutzel, E. The discovery of grounded theory; strategies for qualitative research. Nursing research 1968, 17, 364. [Google Scholar] [CrossRef] [Green Version]
  20. Si, S.-L.; You, X.-Y.; Liu, H.-C.; Zhang, P. DEMATEL Technique: A Systematic Review of the State-of-the-Art Literature on Methodologies and Applications. Math. Probl. Eng. 2018, 2018, 3696457. [Google Scholar] [CrossRef] [Green Version]
  21. Blei, D.M.; Ng, A.Y.; Jordan, M.I. Latent Dirichlet allocation. J. Mach. Learn. Res. 2003, 3, 993–1022. [Google Scholar] [CrossRef]
  22. Maulik, U.; Bandyopadhyay, S. Performance evaluation of some clustering algorithms and validity indices. Ieee Trans. Pattern Anal. Mach. Intell. 2002, 24, 1650–1654. [Google Scholar] [CrossRef] [Green Version]
  23. Rousseeuw, P.J. Silhouettes—A graphical aid to the interpretation and validation of cluster-analysis. J. Comput. Appl. Math. 1987, 20, 53–65. [Google Scholar] [CrossRef] [Green Version]
  24. Chun Tie, Y.; Birks, M.; Francis, K. Grounded theory research: A design framework for novice researchers. SAGE Open Med. 2019, 7, 2050312118822927. [Google Scholar] [CrossRef] [Green Version]
  25. Shi, L.; Jia, Y.; Liu, Q. Exploratory Research into Influence Factors of Team Goal Orientation: Based on the Methods of Grounded Theory and Concept Lattice-Weighted Group DEMATEL. Oper. Res. Manag. Sci. 2016, 25, 104–112. [Google Scholar]
  26. Zhylyevskyy, O.; Jensen, H.H.; Garasky, S.B.; Cutrona, C.E.; Gibbons, F.X. Effects of Family, Friends, and Relative Prices on Fruit and Vegetable Consumption by African Americans. South. Econ. J. 2013, 80, 226–251. [Google Scholar] [CrossRef]
Figure 1. Theoretical model framework.
Agriculture 12 00648 g001
Figure 2. Confusion Degree Curve of Subject Quantity. Data source: self sorting and drawing.
Agriculture 12 00648 g002
Figure 3. Subject Extraction Visualization.
Agriculture 12 00648 g003
Table 1. Text Data Sources.
ContentSourceWeb Address (accessed on 1 February 2022)
NewsBaiduhttps://www.baidu.com/
Weibohttps://weibo.com/
WeChat subscription accountshttps://mp.weixin.qq.com/
Industry information
Analytical articles
Consultation huinonghttps://news.cnhnb.com/
China agricultural information network.http://www.agri.cn/
Influencing factorCNKI (China National Knowledge Infrastructure)https://www.cnki.net/
Table 2. New stop words.
CategoryStop Words
VegetablesWinter melon, beans, pumpkin, garlic, green pepper, ginger, spinach, beef, mutton, leafy vegetables
UnitKilogram, catty, ton, yuan
Table 3. Statistical Analysis of Text Data.
MaximumMinimum Average Standard Deviation
Number of effective words per document1064315155
Number of paragraphs per document4611237
Number of effective words per paragraph26165
Table 4. Spindle coding results.
Main CategoryCorresponding CategoryMain CategoryCorresponding Category
SupplyCost of salesDemandFestival
Transportation costVehicle
ProfitAlternatives
PesticidesNetwork environment
Seeded areaPopulation size
Technical levelVegetable consumption
ResourcesPrice index
VarietiesPeople’s livelihood
Industrial chainNatural environmentWeather
MachiningMonth
InfrastructureGeographical position
Vegetable yieldEconomic policy environmentGovernment policy
International environmentMarket economy
Vegetable priceVegetable price
Data source: self sorting and drawing.
Table 5. Typical relation structure of the main category.
Typical Relational StructureConnotation of Relational Structure
Supply → Vegetable pricesSupply has an impact on vegetable prices
Demand → Vegetable pricesDemand has an impact on vegetable prices
Natural environment → Vegetable pricesSupply plays an intermediate role in the impact of the natural environment on vegetable prices
Economic policy environmentEconomic policy environment plays a regulatory role in the impact of supply on vegetable prices
supplyvegetable prices
Data source: self sorting and drawing.
Table 6. Index system of interference sources of vegetable price fluctuation.
Primary IndexSecondary IndexIndicator TypePrimary IndexSecondary IndexIndicator Type
SupplyAnnual yield of vegetablesQuantitative indexDemandPrice of relevant substitutesQuantitative index
Vegetable planting areaQuantitative indexUrban populationQuantitative index
Material cost inputQuantitative indexRural populationQuantitative index
Total power of agricultural machineryQuantitative indexVegetable consumption of urban residentsQuantitative index
Cost-profit ratioQuantitative indexVegetable consumption of rural residentsQuantitative index
Vegetable importsQuantitative indexConsumer price indexQuantitative index
Economic policy environmentTraffic levelQualitative indexUrban family EngelQuantitative index
Technical levelQualitative indexRural household EngelQuantitative index
Soundness of price control policiesQualitative indexNetwork environment Qualitative index
Soundness of vegetable industry chainQualitative indexNatural envi-ronmentClimatic conditions Qualitative index
Economic development levelQuantitative indexGeological conditions Qualitative index
Social development levelQuantitative index
Data source: self sorting and drawing.
Table 7. Calculation results of improved concept lattice weighted group DEMATEL model.
Primary IndexSecondary IndexInfluence DegreeAffected DegreeCentralityCause DegreeImportanceWeighted CentralitySort
SupplyAnnual yield of vegetables2.20312.86035.0634−0.65720.10550.06991
Vegetable planting area2.40702.88765.2946−0.48060.09550.06615
Material cost input1.76152.19823.9597−0.43670.09670.050112
Total power of agricultural machinery1.55511.75543.3105−0.20030.08850.038317
Cost-profit ratio2.31832.40344.7217−0.08510.08900.05508
Vegetable imports1.72531.76533.4906−0.04000.08400.038416
DemandPrice of relevant substitutes2.25042.61934.8697−0.36890.10700.06823
Urban population1.65591.43683.09270.21910.10600.042914
Rural population1.81311.60923.42230.20390.09600.043013
Vegetable consumption of urban residents2.10492.39124.4961−0.28630.08560.050311
Vegetable consumption of rural residents2.09442.48074.5751−0.38630.08560.051210
Consumer price index2.15652.27504.4315−0.11850.04450.025818
Engel coefficient of urban households1.70781.97953.6873−0.27170.11600.05597
Engel coefficient of rural households1.66661.97683.6434−0.31020.11000.05249
Vegetable related network public opinion1.16711.09802.26510.06910.02400.007122
Natural environmentClimatic conditions1.87181.54903.42080.32280.12600.05646
Soil conditions1.71341.10552.81890.60790.10950.040415
Economic and social environmentSoundness of price control policies2.40252.11954.52200.28300.11400.06744
Soundness of vegetable industry chain2.54942.21804.76740.33140.11100.06922
Economic development level2.99842.41715.41550.58130.02200.015619
Technical level1.63421.41123.04540.22300.01700.006823
Traffic level2.06022.02254.08270.03770.02300.012320
Social development level2.90862.14625.05480.76240.01600.010621
Publisher’s Note: MDPI stays neutral with regard to jurisdictional claims in published maps and institutional affiliations.

