Abstract
Water quality is a global concern; it is due to point and non-point source pollution. Non-point sources for pollution are mainly runoff from Agricultural and forest. To decrease nutrient inputs, management practices are implemented. Using Soil and Water Assessment Tool, water quality parameters can be quantified. Yazoo River Watershed is the largest watershed in Mississippi, which have impact on surface water quality due to large scale agriculture and forest lands. Model has been calibrated and validated for streamflow, sediment, Total Nitrogen (TN), Total Phosphorus (TP) for the USGS gauge stations in the watershed. Model efficiency was assessed with Coefficient of Determination (R2) and Nash-Sutcliffe Efficiency index (NSE). Best Management Practices (BMPs) were implemented throughout the watershed to simulate the impact of BMPs on streamflow, sediment, and nutrient yields. Vegetative Filter Strips (VFS), Riparian Buffer, combination of VFS and Riparian buffer and Cover Crops (CC) were tested for assessing the effective BMP in improving water quality. VFS, Riparian buffer and both (VFS + riparian) have no effect on streamflow, but they were able to decrease sediment, TN, and TP yields. Scenario with both VFS and Riparian buffer had the highest reduction capability as per varying width (5, 10, 15, and 20 m). For CC, Rye grass, Winter Barley and Winter Wheat (WW) were used, of which Rye grass had highest, 5.3% reduction in streamflow. WW has the highest Total Nitrogen reduction that is of 25.4%. CC also has significant reduction ranged between 10% to 11% for TP. This research would assist the Agricultural community to apply appropriate Management practices to improve water quality.
1. Introduction
Deterioration of Natural resources due to manmade alternations to land-use and land-cover dates to pre- historic times. Agricultural land-use has first begun in Mesopotamia, that is known to be the host of human civilization [1]. With growing population and advancement in civilization and technology, led to improper use of natural resources which resulted in climate change, sea level rise, water quality impairment, eutrophication, and several impacts of pollution on environment. To meet the needs of current growing population, agriculture producers have ramped the use of fertilizers and pesticides to increase yield. This resulted water quality impairment in several watersheds globally. Agriculture is considered major non-Point source for pollution [2], other point sources for pollutions are sewage treatment plants, industrial effluents etc. Precipitation, soil type and management and slope gradient are the most significant factors in generating runoff from farmlands, which drains into nearby water bodies. This results in excessive inputs of nitrogen and phosphorus into surface water. Water quality impairment due to mineral salts induce the growth of algae that uses N and P as food source, agricultural runoff that is entering into a stream channel is rich in nitrogen and phosphorus, result in abundant food source for phytoplankton in the water; phytoplankton (algae) are harmful for human, aquatic, and other animal species, it also affects other uses of the water bodies such as drinking water supply, recreation, aesthetic characteristics etc. [3]. About 2.2 billion people of the world population has no access to Safely managed water [4], and about 80 percent of illnesses are caused globally due to consuming impaired water [5]. Impaired water when consumed as drinking water could result in adverse health issues. To mitigate this water quality must be maintained by monitoring practices in the region.
Yazoo river Watershed (YRW) is the largest watershed with almost 50% of the watershed land-use is agriculture, runoff from these fields drain into Yazoo River and ultimately into Mississippi river. There is limited research conducted as a watershed scale analysis for YRW, this study could help in assessing current conditions and projecting for future. Mississippi river carries sediments, nutrients from several parts of the country and drains into Gulf of Mexico. Eutrophication in Gulf of Mexico has been a concern, affecting aquatic life in the area [6].
Inputs such as variety of herbicides, pesticides, and fertilizers are used to maximize yield. Organic manure is one of the inputs that farmers use as fertilizer, to minimize the effect of synthetic ones. Crop management inputs such as irrigation, fertilizer, and pesticide etc. were applied during growing season, although they were applied in prescribed quantities, there is still a significant amount that plants do not use. Residuals after plant uptake will eventually either leach into ground or transported through runoff. This process is quite prominent in parts of the world and in the watershed [7]. Agriculture being a major non-point source pollution [2], to decrease nutrient inputs from agricultural lands, USDA has implemented Best Management Practices in lieu of this concern in several states including Mississippi, but before selecting the appropriate BMP, it is efficient to know the source of pollutant, and the amount of it released into the water.
To assess the efficiency of various management practices, application of modeling tool is essential. Numerous modeling tools are used for the analysis of water quality, they are designed and used based on the applicability of water quality parameters. Soil and Water Assessment Tool (SWAT) is a conceptual model that is used prominently in watershed modelling, there are studies that indicate SWAT model is one of the most efficient models in quantifying hydrologic and water quality parameters at watershed scale [8]. It has also been used in quantifying Nutrient sources in Big sunflower river watershed which is a sub watershed of YRW. Therefore, the objectives of this research were to: (i) calibrate and validate model for streamflow, sediments, total Nitrogen (TN), and total Phosphorus (TP); and (ii) assess Best Management Practices’ (BMPs) effects on water quality.
2. Materials and Methods
2.1. Study Area
YRW is the largest watershed in the state of Mississippi, with a drainage area of 5.08 million ha, shown in Figure 1. Located in the north-western region of Mississippi. YRW has two regions that are predominant, the Buff hills where most of the land type is upland, birthplace for many rivers in the state, located in the northeast region of the watershed, and The Delta where most of the land is flat with some of the most fertile soils that are best for Agriculture, located between Yazoo and Mississippi Rivers in the northwest. YRW covers 30 counties of Mississippi with Interstate 55 crossing across the watershed.
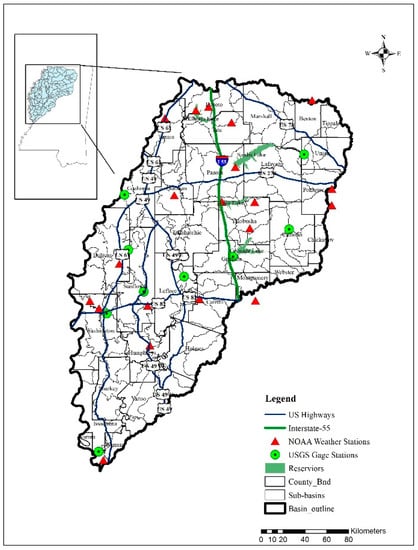
Figure 1.
Location of the Yazoo River Watershed showing weather and USGS gage stations.
Land use characteristics include Agriculture, forest lands, wetlands, lakes, and urban areas. Major crops in agricultural land use are Corn, cotton, Soybean, Pasture lands that accounts to 47.24%. Forest lands are classified as Deciduous, evergreen, and mixed types that cover majority of the watershed to 49.92%, the remainder land that is of 2.84% is covered with lakes, forested and non-forested wetlands, and urban areas as shown in Figure 2. Majority of the soils present in the watershed are Alligator, Dundee, Sharkey, Dowling, Forestdale, Smith-dale. This watershed is divided into 109 smaller watersheds (sub-basins) for ease of analysis in SWAT.
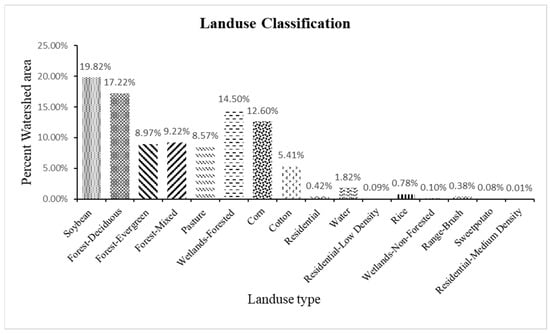
Figure 2.
Land use Characteristics in Yazoo River Watershed.
2.2. Model Description
SWAT—Soil and Water Assessment Tool is a continuous daily time-step watershed scale model. SWAT can simulate Hydrologic and water quality parameter outputs such as sediment, total Nitrogen, and total Phosphorus concentrations for each HRU (Hydrologic Response Unit), Sub-basin [9]. Watershed delineation of YRW resulted in 109 sub-basins which are reclassified into HRUs with the help of Digital Elevation Model input, land-use, soil, and slope classifications. This classification helps in applying different crop, soil, and slope parameters for individual HRU for detailed analysis. Output generated from SWAT can also be viewed as per sub-basin and HRU level. Sediment and Nutrient inputs are derived from basin slope, surface lag time etc., for nutrients, Agricultural management inputs such as fertilizer and pesticide application etc., are used. It is one of the efficient hydrological models existing, used for estimating long-term effects caused by agricultural and other management operations. This analysis could be useful in developing management operations. Arc SWAT is an ArcGIS extension, a joint development by USDA-ARS and Texas A&M University.
2.3. Model Inputs
Primary data inputs used were Digital Elevation Models (DEM) for 30 m × 30 m resolution acquired from United States Geological Survey [10], for watershed delineation. Land-use data is acquired from United States Department of Agriculture–National Agricultural Statistics Service (USDA-NASS) [11] that is Crop Land data layer (CDL) of 30 m × 30 m resolution. Soils data was obtained from Soil Survey Geographic (SSURGO) database [12]. Weather inputs such as daily minimum and maximum Temperature and Precipitation data obtained from National Oceanic and Atmospheric Administration [13] from 2000 to 2019 for weather stations in YRW.
Agriculture, since considered as major non-point source of pollution, nutrient inputs in agriculture such as fertilizer, pesticides, animal manure etc. were applied. Mississippi State University Agricultural and Forestry Extension Service [14] keeps the information for different crop, this including Planting date, Fertilizer and Pesticide application date and type used, Irrigation schedule and amounts, Tillage practices and Harvest dates. These dates vary for different crop types, respective dates and types were obtained and applied to the model. Forest Management practices were obtained from Mississippi Forestry Commission [15].
Manure inputs were estimated with the help of revised standards provided by American Society for Agricultural and biological Engineers [16]. Total dry weight produced by cattle is estimated to 2.36 kg/day/animal, similarly, for chicken it is 0.03 kg/day/animal and for swine, it is 0.14 kg/day/animal. Average weight for cattle, chicken and swine are 440 kg, 1.9 kg, and 196 kg respectively. Most of the manure inputs have been given in lieu of timber production for the forested area.
2.4. Model Accuracy Assessment
Accuracy of the model is estimated using two statistical indices, Nash, and Sutcliff Efficiency (NSE) [17] index, and coefficient of determination (R2) [18] (1) and (2) respectively. For each parameter that is calibrated mainly, Streamflow, sediment, Total Phosphorus and Total Nitrogen both NSE and R2 are evaluated.
where Oi is the Observed data, Si is simulated data, and are observed and simulated means respectively. Coefficient of Determination helps us in understanding the trend between two sets of data, in this case Observed and Simulated by giving linear relationship between them. R2 ranges from 0 to 1, if R2 value is close to 1 then it is perfect relationship between observed and model simulated value. NSE ranges −∞ to 1, result close to 1 depicts model is accurate.
2.5. Calibration and Validation
Using R2 and NSE statistics, model accuracy was tested for Streamflow, sediments, total Nitrogen, and total Phosphorus. This is essential, since we are simulating outputs based on limited field collected observations. Once the statistic had shown positive trend, conclusions were based for 20 years.
2.5.1. Streamflow Calibration
Flow parameter calibration is the primary step in calibration and validation process. For a total of 8 USGS Gauge stations in YRW with continuous streamflow data, model was calibrated and validated. Monthly data from these stations is collected and calibrated from year 2008 to 2011 and validated from year 2012 to 2015. By using Auto-Calibration tool, SWAT-CUP (SWAT calibration and Uncertainty Procedures). SWAT_CUP is designed specifically for SWAT calibration procedures, SUFI-2 (Sequential Uncertainty Fitting version 2) algorithm helps in fitting the best parameter value for the given respective range [19]. Flow is affected by numerous parameters; this tool was used so that multiple parameters that are sensitive [8,20,21,22] that are mentioned in Table 1 for flow were simultaneously changed until best results were obtained.

Table 1.
Streamflow sensitive Parameters.
2.5.2. Sediment Calibration
Best Management Practices can limit sediment transport with the runoff; therefore, calibration and validation of Sediment was performed. With the limited available data, model was calibrated and validated for 2 USGS gauge stations, Big Sunflower at Merigold (USGS-07288280) and Bouge Phalia near Leland (USGS-07288650) respectively. Manual calibration approach was used with the help of Manual Calibration helper tool in SWAT. From literature and testing, sensitive parameters [23,24,25,26] were selected and used in calibration and validation process, they are mentioned in Table 2 below. Observed suspended sediment data obtained from field collected samples, for the period from 2013 to 2016 that is collected every 15 days for these 4 years. Calibration was performed from 2013 to 2014; and validation was performed from 2015 to 2016.
Table 2.
Sensitive Parameters in Sediment Calibration.
2.5.3. Total Nitrogen
In the process of nutrient quantification, Nitrogen is considered one of the main mineral salts that is deposited in surface water from agricultural runoff. Therefore, Calibration and validation of Total Nitrogen was performed from 2013 to 2014 and 2015 to 2016 respectively. Data collected at 15-day interval was obtained from MDEQ for this process. Manual Calibration approach was chosen due to limited data availability and performed with the help of Manual Calibration Helper tool in SWAT. Sensitive parameters were identified from numerous journals and performed calibration and validation [27,28] that are mentioned in Table 3 below, for Big Sunflower at Merigold (USGS-07288280) and Bouge Phalia near Leland (USGS-07288650) respectively.
Table 3.
Sensitive Parameters in Total Nitrogen Calibration.
2.5.4. Total Phosphorus
Phosphorus is one other significant mineral that impacts water quality, therefore, Total phosphorus estimated by the model must be calibrated to achieve accurate results. Calibration and validation for total phosphorus was performed from 2013 to 2014 and 2015 to 2016 respectively. MDEQ collected field samples at an interval of 15 days. This data was obtained and used in the process. With the help of Manual calibration helper tool in SWAT, the model was calibrated for Big Sunflower at Merigold (USGS-07288280) and Bouge Phalia near Leland (USGS-07288650) respectively. Parameters that affect the total phosphorus concentration were identified from the literature, and testing [29,30,31] had used in the process. They are mentioned in Table 4.
Table 4.
Sensitive Parameters in Total Phosphorus Calibration.
2.6. Management Scenarios
After a thorough research, implementation of BMPs is one of the methods to reduce hydrologic and water quality outputs from Agricultural and Forested land-use. There are numerous BMPs that are in practice, for this study Vegetative Filter Strips (VFS), Riparian buffers, Cover Crops were selected.
2.6.1. Vegetative Filter Strips
VFSs are the areas that are located at the edge of Agricultural land and in between these agricultural lands and streams of rivers, bayous, and lakes [32]. They are implemented in such a way that runoff from fields is first passed through VFS before entering the streams. They also provide erosion control locally by trapping sediments, nutrients, and organic matter. VFS widths of 5, 10, 15, 20 m were applied. Water quality outputs were simulated by adjusting.
2.6.2. Riparian Buffer
Riparian Buffer if implemented in forested areas. It is land area alongside surface water streams that is covered with trees, shrubs [33]. For this study, riparian buffer is applied as an edge of field practice [34] in mixed, deciduous, and evergreen forest land use types. Buffer lengths of 5, 10, 15, 20 m were used for simulating the sediment, and nutrient yields.
2.6.3. Cover Crops
Cover Crops (CCs) are considered as BMPs, they provide vegetative cover in agricultural lands, during post-harvest period [35]. CCs are also beneficial in providing organic matter to the field, increasing soil fertility, porosity, and decrease nutrient loss [36]. CCs were added Post harvest of main crop for every agricultural land [14]. CCs are not harvested before the main crop, they are buried in the process of tillage and land preparation for the main crop to avoid more disturbance in the soil, and leaving them in the soil, improves the organic content enrichment. CCs such as Winter wheat, winter barley, Rye grass were used to simulate sediment and nutrient yields.
3. Results and Discussion
3.1. Calibration and Validation
SWAT project for Yazoo River Watershed is created, then calibrated and validated for all the sensitive parameters that affect the water quality. For a total of 109 Sub-basins, streamflow data was obtained for 8 Stations, Total Suspended Solids (TSS), Total Nitrogen (TN), and Total Phosphorus (TP) data were available only for 2 stations in the watershed.
3.1.1. Streamflow (m3/s)
Streamflow calibration and validation was done for 8 USGS gauge stations, in YRW, they are spread across the watershed with varied sub-basin characteristics. Overall model performance resulted in good as shown in Figure 3, the values for R2 and NSE ranged from 0.36 to 0.80 and 0.30 to 0.80 respectively for Calibration. Similarly, R2 and NSE ranged from 0.16 to 0.75 and 0.14 to 0.74 for validation. Table 5 shows Statistical results of Calibration and validation of all 8 Stations.
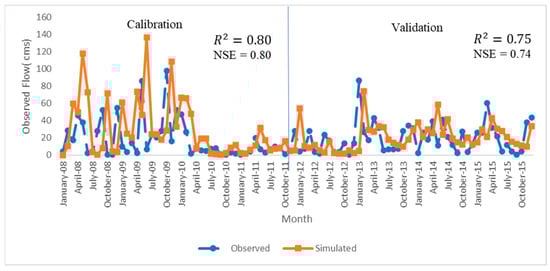
Figure 3.
Monthly observed vs. simulated flow during model calibration and validation from Bogue Phalia gauge station.
Table 5.
Calibration and Validation Results for Streamflow.
3.1.2. Sediment Concentration
For sediments, due to limited data availability, the model is calibrated and validated from 2013 to 2016 for 2 stations, at Leland (USGS07288650) and Merigold (USGS07288280). Model Performance resulted in Satisfactory, it is due to numerous peaks sediment concentrations due to extreme weather events such as heavy rainfall, snow, hail, and thunderstorms reported in 2014, 2015 in Washington County, Mississippi where the station is located [37]. The slope gradient in this region is very less, close to flat conditions, that are suitable for intense agriculture, resulting nominal flow during normal conditions. But, in the event of extreme weather events, this region is prone to flash floods, and high speed wind gusts during thunderstorms resulting increased sediment concentrations in the stream channel. The R2 and NSE values were 0.12 and 0.17 respectively for calibration and 0.17 and 0.14 respectively for Validation. Calibration of the model was done for Big Sunflower at Merigold (USGS07288280) and validation was done for station Bogue Phalia station (USGS07288650) as mentioned in Table 6. Figure 4 and Figure 5 show the trend plot.
Table 6.
Calibration and Validation for Sediment Concentration.
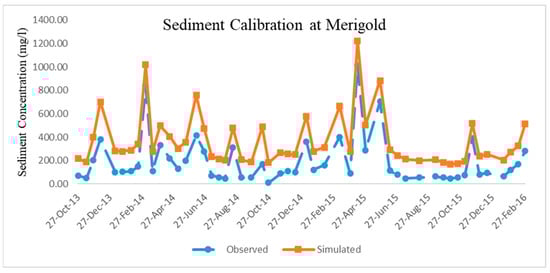
Figure 4.
Calibration of Sediment Concentration for station Big Sunflower River at Merigold.
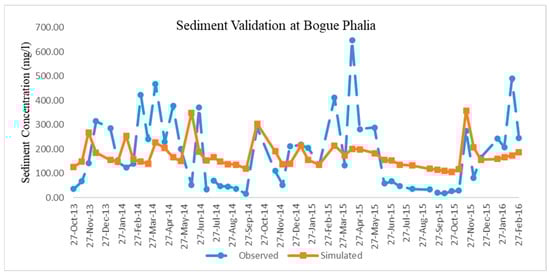
Figure 5.
Validation of Sediment Concentration at Bogue Phalia Station near Leland.
3.1.3. Total Nitrogen (TN)
Calibration for Total nitrogen is done for Merigold Station (USGS07288280) and Validation for Leland Station (USGS07288650). As we know, Nitrogen concentrations are extremely difficult to predict, as it is volatile in nature. Model performance was satisfactory. R2 and NSE values for Calibration 0.05 and 0.10 respectively and validation were 0.08 and 0.13 respectively as shown in Table 6. Concentration of Nitrogen is extremely varied from one HRU to the other with in the same sub-basin. These stations are in the area where Agriculture is intensive. Yazoo river watershed is about 50% forest, and field collected data from forested creeks and streams was very sparse and dis-continuous.
3.1.4. Total Phosphorus (TP)
Similar to TN, model was calibrated at Merigold station (USGS07288280) Validated at Leland station (USGS02788650). Model performance resulted poor during calibration, but the performance was satisfactory in validation. R2 and NSE values for Calibration 0.33 and 0.18 respectively and validation were 0.41 and 0.33 respectively as shown in Table 6.
3.2. Watershed Scale Impact of BMPs
Implementation of BMPs have resulted significant reductions in sediment and Nutrient concentrations in the watershed. Although most of the BMPs does not have impact on flow, Cover crop (CC) BMP has shown about 3–5% reduction, depending on the CC that is used. Results from rest of the BMPs are as following.
3.2.1. Vegetative Filter Strips (VFS)
Sediment and Nutrient trapping from VFS have resulted in proportional to the width of VFS as shown in Figure 6. Sediment and Nutrient yields for varying widths from 5 m to 20 m with 5 m increments have been simulated. When compared with baseline scenario, percentage reduction in Sediment and nutrient concentrations were described in Table 7.
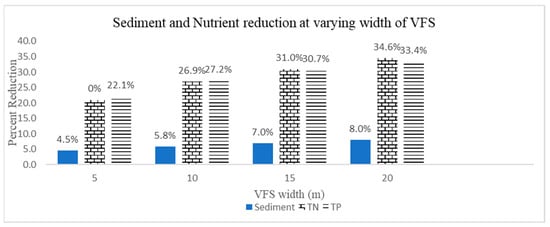
Figure 6.
Comparison of different VFS widths based on water quality outputs.
Table 7.
Percentage reduction in Sediment and Nutrient Concentrations at varying widths.
3.2.2. Riparian Buffer
Riparian buffer has been applied as edge of field practice in Forested land-use, with width at baseline conditions 0 m to a maximum of 20 m with 5-m increments. Similar to VFS, increase in buffer width resulted increased reduction in sediment and nutrients concentrations as shown in Figure 7. Percent reduction in Sediment, TN and TP concentrations are listed in Table 7. Although TN and TP reductions were not as good as in case of VFS, it is expected due to no agricultural or silvicultural management for forested land-use.
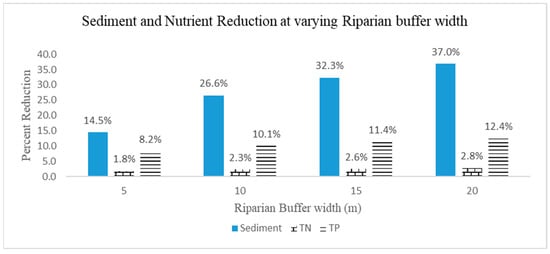
Figure 7.
Yield reduction of Sediment and Nutrient due to application Riparian buffer at varying width.
3.2.3. VFS and Riparian Buffer
This scenario is simulated with the combination of two BMPs, VFS and Riparian buffer in Agricultural and forested lands. Implementing both BMPs throughout the watershed has significantly reduced sediment and nutrient yields, shown in Figure 8. Percent reduction varied with respect to width of VFS and buffer. Reduction in sediment concentrations ranged between 23% and 52%, similarly TN ranged between 22% and 37% and TP between 30% and 46%. Percent reductions at varying width are listed in Table 7.
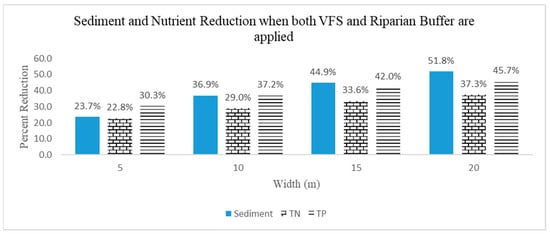
Figure 8.
Reduction in sediment and Nutrient yields when both VFS and Riparian buffer are applied.
3.2.4. Cover Crops (CC)
Cover crops (CC) are used to maintain soil nutrient concentrations and provide vegetative cover to minimize impact of rain drop during a storm event. Rye grass, winter barley and winter wheat had different impact in streamflow, TN, and TP concentrations as shown in Figure 9. Although there is no significant impact on sediments, it is observed that reduction in TN is significant, and ranged between 14% to 26%. Reduction in streamflow and Nutrient concentrations is listed in Table 8.
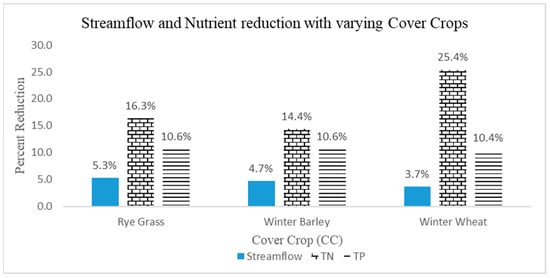
Figure 9.
Reductions in Flow and Nutrient concentrations due to CC implementation.
Table 8.
Percentage Reductions when CC were implemented.
4. Conclusions
From this study, it is evident that implementing BMPs in a watershed have significant impact in improving water quality. VFS (in agricultural land), Riparian buffer (forested land) and combination of both have no impact on reducing streamflow, but these BMPs were effective in reducing the sediment concentration, TN, and TP. As both VFS and Riparian buffer are edge of field practices [35], size of the width is directly proportional to extent of reduction. All three scenarios were simulated for five different widths, starting with 0 m, till 20 m with 5-m increments. The highest reduction in sediment and nutrient outputs were at 20 m width for all three scenarios. The results obtained from this study were compared with other studies conducted in Big Sunflower River Watershed, in Mississippi [38], and Alger Creek watershed in Michigan [23] which implemented VFS in their respective watersheds to validate, results from both studies follow similar trend. Combination of VFS and Riparian buffer throughout watershed had the highest reduction of the three, with width of 20 m, it is observed that there is about 52% reduction in sediments, 37% reduction in total nitrogen and 46% reduction in total phosphorus. Therefore, it is recommended to have a combination of VFS and Riparian buffer for highest sediment, nutrient reduction that could result in improving water quality.
Cover Crops (CC) used in this study are planted after the harvest of main crop (Soybean, Corn, Cotton, and Rice). Crop scheduling, and management operations were applied based on the observations from Mississippi Agriculture and Forestry Extension Services [14]. Out of the three crops (Rye grass, winter barley, winter wheat) used as CC, Rye had proved to be reducing streamflow the highest to about 5% compared to other CC, whereas winter wheat had the highest TN reduction, about 25%. TP reduction ranged between 10 to 11% for all three CC. These results were validated by comparing the results from other studies conducted in Alger Creek Watershed in Michigan [23], Eagle creek Watershed in Ohio [39], Smith fry watershed in Indiana [40]. All of them reported the similar trend in application of CC as BMP for Flow, Sediment and Nutrient reductions.
Author Contributions
Model development, data analysis and manuscript draft by V.V. and project supervision, review of manuscript, and funding acquisition by P.B.P. All authors have read and agreed to the published version of the manuscript.
Funding
This research was partially funded by USDA Multi-state Hatch project through Mississippi Agricultural and Forestry Experiment Services (MAFES), MAFES Director’s fellowship, position # 7515.
Institutional Review Board Statement
Not applicable.
Informed Consent Statement
Not applicable.
Data Availability Statement
Not applicable.
Acknowledgments
We would like to acknowledge the partial support of USDA’s Multi-state Hatch project through Mississippi Agricultural and Forestry Experiment Services (MAFES), MAFES Director’s fellowship, position # 7515, NIFA competitive grant award # 2017-67020-26375, Mississippi Agricultural and Forestry Experiment Services (MAFES), and College of Agriculture and Life Sciences at Mississippi State University, United States Geological Survey (USGS), and all our collaborators for providing necessary data for this study.
Conflicts of Interest
The authors declare no conflict of interest.
References
- Kaplan, J.O.; Krumhardt, K.M.; Zimmermann, N. The prehistoric and preindustrial deforestation of Europe. Quat. Sci. Rev. 2009, 28, 27–28. [Google Scholar] [CrossRef]
- Environment Protection Agency (EPA). Available online: https://www.epa.gov/nps/basic-information-about-nonpoint-source-nps-pollution (accessed on 11 November 2021).
- Dash, P.; Silwal, S.; Ikenga, J.O.; Pinckney, J.L.; Arslan, Z.; Lizotte, R.E. Water Quality of Four Major Lakes in Mississippi, USA: Impacts on Human and Aquatic Ecosystem Health. Water 2015, 7, 4999–5030. [Google Scholar] [CrossRef]
- World Health Organization (WHO). Available online: https://www.who.int/news-room/fact-sheets/detail/drinking-water#:~:text=In%202017%2C%2071%25%20of%20the,at%20least%20a%20basic%20service (accessed on 11 November 2021).
- United Nations (UN). Available online: https://www.un.org/en/global-issues/water (accessed on 12 November 2021).
- Rabalais, N.N.; Turner, R.E.; Gupta, B.K.S.; Platon, E.; Parsons, M.L. Sediments tell the history of eutrophication and hypoxia in the northern Gulf of Mexico. Ecol. Appl. 2007, 17, S129–S143. [Google Scholar] [CrossRef]
- Tilman, D.; Balzer, C.; Hill, J.; Befort, B.L. Global food demand and the sustainable intensification of agriculture. Proc. Natl. Acad. Sci. USA 2011, 108, 20260–20264. [Google Scholar] [CrossRef] [PubMed] [Green Version]
- Parajuli, P.B.; Nelson, N.O.; Frees, L.D.; Mankin, K.R. Comparison of AnnAGNPS and SWAT model simulation results in USDA-CEAP agricultural watersheds in south-central Kansas. Hydrol. Process. 2009, 23, 748–763. [Google Scholar] [CrossRef]
- Arnold, J.G.; Srinivasan, R.; Muttiah, R.S.; Williams, J.R. Large area hydrologic modeling and assessment part I: Model development. J. Am. Water Resour. Assoc. 1998, 34, 73–89. [Google Scholar] [CrossRef]
- United States Geological Survey (USGS). Available online: https://apps.nationalmap.gov/downloader/#/productSearch (accessed on 27 August 2020).
- United States Department of Agriculture—National Agricultural Statistics Service (USDA-NASS) CropScape—Cropland Data Layer. Available online: https://nassgeodata.gmu.edu/CropScape/ (accessed on 10 September 2020).
- Web Soil Survey (WSS) SSURGO Database. Available online: https://websoilsurvey.sc.egov.usda.gov/App/WebSoilSurvey.aspx (accessed on 10 September 2020).
- National Oceanic and Atmospheric Administration (NOAA)—Climate Data Online. Available online: https://www.ncdc.noaa.gov/cdo-web/search (accessed on 10 September 2020).
- Mississippi Agricultural and Forestry Experiment Station (MAFES)—Variety trials. Available online: https://www.mafes.msstate.edu/variety-trials/ (accessed on 5 November 2020).
- Mississippi Forestry Commission. Mississippi’s BMPs—Best Management Practices for Forestry in Mississippi Handbook, 4th ed.; Wayback Machine: Jackson, MS, USA, 2008. [Google Scholar]
- ASABE. American Society for Agricultural and Biological Engineering (ASABE)—Manure Production and Characteristics. In ASAE D384.2 MAR2005; ASABE: St. Joseph, MI, USA, 2019. [Google Scholar]
- Nash, J.E.; Sutcliffe, J.V. River flow forecasting through conceptual models. Part I—A discussion of principles. J. Hydrol. 1970, 10, 282–290. [Google Scholar] [CrossRef]
- Wright, S. Correlation and causation. J. Agric. Res. 1921, 20, 557–585. [Google Scholar]
- Abbaspour, K.C.; Rouholahnejad, E.; Vaghefi, S.; Srinivasan, R.; Yang, H.; Kløve, B. A continental-scale hydrology and water quality model for Europe: Calibration and uncertainty of a high-resolution large-scale SWAT model. J. Hydrol. 2015, 524, 733–752. [Google Scholar] [CrossRef] [Green Version]
- Kim, H.K.; Parajuli, P.B.; To, S.F. Assessing impacts of bioenergy crops and climate change on hydrometeorology in the Yazoo River Basin, Mississippi. Agric. For. Meteorol. 2013, 169, 61–73. [Google Scholar] [CrossRef]
- Knouft, J.H.; Botero-Acosta, A.; Wu, C.L.; Charry, B.; Chu, M.L.; Dell, A.I.; Hall, D.M.; Herrington, S.J. Forested riparian buffers as climate adaptation tools for management of riverine flow and thermal regimes: A case study in the Meramec River Basin. Sustainability 2021, 13, 1877. [Google Scholar] [CrossRef]
- Soil and Water Assessment Tool (SWAT)—Input–Output Documentation 2012. Available online: https://swat.tamu.edu/docs/ (accessed on 10 September 2020).
- Merriman, K.R.; Russell, A.M.; Rachol, C.M.; Daggupati, P.; Srinivasan, R.; Hayhurst, B.A.; Stuntebeck, T.D. Calibration of a field-scale Soil and Water Assessment Tool (SWAT) model with field placement of best management practices in Alger Creek, Michigan. Sustainability 2018, 10, 851. [Google Scholar] [CrossRef] [Green Version]
- Zhang, X.; Zhang, M. Modeling effectiveness of agricultural BMPs to reduce sediment load and organophosphate pesticides in surface runoff. Sci. Total Environ. 2011, 409, 1949–1958. [Google Scholar] [CrossRef] [PubMed]
- Himanshu, S.K.; Pandey, A.; Yadav, B.; Gupta, A. Evaluation of best management practices for sediment and nutrient loss control using SWAT model. Soil Tillage Res. 2019, 192, 42–58. [Google Scholar] [CrossRef]
- Luo, Y.; Zhang, M. Management-oriented sensitivity analysis for pesticide transport in watershed-scale water quality modeling using SWAT. Environ. Pollut. 2009, 15, 3370–3378. [Google Scholar] [CrossRef] [PubMed]
- Risal, A.; Parajuli, P.B. Quantification and simulation of nutrient sources at watershed scale in Mississippi. Sci. Total Environ. 2019, 670, 633–643. [Google Scholar] [CrossRef]
- Jayakody, P.; Parajuli, P.B.; Cathcart, T.P. Impacts of climate variability on water quality with best management practices in sub-tropical climate of USA. Hydrol. Process. 2014, 28, 5776–5790. [Google Scholar] [CrossRef]
- Ni, X.; Parajuli, P.B. Evaluation of the impacts of BMPs and tailwater recovery system on surface and groundwater using satellite imagery and SWAT reservoir function. Agric. Water Manag. 2018, 210, 78–87. [Google Scholar] [CrossRef]
- Parajuli, P.B.; Jayakody, P.; Sassenrath, G.F.; Ouyang, Y. Assessing the impacts of climate change and tillage practices on stream flow, crop and sediment yields from the Mississippi River Basin. Agric. Water Manag. 2016, 168, 112–124. [Google Scholar] [CrossRef] [Green Version]
- Lin, P.; Chen, M.; Guo, L. Speciation and transformation of phosphorus and its mixing behavior in the Bay of St. Louis estuary in the northern Gulf of Mexico. Geochim. Cosmochim. Acta 2012, 87, 283–298. [Google Scholar] [CrossRef]
- United States Department of Agriculture—Natural Resources Conservation Service (USDA-NRCS)—Filter Strips (Code 393, 2016). Available online: https://www.nrcs.usda.gov/Internet/FSE_DOCUMENTS/stelprdb1241319.pdf (accessed on 5 December 2021).
- United States Department of Agriculture—Natural Resources Conservation Service (USDA-NRCS)—Riparian Forest Buffer (Code 391, 2012). Available online: https://www.nrcs.usda.gov/Internet/FSE_DOCUMENTS/stelprdb1255022.pdf (accessed on 5 December 2021).
- United States Department of Agriculture—Natural Resources Conservation Service (USDA-NRCS)—Conservation Effects Assessment Project (CEAP). 2013. Available online: https://www.nrcs.usda.gov/Internet/FSE_DOCUMENTS/stelprdb1176978.pdf (accessed on 15 December 2021).
- United States Department of Agriculture—Natural Resources Conservation Service (USDA-NRCS)—Cover Crops (Code 340, 2021). Available online: file:///C:/Users/vv221/Downloads/340_NHCP_CPS_Cover_Crop_2021%20.pdf (accessed on 20 December 2021).
- Yeo, I.Y.; Lee, S.; Sadeghi, A.M.; Beeson, P.C.; Hively, W.D.; McCarty, G.W.; Lang, M.W. Assessing winter cover crop nutrient uptake efficiency using a water quality simulation model. Hydrol. Earth Syst. Sci. 2014, 18, 5239–5253. [Google Scholar] [CrossRef] [Green Version]
- National Oceanic and Atmospheric Administration (NOAA)—Storm Events Database. Available online: https://www.ncdc.noaa.gov/stormevents/listevents.jsp?eventType=ALL&beginDate_mm=01&beginDate_dd=01&beginDate_yyyy=2014&endDate_mm=05&endDate_dd=31&endDate_yyyy=2016&county=WASHINGTON%3A151&hailfilter=0.00&tornfilter=0&windfilter=000&sort=DT&submitbutton=Search&statefips=28%2CMISSISSIPPI (accessed on 15 July 2021).
- Risal, A.; Parajuli, P.B.; Ouyang, Y. Impact of BMPs on water quality: A case study in Big Sunflower River watershed, Mississippi. Int. J. River Basin Manag. 2021, 1–14. [Google Scholar] [CrossRef]
- Merriman, K.R.; Daggupati, P.; Srinivasan, R.; Toussant, C.; Russell, A.M.; Hayhurst, B. Assessing the impact of site-specific BMPs using a spatially explicit, field-scale SWAT model with edge-of-field and tile hydrology and water-quality data in the Eagle Creek Watershed, Ohio. Water. 2018, 10, 1299. [Google Scholar] [CrossRef] [Green Version]
- Arabi, M.; Frankenberger, J.R.; Engel, B.A.; Arnold, J.G. Representation of agricultural conservation practices with SWAT. Hydrol. Process. 2008, 22, 3042–3055. [Google Scholar] [CrossRef]
Publisher’s Note: MDPI stays neutral with regard to jurisdictional claims in published maps and institutional affiliations. |
© 2022 by the authors. Licensee MDPI, Basel, Switzerland. This article is an open access article distributed under the terms and conditions of the Creative Commons Attribution (CC BY) license (https://creativecommons.org/licenses/by/4.0/).