Article

Digital Technologies Determination Effectiveness for the Productivity of Organic Winter Wheat Production in Low Soil Performance Indicator

by
Paulius Astrauskas
* and
Gediminas Staugaitis
Lithuanian Research Centre for Agriculture and Forestry, LT-58344 Akademija, Lithuania
*
Author to whom correspondence should be addressed.
Agriculture 2022, 12(4), 474; https://doi.org/10.3390/agriculture12040474
Submission received: 1 February 2022 / Revised: 22 March 2022 / Accepted: 25 March 2022 / Published: 28 March 2022
(This article belongs to the Section Agricultural Soils)

Abstract

:
The most important aspect of precision farming is the prediction of crop yield and quality. Digital technologies (soil maps and combine harvester with telemetry functions) were used to determinate the yield of organically grown winter wheat (variety Skagen) in two fields of 18.8 and 4.5 ha in Lithuanian regional conditions, in an area classified as low-performance for farming. The objective of the research was to determine the effectiveness of digital technologies (soil maps and combine harvester with telemetry functions) in assessment of the dynamics of soil pH, P2O5, and K2O, humus and organic winter wheat (variety Skagen) productivity, and grain crude-protein dependence in low-performance soils. Haplic Luvisol soils predominated, while Eutric Gleysols, Haplic Arenosols, and Eutric Planosols soils intervened in smaller areas, and the granulometric composition of the soil in the arable layer and the subsoil varied from sand to sandy loam, loam, and silt loam. In the sandy areas of Haplic Arenosols and in the lower parts of the field, where Eutric Gleysols, intervened in predominant Haplic Luvisols soils, winter wheat crude protein content and grain yield were lower. The biggest grain yield of 6.95 t ha−1 was obtained in Haplic Luvisols soils. Crude protein of winter wheat grains varied from 9.70 to 13.34%. Although both technologies reflected the non-uniform yields of the fields and correlation between them well, the information on the soil cover of the field better explained the reasons for lower yields. In the case of this research, sand inclusions and lower areas in winter wheat fields, causing plants to soak during winter, were identified. The combination of two digital technologies (soil maps and combine harvester with telemetry functions) made it possible to determine yields accurately, and quickly. Moreover, there is a need, in the future, to evaluate the reasons for yield variation and address changes in yields due to the improvement of certain low-performance soil areas. The complex use of these technologies can be beneficial in terms of labour and economy. However, the accurate benefit of labour time and economic should be investigated.

1. Introduction

The need for nutrients for crop growth is determined by soil performance indicators, granulometric composition, agrochemical properties such as nutrient concentration, pH, and other factors. The soil water regime can also have a significant impact on plant fertility and needs to be considered [1,2]. Therefore, it is necessary to know the soil performance indicators and the resulting crop yield because it allows for the application of cultivation or other agrotechnical measures in infertile areas and changes in the amounts of soil improvers, etc. [3]. It is especially important to know the reasons for the change in yield in organic farms, as it is more difficult to increase the yield due to not using chemical technologies [4]. Moreover, scientific research has shown that ongoing climate change and changes in the growing season necessitate annual adjustments to key parameters affecting crop quality and yield [5].
Increasing the intensity of land use is a major cause of biodiversity loss on arable land, so new methods for measuring land-use intensity using remote sensing parameters from Sentinel-2 satellites are being developed. These showed that the vegetation index of traditional cereals was 17% and 13% higher than in organic fields. Therefore, Sentinel-2 can be used to assess land-use intensity and its impact on biodiversity [6]. However, the transition to digital technologies is relatively slow, although their purpose is to increase the productivity of crop companies [7].
In Lithuania, a web field (www.zis.lt, accessed on 1 March 2022) contains the following digitized M 1:10,000 soil datasets for agricultural land of the whole country DIRV_DB10LT: (1) soil types according to FAO, (2) granulometric composition of soil surfaces, (3) granulometric composition of soil-forming rock (subsoil), and (4) land productivity score maps [8,9]. This information allows the contours of the soil or its productivity to be applied to a specific field and, knowing that 1 GJ/ha equals 0.8 productivity points, to calculate the yield of the field and the soil in it, for example for winter wheat. Multispectral aerial photography allows monitoring of the condition and development of winter wheat crops and accurate forecasts of grain yields [10]. Another evaluated method for monitoring planted areas and modelling the winter-wheat yield based on data from the Moderate-Resolution Imaging Spectroradiometer (MODIS) showed an overall accuracy of 96.5% for the calculated area under winter wheat. Models can accurately estimate yields with appropriate NDVI data before harvest dates. A fast and reliable method can be applied to monitor the sown area of winter wheat and to model yields in other regions [11].
To determine winter-wheat yield-forecasting models during the season, advanced machine-learning algorithms were extracted, extracting yield determinants from satellite images, climate data, soil maps, and historical yield records. The results showed that machine-learning methods performed better than linear regression models, that satellite data from multiple sources were better combined than satellite data from the same source, and the highest accuracy of predictions was obtained 2.5 months before harvest when data from multiple sources were combined [12]. When mapping using machine-learning (ML) and traditional methods, the results showed a higher accuracy of ML-based land suitability maps compared to maps obtained using the traditional method [13].
Based on the regression equations, the topographic indices can well justify the spatial variability of wheat yield, indicating the importance of these factors in influencing the moisture distribution during the wheat cultivation process in the study region [14]. Graphs of data from the analysis of two sources—a map of stable intra-field heterogeneity of soil fertility (analyzing large satellite data) and the crop yield map (analyzing sensors of a John Deere combine) showed that the average yield according to the combine data had a high correlation with the fertility zones. The distribution of yields within the zones had an almost normal distribution [15]. The accuracy of the soil map has been improved so that it can be adapted to the most advanced farming systems, including precision farming and a new source of information has emerged about the spatial heterogeneity of soil cover and its fertility [16].
Recipe maps were created based on archived crop maps and soil analysis, and recently integrated with Sentinel 2 satellite imagery. In addition, the experience of farmers and the availability of variable rate application (VRA) requirements have influenced the development of homogeneous management zones. Farmer management solutions can evolve each season by continuously monitoring crop performance, understanding field variability, and leveraging recently developed decision-support software [17,18].
Automation of technological processes maximizes the technical potential, shortens the time taken for the technological processes, and reduces fuel consumption. Automatic cruise control systems allow for the monitoring of the set parameters and the constant change of the speed of the combine in the fields according to the data received. The choice of driving speed is influenced by controlled parameters such as grain separation, cleaning losses, threshing drum speed, engine load, and the grain mass flow height feed conveyor. Automatic control systems can increase the efficiency of combines by up to 10%, consuming an average of 46 ± 5% working time for the technological process [19].
Studies comparing predictions computed from satellite images with yield measurements at fully operational farms are rare since (detailed) yield data are the most sensitive kind of farm data. The non-openness of yield data is even worse with respect to accessing yield maps that depict the geospatial variations in yield within a plot—that is to say, maps with yield measurements from harvesters in our study reaching up to a spatial resolution of 9.15 m (operational harvesting width) to 3.1 m (measurements each two seconds for average speed 1.55 m·s−1). Correlations were found between the predicted yield productivity zones and the measured yield. The standard deviations as well as the extent of (minimum and maximum) values were in all cases higher than the yield values measured by a field harvester. The differences in yield predictions compared to the measured values were up to 5%. The prediction overestimated the yield by 6.66% in one case and underestimated it by 10.83% in another case. Moreover, a qualitative evaluation by farmers/agronomists/scientists has also demonstrated the credibility of yield productivity zone identification as well as its geospatial distribution [20]. Digitized technologies offer great potential but are still little tested in practice. The aim of this research was to evaluate the effectiveness of a combination of two digital technologies (soil maps and combine harvester with telemetry functions) in determining the yield of organically grown winter wheat crops in the fields with uneven soil variegation. However, because of the uncertainties in measurement accuracy [21] and the inherent observational expression [22,23] in both digital and biophysical data, comparative research in finding the most optimal solutions is also relevant. For this, the data obtained by a smart combine harvester with telemetry functions were used and the grain yield was determined in different soils using the digital dataset DIRV_DB10LT. The objective of the research was to determine the effectiveness of digital technologies (soil maps and combine harvester with telemetry functions) in assessment of the dynamics of soil pH, P2O5, and K2O, humus and organic winter wheat (variety Skagen) productivity, and grain crude-protein dependence in low-performance soils.

2. Materials and Methods

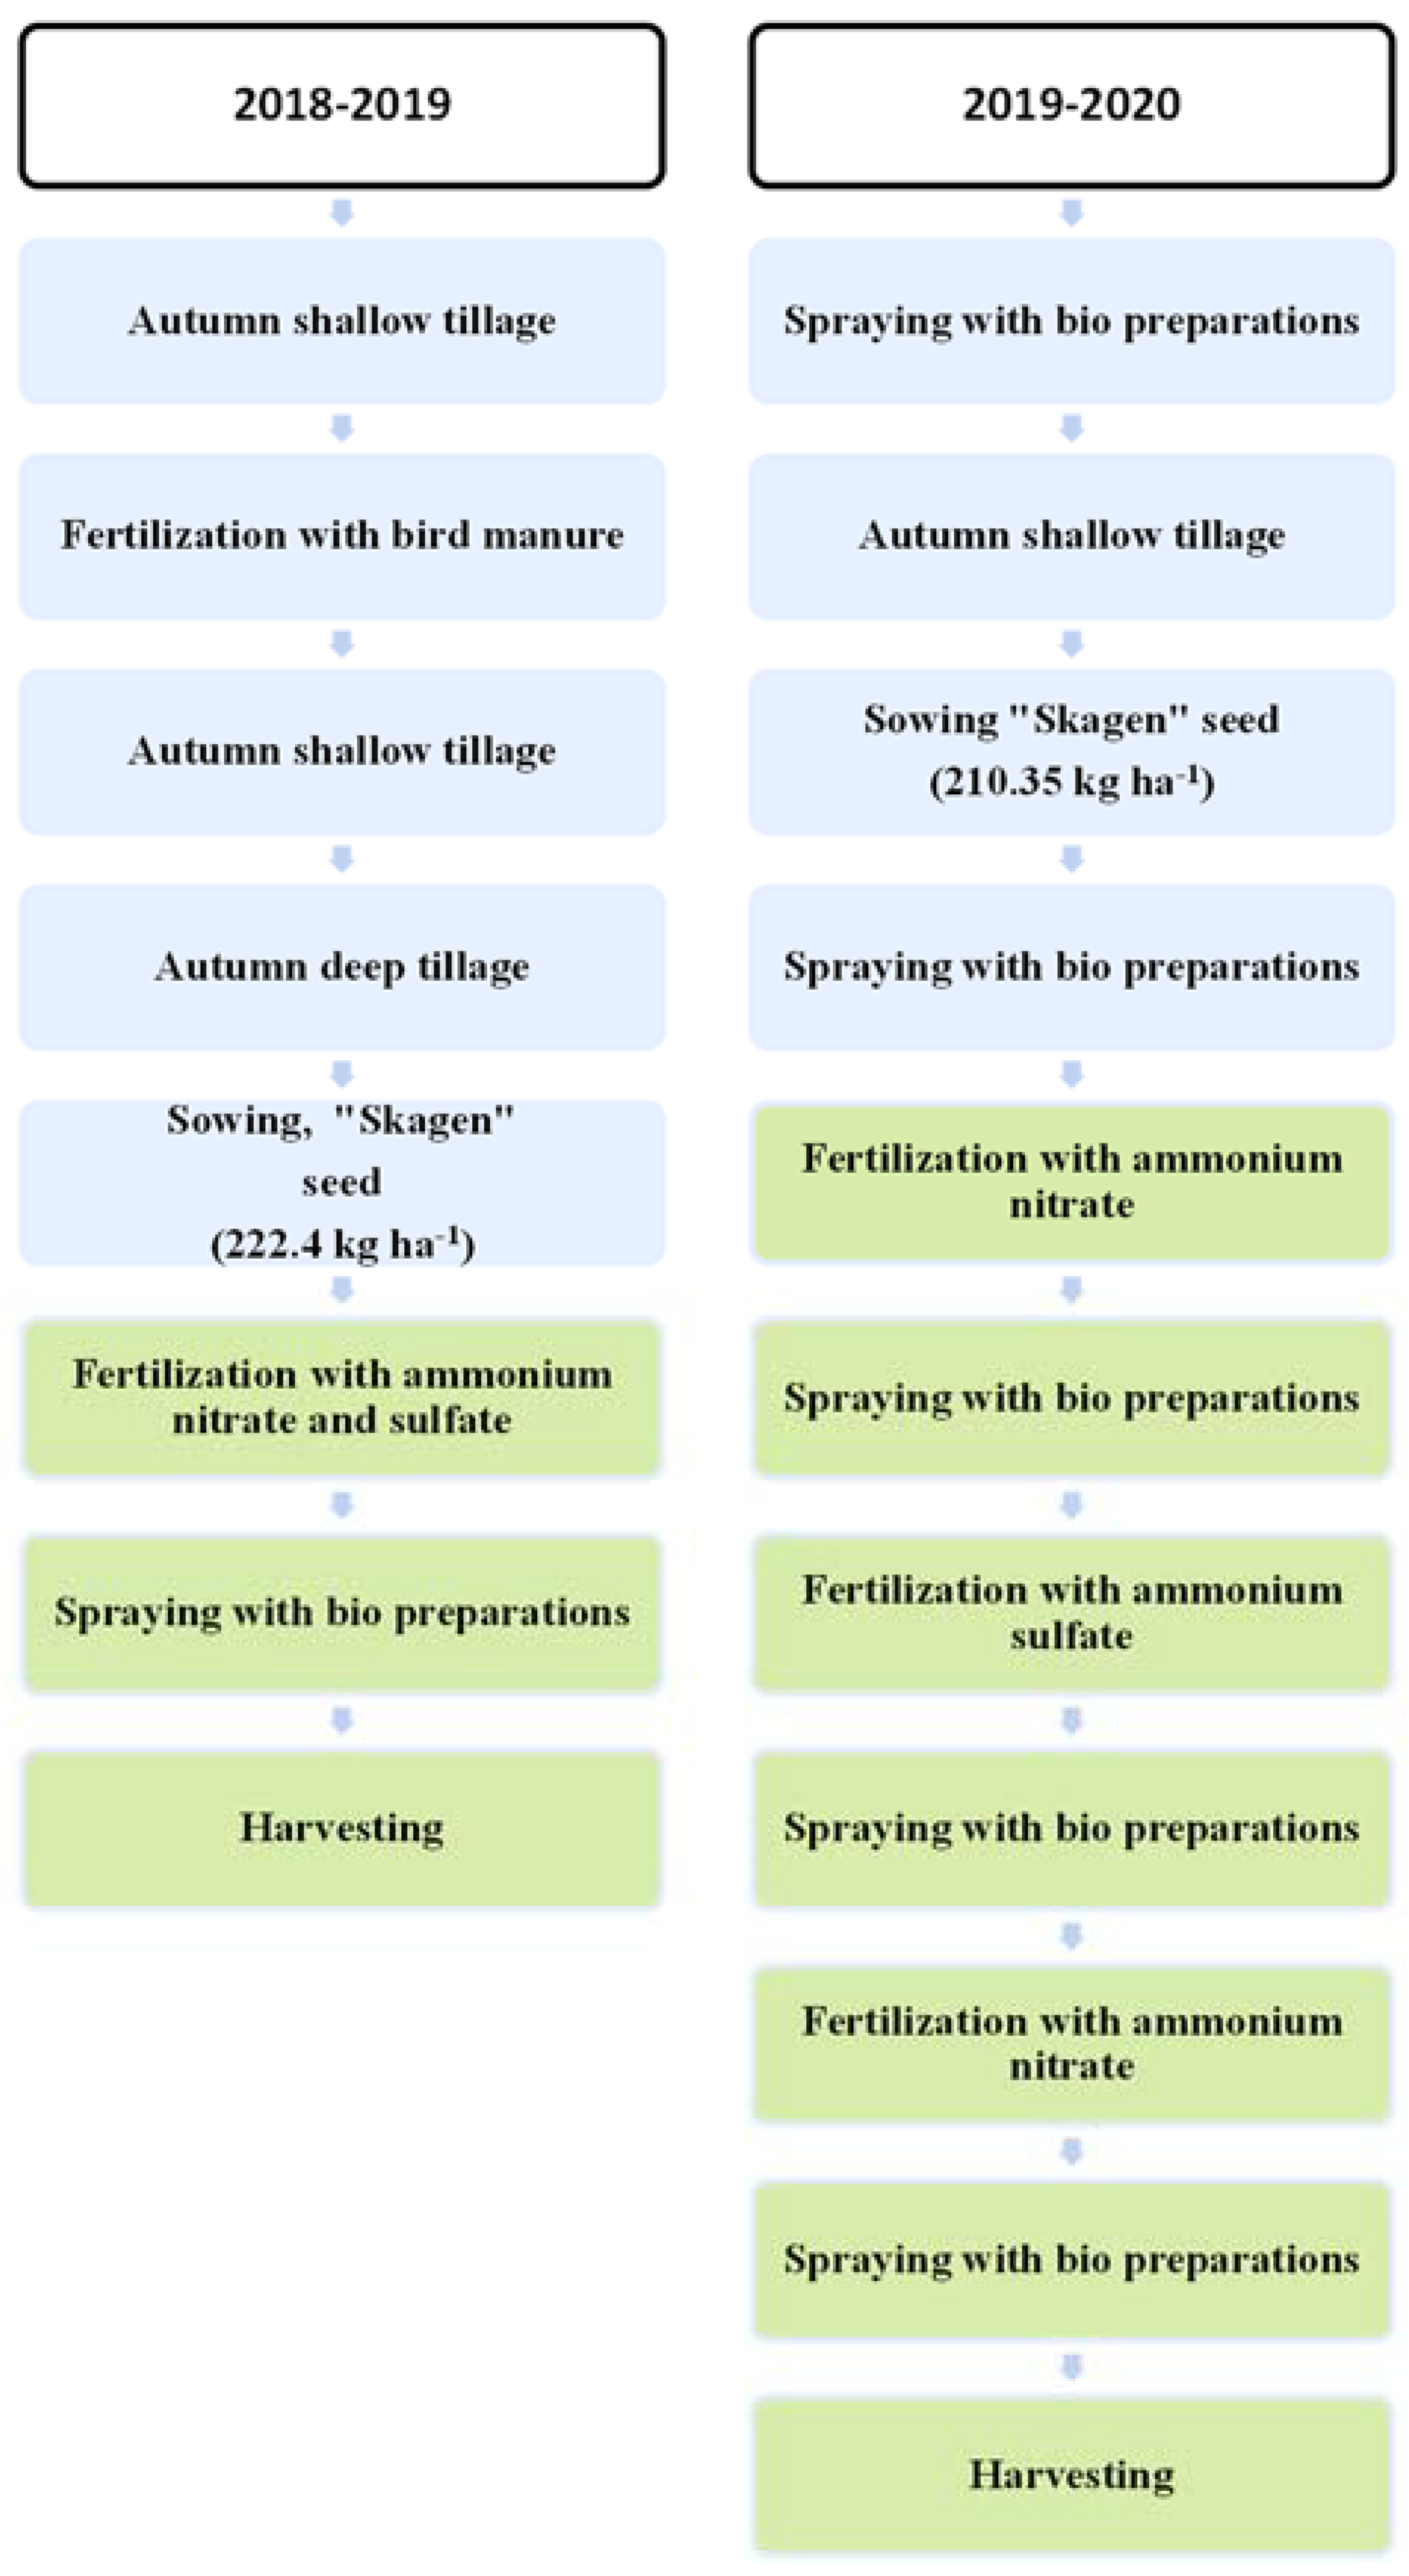
2.1. Experimental Design and Execution Plan

It was decided to combine the two possible techniques which could be used together and to evaluate the accuracy of their overall complex measurement to assess the effectiveness of the digital technologies. Digital technologies such as soil maps and a combine harvester with telemetry functions were combined. This was done by comparing their measured and recorded values with those measured mechanically in the usual way. The complex effectiveness of the digital technologies was evaluated by assessing the dynamics of soil pH, P2O5, and K2O, humus and organic winter wheat (variety Skagen) productivity, and grain crude-protein dependence on low-performance Haplic Luvisols, Eutric Gleysols, Haplic Arenosols, Eutric Planosols soil texture including topsoil/subsoil (silt loam/silt loam, sandy loam/sandy loam, sandy loam/sand, sandy loam/sandy loam/silty clay loam, sandy loam/loam.
Field experiments were performed in low-performance soils from 2018 to 2020 in the Elektrėnai municipality of Lithuania. Field experiments consist of two soil fields of 18.8 ha and 4.5 ha. The two fields were divided into eight different soil contours according to soil dataset DIRV_DB10LT, which contains the contours of soil types according to FAO, and granulometric composition of the surface and deeper soil-forming rock in Lithuanian agricultural land (Table 1).
The database of agrochemical properties of Lithuanian soils DirvAgroch_DB10LT is intended for the assessment of soil fertility by preparing the layers of soil pH, humus content, soil phosphorus, and potash groups. The Dirv_DB10LT database contains information on soil systemic units determined according to the Soil Classification of the Republic of Lithuania (LTDK-99) and grouped according to close properties into 21 soil fertility assessment groups. Granulometric composition data is expressed according to the equilateral triangle and divided into nine groups and layers of soil typological systematic units and granulometric composition groups were prepared. The contour of the soil pH KCl groups (I—pH 4.5 or less, II—pH 4.6–5.0, III—5.1–5.5, and IV—5.6–6) is presented in the improved DirvAgroch_DB10LT base on a scale of 1:10,000, 0, V—6.1–6.5, VI—more than 6.5), aggregate data of the test object, contours of mobile phosphorus (P2O5) and potassium (K2O) mg kg−1 groups (I—up to 50, I,II—0–100, II—51–100, II,III—51–150, III—101–150, III,IV—101–200, IV—151–200, and V—more than 200 mg kg−1), aggregate data of the test object.
The eight different soil contours were installed in 2 m2 plots due to determine the crops’ productivity. For soil-performance-indicator-demanding plants, a basic soil was a suitable performance indicator—up to 35 points, less-demanding and soil-demanding plants would need 36–45 points, and for very demanding soils over 45 points. The research area was classified as soil performance indicator performance indicator for farming because the soil performance indicator of two research fields ranged from 30 to 40 points, the undulating relay had a heterogeneous granulometric composition of the fields, and each field was dominated by three soil types. The first field was dominated by Haplic Luvisol soil with silt loam in thetopsoil and subsoil. Very different soils textures from Eutric Gleysols and Haplic Arenosols were mixed nearby, with sandy loam in the topsoil and sandy loam and sand in the subsoil. The second field was also dominated by Haplic Luvisol soil, with sandy loam in the topsoil and loam texture in the subsoil. There was also an interspersed area of Eutric Planosols soil with sandy loam texture and silty clay loam 60 cm below that. The first field also had Eutric Gleysols with sandy loam in the topsoil and subsoil.
The winter wheat of variety Skagen was grown in organic production fields where no chemical plant protection products had been used for two years. Previously, the fields were fertilized annually with bird manure not exceeding nitrogen (N) rates of 170 kg ha−1.
The technological operations research plan is provided in Figure 1. In 2018 and 2019, before sowing, the fields were ploughed and cultivated. Sowing work was performed from 18 to 22 September (2018–2019). In the autumn, two weeks after sowing, and in the spring, after the resumption of winter wheat vegetation, weed control was performed mechanically using an ecological tine harrow. In 2018 and 2019, the grain was harvested in the first week of August. Wheat grain yield was approximately 14% moisture.

2.2. The Assessment of Meteorological Conditions

Meteorological conditions of the region are suitable for growing winter wheat. During the research period of 2018–2019, September and October were warm, with sufficient rainfall, so winter wheat germinated well and rooted (Table 2). In December and January, the average daily temperature was slightly negative at −1.1 and −4.2 °C, respectively. In February and March the average daily temperature was slightly positive at 1.1 and 3.4 °C, respectively. This was favorable for winter wheat as it overwintered well, and the vegetation resumed in early April. However, precipitation was low in April and May—only 0.1 and 10.7 mm, respectively. Soil moisture reserves increased close to optimal only in the second half of June. Therefore, during this period, the plants felt a lack of moisture. July was warm with 44.3 mm of precipitation, so the weather was favorable for grain formation and maturation in the bells.
Meteorological conditions in October of the period 2019–2020 were unusually warm for the region. The warm autumn and the positive temperature in the winter allowed winter wheat to form a lush crop and overwinter well. Plant vegetation resumed in the second week of April. The month of May was favorable for winter wheat, as the precipitation was 60.1 mm, and the average daily temperature was 10.8 °C. Meanwhile, the summer of that year was warm, and the soil was moist due to the 79.4, 54.0, and 76.8 mm of precipitation in June, July, and August, respectively. Therefore, these months were favorable for winter wheat to grow and to form a harvest.

2.3. Determination of Soil and Winter Wheat of Variety Skagen Grain Quality and Productivity

The soil agrochemical properties were determined in 0–20 cm depth of the soil. Litmus strips were used to determine soil pH. We mixed a handful of soil with room-temperature distilled water, dipped a pH test strip in the mixture for 20–30 s and compared the pH strip to the test kit’s key. P2O5 and K2O were determined by the acetate lactate (A-L) method. Soil humus was determined by the Thurin method. The crude protein content of winter wheat was determined firstly by determining in cereals, the total nitrogen by the Kjeldahl method (which consists essentially of transforming all nitrogen in a weighed sample into ammonium sulfate by digestion with sulfuric acid, alkalizing the solution, and determining the resulting ammonia by distilling it into a measured volume of standard acid, the excess of which is determined by titration) and multiplied by a factor of 6.25.
The productivity of winter wheat was determined in two ways. In the first case, a 2018-made John Deere S-Class harvester with smart telemetry functions was used to determine the yield. The Harvest Smart system is an adaptive, on-the-go control system designed to enable automatic ground speed control during harvest operation. Harvest Smart ensures the combine maintains a consistent crop load by automatically changing the combine ground speed to compensate for variations in crop that are not readily visible to the operator. Since the Harvest Smart control system automatically keeps the machine at maximum load capacity, as set by the operator, fatigue and stress are reduced and overall harvesting productivity is increased. The productivity data determined by the combine harvester with telemetry functions were evaluated by GPS coordinates. In the second case, after mechanically collecting wheat feet in 2 m2 plots in eight different soil contours of two fields, the biometric parameters of the plants (grain content, weight, and wheat-ear data) were determined in the laboratory, and the yield in different fields was calculated.

2.4. Statistical Analysis

For statistical evaluation of the research results, the ANOVA tool of Microsoft Excel software was used. Arithmetic averages, standard deviations, and their confidence intervals were determined at the p < 0.05 probability level.

3. Results and Discussion

3.1. Assessment of Dynamic of Soil Agrochemical Properties and Winter Wheat of Variety Skagen Grain Crude-Protein Dependence on Soil Texture

The agrochemical properties of the soil were similar to those in the first field, except that there was more mobile phosphorus, and Eutric Gleysols and Eutric Planosols had more humus.
The soil pH in the field was very close to neutral (approximately 6.80), mobile phosphorus was very high (the first field varied from 385 to 794.50 mg kg−1 and the second field from 635 to 790.50 mg kg−1), mobile potassium was moderate or high (the first field varied from 161 to 287.50 mg kg−1 and the second field from 167.5 to 210.50 mg kg−1), and humus was moderate (the first field varied from 2.09 to 2.46% and the second field from 1.94 to 3.44%) (Table 3). The fields under study had been fertilized with bird manure for several years. As a result, large amounts of phosphorus and potassium were formed in the soil.
In the first field, grains grown in Eutric Gleysols (field no. 3) and Haplic Arenosols (field no. 3) soils contained less crude protein—10.68% and 9.70%, respectively, while in Haplic Luvisols (field no. 1 and field no. 2), on average 12.83% crude protein was found (Figure 2). In the second field, grain levels of crude protein were similar in all fields (approximately 10.45%). Edible wheat contains 6–20% protein.

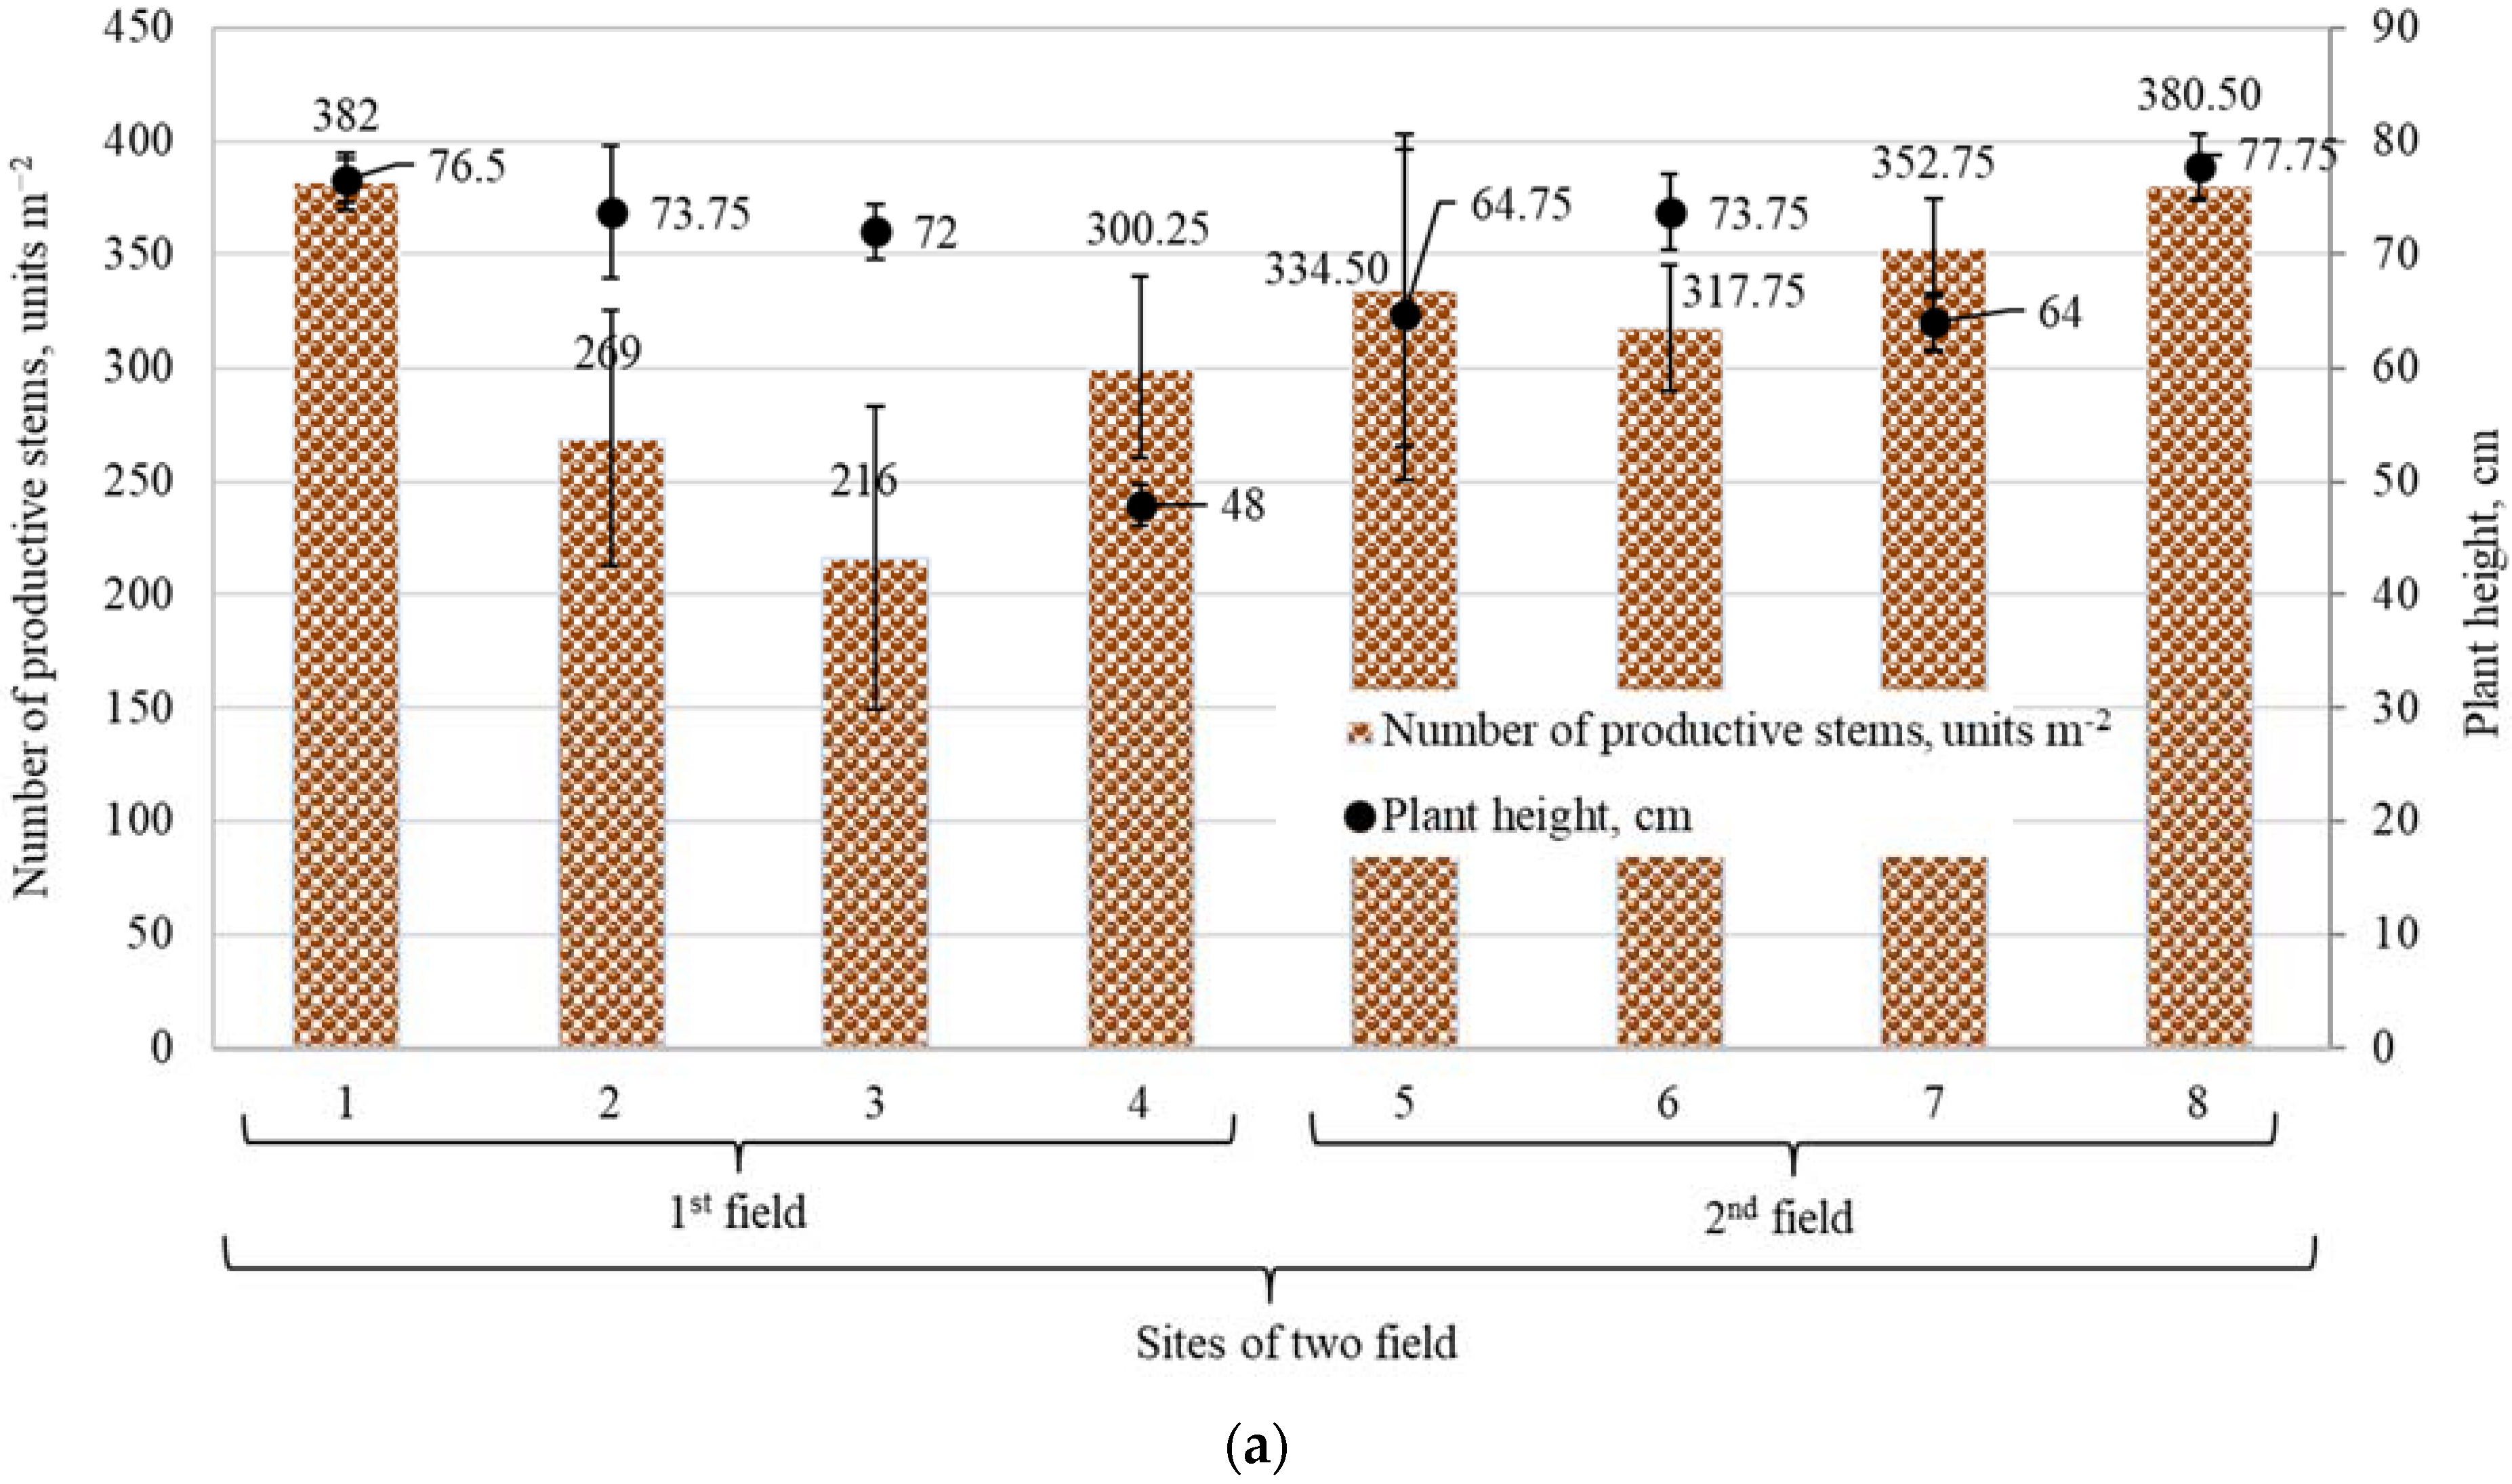
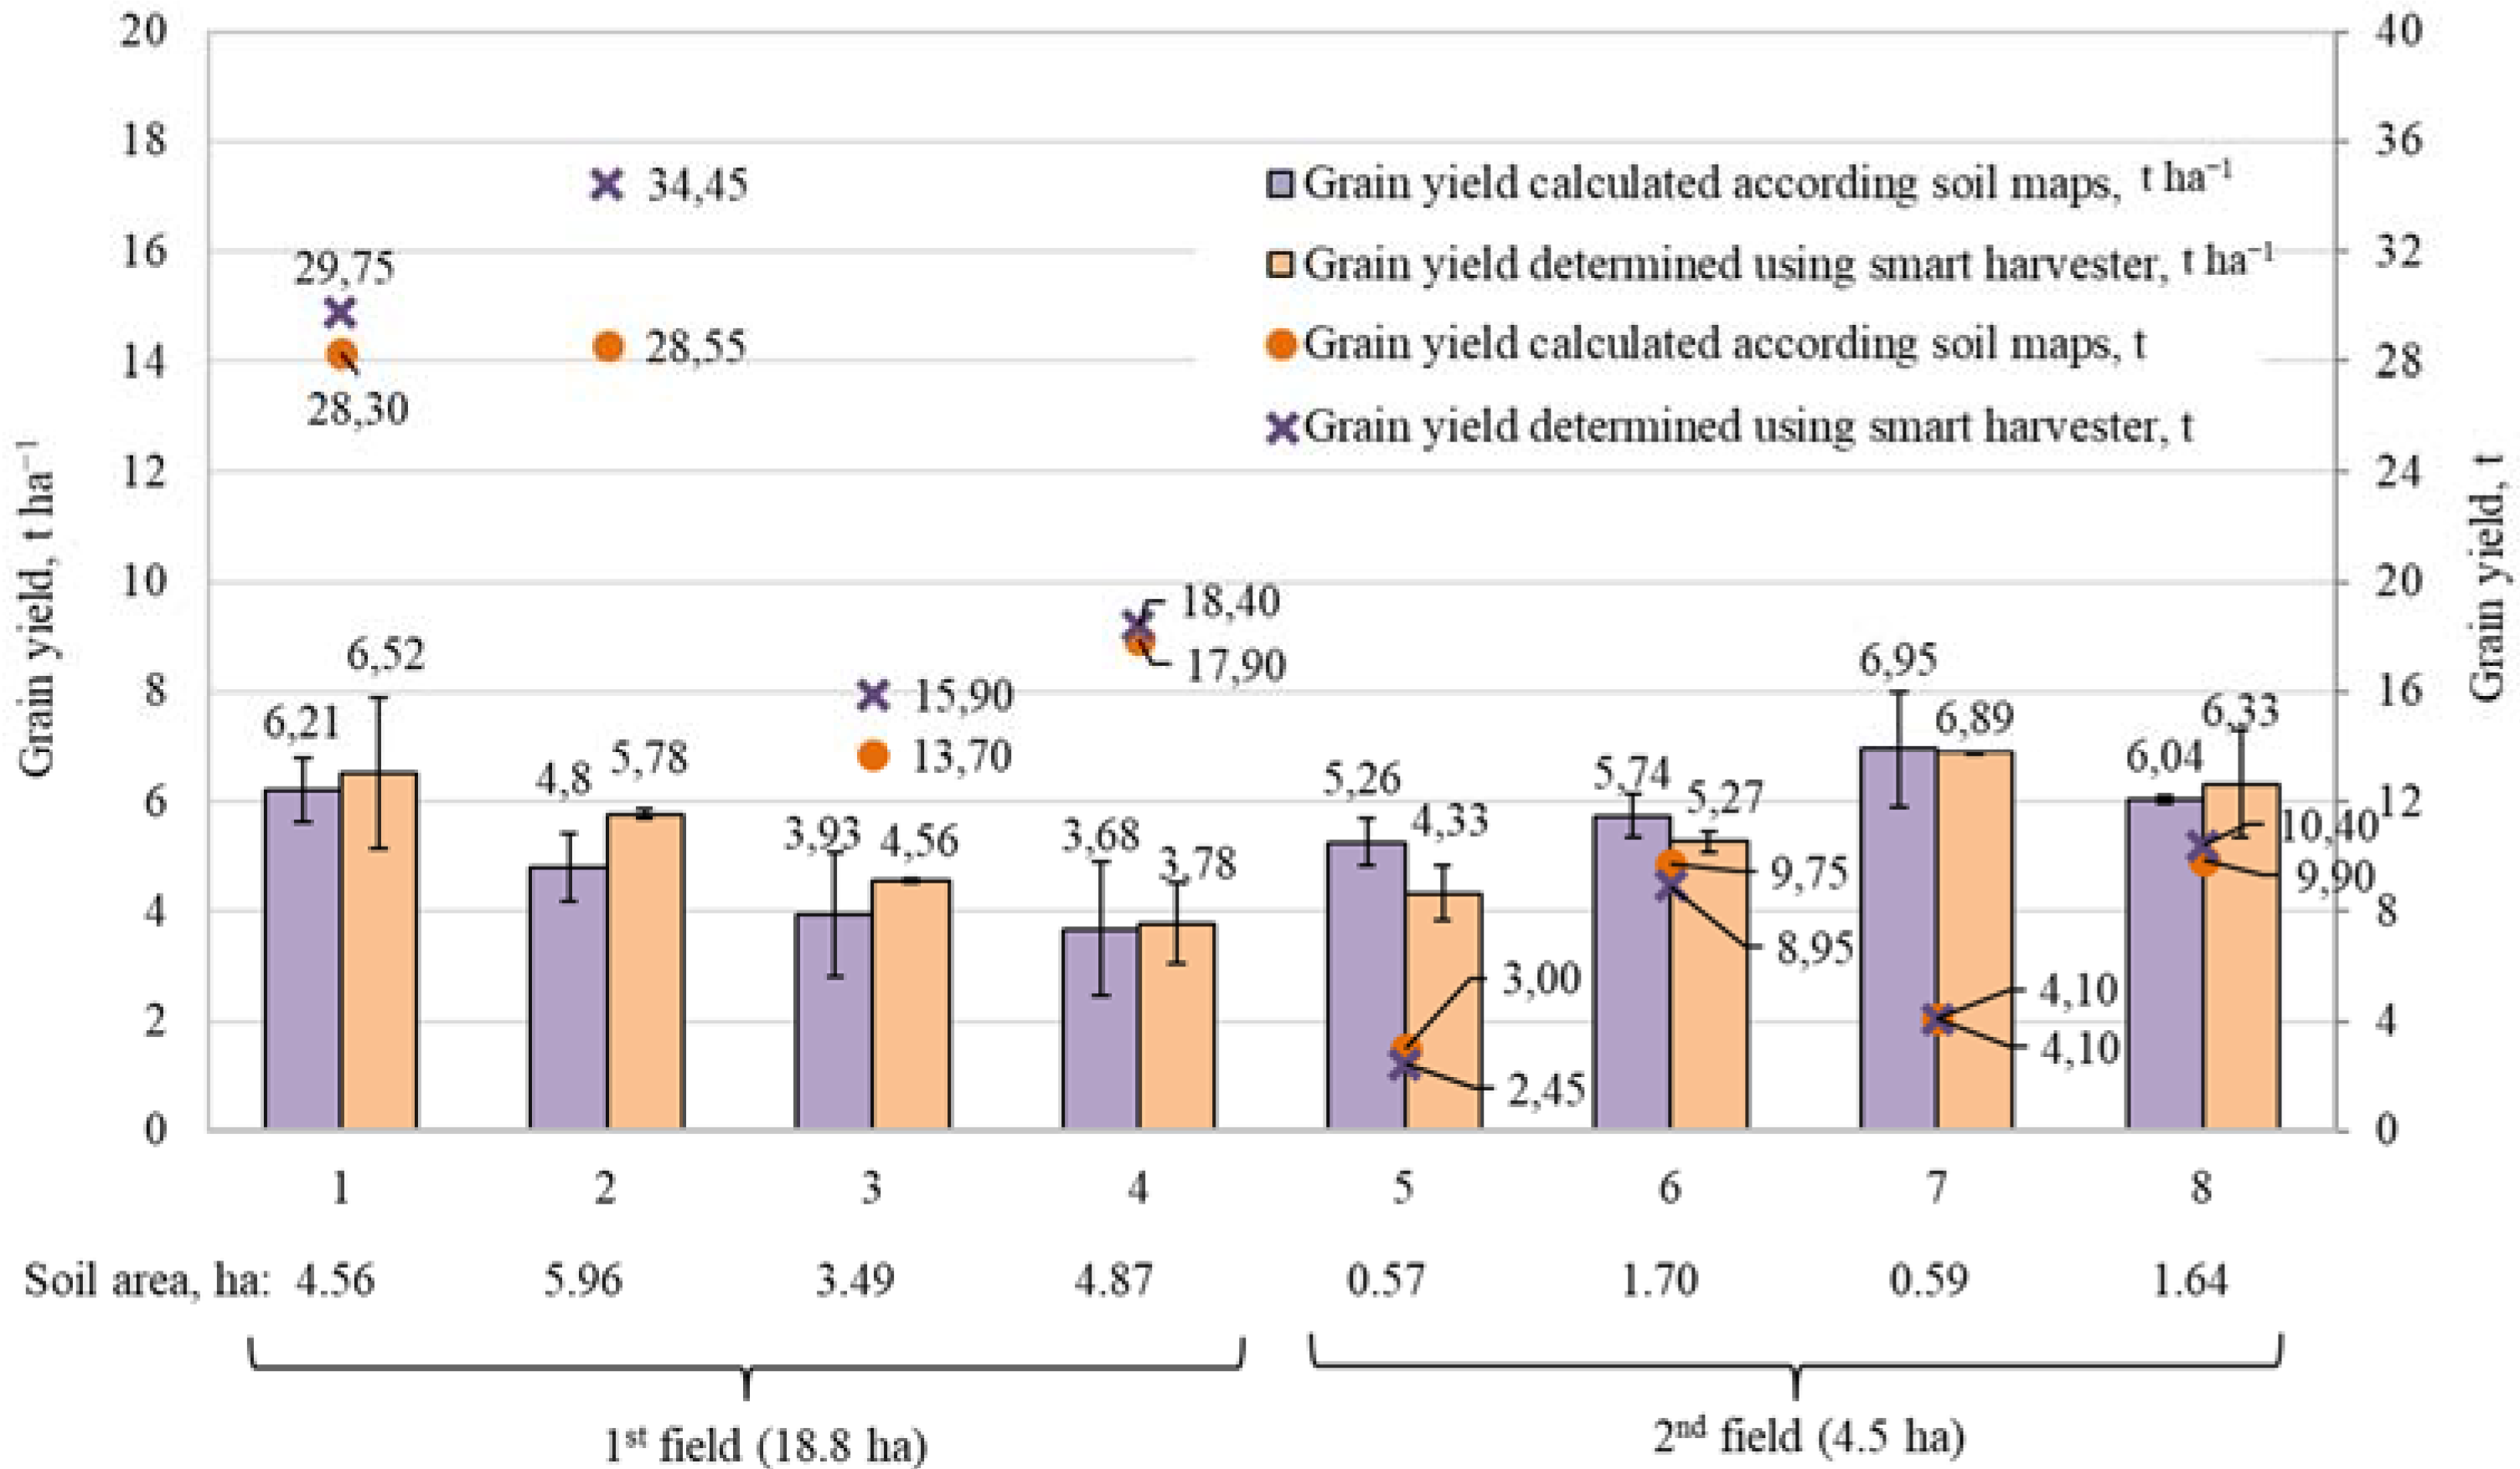
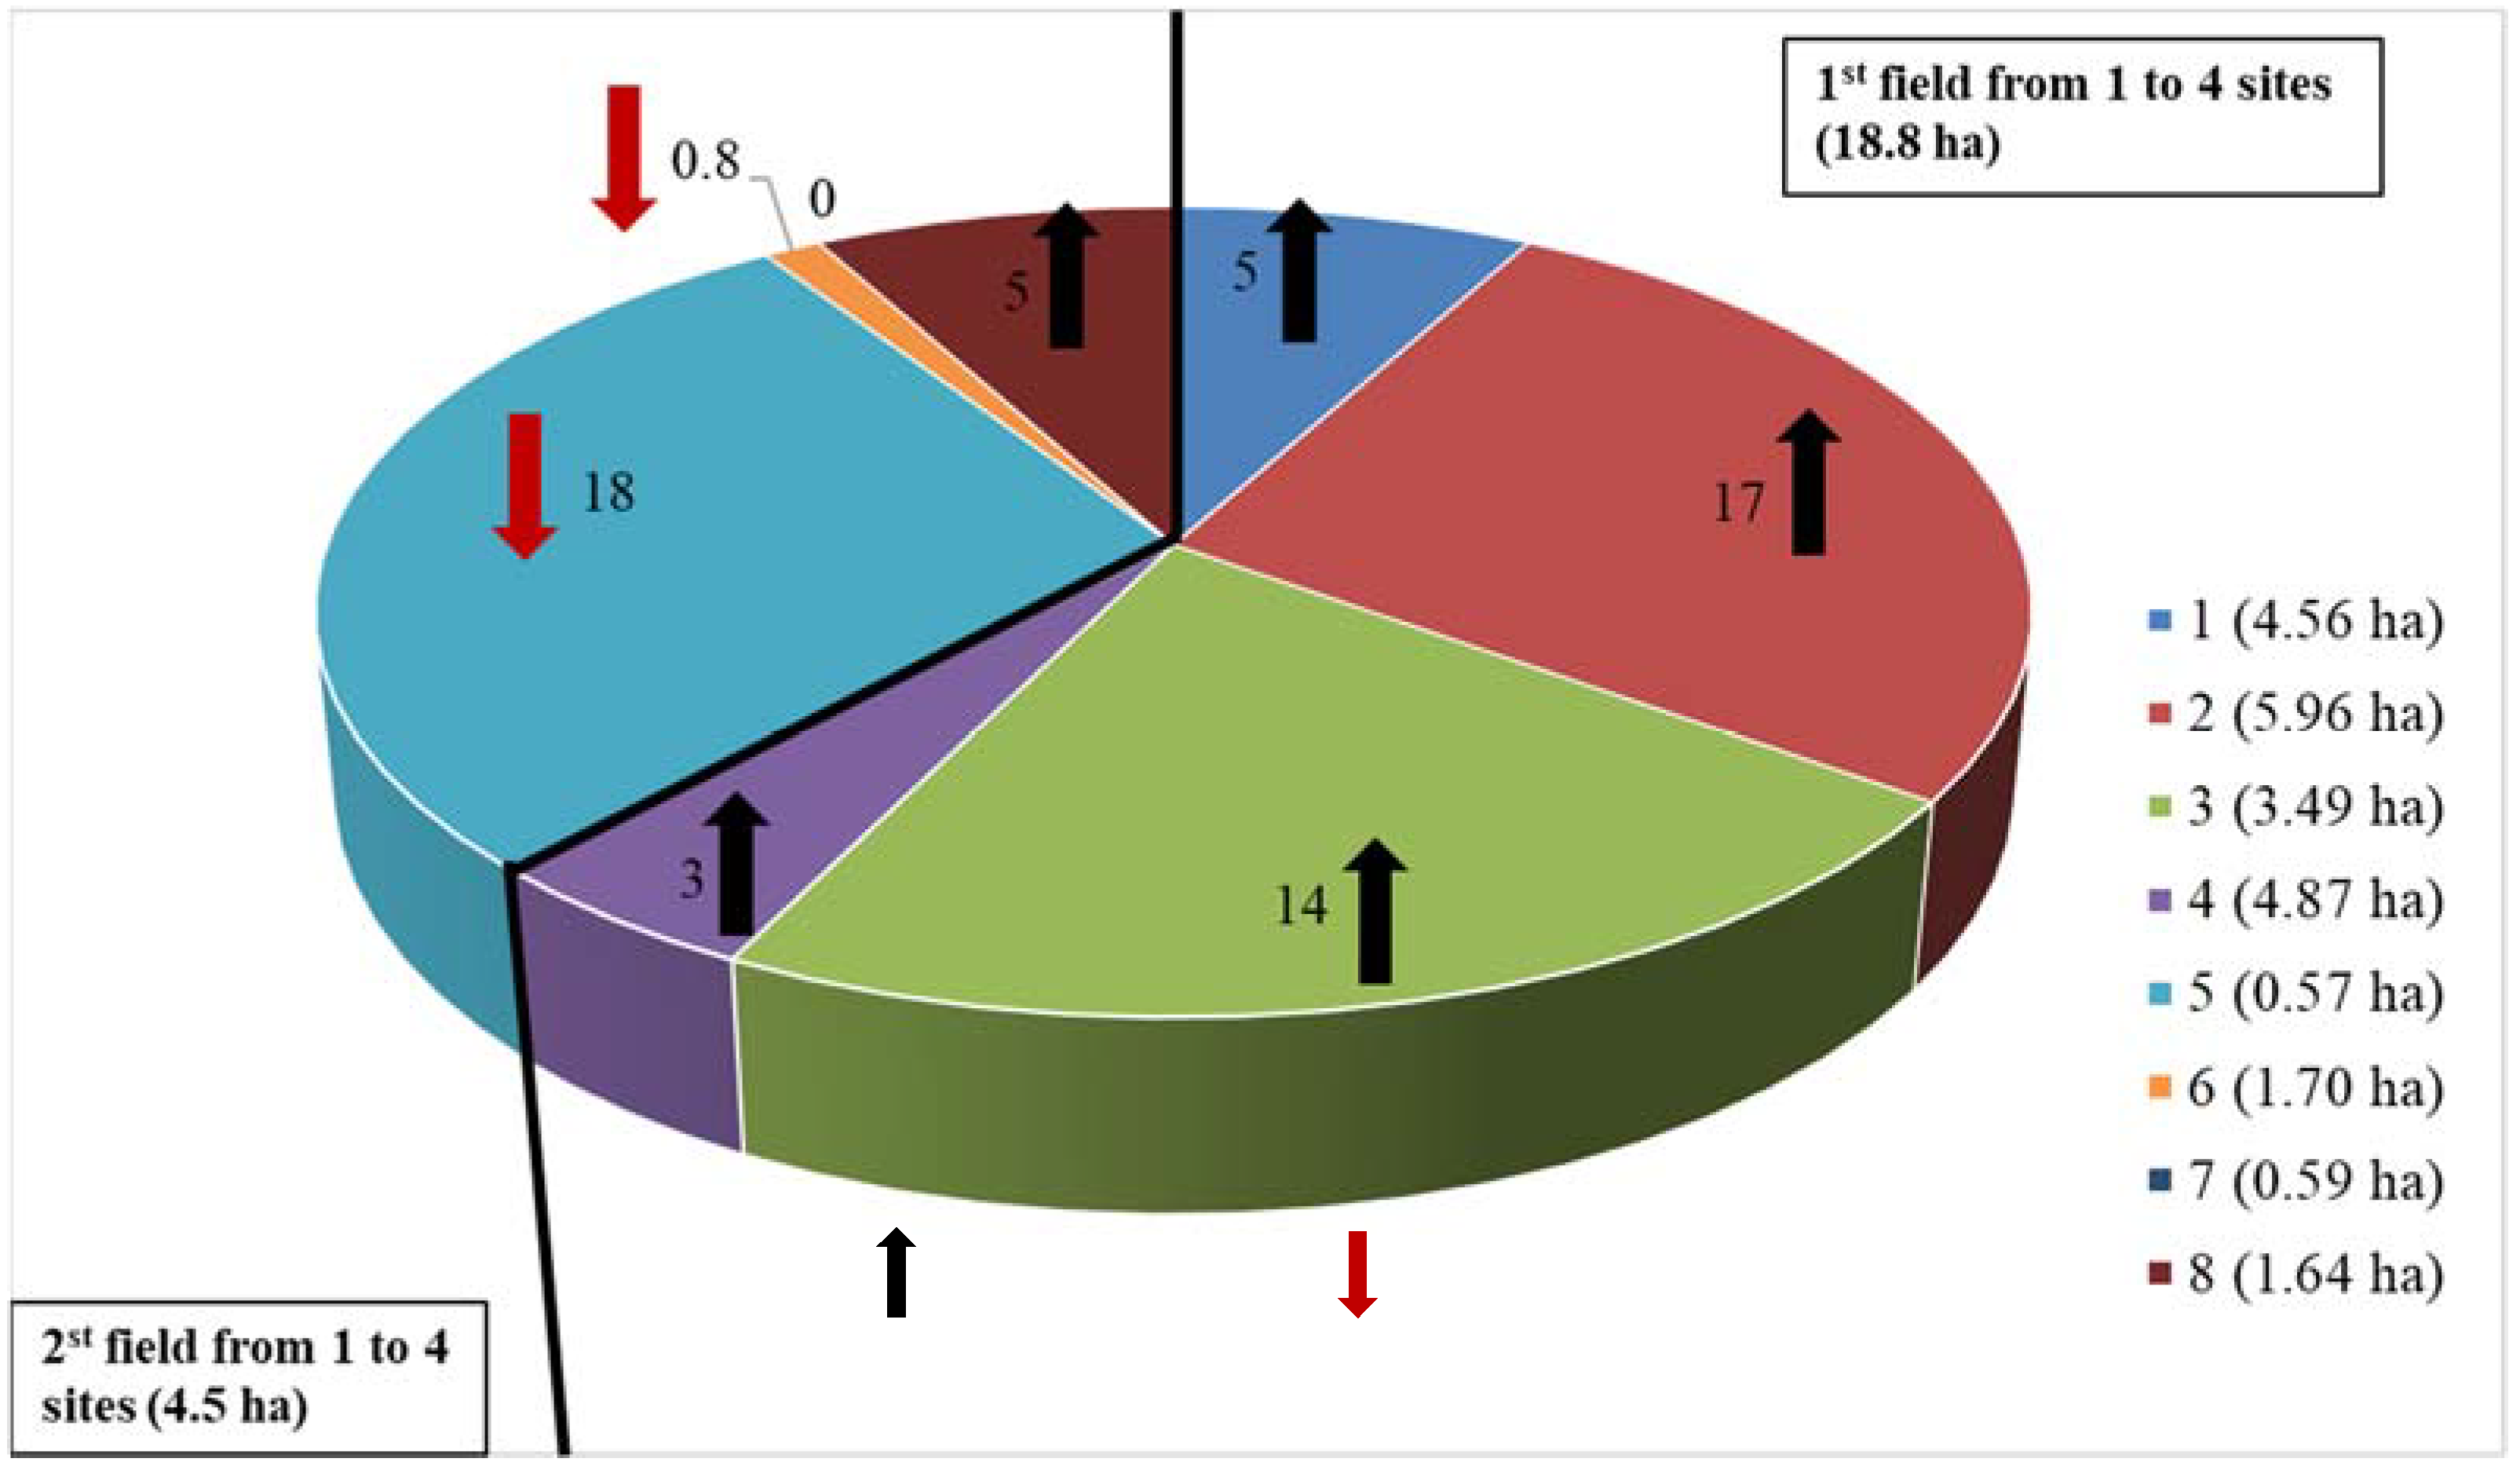
3.2. Productivity of Winter Wheat of Variety Skagen

In the first field, the number of stems ranged from 216 to 382 units m−2, and in the second from 317.75 to 380.50 units m−2 (Figure 3a). The second field had smaller differences in the number of stems. In both the first field and the second, the number of stems in the soil of Haplic Luvisols (fields 1, 7, and 8) was similar (about 372 units m−2). The minimum number of stems (216 units m−2) was found in the first field in the soil Eutric Gleysols. This was significantly less (156 units m−2) compared to the field where the maximum number of stems was found. Plant height ranged from 48 cm (Haplic Arenosols in the soil) to 76.5 cm (Haplic Luvisols in the soil) in the first field. In the second field, the height of the plants varied from 64 cm (Haplic Luvisols in the soil) to 77.75 cm (Haplic Luvisols in the soil). The highest number of stems was found in both the first field and the second field in the soil Haplic Luvisols (fields 1 and 8). In field no. 3 soil (Eutric Gleysols) of first field was slightly soaked during winter in 2019, resulting in plants being less lush. Meanwhile, in the Haplic Arenosols soil (field no. 4), the dry weather in summer had the strongest negative impact on winter wheat of variety Skagen—plant height and 1000-grain weight were lower (Figure 3b), and, in the end, so was the grain yield.
In the first field, the yield of variety Skagen winter wheat varied widely from 3.68 to 6.21 t ha−1 according to the first method (grain yield calculated according to soil maps), and from 3.78 to 6.52 t ha−1 according to the second method (grain yield determined using combine harvester with telemetry functions) (Figure 4). In the second field, the yield of variety Skagen winter wheat varied, respectively, from 5.26 to 6.95 t ha−1, and from 4.33 to 6.89 t ha−1. Significantly higher grain yields were obtained in Haplic Luvisol (fields 1, 2, 7, and 8) soil applying both methods, where, according to the first method, in the first and the second fields, yields were 6.21 and 4.80 t ha−1, and in the seventh and the eighth fields 6.95 and 6.04 t ha−1, respectively, according to the second method yields were 6.52 t ha−1, 5.78 t ha−1, 6.89 t ha−1, and 6.33 t ha−1. While in Eutric Gleysols (field no. 3) and Haplic Arenosols (field no. 4) soils yields were only 3.93 and 3.68 t ha−1, and 4.56 t ha−1 and 3.78 t ha−1, respectively. The grain yield in Eutric Gleysols soil was lower due to higher waterlogging in the lower places than in other outdoor areas in winter months and early spring, especially in the winter of 2018–2019. Experimental research has shown that harvesting with a combine harvester with telemetry functions has, in almost all cases, established an increase in grain yield compared with grain yield obtained from samples collected from fields broken down according to soil maps.
When determining the grain yield with the combine harvester with telemetry functions, an increase in grain yield was observed in all fields in the first field and two fields in the second field compared to the yield obtained by collecting samples using soil maps and sample calculations (Figure 5). The biggest increase (17%) in grain yield was found in the first field at the second field. Yield decreases were observed in the fifth and sixth fields of the second field. The same yield content was found at seventh field. Because the soil cover on the fields was uneven, the yield estimation in both digitized ways was good.
Modern digital technologies make it possible to determine the impact of field area unevenness on crop yields. This allows the selection of measures to increase the yield in the field where it is lowest (Figure 1). This is especially important for organic farms. In our study, the yield unevenness of organically grown winter wheat field was determined using two digital technologies—online digital soil cover maps, installation of monitoring fields in predominant soils, and a smart combine harvester with telemetry functions. Although both digital technologies reflected the unevenness of the yields and correlation between them well, only the information on the field soil cover allowed better explanation of the reasons for lower yields. In the case of our research, these were sand inclusions interspersed in winter wheat fields and lower places where plants were soaked during winter. Our research is related to other scientific works, investigating whether unevenness of crop yields on the field can be estimated with a smart combine harvester with telemetry functions or digital soil cover maps [1,8].
The results of other researchers suggest that digital image analysis is a viable alternative method for real-time estimation of terrestrial biomass and prediction of yield and grain quality parameters. The digital area outperformed other numerical biomass prediction variables compared to drought stress, but altitude and ferret diameter correlated better with yield and grain quality parameters. Based on these results, we suggest that a combination of different vision-based approaches could improve the performance assessment of wheat in a non-destructive and real-time manner [8,24].
Wheat growing regions and seasons are different, so different cultivation practices and management practices are needed. For example, the wheat growing season in the eastern United States lasts up to nine months in changing environments, highlighting the importance of variety and management. Therefore, one of the targets in improving grain yield is nitrogen management [25]. To coordinate the relationship between grain yield, quality, water productivity, and wheat production in regions like China’s Loes Plateau, a plastic-covered ridge and furrow planting system with 1200 m3 ha−1 irrigation suitable for sustainable fertile wheat cultivation was used. When at 0, 400, 1200, and 2000 m3 ha−1 irrigation levels, the grain yield resulting from plastic-covered ridge and furrow planting was 51.7%, 64.8%, 25.5%, and 5.84% higher compared to traditional flatbed planting [26]. This is why yield data from high quality combines are very important for yield mapping. The data sources that could be used to improve yield maps derived from combine data are satellite data (e.g., Sentinel 2 (S2) imagery) and unmanned aerial vehicle (UAV) data, which are commonly used to predict and define grain yields after evaluating the yield data from the combine, the multispectral camera, and the S2 images to obtain more accurate yield maps. To calibrate and validate this method, biomass samples were taken manually prior to harvesting and erroneous harvest data were replaced with remote-monitoring data [27]. With the advancement of multi-spectral cameras mounted on unmanned aerial vehicles and machine-learning methods, crop prediction systems can be more accurately developed using machine-learning methods. Therefore, we can compare performance for predicting wheat grain yield and protein content between machine-learning algorithms based on spectral reflection and plant height (e.g., random forest and artificial neural network) and traditional linear regression based on vegetation indices. Machine-learning methods have great potential for prediction of protein content [28].
These studies are useful in achieving the goals of the European Green Course by contributing to the farm-to-table, Biodiversity 2030, and Zero Pollution strategies that require mutually beneficial solutions at the farm and territorial level to reduce air, water, and soil pollution and biodiversity loss.

4. Conclusions

Using a digitized dataset of soil maps, two fields were broken down into different fields according to soil texture. Significant amounts of mobile phosphorus were found—from medium or high—as the soil had been fertilized with bird manure for few years. The soil pH was close to neutral.
Crude protein of winter wheat grains was significantly different in the first field and varied from 9.70 to 13.34%. The crude protein content in the second field was similar and varied from 10.71 to 10.91%. In the sandy areas of Haplic Arenosols and in the lower parts of the field, where Eutric Gleysols, intervened in predominant Haplic Luvisols soils, winter wheat crude protein content and grain yield were lower.
The biggest grain yield was obtained in Haplic Luvisols soils and varied from 4.8 to 6.52 t ha−1 in the first field, and from 6.04 to 6.95 t ha−1 in the second field. Experimental research has established that harvesting with a combine harvester with telemetry functions in Haplic Luvisols soils showed a slightly bigger or similar yield compared to grain yield obtained from samples collected from fields broken down according soil maps. Both digital technologies reflected the yields well but the information on the field soil cover allowed better explanation of the reasons for lower yields. In the future, application of the digital technologies will be beneficial in accurately determining yield and justifying its variation and in addressing changes in yields due to the improvement of low-performance soils.
The complex use of the technologies (soil maps and combine harvester with telemetry functions) allows time to be saved and the reasons for the harvest changes, which can increase farm incomes and reduce costs, to be efficiently identified. Moreover, the complex use of the technologies can be utilized at the national level to prepare strategies to maintain and restore land productivity.

Author Contributions

Conceptualization, P.A. and G.S.; methodology, G.S.; software, P.A.; validation, P.A. and G.S.; formal analysis, P.A. and G.S.; investigation, P.A. writing—original draft preparation, P.A. and G.S.; writing—review and editing, P.A. and G.S.; visualization, P.A. and G.S. All authors have read and agreed to the published version of the manuscript.

Funding

This research received no external funding.

Institutional Review Board Statement

Not applicable.

Informed Consent Statement

Not applicable.

Conflicts of Interest

The authors declare no conflict of interest.

References

  1. Baltrėnaitė, E.; Baltrėnas, P.; Lietuvninkas, A. Biogeochemical Aspect of Metal Uptake by Trees. In The Sustainable Role of the Tree in Environmental Protection Technologies; Springer: Cham, Switzerland, 2016; pp. 81–126. [Google Scholar]
  2. Budnakova, M.; Čermak, P. Fertilising recommendation system based on results of agrochemical soil testing. Fertil. Fertil. 2009, 37, 149–159. [Google Scholar]
  3. Abdulhakim, M.A.; Romain, C.; William, S.H.; Zhanzhang, C.; Niklas, B.O.; Henrik, G.S.; Lars, E.; Johan, E. Biodiversity decline with increasing crop productivity in agricultural fields revealed by satellite remote sensing. Ecol. Indic. 2021, 130, 108098. [Google Scholar]
  4. Mažvila, J.; Staugaitis, G.; Adomaitis, T.; Arbačiauskas, J.; Vaišvila, Z.; Šumskis, D. Agrochemical properties of Lithuanian soils and their changes after regaining independence. Žemės Ūkio Moksl. 2008, 15, 13–21. [Google Scholar]
  5. Tripolskaja, L.; Mašauskas, V.; Adomaitis, T.; Karčiauskienė, D.; Vaišvila, Z. Managment of Agroecosystem Components; Lithuanian Research Centre for Agriculture and Forestry: Kaunas, Lithuania, 2010; p. 568. (In Lithuanian) [Google Scholar]
  6. Toigildin, A.; Kulikov, Y.; Toigildina, I.; Aypov, D.; Nikiforova, S.; Ibragimova, C. Geographic Information Systems in Forecasting the Winter Wheat Yield. In XIV International Scientific Conference “Interagromash 2021"; Springer: Cham, Switzerland, 2021; pp. 322–329. [Google Scholar]
  7. Besaliev, I.N.; Bolodurina, I.P.; Parfenov, D.I.; Akimov, S.S. Development of a digital model for assessing the influence of agroecological factors on the productivity of wheat grains. In IOP Conference Series: Earth and Environmental Science; IOP Publishing: Bristol, UK, 2021; Volume 624, p. 012214. [Google Scholar]
  8. Staugaitis, G.; Šumskis, D. Spatial variability of pH as influenced by different soil sampling methods and geostatistical techniques. Žemdirbystė 2011, 98, 323–332. [Google Scholar]
  9. Staugaitis, G.; Vaišvila, Z. Soil Agrochemical Research; Lithuanian Research Centre for Agriculture and Forestry: Kaunas, Lithuania, 2019; p. 111. (In Lithuanian) [Google Scholar]
  10. Schut, A.G.T.; Traore, P.C.S.; Blaes, X.; de By, R.A. Assessing yield and fertilizer response in heterogeneous smallholder fields with UAVs and satellites. Field Crops Res. 2018, 221, 98–107. [Google Scholar] [CrossRef]
  11. Rasmussen, J.; Ntakos, G.; Nielsen, J.; Svensgaard, J.; Poulsen, R.N.; Christensen, S. Are vegetation indices derived from consumer-grade cameras mounted on UAVs sufficiently reliable for assessing experimental plots? Eur. J. Agron. 2015, 74, 75–92. [Google Scholar] [CrossRef]
  12. Wang, Y.; Zhang, Z.; Feng, L.; Du, Q.; Runge, T. Combining multi-source data and machine learning approaches to predict winter wheat yield in the conterminous united states. Remote Sens. 2020, 12, 1232. [Google Scholar] [CrossRef] [Green Version]
  13. Taghizadeh-Mehrjardi, R.; Nabiollahi, K.; Rasoli, L.; Kerry, R.; Scholten, T. Land suitability assessment and agricultural production sustainability using machine learning models. Agronomy 2020, 10, 573. [Google Scholar] [CrossRef]
  14. Ajami, M.; Heidari, A.; Khormali, F.; Zeraatpisheh, M.; Gorji, M.; Ayoubi, S. Spatial variability of rainfed wheat production under the influence of topography and soil properties in loess-derived soils, northern Iran. Int. J. Plant Prod. 2020, 14, 597–608. [Google Scholar] [CrossRef]
  15. Koroleva, P.; Dolinina, E.; Rukhovich, A. Comparative analysis of the yield map obtained from the John Deere combine and the ASF-index distribution map. Int. Multidiscip. Sci. GeoConference SGEM 2020, 20, 191–198. [Google Scholar]
  16. Kulyanitsa, A.L.; Rukhovich, D.I.; Koroleva, P.V.; Vilchevskaya, Y.V.; Kalinina, N.V. Analysis of the Informativity of Big Satellite Precision-Farming Data Processing for Correcting Large-Scale Soil Maps. Eurasian Soil Sci. 2020, 53, 1709–1725. [Google Scholar] [CrossRef]
  17. Nabiollahi, K.; Heshmat, E.; Mosavi, A.; Kerry, R.; Zeraatpisheh, M.; Taghizadeh-Mehrjardi, R. Assessing the influence of soil quality on rainfed wheat yield. Agriculture 2020, 10, 469. [Google Scholar] [CrossRef]
  18. Kayad, A.; Sozzi, M.; Gatto, S.; Whelan, B.; Sartori, L.; Marinello, F. Ten years of corn yield dynamics at field scale under digital agriculture solutions: A case study from North Italy. Comput. Electron. Agric. 2021, 185, 106126. [Google Scholar] [CrossRef]
  19. Juostas, A.; Jotautiene, E. Evaluation of combine harvester parameters using manual and auto-steering modes. In Proceedings of the Engineering for Rural Development: 20th International Scientific Conference, Jelgava, Latvia, 26–28 May 2021; Latvia University of Life Sciences and Technologies: Jelgava, Latvia, 2021. [Google Scholar]
  20. Řezník, T.; Pavelka, T.; Herman, L.; Lukas, V.; Širůček, P.; Leitgeb, Š.; Leitner, F. Prediction of Yield Productivity Zones from Landsat 8 and Sentinel-2A/B and Their Evaluation Using Farm Machinery Measurements. Remote Sens. 2020, 12, 1917. [Google Scholar] [CrossRef]
  21. Czarnecki, W.M.; Podolak, I.T. Machine learning with known input data uncertainty measure. In Proceedings of the IFIP International Conference on Computer Information Systems and Industrial Management, Krakow, Poland, 25–27 September 2013. [Google Scholar]
  22. Steel, R.G.D.; Torrie, J.H. Principles and Procedures of Statistics. In A Biometrical Approach, 2nd ed.; McGraw-Hill: New York, NY, USA, 1980. [Google Scholar]
  23. Stevens, D.R.; Thompson, B.R.; Johnson, P.; Welten, B.; Meenken, E.; Bryant, J. Integrating Digital Technologies to Aid Grassland Productivity and Sustainability. Front. Sustain. Food Syst. 2021, 5, 99. [Google Scholar] [CrossRef]
  24. Diacono, M.; Trinchera, A.; Montemurro, F. An Overview on Agroecology and Organic Agriculture Strategies for Sustainable Crop Production. Agronomy 2021, 11, 223. [Google Scholar] [CrossRef]
  25. Russell, B.; Guzman, C.; Mohammadi, M. Cultivar, trait and management system selection to improve soft-red winter wheat productivity in the eastern United States. Front. Plant Sci. 2020, 11, 335. [Google Scholar] [CrossRef] [PubMed]
  26. Liu, Y.; Zhang, X.; Xi, L.; Liao, Y.; Han, J. Ridge-furrow planting promotes wheat grain yield and water productivity in the irrigated sub-humid region of China. Agric. Water Manag. 2020, 231, 105935. [Google Scholar] [CrossRef]
  27. Karampoiki, M.; Heiß, A.; Sharipov, G.M.; Mahmood, S.; Todman, L.C.; Murdoch, A.J.; Griepentrog, H.W.; Paraforos, D.S. Producing grain yield maps by merging combine harvester and remote sensing data. In Precision Agriculture’21; Wageningen Academic Publishers: Wageningen, The Netherlands, 2021; pp. 377–402. [Google Scholar]
  28. Zhou, X.; Kono, Y.; Win, A.; Matsui, T.; Tanaka, T.S. Predicting within-field variability in grain yield and protein content of winter wheat using UAV-based multispectral imagery and machine learning approaches. Plant Prod. Sci. 2021, 24, 137–151. [Google Scholar] [CrossRef]
Figure 1. Technological operation research plan. The blue arrows indicate autumn work and the green arrows indicate spring work.
Agriculture 12 00474 g001
Figure 2. Crude protein (%) of Skagen variety winter wheat grains.
Agriculture 12 00474 g002
Figure 3. Productivity indicators of variety Skagen winter wheat grain: (a) number of productive stems and plant height and (b) 1000-grain weight, g.
Agriculture 12 00474 g003aAgriculture 12 00474 g003b
Figure 4. Winter wheat of variety Skagen grain yield in the studied fields obtained according to different methods.
Agriculture 12 00474 g004
Figure 5. Increases and decreases (%) of grain yield in different fields determined with the combine harvester with telemetry functions comparing with calculated according to soil maps.
Agriculture 12 00474 g005
Table 1. Soil texture of the field areas evaluated.
Field
No.
Field Area, haSoil (FAO)Soil Texture:
Topsoil/Subsoil
First field
14.56Haplic LuvisolsSilt loam/silt loam
25.96Haplic LuvisolsSilt loam/silt loam
33.49Eutric GleysolsSandy loam/sandy loam
44.87Haplic ArenosolsSandy loam/sand
18.8
Second field
50.57Eutric GleysolsSandy loam/sandy loam
61.70Eutric PlanosolsSandy loam/sandy loam/silty clay loam
70.59Haplic LuvisolsSandy loam/loam
81.64Haplic LuvisolsSandy loam/loam
4.5
Table 2. Meteorological conditions during winter wheat growth. Meteorological data were obtained from the Elektrėnai Meteorological Station (54°47′10″ N; 24°41′23″ E).
IndicatorsMonths
091011120102030405060708
Monthly Average Daily Temperature, °C
2018–201915.28.92.7−1.1−4.21.13.49.213.521.217.318.5
2019–202013.39.65.02.52.22.23.87.010.819.618.118.9
SCN *13.97.83.70.1−3.6−2.11.88.014.018.118.818.5
Monthly Precipitation, mm
2018–20192227.612.440.531.320.631.30.110.725.544.356.4
2019–202040.53732.822.338.639.5216.460.179.454.76.8
SCN *45.444.841.844.739.629.627.533.150.751.2100.474.3
* SCN—standard climate norm in 2010–2020.
Table 3. Assessment of soil pH, P2O5, and K2O, and humus dynamic dependence on different soil textures.
Field
No.
Field Area, haSoil (FAO)Soil Texture:
Topsoil/Subsoil
pHKClAvailable P2O5, mg kg−1Available K2O, mg kg−1Humus %
First field
14.56Haplic LuvisolsSilt loam/silt loam7.05794.5216.02.46
25.96Haplic LuvisolsSilt loam/silt loam6.60385.0175.02.09
33.49Eutric GleysolsSandy loam/sandy loam6.85487.0161.02.32
44.87Haplic ArenosolsSandy loam/sand6.50659.0287.52.18
x/median6.75/6.73683.7/573.0220.1/216.02.26/2.25
min/max6.05/7.05385.0/1204.0161.0/287.52.09/2.46
σ/CV, %0.25/3.68364.80/53.3561.51/27.940.16/7.27
Second field
50.57Eutric GleysolsSandy loam/sandy loam6.70707.0210.52.97
61.70Eutric PlanosolsSandy loam/sandy loam/silty clay loam6.85790.5181.03.44
70.59Haplic LuvisolsSandy loam/loam6.60635.0175.02.16
81.64Haplic LuvisolsSandy loam/loam6.95715.7167.51.94
x/median6.78/6.78732.2/748.7181.6/178.22.63/2.56
min/max6.60/6.95635.0/796.5159.5/178.21.94/3.44
σ/CV, %0.16/2.2976.63/10.4621.30/11.730.70/26.76
Publisher’s Note: MDPI stays neutral with regard to jurisdictional claims in published maps and institutional affiliations.

