
Feasibility of Near-Infrared Spectroscopy for Rapid Detection of Available Nitrogen in Vermiculite Substrates in Desert Facility Agriculture

 ,
,
Abstract
:1. Introduction
2. Materials and Methods
2.1. Experimental Materials
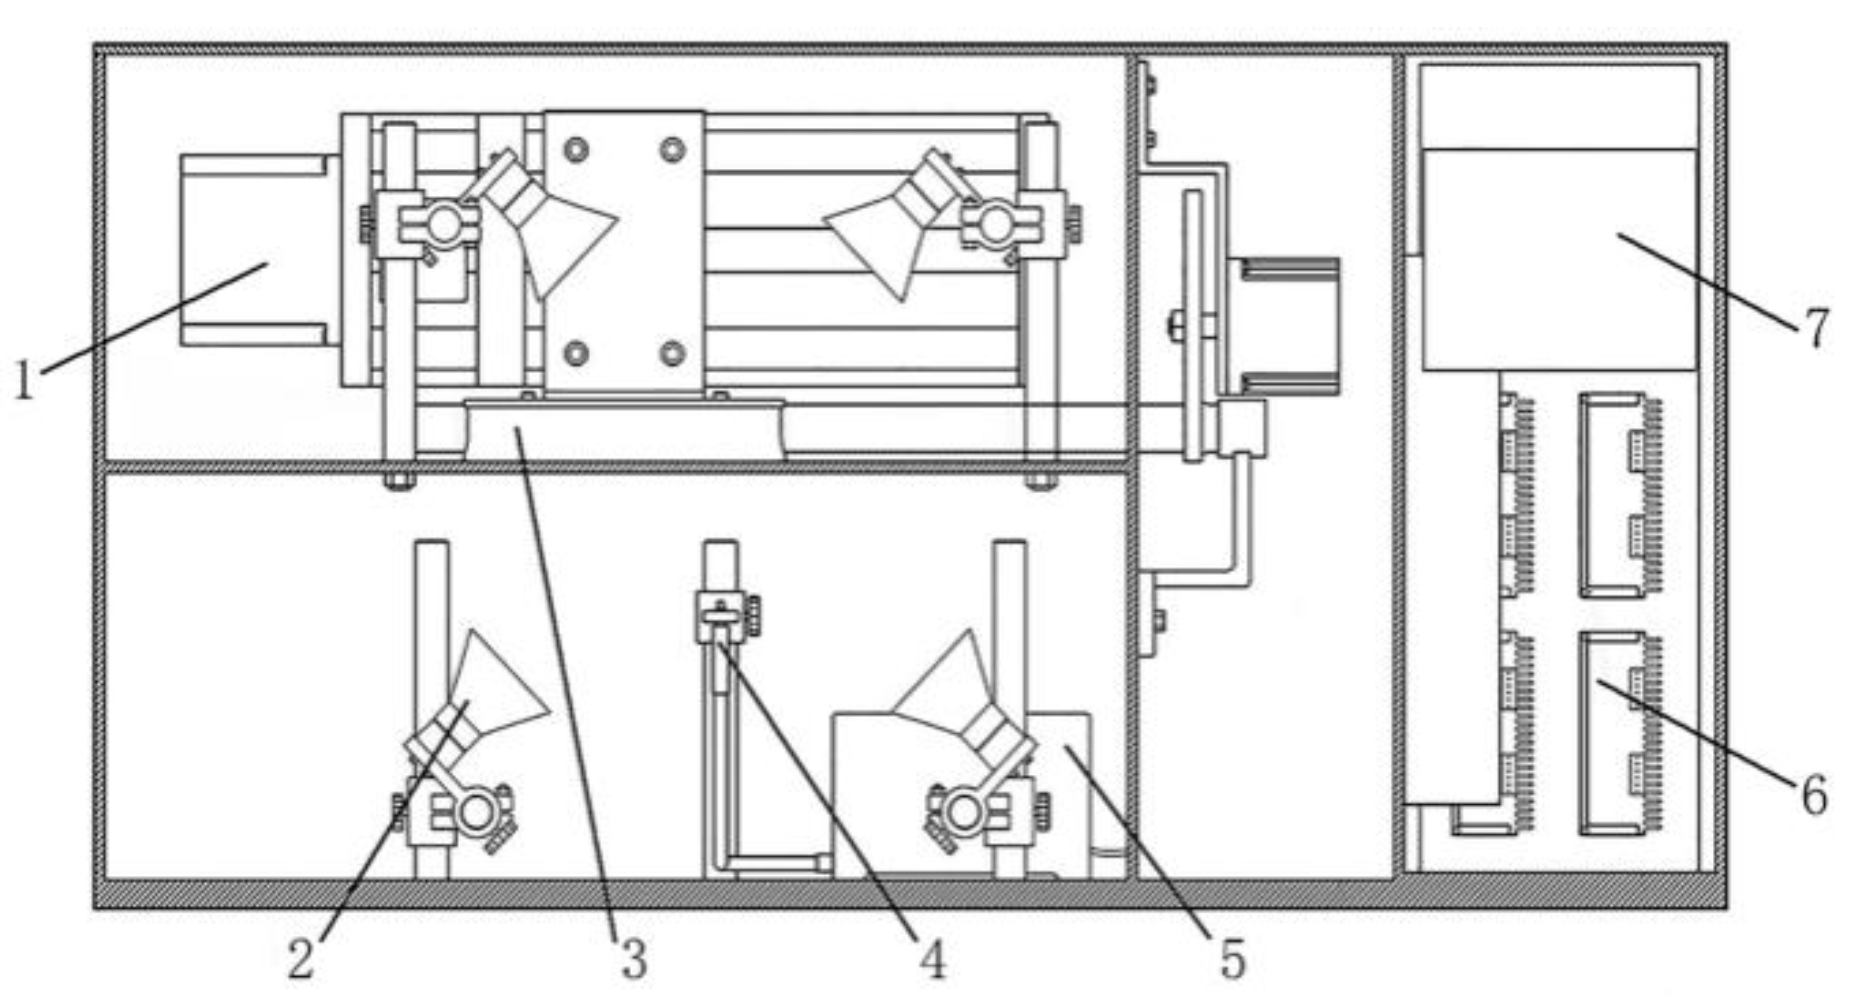
2.2. NIR Spectrum Measurement System and Spectral Data Acquisition
2.3. Laboratory Chemical Measurements
2.4. Spectral Preprocessing
2.5. Establishment and Evaluation of the Spectral Prediction Model
3. Results and Discussion
3.1. Grouping Statistics of the Available Nitrogen Content of Vermiculite
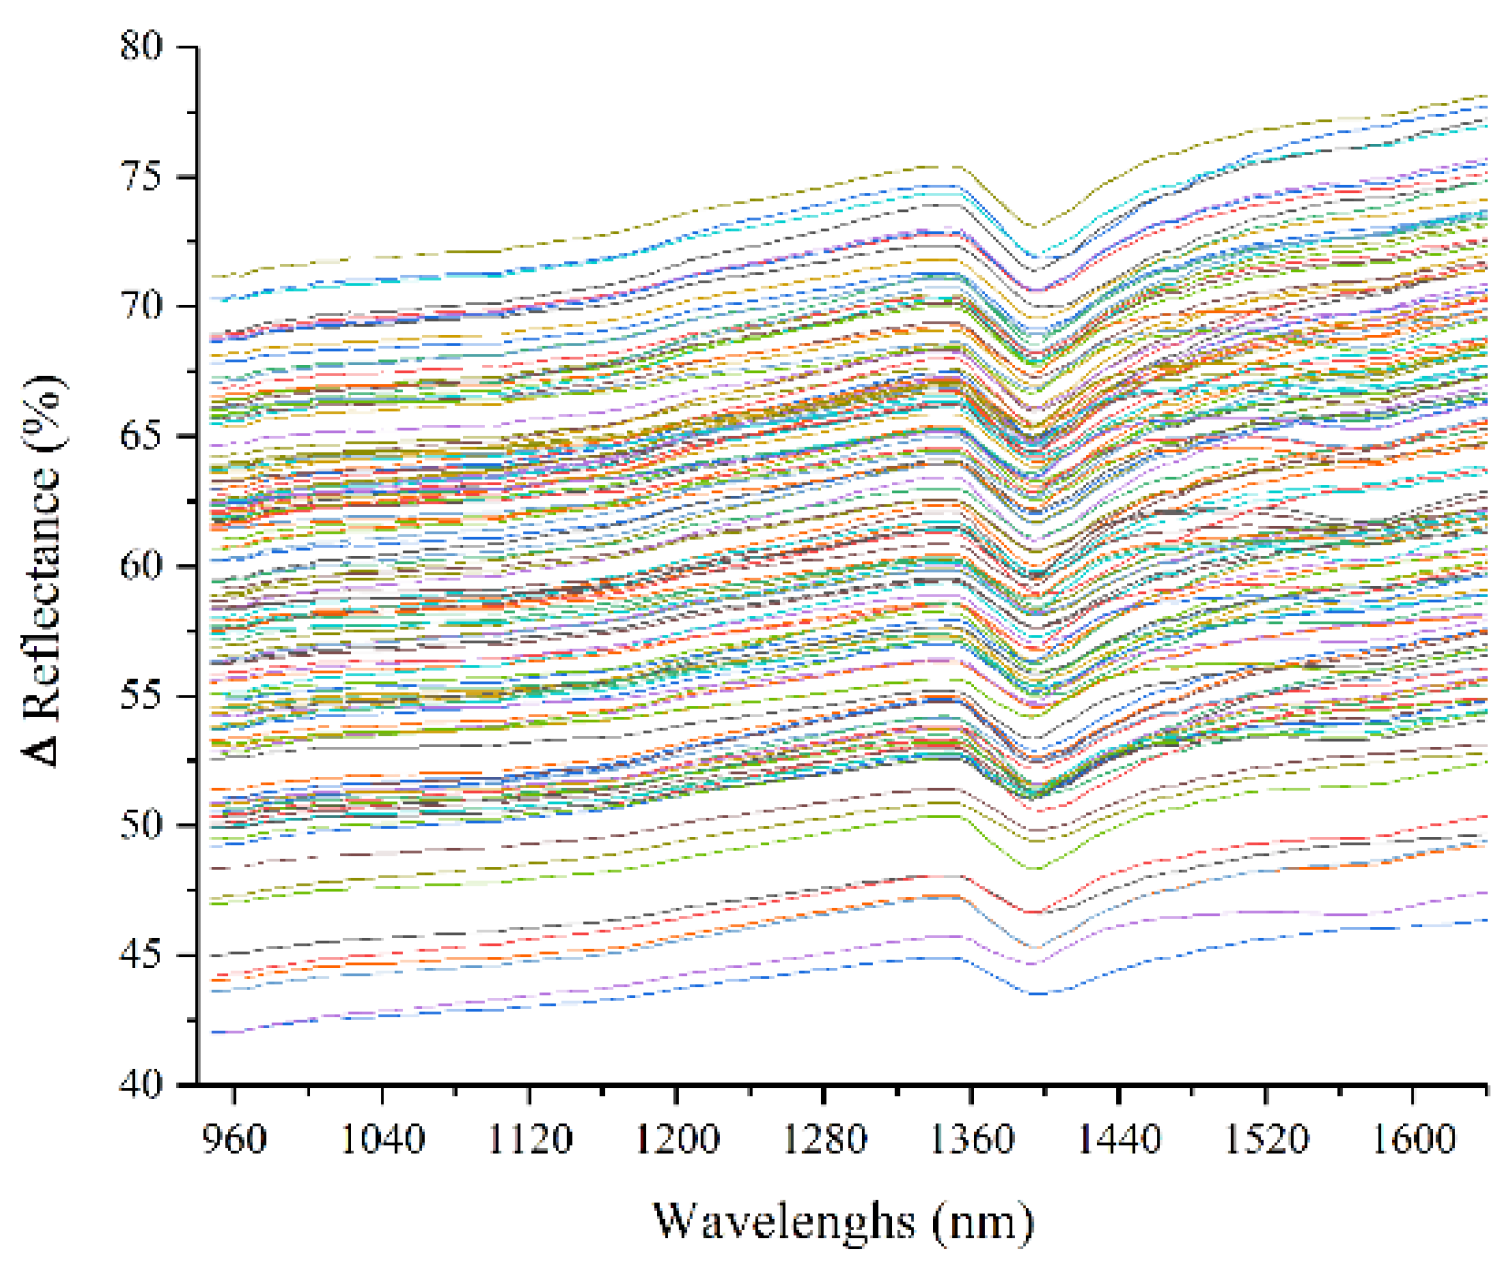
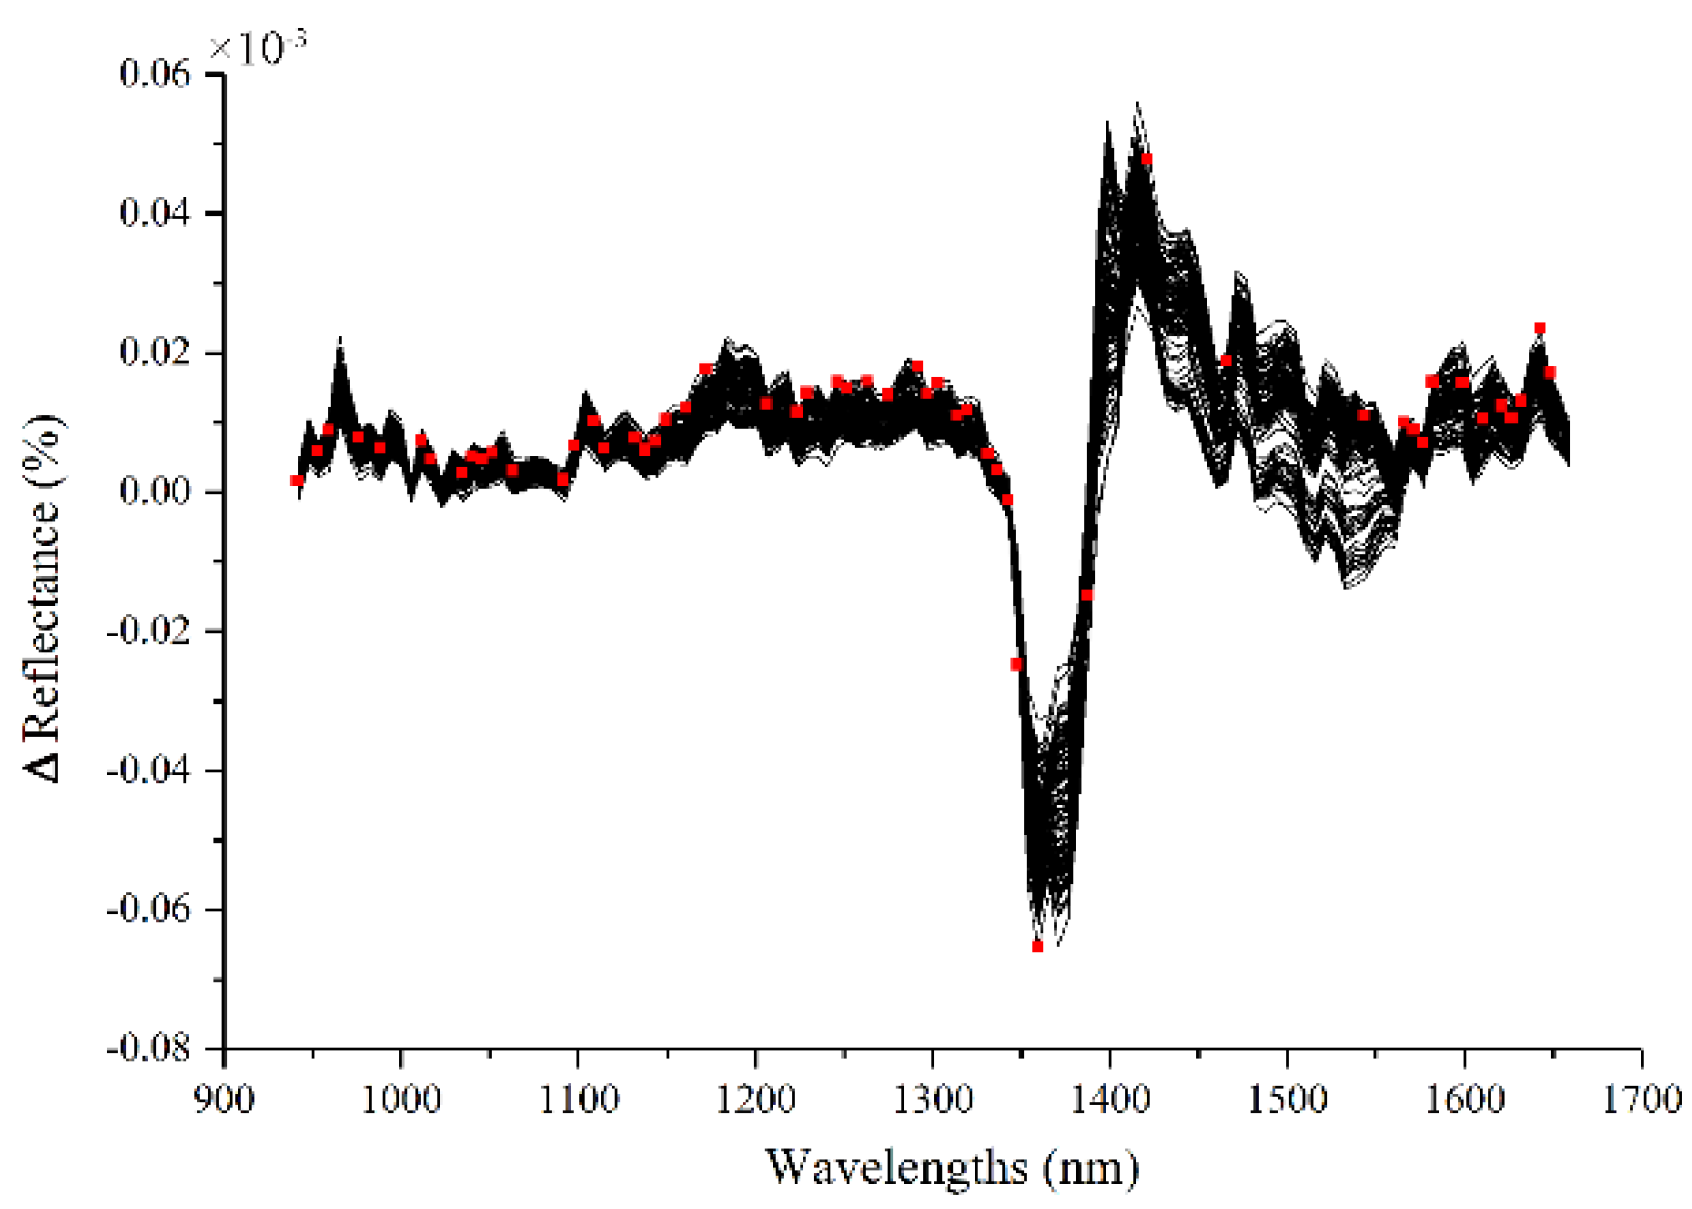
3.2. Analysis of the Spectral Data of Vermiculite
3.3. NIR Spectroscopy of Available Nitrogen Content Based on All-Band Spectral Data of Vermiculite Substrates
3.4. Spectroscopic Measurement and Analysis of the Available Nitrogen Content of the Vermiculite Substrate Based on SPA-Screened Characteristic Wavelengths
3.5. Spectroscopic Measurement and Analysis of the Available Nitrogen Content of the Vermiculite Substrate Based on CARS-Screened Characteristic Wavelengths
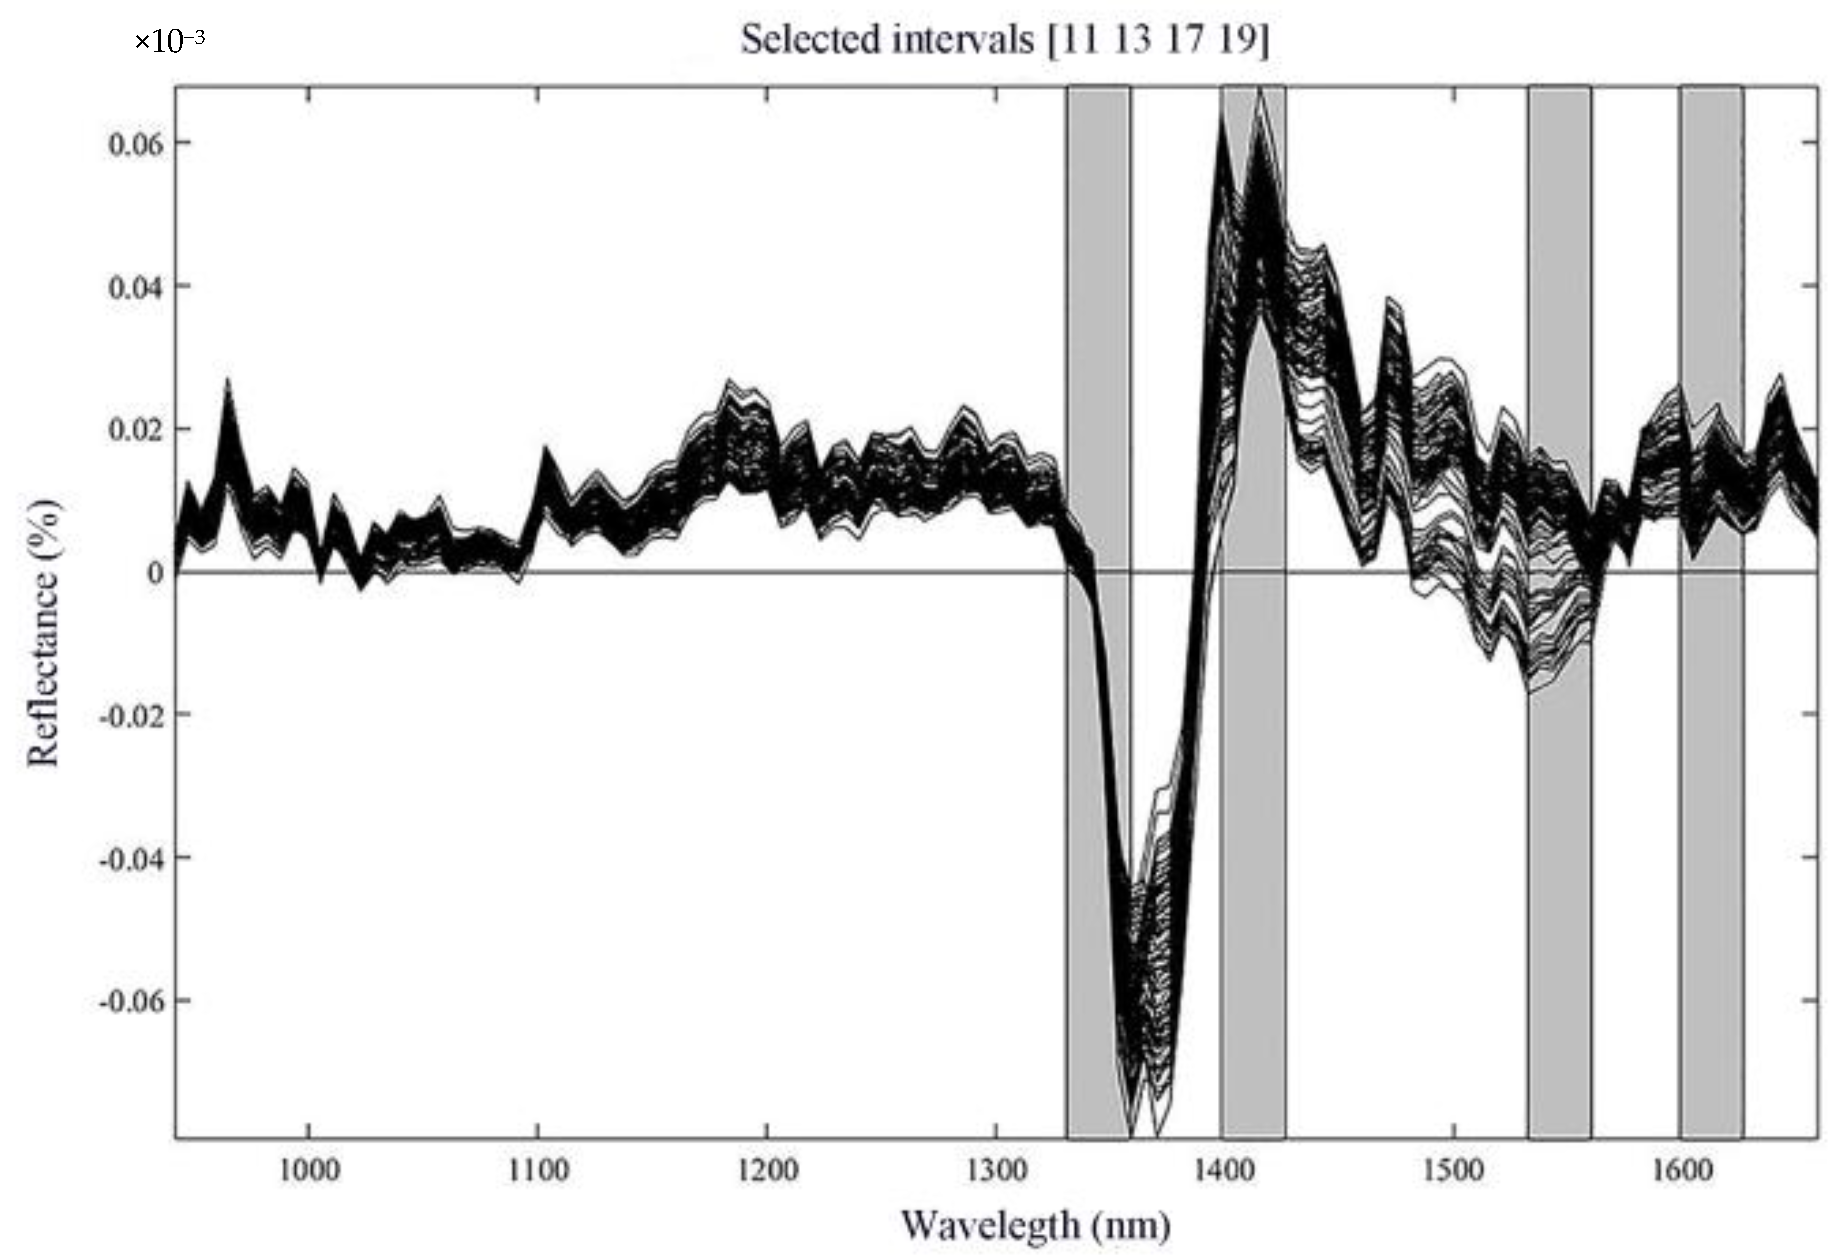
3.6. Spectroscopic Measurement and Analysis of the Available Nitrogen Content of the Vermiculite Substrate Based on Si-PLS-Screened Characteristic Wavelengths
3.7. Prediction Model Performance for the Available Nitrogen Content of Vermiculite Substrates Based on All-Band Spectral Data and Characteristic Variables
4. Conclusions
Author Contributions
Funding
Institutional Review Board Statement
Informed Consent Statement
Data Availability Statement
Acknowledgments
Conflicts of Interest
References
- Yin, H.Y.; Cao, Y.T.; Marelli, B.; Zeng, X.Q.; Mason, A.J.; Cao, C.Y. Smart agriculture systems: Soil sensors and plant wearables for smart and precision agriculture. Adv. Mater. 2021, 33, 2170156. [Google Scholar] [CrossRef]
- Linaza, M.; Posada, J.; Bund, J.; Eisert, P.; Quartulli, M.; Döllner, J.; Pagani, A.; Olaizola, I.G.; Barriguinha, A.; Moysiadis, T.; et al. Data-driven artificial intelligence applications for sustainable precision agriculture. Agronomy 2021, 11, 1227. [Google Scholar] [CrossRef]
- Shinzato, M.C.; Wu, L.; Mariano, T.O.; Freitas, J.G.; Martins, T.S. Mineral sorbents for ammonium recycling from industry to agriculture. Environ. Sci. Pollut. R 2020, 27, 13599–13616. [Google Scholar] [CrossRef]
- Tang, Q.W.; Lin, J.M.; Wu, J.H.; Xu, Y.W.; Zhang, C.J. Preparation and water absorbency of a novel poly (acrylate-co-acrylamide)/vermiculite superabsorbent composite. J. Appl. Polym. Sci. 2007, 104, 735–739. [Google Scholar] [CrossRef]
- Chen, S.Y.; Han, J.G.; Wang, Y.W.; Li, S.T.; Chang, S.J. Effects of matriconditioning with vermiculite on germination and germination speed of zoysia grass seed samples. Acta Agrestia Sin. 2007, 3, 254–258. [Google Scholar]
- Yang, L.L.; Yao, Q.F.; Liang, Q.; Lu, X.M. Research progress on soil nitrogen internal cycling response to ecological cover change. Chin. J. Econ. Agric. 2020, 28, 1543–1550. [Google Scholar] [CrossRef]
- Xie, X.L.; Li, A.B. Identification of soil profile classes using depth-weighted visible near-infrared spectral reflectance. Geoderma 2018, 325, 90–101. [Google Scholar] [CrossRef]
- Lin, L.X.; Xue, F.C.; Wang, Y.J.; Liu, K.Q. Photography measured-value magnification improves local correlation maximization-complementary superiority method of hyperspectral analysis of soil total nitrogen. Catena 2018, 165, 106–114. [Google Scholar] [CrossRef]
- Picouet, A.P.; Gou, P.; Hyypio, R.; Castellari, M. Implementation of NIR technology for at-line rapid detection of sunflower oil adulterated with mineral oil. J. Food. Eng. 2018, 230, 18–27. [Google Scholar] [CrossRef]
- Verstraeten, M.; Van, H.D.; Hellings, M.; Hermans, M.; Geens, J.; Vervaet, C.; Nopens, I.; Beer, D.T. Model-based NIR spectroscopy implementation for in-line assay monitoring during a pharmaceutical suspension manufacturing process. Int. J. Pharm. 2018, 546, 247–254. [Google Scholar] [CrossRef]
- Altieri, G.; Genovese, F.; Tauriello, A.; Di, R.G.C. Models to improve the nondestructive analysis of persimmon fruit properties by VIS/NIR spectrometry. J. Sci. Food. Agric. 2017, 97, 5302–5310. [Google Scholar] [CrossRef]
- Jiang, Q.H.; Li, Q.X.; Wang, X.G.; Wu, Y.; Yang, X.L.; Liu, F. Estimation of soil organic carbon and total nitrogen in different soil layers using VNIR spectroscopy: Effects of spiking on model applicability. Geoderma 2017, 293, 54–63. [Google Scholar] [CrossRef]
- Lu, B.; Wang, X.F.; Liu, N.H.; He, K.; Wu, K.; Li, H.L.; Tang, X.Y. Feasibility of NIR spectroscopy detection of moisture content in cocopeat substrate based on the optimization characteristic variables. Spectrochim. Acta A 2020, 239, 118455. [Google Scholar] [CrossRef]
- Zhang, H.L.; Luo, W.; Liu, X.M.; He, Y. Measurement of soil organic matter with near infrared spectroscopy combined with genetic algorithm and successive projection algorithm. Spectrosc. Spect. Anal. 2017, 37, 584–587. [Google Scholar]
- Wang, L.S.; Wang, R.J.; Lu, C.P.; Wang, J.; Huang, W.; Jian, Q.; Wang, Y.B.; Lin, L.Z.; Song, L.T. Quantitative Analysis of Total Nitrogen Content in Monoammonium Phosphate Fertilizer Using Visible-Near Infrared Spectroscopy and Least Squares Support Vector Machine. J. Appl. Spectrosc. 2019, 86, 465–569. [Google Scholar] [CrossRef]
- Liu, S.S.; Shen, H.H.; Chen, S.C.; Zhao, X.; Biswas, A.; Jia, X.L.; Shi, Z.; Fang, J.Y. Estimating forest soil organic carbon content using vis-NIR spectroscopy: Implications for large-scale soil carbon spectroscopic assessment. Geoderma 2019, 348, 37–44. [Google Scholar] [CrossRef]
- Liu, J.B.; Xie, J.C.; Han, J.C.; Wang, H.Y.; Sun, J.H.; Li, R.; Li, S.X. Visible and near-infrared spectroscopy with chemometrics are able to predict soil physical and chemical properties. J. Soil. Sediment. 2020, 20, 2749–2760. [Google Scholar] [CrossRef]
- Lu, B.; Liu, N.H.; Li, H.L.; Yang, K.F.; Hu, C.; Wang, X.F.; Li, Z.X.; Shen, Z.X.; Tang, X.Y. Quantitative determination and characteristic wavelength selection of available nitrogen in coco-peat by NIR spectroscopy. Soil. Till. Res. 2019, 191, 266–274. [Google Scholar] [CrossRef]
- Dalias, P.; Christou, A.; Neocleous, D. Adjustment of Irrigation Schedules as a Strategy to Mitigate Climate Change Impacts on Agriculture in Cyprus. Agriculture 2018, 9, 4. [Google Scholar] [CrossRef] [Green Version]
- Puneet, M.; Santosh, L. Improved prediction of protein content in wheat kernels with a fusion of scatter correction methods in NIR data modelling. Biosyst. Eng. 2021, 203, 93–97. [Google Scholar] [CrossRef]
- Xu, X.B.; Ren, M.Y.; Cao, J.F.; Wu, Q.Y.; Liu, P.Y.; Lv, J.S. Spectroscopic diagnosis of zinc contaminated soils based on competitive adaptive reweighted sampling algorithm and an improved support vector machine. Spectros. Lett. 2019, 53, 86–99. [Google Scholar] [CrossRef]
- Bi, Y.M.; Yuan, K.L.; Xiao, J.Z.; Wu, J.Z.; Shi, C.Y.; Xie, J.; Chu, G.H.; Zhang, G.X.; Zhou, G.J. A local pre-processing method for near-infrared spectra, combined with spectral segmentation and standard normal variate transformation. Anal. Chim. Acta 2016, 909, 30–40. [Google Scholar] [CrossRef] [PubMed]
- Nie, L.X.; Dai, Z.; Ma, S.C. Enhanced accuracy of near-infrared spectroscopy for traditional chinese medicine with competitive adaptive reweighted sampling. Anal. Lett. 2016, 49, 2259–2267. [Google Scholar] [CrossRef]
- Liu, E.; Liu, J.; Yu, K.Y.; Wang, Y.J.; He, P. A hybrid model for predicting spatial distribution of soil organic matter in a bamboo forest based on general regression neural network and interative algorithm. J. For. Res. 2020, 31, 1673–1680. [Google Scholar] [CrossRef]
- Hobimiarantsoa, R.; Kensuke, K.; Yasuhiro, T.; ToTomohiro, N.; Herintsitohaina, R.; Bruce Haja, A.; Andry, A. Prediction of Soil Oxalate Phosphorus using Visible and Near-Infrared Spectroscopy in Natural and Cultivated System Soils of Madagascar. Agriculture 2020, 10, 177. [Google Scholar] [CrossRef]
- Li, Z.X.; Tang, X.Y.; Shen, Z.X.; Yang, K.F.; Zhao, L.J.; Li, Y.L. Comprehensive comparison of multiple quantitative near-infrared spectroscopy models for aspergillus flavus contamination detection in peanut. J. Sci. Food Agric. 2019, 99, 5671–5679. [Google Scholar] [CrossRef] [PubMed]
- Zhang, Y.; Li, M.Z.; Zheng, L.H.; Zhao, Y.; Pei, X.S. Soil nitrogen content forecasting based on real-time NIR spectroscopy. Comput. Electron. Agric. 2016, 124, 29–36. [Google Scholar] [CrossRef]
- Morra, M.J.; Hall, M.H.; Freeborn, L.L. Carbon and nitrogen analysis of soil fractions using near-infrared reflectance spectroscopy. Soil. Sci. Soc. Am. J. 1991, 55, 288–291. [Google Scholar] [CrossRef]
- Riikka, R.; Asumund, R. Application of near infrared reflectance (NIR) and fluorescence spectroscopy to analysis of microbiological and chemical properties of arctic soil. Soil Biol. Biochem. 2007, 39, 1664–1673. [Google Scholar] [CrossRef]
- Chu, X.L. Molecular Spectroscopy Analytical Technology Combined with Chemometrics and Its Applications; Chemical Industry Press: Beijing, China, 2011. (In Chinese) [Google Scholar]
- Bambang, H.K.; Hedley, C.B.; Hedley, M.J.; Hueni, A.; Tuohy, M.P.; Arnold, G.C. The use of diffuse reflectance spectroscopy for in situ carbon and nitrogen analysis of pastoral. Soil Res. 2008, 46, 623–635. [Google Scholar] [CrossRef]
- Kodaira, M.; Shibusawa, S. Using a mobile real-time soil visible infrared sensor for high resolution soil property. Geoderma 2013, 199, 54–63. [Google Scholar] [CrossRef]
- Shao, Y.N.; He, Y. Nitrogen, phosphorus, and potassium prediction in soils, using infrared spectroscopy. Soil Res. 2010, 49, 166–172. [Google Scholar] [CrossRef]


| Subsets | Sample Number | Range of Available Nitrogen Content (mg/kg) | Mean (mg/kg) | Standard Deviation (mg/kg) |
|---|---|---|---|---|
| Calibration set | 108 | 11.2–753.21 | 232.29 | 202.886 |
| Prediction set | 36 | 11.2–699.16 | 228.18 | 200.289 |
| Total samples | 144 | 11.2–753.21 | 231.26 | 200.848 |
| Pre-Processing Methods | Number of Principal Components | Rc | RMSEC | Rp | RMSEV | RPD |
|---|---|---|---|---|---|---|
| Original | 8 | 0.9901 | 283.82 | 0.9835 | 399.56 | 5.28 |
| 1st Der | 9 | 0.9955 | 191.69 | 0.9861 | 334.56 | 6.00 |
| 2nd Der | 7 | 0.9957 | 187.63 | 0.9827 | 368.98 | 5.31 |
| SG | 8 | 0.9945 | 211.03 | 0.9942 | 239.91 | 8.54 |
| MSC | 7 | 0.9841 | 358.89 | 0.9747 | 501.61 | 4.27 |
| SNV | 8 | 0.9859 | 337.57 | 0.9751 | 515.51 | 4.21 |
| 1st Der + SG | 8 | 0.9978 | 133.15 | 0.9967 | 169.10 | 11.78 |
| 2nd Der + SG | 8 | 0.9982 | 120.35 | 0.9977 | 141.78 | 12.14 |
| Pre-Processing Methods | Number of Characteristic Variables | Rc | RMSEC | Rp | RMSEV | RPD |
|---|---|---|---|---|---|---|
| Original | 5 | 0.9783 | 419.84 | 0.9809 | 395.19 | 5.21 |
| 1st Der | 10 | 0.9852 | 346.67 | 0.9867 | 330.06 | 6.18 |
| 2nd Der | 9 | 0.9666 | 521.19 | 0.9757 | 484.99 | 4.36 |
| SG | 31 | 0.9943 | 214.92 | 0.9941 | 244.87 | 8.49 |
| MSC | 16 | 0.9773 | 427.44 | 0.9713 | 503.21 | 4.21 |
| SNV | 27 | 0.9812 | 389.42 | 0.9699 | 518.45 | 4.10 |
| 1st Der + SG | 54 | 0.9969 | 160.03 | 0.9966 | 186.45 | 10.99 |
| 2nd Der + SG | 55 | 0.9967 | 164.45 | 0.9950 | 198.75 | 9.96 |
| Pre-Processing Methods | Number of Characteristic Variables | Rc | RMSEC | Rp | RMSEV | RPD |
|---|---|---|---|---|---|---|
| Original | 13 | 0.9843 | 357.39 | 0.9838 | 375.20 | 5.57 |
| 1st Der | 26 | 0.9938 | 225.21 | 0.9878 | 312.60 | 6.48 |
| 2nd Der | 25 | 0.9920 | 254.70 | 0.9896 | 285.08 | 7.04 |
| SG | 29 | 0.9926 | 246.05 | 0.9914 | 268.36 | 7.53 |
| MSC | 39 | 0.9864 | 331.35 | 0.9794 | 459.42 | 4.72 |
| SNV | 43 | 0.9859 | 337.99 | 0.9824 | 420.05 | 5.12 |
| 1st Der + SG | 31 | 0.9972 | 149.98 | 0.9968 | 159.65 | 12.57 |
| 2nd Der + SG | 25 | 0.9951 | 199.11 | 0.9933 | 228.79 | 8.77 |
| Pre-Processing Methods | Rc | RMSEC | Rp | RMSEV | RPD |
|---|---|---|---|---|---|
| Original | 0.9869 | 325.33 | 0.9708 | 570.83 | 3.51 |
| 1st Der | 0.9929 | 241.64 | 0.9868 | 354.38 | 5.65 |
| 2nd Der | 0.9919 | 256.08 | 0.9879 | 402.56 | 4.98 |
| SG | 0.9942 | 218.02 | 0.9784 | 461.11 | 4.34 |
| MSC | 0.9870 | 324.43 | 0.9586 | 1164.92 | 1.72 |
| SNV | 0.9870 | 324.47 | 0.9599 | 1130.79 | 1.77 |
| 1st Der + SG | 0.9964 | 172.07 | 0.9899 | 313.11 | 6.40 |
| 2nd Der + SG | 0.9952 | 198.06 | 0.9879 | 402.56 | 4.98 |
| Pre-Processing Methods | Number of Characteristic Variables | Modeling Methods | Rc | RMSEC | Rp | RMSEV | RPD |
|---|---|---|---|---|---|---|---|
| 2nd Der + SG | 128 | PLSR | 0.9982 | 120.35 | 0.9977 | 141.78 | 12.14 |
| 1st Der + SG | 54 | SPA + PLSR | 0.9969 | 160.03 | 0.9966 | 186.45 | 10.99 |
| 1st Der + SG | 31 | CARS + PLSR | 0.9972 | 149.98 | 0.9968 | 159.65 | 12.57 |
| 1st Der + SG | 24 | Si-PLS + PLSR | 0.9964 | 172.07 | 0.9899 | 313.11 | 6.40 |
Publisher’s Note: MDPI stays neutral with regard to jurisdictional claims in published maps and institutional affiliations. |
© 2022 by the authors. Licensee MDPI, Basel, Switzerland. This article is an open access article distributed under the terms and conditions of the Creative Commons Attribution (CC BY) license (https://creativecommons.org/licenses/by/4.0/).
Share and Cite
Zhao, P.; Xing, J.; Hu, C.; Guo, W.; Wang, L.; He, X.; Xu, Z.; Wang, X. Feasibility of Near-Infrared Spectroscopy for Rapid Detection of Available Nitrogen in Vermiculite Substrates in Desert Facility Agriculture. Agriculture 2022, 12, 411. https://doi.org/10.3390/agriculture12030411
Zhao P, Xing J, Hu C, Guo W, Wang L, He X, Xu Z, Wang X. Feasibility of Near-Infrared Spectroscopy for Rapid Detection of Available Nitrogen in Vermiculite Substrates in Desert Facility Agriculture. Agriculture. 2022; 12(3):411. https://doi.org/10.3390/agriculture12030411
Chicago/Turabian StyleZhao, Pengfei, Jianfei Xing, Can Hu, Wensong Guo, Long Wang, Xiaowei He, Zhengxin Xu, and Xufeng Wang. 2022. "Feasibility of Near-Infrared Spectroscopy for Rapid Detection of Available Nitrogen in Vermiculite Substrates in Desert Facility Agriculture" Agriculture 12, no. 3: 411. https://doi.org/10.3390/agriculture12030411
APA StyleZhao, P., Xing, J., Hu, C., Guo, W., Wang, L., He, X., Xu, Z., & Wang, X. (2022). Feasibility of Near-Infrared Spectroscopy for Rapid Detection of Available Nitrogen in Vermiculite Substrates in Desert Facility Agriculture. Agriculture, 12(3), 411. https://doi.org/10.3390/agriculture12030411