Article

Rootstock Effects on Anthocyanin Accumulation and Associated Biosynthetic Gene Expression and Enzyme Activity during Fruit Development and Ripening of Blood Oranges

1
Institute of Pomology and Olericulture, College of Horticulture, Sichuan Agricultural University, Chengdu 611130, China
2
Citrus Research Institute, Southwest University, Chongqing 400715, China
3
College of Environmental Sciences, Sichuan Agricultural University, Chengdu 611130, China
*
Author to whom correspondence should be addressed.
These authors contributed equally to this work.
Agriculture 2022, 12(3), 342; https://doi.org/10.3390/agriculture12030342
Submission received: 29 January 2022 / Revised: 25 February 2022 / Accepted: 25 February 2022 / Published: 27 February 2022

Abstract

:
Blood orange (Citrus sinensis L. Osbeck) is a rare commercial citrus fruit containing abundant anthocyanins and has numerous health benefits. Blood orange rootstock determines the fruit yield and quality. This study evaluated the effect of the three most commonly used rootstocks on the fruit features, color index, physicochemical parameters, anthocyanin accumulation, the anthocyanin biosynthetic gene expression, and the associated enzymes during the fruit development and ripening of ‘Tarocco’ blood orange. The highest anthocyanin content at harvest was found in blood orange trees grafted onto ‘Trifoliate orange’ (Poncirus trifoliata L. Raf., Pt) rootstock. Molecular analyses revealed that the rootstock affects the anthocyanin accumulation in the blood orange. Additionally, there was a strong correlation between the anthocyanin content and the expression and the activity of related genes and enzymes, respectively. Based on gene expression and enzymatic activity analyses, Pt rootstock promotes a very high anthocyanin accumulation in ‘Tarocco’ blood orange fruit. Accordingly, Pt is the promising rootstock for producing good quality and highly nutritious ‘Tarocco’ blood orange fruit for commercial purposes.

1. Introduction

Blood orange (Citrus sinensis L. Osbeck) originated centuries ago from a spontaneous genetic mutation of the common sweet orange [1]. The fruit is thought to have originated from China or the Mediterranean climate area [2], and its cultivation has since spread to other citrus-producing countries, such as Italy, Spain, the United States, Australia, and China. There has been a global increase in the demand and consumption of blood oranges, given their high anthocyanin concentration and abundant bioactive compounds [3]. The brilliant red coloration of blood orange is attributed to anthocyanins [4], which are not usually found in other citrus fruits [2]. Anthocyanins possess antioxidation, anti-inflammatory, and anti-apoptotic properties. As such, it ameliorates oxidative stress, regulates inflammation, and prevents cancer, diabetes, cardiovascular, and neurological diseases [5].
Given its health benefits, blood orange is consumed globally both as fresh fruit and processed juice [6]. ‘Tarocco’, ‘Moro’, and ‘Sanguinello’ are the three most common types of blood oranges worldwide [2,3,6]. Tarocco is a medium-sized, half-blood fruit and the sweetest among the three varieties [2,6].
The grafting of citrus cultivar onto rootstocks is a common and essential agronomical technique used worldwide for producing commercial varieties [7] with superior qualities such as fast growth, high yielding, and resistance to pests (nematodes and weevils) and diseases (Phytophthora rots, Tristeza virus (CTV), Huanglongbing (HLB), and other diseases caused by viruses, viroids, fungi, and bacteria) and tolerance to various abiotic stresses (flood, drought, extreme temperatures, and salinity, and high pH, among other stressors) [7,8]. For decades, ‘Ziyang Xiangcheng’ (C. junos Sieb. ex Tanaka, Cj), ‘Hongju’ (C. reticulata Blanco, Cr), and ‘Trifoliate orange’ (Poncirus trifoliata L. Raf., Pt) have been the most widely grown varieties in Sichuan Province and other major citrus-growing areas in China.
Cj is a unique citrus rootstock from southwest China [9], suitable for the wet and heavy paddy soils of Sichuan and Chongqing in China [7]. Cr is a popular rootstock in central China for mandarins and yields moderately fast ripening sweet orange cultivars [10]. The rootstock is tolerant to citrus exocortis viroid (CEV) [11]. Pt has been grown in China for at least 700 years [12] and is currently extensively used as a rootstock in China, Japan, Australia, New Zealand, and Argentina, given its good productivity and compatibility, cold tolerance, and CTV resistance [7].
Previous studies have suggested that scion–rootstock interaction can improve the content of bioactive compounds such as anthocyanins in horticultural plants, including red-fleshed apples (Malus × domestica L. Borkh.) [13], peach (Prunus persica cv. Tebana), and nectarine (Prunus persica cv. Queen Giant) [14], sour cherry (Prunus cerasus L.) [15], Cornelian cherry (Cornus mas L.) [16], and ‘Red Alexandria’ grape (Vitis vinifera L.) [17]. However, a few studies have focused on rootstock selection for grafting ‘Tarocco’ blood oranges [18]. Recently, Lanal et al. found a strong relationship between metabolism and gene expression in ‘Tarocco Sciré’ blood orange. They also found that rootstocks impacted the quality of the fruit, including the anthocyanins, sugars, acids, and vitamin C levels [19]. Continella et al. found that rootstocks strongly influenced the yield and quality of fruits, particularly the amount of total soluble solids, titratable acidity, vitamin C, and total anthocyanin concentration of ‘Tarocco Scirè’ blood orange in a Sicilian area [20]. However, these rootstocks are not commonly used in citriculture in China.
The anthocyanin biosynthesis pathway regulates the conversion of phenylalanine to trans-cinnamic acid, catalyzed by phenylalanine ammonia lyase (PAL) in the general phenylpropanoid pathway [21]. The trans-cinnamic acid is then converted into p-coumaric acid by cinnamate 4-hydroxylase (C4H). As the most limiting intermediate factor in the pathway [22], p-coumaric acid is broken down to an ester and p-coumaroyl-CoA by 4-coumarate-CoA ligase (4CL) to produce its counterpart [23]. Chalcone synthase (CHS), the first enzyme of the anthocyanin synthetic pathway, catalyzes naringenin chalcone production. Chalcone isomerase (CHI) then isomerizes naringenin chalcone to flavanone naringenin, which is catalyzed by flavanone 3-hydroxylase (F3H) producing dihydrokaempferol. Favonoid 3′-hydroxylase (F3′H) and flavonoid 3′5′-hydroxylase (F3′5′H) hydrolyze dihydrokaempferol into dihydroquercetin and dihydromyricetin, respectively. Meanwhile, flavonol synthase (FLS) catalyzes flavonol synthesis, while dihydroflavonol 4-reductase (DFR) reduces dihydroflavonols to leucoanthocyanidins. The colorless leucoanthocyanidins are subsequently oxidized to colored anthocyanidins by anthocyanidin synthetase (ANS). UDP-glucose-flavonoid 3-O-glucosyltransferase (UFGT) then catalyzes the production of chemically stable and water-soluble anthocyanins by adding one glucose molecule in the 3-OH position of the colored anthocyanidins [23,24,25]. The blood orange-specific glutathione-by-glutathione transferase (GST) catalyzes the conjugation of anthocyanin to GSH [26]. The anthocyanins are then conjugated to GST and transferred from the cytosol to vacuoles [23,25,27]. Although the anthocyanin biosynthesis pathway in plant species is well known [23,25,27], the blood orange–rootstock interaction at the molecular level and how this influences the biosynthesis and accumulation of anthocyanin in the Citrus species [24,28] is not well understood.
It is still unclear how different rootstocks affect anthocyanin biosynthesis. The present study explored how different rootstocks influence the accumulation of anthocyanins, the expression of anthocyanin biosynthetic genes, and the activities of anthocyanin biosynthetic enzymes during the development and ripening of ‘Tarocco’ blood orange. The findings of this study reveal the physiological processes and molecular mechanisms underlying the development, coloration, and ripening of blood orange fruit. The comparative assessment of different rootstocks on the biosynthesis of anthocyanins, the most essential compounds in blood orange, will reveal the most suitable rootstock for the most nutritious blood orange.

2. Materials and Methods

2.1. Plant Materials and Sampling

Tarocco blood orange was grafted onto three common rootstocks: Cj, Cr, and Pt obtained from a commercial orchard at Fushun’ county, Zigong City, Sichuan Province, China (FS, 29°11′30.60″ N, 105°10′43.65″ E). The region has a sub-tropical monsoon climate with annual average rainfall, sunshine, and temperature of 1078.5 mm, 1193.2 h, and 18.0 °C, respectively. Thereafter, we planted the trees in the north–south orientation at a spacing of 3 × 4 m between plants and rows. All trees were subjected to similar management practices, including pruning, thinning, fertilization, and pest disease control. Nine identical experimental trees, including the age (eight-year-old in 2020) and size, were selected for each scion/rootstock combination.
Fruits were randomly sampled from the upper, central, and lower parts of each tree. Four fruits were sampled at each location for each scion/rootstock combination, giving 12 fruits at any given time. The fruits were harvested at 90, 120, 150, 180, 210, 240, 270, 300, 315, 330, and 345 days after full bloom (DAFB), matching the major events during the growth and development of the citrus fruits. The epicarp and pulp of fruits were immediately separated. The pulps were cut into small pieces, frozen in liquid nitrogen, and stored at −80 °C until further analyses for chemical composition, gene expression, and activities of key enzymes. Juice for the determination of internal fruit quality, including soluble solids content (SSC), total soluble sugar (TSS), titratable acidity (TA), and vitamin C (Vc), was extracted from the fruits using a hand juice crusher.

2.2. Chemicals and Solvents

All the chemicals and solvents used in our experiments were of HPLC quality. Cyanidin 3-glucoside (C3G) (CAS: 7084-24-4, Beijing, China) and cyanidin 3-(6″-malonyl) glucoside (CMG) (CAS: 171828-62-9, Wuhan, China) were purchased from Beijing Solarbio Science & Technology Co. and Wuhan ChemFaces Biochemical Co., Ltd., respectively. Methanol (MeOH) and formic acid were purchased from Sigma-Aldrich (St. Louis, MO, USA). Ultrapure water was prepared using a Milli-Q water purification system (Millipore Corporation, Bedford, MA, USA) with a 0.22 μm filter.

2.3. Fruit Weight, Shape, and Color Measurement

For weight, shape, and color determination, a total of 10 fruits at any given sampling stage were used. The fruit shape index was calculated by dividing the vertical length of the fruit with the transverse diameter. The color of the fruits was determined using a CM-2600d spectrophotometer (Konica Minolta, Tokyo, Japan). Ten fruits were randomly selected at each sampling stage and four points around their equatorial plane were measured. The resultant citrus color index (the Hunter ratio (h) = a*/b*) was measured at the mature fruit stage, which is mostly preferred for common industrial applications [29].

2.4. Determination of Soluble Solid Content (SSC), Total Soluble Sugar (TSS), Titratable Acidity (TA), Vitamin C (Vc), and Total Anthocyanin Concentration (TAC)

SSC was directly measured using a hand-held, temperature-compensating digital refractometer purchased from Atago Co., Ltd. (Model PAL1 0%~53%; Tokyo, Japan) and was expressed as refractive index (° Brix). TSS was determined using the anthrone–sulfuric acid method at 620 nm. TA was quantitatively measured using the standard acid-base titration at the equivalence pH of 8.2 as previously described [30].
For the base, 0.1 N NaOH was used. The TSS was expressed as a percentage (%) of the citric acid equivalent. The ripeness index was calculated by dividing the SSC (° Brix) with TA (%). The sugar–acid ratio was obtained by diving TSS (%) with TA (%). The Vc content was determined using the 2, 6-dichloroindophenol titrimetric method (AOAC Official Method 967.21) and was expressed in mg 100 mL−1. The total anthocyanin concentration (TAC) was estimated using a spectrophotometer (Thermo Multiskan, Waltham, MA, USA) as previously described [31] and was expressed in mg L−1 of cyanidin-3-glucoside.

2.5. Extraction, Characterization, and Quantification of Anthocyanin Using High-Performance Liquid Chromatography (HPLC)

Briefly, 5.0 g of the frozen samples was ground using a pestle and mortar. Thereafter, 1.0 g of the ground samples was mixed with 3.0 mL of 1% (v/v) hydrochloric acid–MeOH for 24 h at 4 °C in darkness using a rotating shaker and centrifuged at 10,500× g at 4 °C for 10 min. The supernatants were filtered through a 0.45 μm filter. Finally, 10 μL of the supernatant was injected into an HPLC instrument equipped with a Zobax Stablebond Analytical SB-C18 column (250 × 4.6 mm, 5 μm), an Agilent 1260 HPLC instrument, and a diode array detector (Agilent, Santa Clara, CA, USA). Ultrapure water (phase A), acetonitrile (phase B), and MeOH (phase C) at a flow rate of 1 mL min−1 were used in the mobile phase. The linear gradient was determined as previously described by Liang et al. [32]. The anthocyanins were detected at 520 nm and quantified based on the retention time and spectra against the standards. The amount of the anthocyanins was expressed as mg 100 g−1.

2.6. Quantitative Real-Time Polymerase Chain Reaction (qRT-PCR)

Ribonucleic acid (RNA) extraction and purification were performed using the RNase-free but DNase-based Qiagen total RNA Qiagen RNeasy power plant kit. The quality of the purified RNA was initially evaluated using 1% agarose gel and confirmed using a NanoPhotometer spectrophotometer (Thermo Fisher Scientific, Inc., CA, USA). The RNA was transcribed to cDNA using a reverse transcription kit containing the PrimeScrptTM RT reagent Kit and gDNA Eraser (Perfect Real Time) (Takara, Dalian, China).
The sequences of the primers used in the qRT-PCR are listed in Table 1. The primers were synthesized by Tsinke (Beijing, China). The cDNA synthesis was performed using the CFX96 Touch Real-Time PCR C1000 Thermal Cycler system (Bio-RAD, Hercules, CA, USA) based on the NovoStart SYBR® qPCR SuperMix Plus kit (Novoprotein Scientific Inc., Shanghai, China) according to the manufacturer’s instructions. Data were collected and analyzed using the Bio-Rad software v.3.1. The relative expression of genes was calculated using the 2−ΔΔCT method.

2.7. Assay Enzymes

The activities of PAL, CHI, DFR, and UFGT were analyzed using the plant PAL, CHI, DFR, and UFGT ELISA kits (respectively) purchased from Shanghai Meilian Biotechnology Co. Ltd. (Shanghai, China), following the manufacturer’s instructions. The technique relies on the double antibody sandwich method to measure the enzyme activity. The enzyme is conjugated to an antibody linked to the HRP enzyme. TMB is the substrate for the HRP enzyme and changes in color after digestion. The intensity of the color change is measured using a spectrophotometer at a wavelength of 450 nm. The concentrations of PAL, CHI, DFR, and UFGT in the samples were determined by comparing the OD of the samples to that of the standard.

2.8. Statistical Analyses

Normally distributed continuous data were expressed as means and standard deviations. The data were analyzed using the JMP Pro software, version 14.1 (SAS Institute Inc. Cary, NC, USA). The effects of the rootstock cultivar, sampling time point, and the interactions between the two most detected variables were evaluated using two-way analysis of variance (ANOVA) followed by Turkey’s honest significant differences (HSD) test if the relationship was substantial. Statistical significance was set at p < 0.05. The association between anthocyanin concentration and other continuous variables (gene relative expression and enzyme activity) was assessed using Pearson’s correlation coefficient at a statistical significance level of p < 0.05.

3. Results

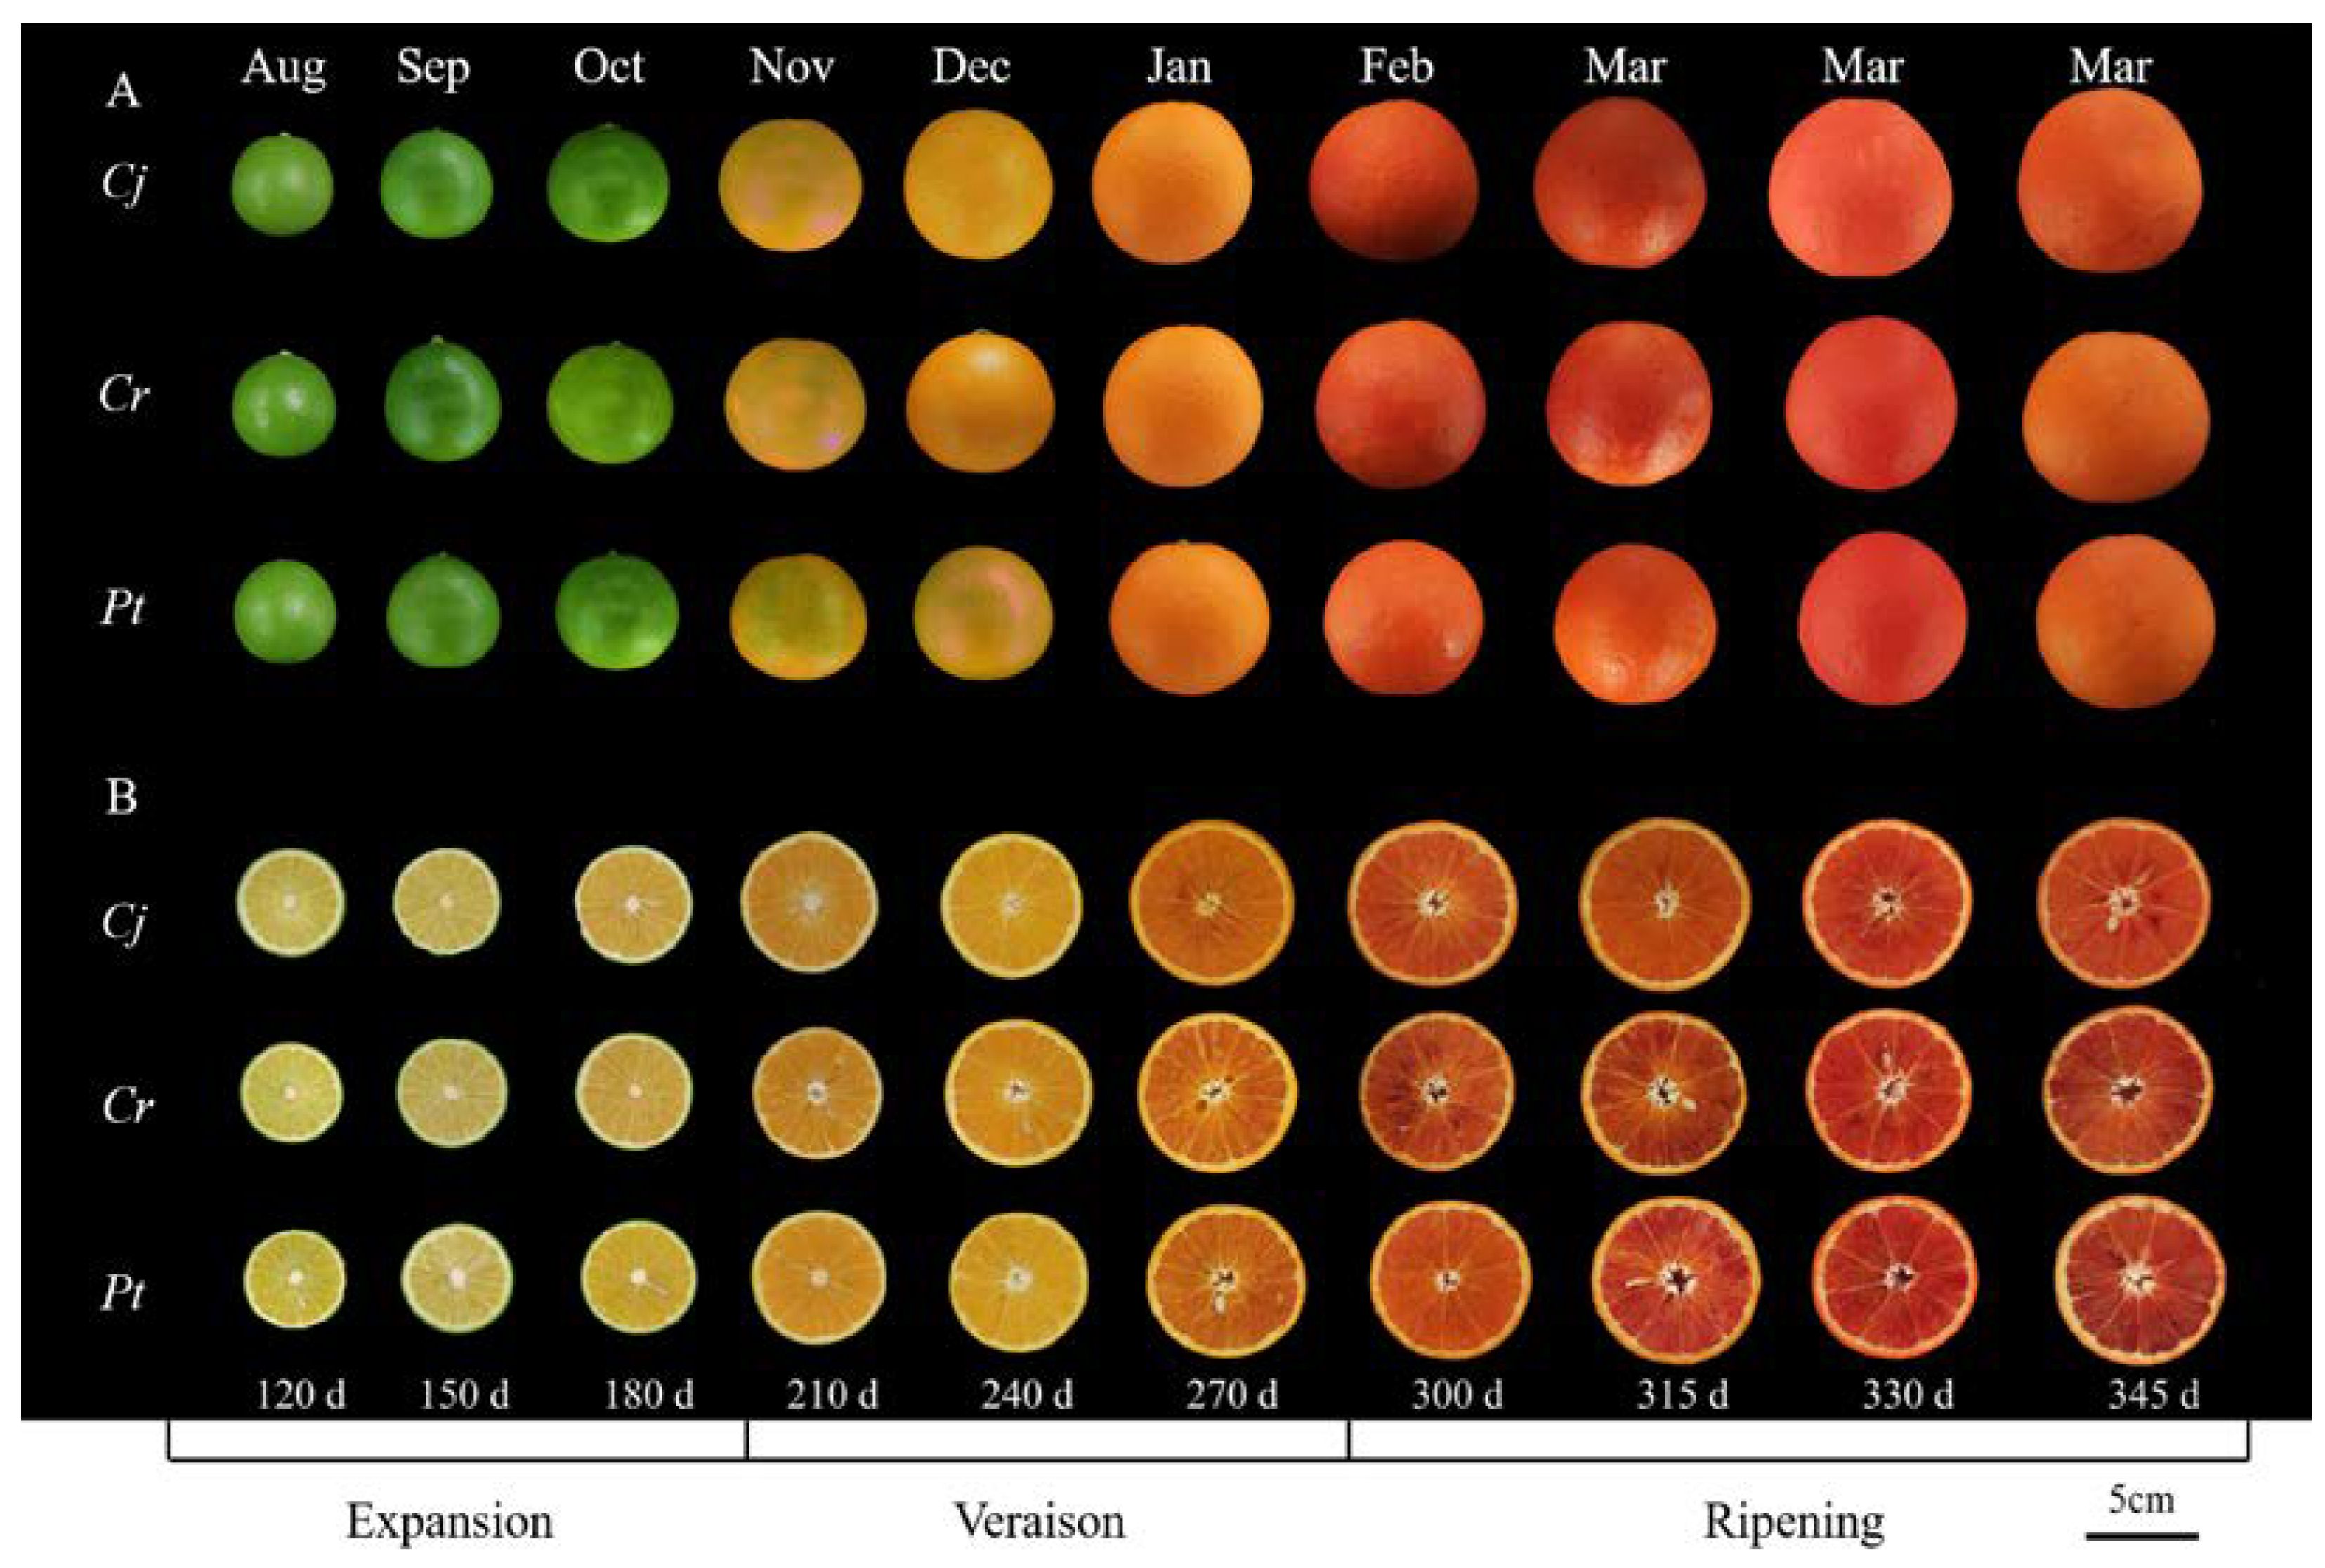
3.1. The Fruit Phenotypes

The different fruit phenotypes during the development and ripening of blood orange fruit are presented in Figure 1. The epicarp gradually changed from green (July–October) to yellow-orange (November 2020–January 2021) and dark orange, and to slightly blush red tones (February–March) across the developmental stages (Figure 1A). The color of fresh pulp also changed from pale yellow (July–September) to yellow-orange (October 2020–January 2021) and red-orange (blood-colored) (February–March 2021) (Figure 1B).

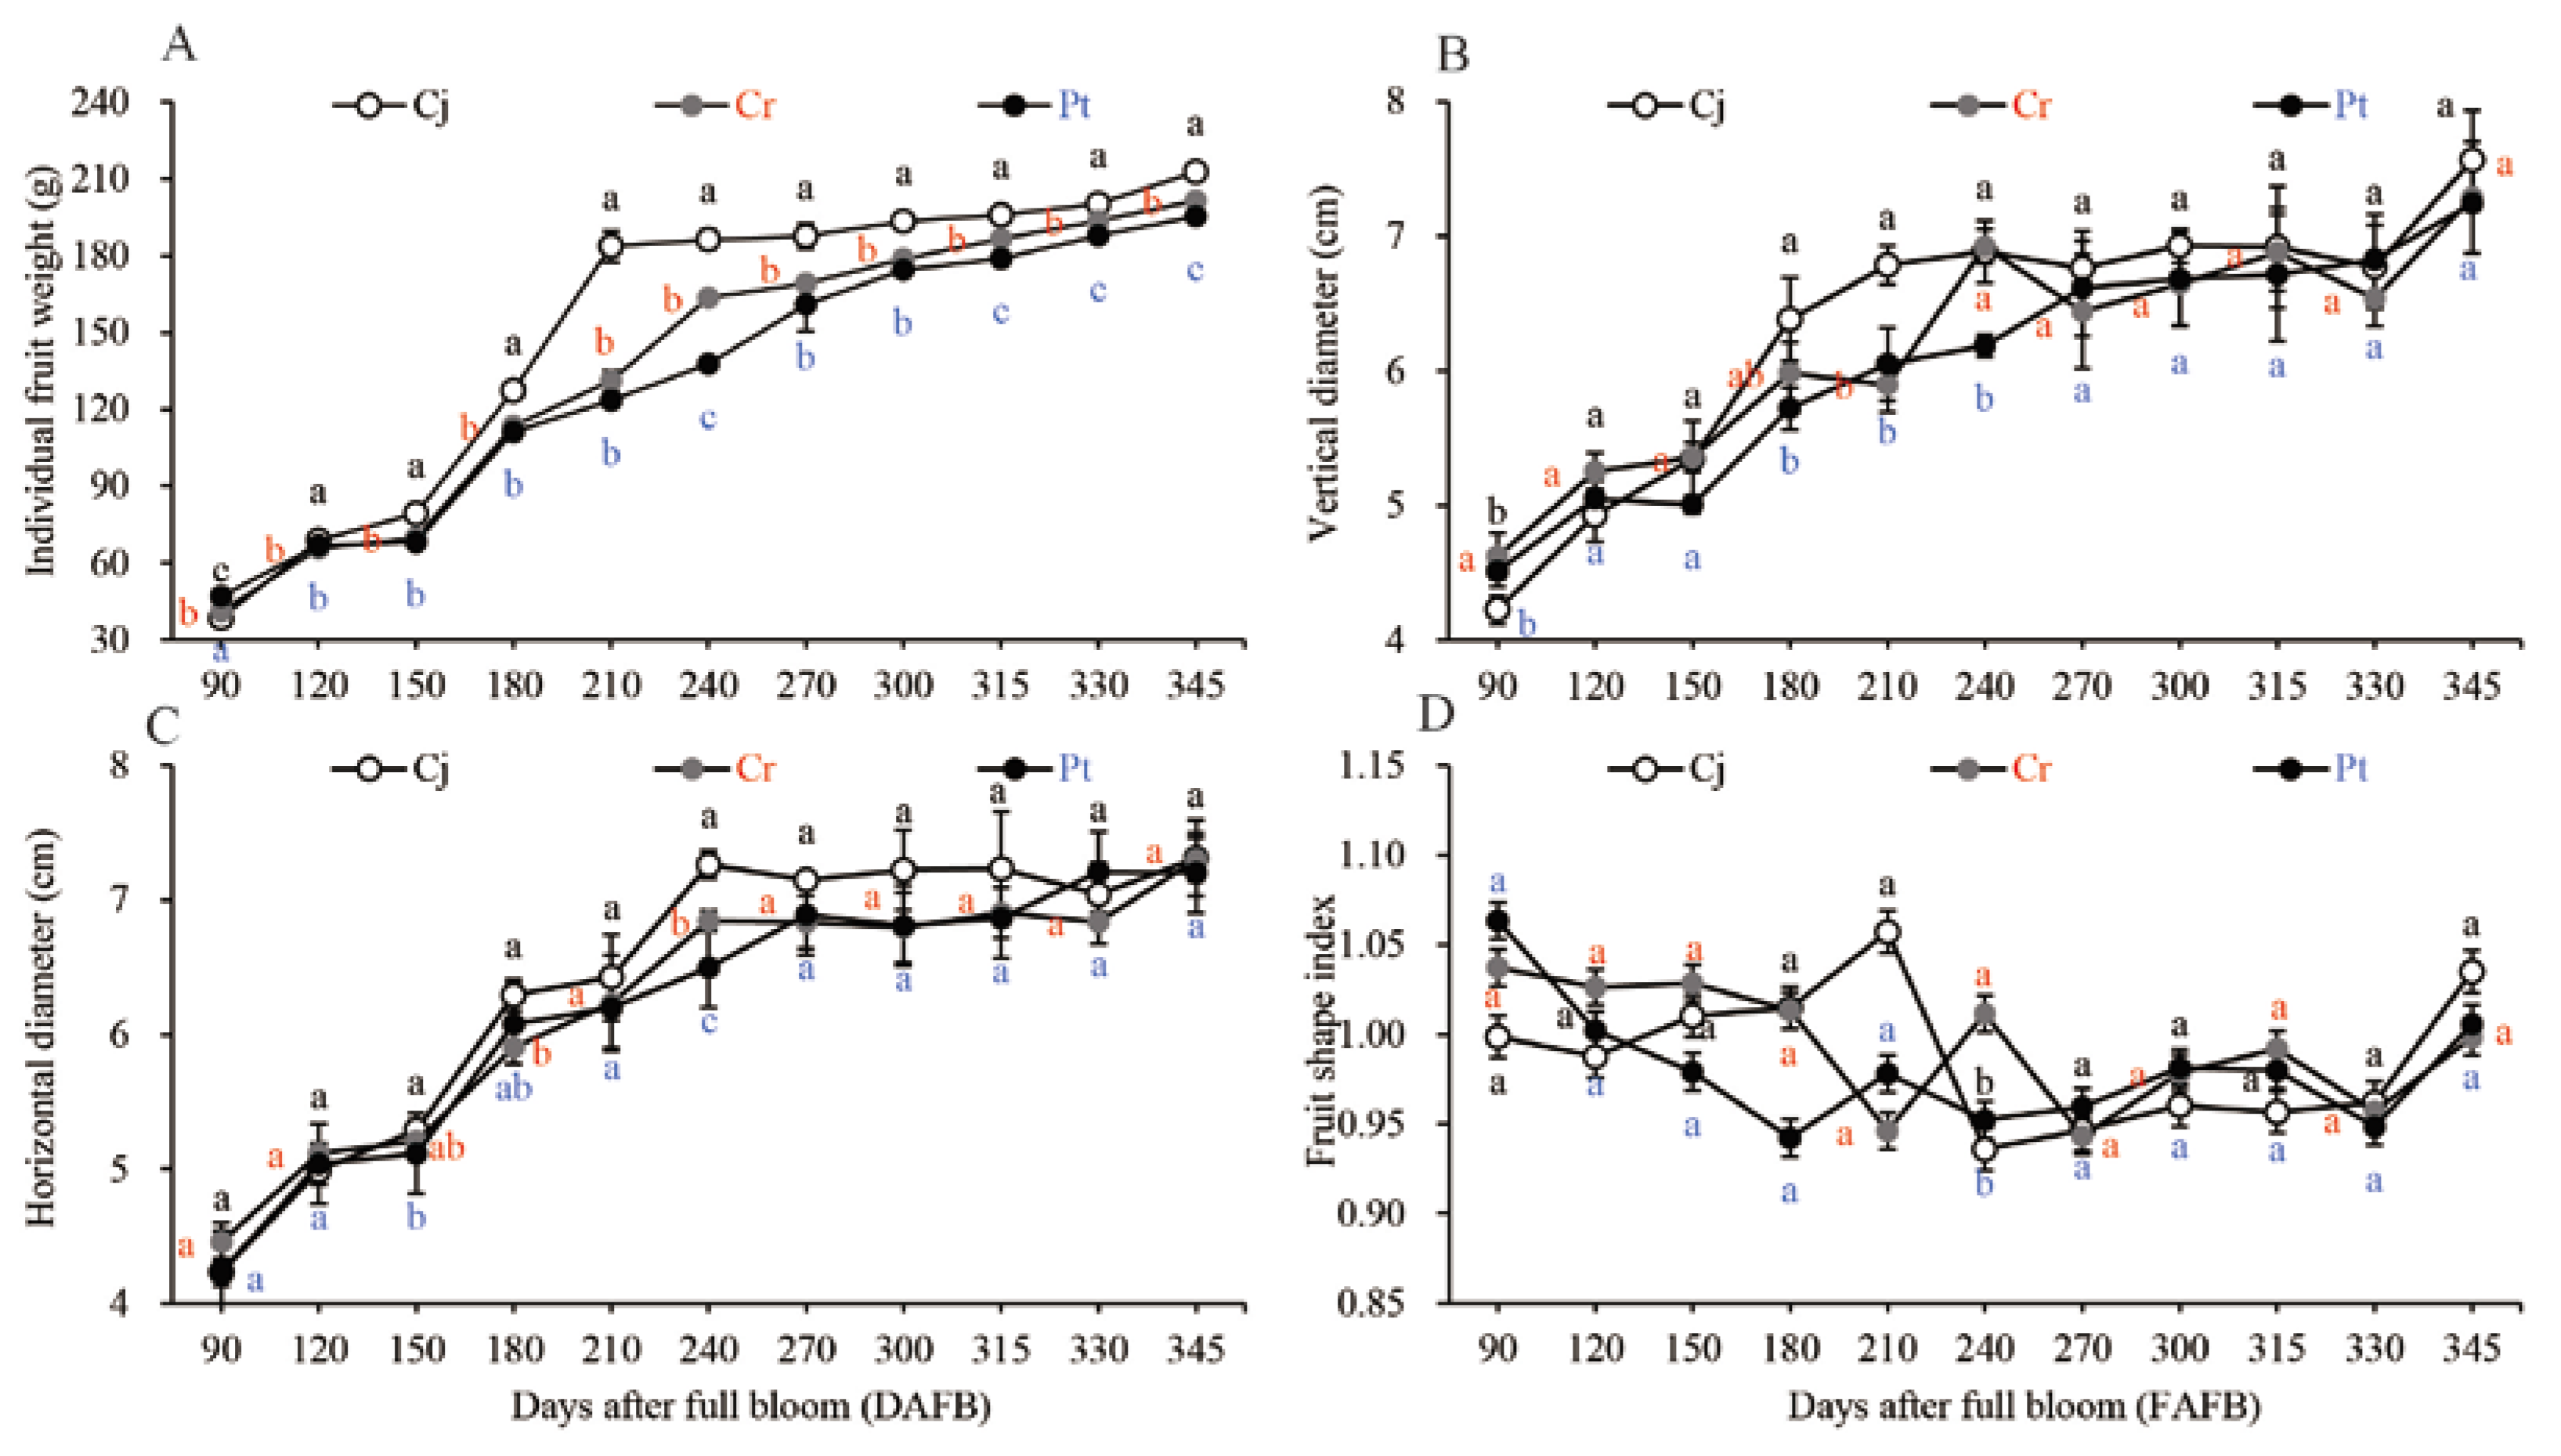
3.2. The General Features of the Fruits

The fresh weight remarkably increased during the early expansion stages (90−180 DAFB), gradually increased during the veraison stages (210−270 DAFB), and remained nearly constant in the later stages as the fruit ripened (270−345 DAFB) (Figure 2A). The blood oranges weighted highest during the harvesting period. The weight was highest (212.66 ± 2.05 g weight) for the Cj graft, median for Cr (201.37 ± 2.56 g weight), and least for Pt (195.34 ± 1.07 g weight) (Figure 1 and Figure 2A).
The vertical (Figure 2B) and transverse (Figure 2C) diameters of blood orange gradually increased over the fruit’s development process. The shapes of the fruits were generally similar across the groups ranging from 1.01 to 1.04 at the ripening stage (Figure 2D). The images for the shape of the fruit as seen by the naked eye are shown in Figure 1.

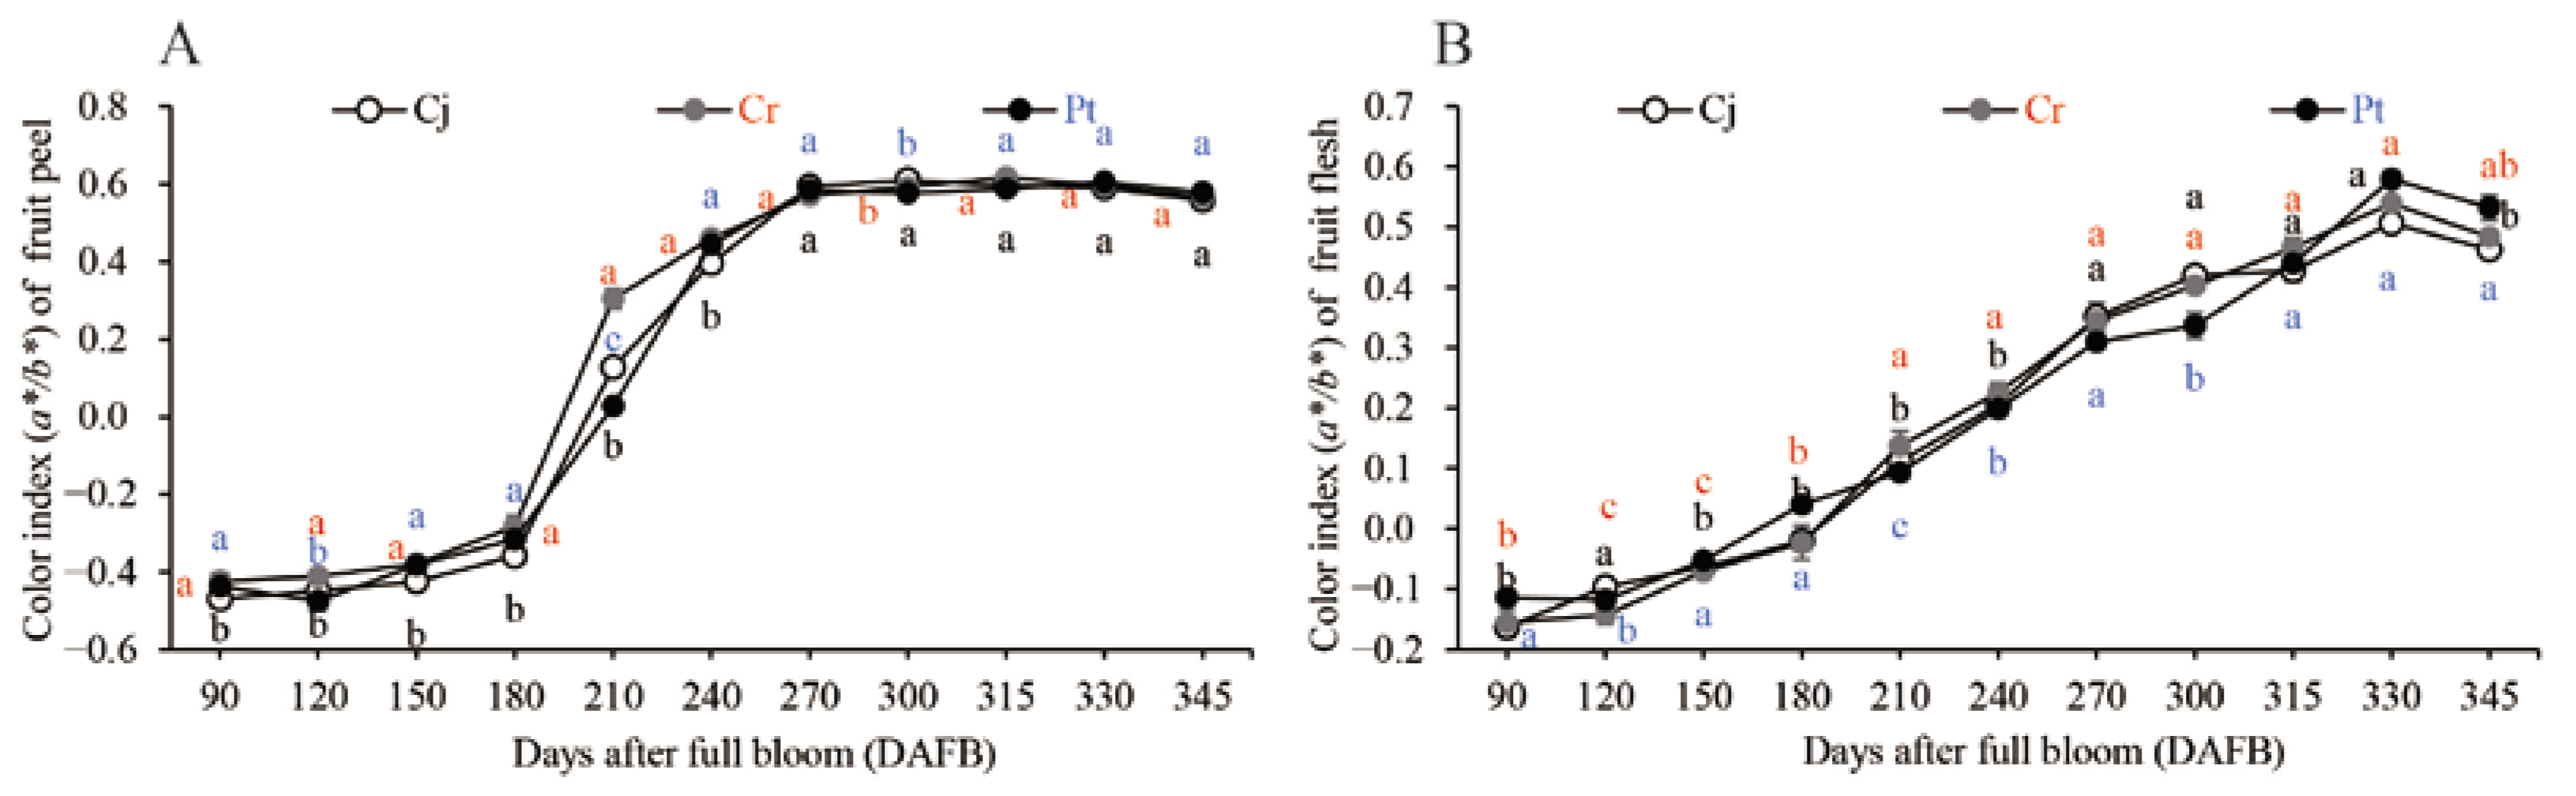
3.3. The Color Index of the Fruits

The color of the epicarp and flesh of the blood orange grafted onto different rootstocks are shown in (Figure 3A) and (Figure 3B), respectively. The color index of the epicarp (a*/b* Hunter ratio) gradually increased before 180 DAFB, and then rapidly increased from 180 to 240 DAFB before slowing down again during the maturation stage (Figure 3A). On the other hand, the color index of the fresh pulp gradually increased throughout the fruit development and ripening stages, and slightly decreased in the fully ripened fruits (345 DAFB) (Figure 3B). There were no significant differences in the color of the epicarp and the pulp for the blood orange on different rootstocks at the 345 DAFB (Figure 3A). However, there was a marked difference in the color of the pulps across blood orange on different rootstocks (Figure 3B). The Pt generated the best internal color for the fully ripened blood orange (0.53 ± 0.03) followed by Cr (0.48 ± 0.02). Pt generated the most intense reddish-orange and blood-colored flesh (Figure 3).

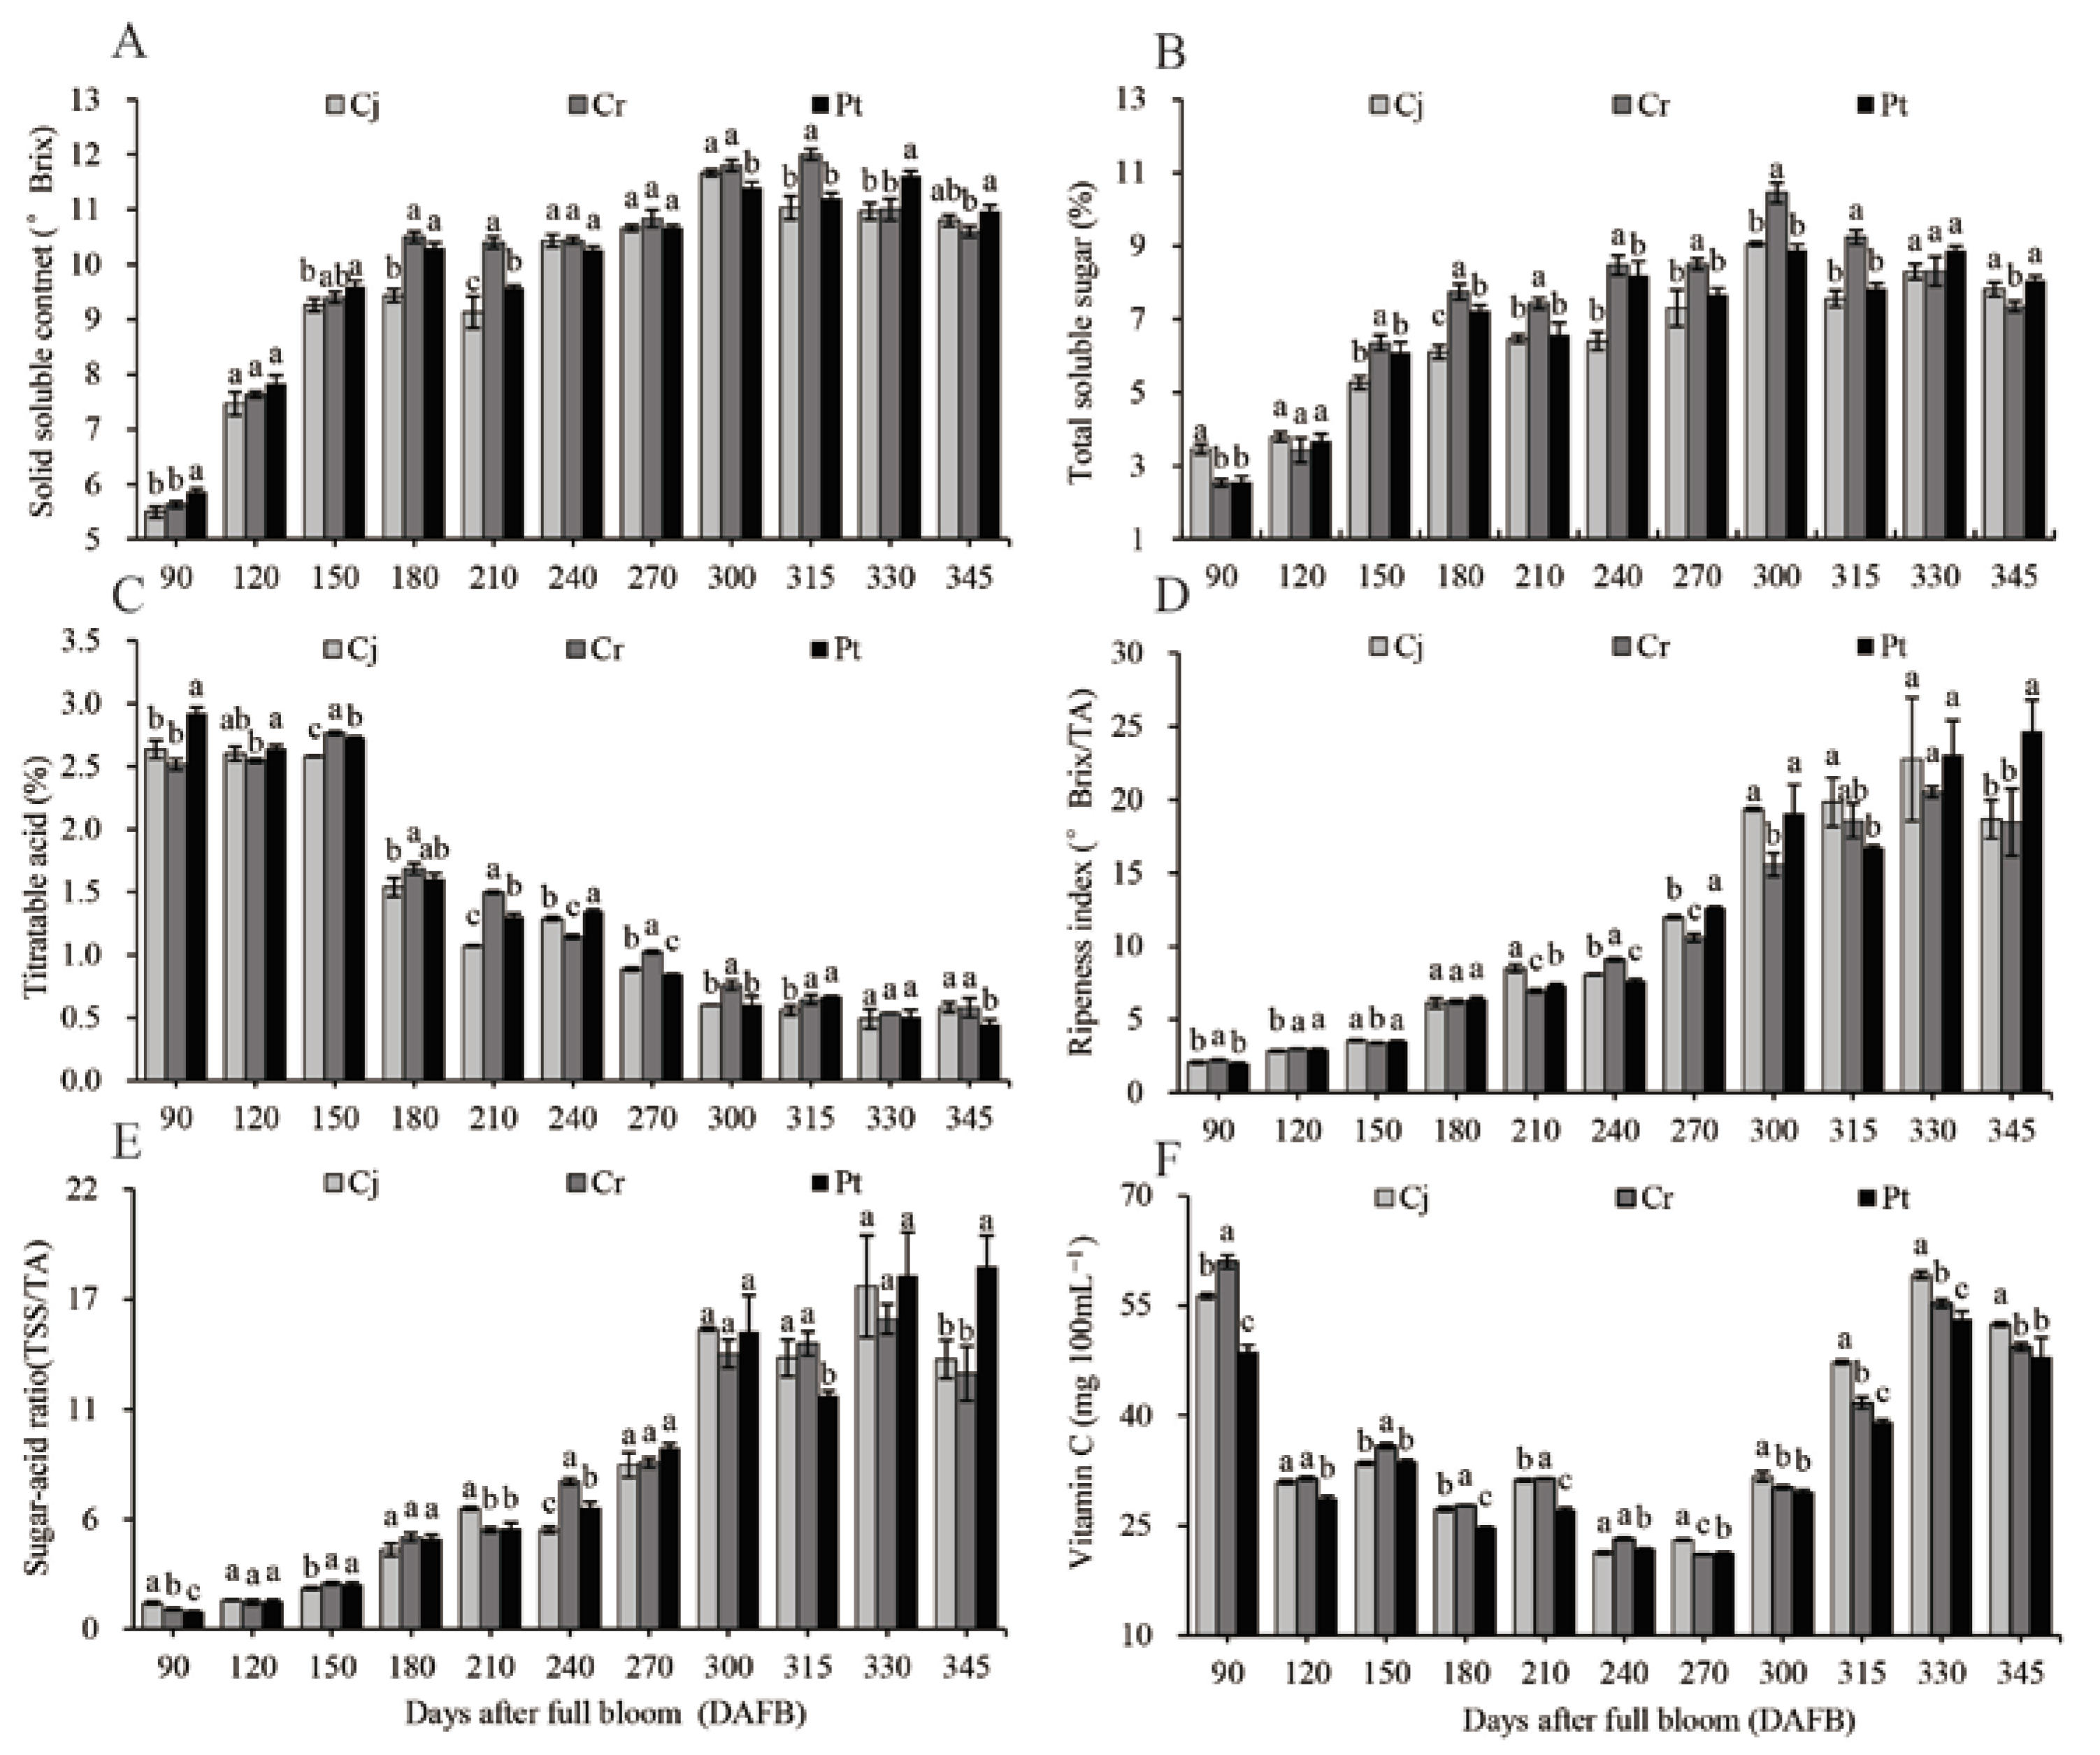
3.4. The SSC, TSS, TA, and Vc Analysis

The SSC, TSS, TA, and Vc fruit analyses are shown in Figure 4. The highest SSC for Cj (11.67 ± 0.06 ° Brix), Rt (12.00 ± 0.10 ° Brix), and Pt (11.60 ± 0.10 ° Brix) were observed at 300, 315, and 330 DAFB, respectively. A slight drop of 10.80–10.97 ° Brix was observed at harvest across all rootstocks. The rootstocks had no significant effect on the SSC of the fruits at harvest (Figure 4A). The TSS initially increased with fruit development, climaxing at 300 DAFB at 9.06% ± 0.06%, 10.45% ± 0.28%, and 8.89% ± 0.15% in the Cj, Cr, and Pt rootstocks, respectively, and then slightly decreased in the final ripening process. Compared with the other two groups, a significantly higher TSS was observed at harvest for Pt (8.06% ± 0.12%). Those of Cj and Cr were (7.82% ± 0.19%) and (7.36% ± 0.14%), respectively (Figure 4B).
TA slowly decreased between 90 and 150 DAFB, dramatically decreased between 150 and 180 DAFB, and decreased at a constant rate thereafter until 300 DAFB before stabilizing. At harvest, the TA was significantly lower (p < 0.05) in the Pt (0.45% ± 0.04%) oranges, relative to the Cj (0.58% ± 0.04%) and Cr (0.58% ± 0.08%) (Figure 4C) groups. A steady increase in SSC/TA (Figure 4D) and TSS/TA ratio (Figure 4E) positively correlated with the change in SSC (Figure 4A) and TSS (Figure 4B), but negatively with the change in TA (Figure 4C). Significantly higher SSC/TA (24.67 ± 2.12) and TSS/TA (18.14 ± 1.56) ratios (p < 0.05) were observed in the Pt group at harvest time. Compared with the two other groups, the SSC/TA (18.46 ± 2.29) and TSS/TA (12.79 ± 1.37) ratios (p < 0.05) were significantly low in the Cr group (Figure 4D,E).
The Vc content transiently peaked at 90 DAFB, reaching 56.32 ± 0.35, 60.99 ± 0.92, and 48.71 ± 0.93 mg 100 mL−1 FW in the Cj, Cr, and Pt, respectively. However, it rapidly decreased thereafter until 120 DAFB and slightly fluctuated during the veraison and early ripening stages. The Vc contents were 52.45 ± 0.28, 49.37 ± 0.57, and 47.96 ± 2.65 mg 100 mL−1 FW in Cj, Cr, and Pt, respectively (Figure 4F).

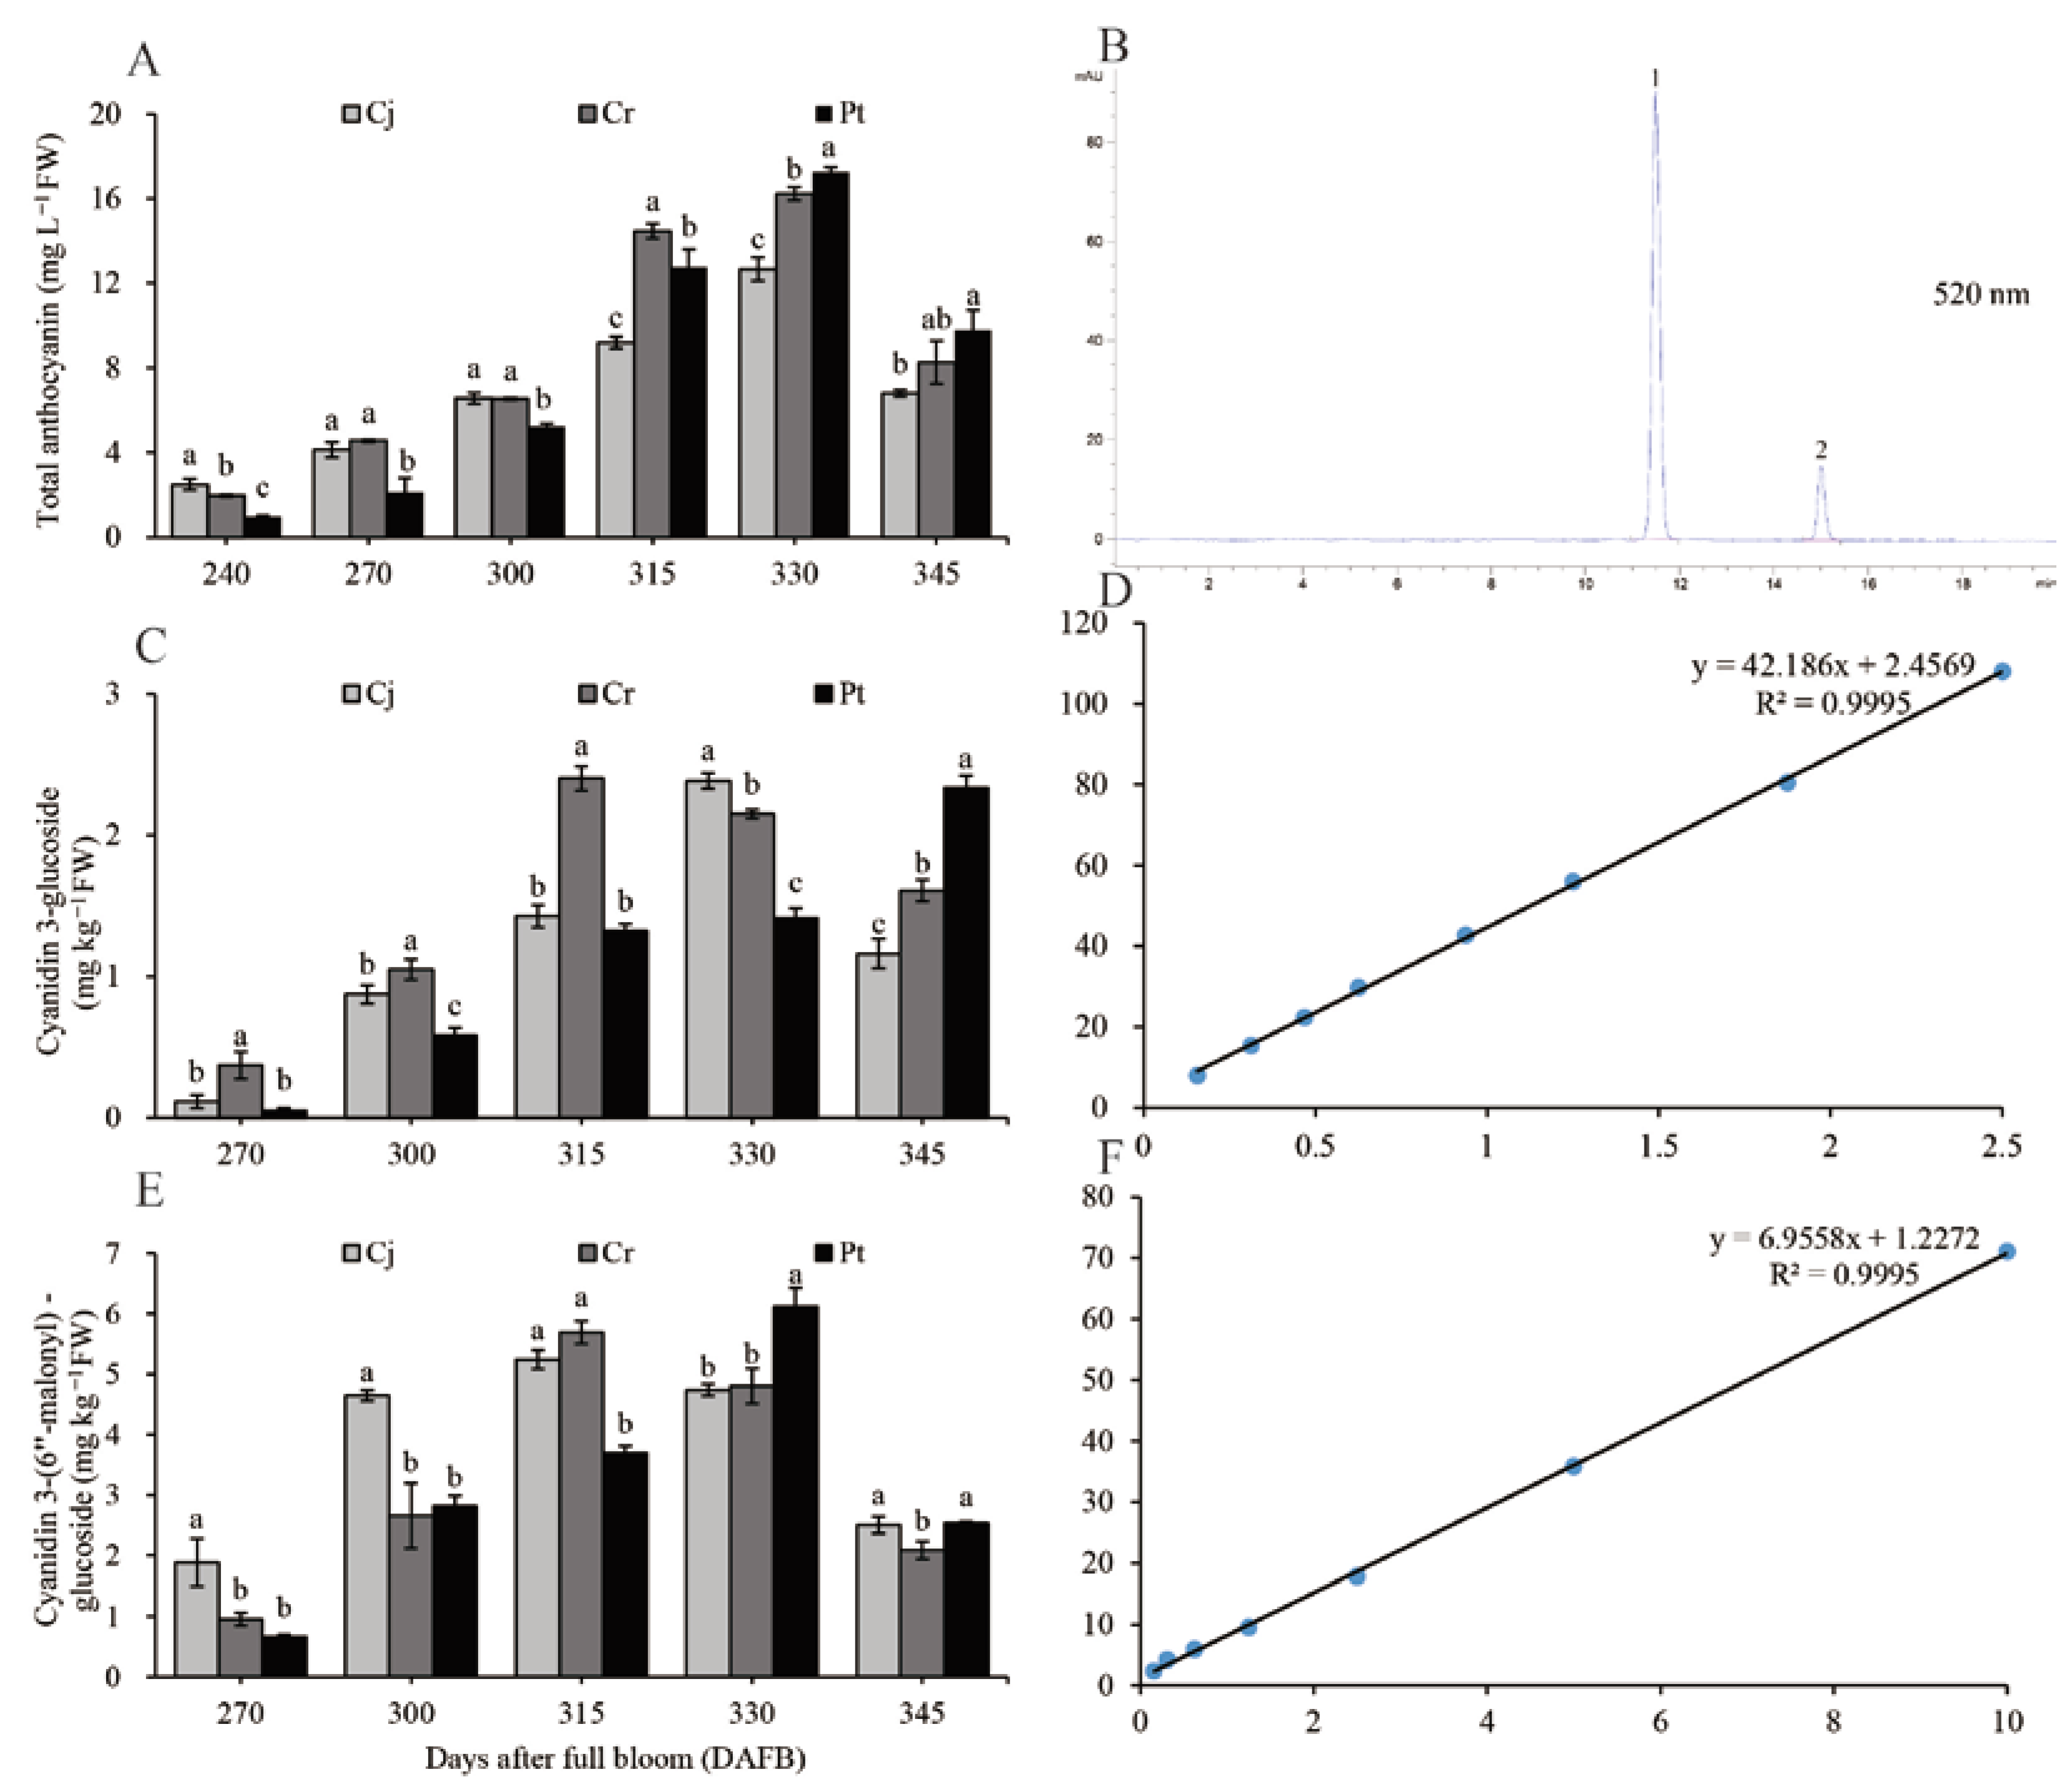
3.5. The Anthocyanin Concentration

The TAC increased from the veraison stage to 330 DAFB and peaked at 330 DAFB before gradually decreasing until harvest. There was a strong link between TAC of the whole blood orange fruit (Figure 5A) and changes in the color of the fresh epicarp (Figure 1). The number of total anthocyanins at maturity was the highest in the Pt (9.80 ± 0.92 mg L−1 FW) group, moderate in the Cr (8.27 ± 1.01 mg L−1 FW) group, and lowest in the Cj (6.80 ± 0.17 mg L−1 FW) group (Figure 5A). The HPLC chromatogram for the anthocyanin compositions acquired at 520 nm shows that C3G and CMG are the two most commonly detected anthocyanins (Figure 5B).
The C3G and CMG were quantified using the calibration curves based on reference standards. The simple linear regression equation for C3G was y = 42.186x + 2.4569. There was a very strong positive correlation between C3G and the peak area (R2 = 0.9995) (Figure 5D). The C3G concentration in Cj and Cr groups positively correlated with that of TAC, whereas in Pt, the C3G concentration continued to increase throughout the coloration and ripening period. At maturity, the C3G concentration was significantly higher in the Pt group (2.33 ± 0.09 mg kg−1 FW), relative to the Cj (1.16 ± 0.11 mg kg−1 FW) and Cr (1.61 ± 0.08 mg kg−1 FW groups (Figure 5C).
The linear regression equation for CMG can be expressed as y = 6.9558x + 1.2272. The correlation coefficient between the CMG standard concentration and the peak area was very high (R2 = 0.9995) (Figure 5F). Although the time for achieving the maximum CMG concentration varied among the three groups, the pattern of CMG accumulation was similar across the groups. The CMG concentration of the Pt (2.52 ± 0.12 mg kg−1 FW) and Cj groups (2.51 ± 0.14 mg kg−1 FW) (at maturity) was significantly higher than that of the Cr (2.09 ± 0.15 mg kg−1 FW) group (Figure 5E).

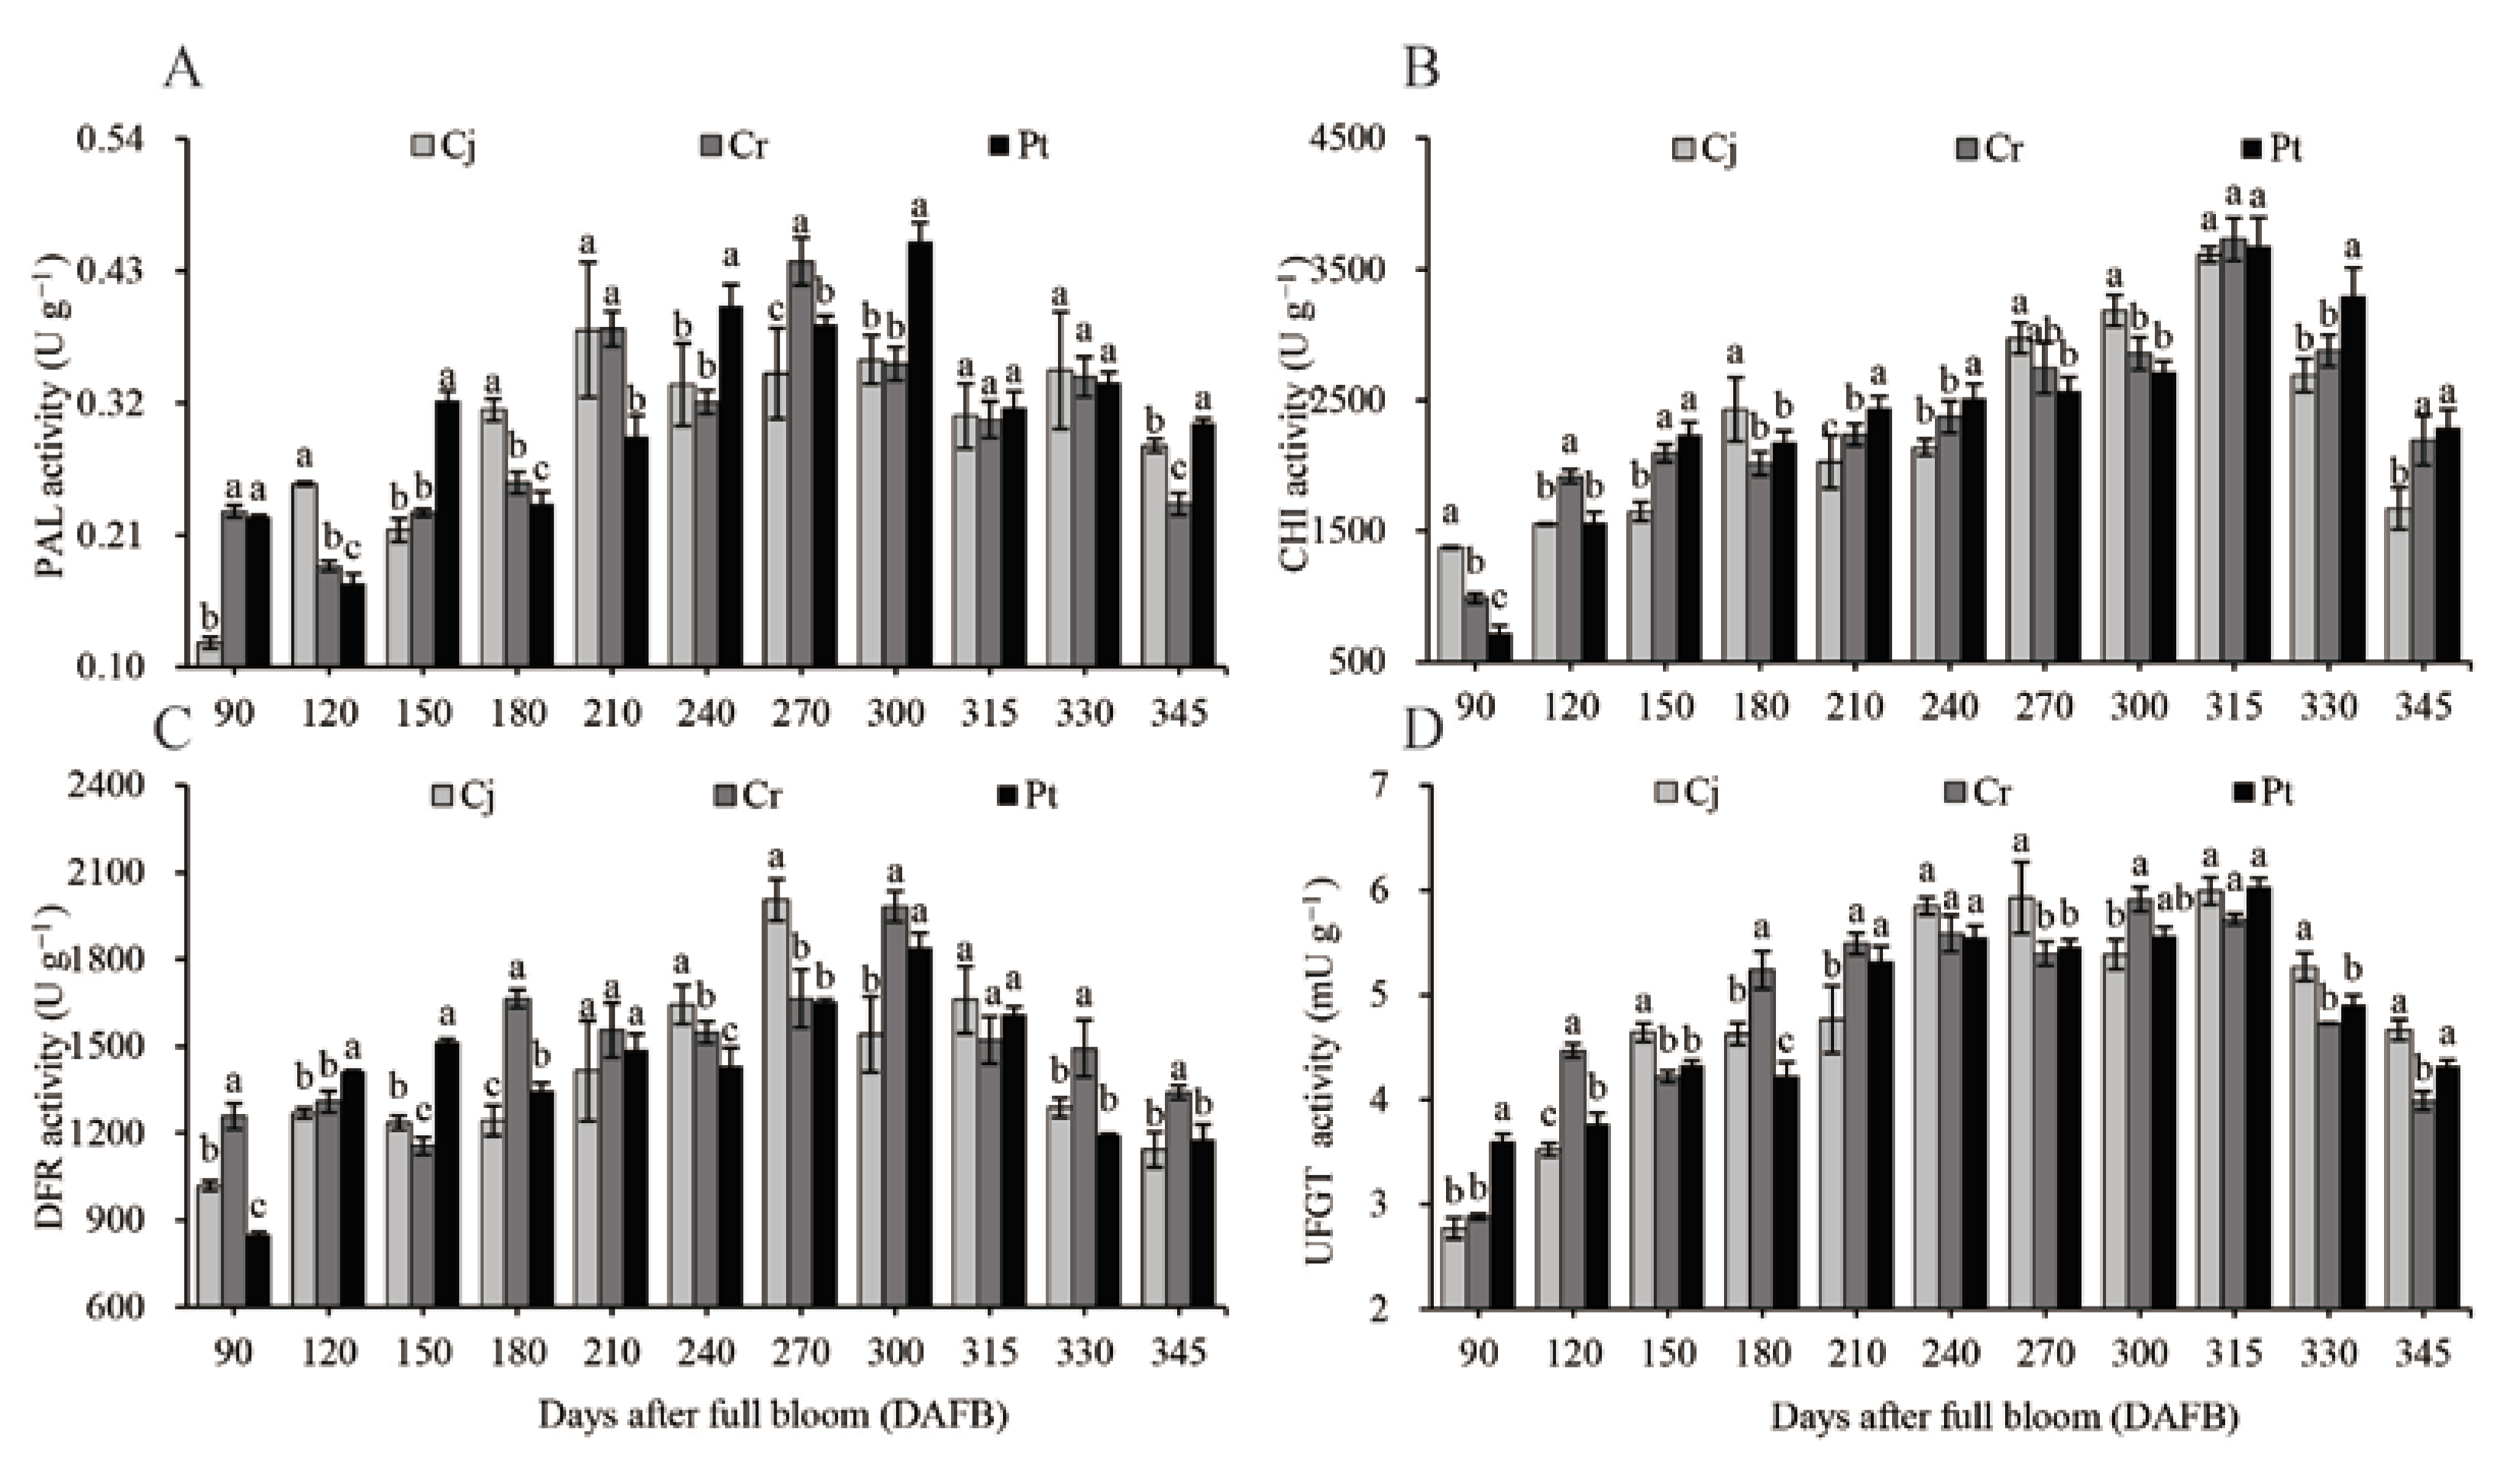
3.6. Activity of Enzyme for Anthocyanin Biosynthesis

The activities of four enzymes (PAL, CHI, DFR, and UFGT), essential for anthocyanin biosynthesis in blood orange, were investigated during the development and ripening of the fruit (Figure 6). The highest PAL activity (0.46 ± 0.02 U g−1) in Pt was observed at the early ripening stages (300 DAFB) (Figure 6A). The highest anthocyanin concentration (Figure 5A) and composition (Figure 5C,E) were observed in Pt group at harvest. In the rootstocks, the PAL activity was highest in the Pt (0.30 ± 0.00 U g−1) group, medium in the Cj (0.28 ± 0.01 U g−1) group, and lowest in the Cr (0.24 ± 0.01 U g−1) group (Figure 6A). The CHI activity initially increased during the expansion stages, and remained relatively stable in the veraison stages. It again increased in the early ripening stages and declined in the later stages. The highest CHI activity was observed at 315 DAFB, reaching 3613.01 ± 59.50, 3729.71 ± 161.53, and 3676.16 ± 217.73 U g−1 in the Cj, Cr, and Pt groups, respectively. The activity of the CHI enzyme was significantly higher in Pt group (2288.22 ± 140.57 U g−1) and Cr groups (2194.33 ± 187.72 U g−1) than in group Cj (1672.68 ± 159.61 U g−1) at harvest (Figure 6B). The activity of DFR in the pulp increased at the expansion and veraison stages but decreased at the ripening stages (300–345 DAFB). At harvest, the DFR activity was highest in the Cr (1339.82 ± 22.71 U g−1) group, moderate in the Pt group (1178.03 ± 53.12), and lowest in the Cj group (1142.82 ± 61.13 U g−1) (Figure 6C). The activity of UFGT increased with time until ripening before decreasing/stabilizing. The UFGT activity was significantly lower in the Cr (3.99 ± 0.09 mU g−1) group, compared to the Cj (4.67 ± 0.10) and Pt (4.33 ± 0.05 mU g−1) groups at the final stages (Figure 6D).

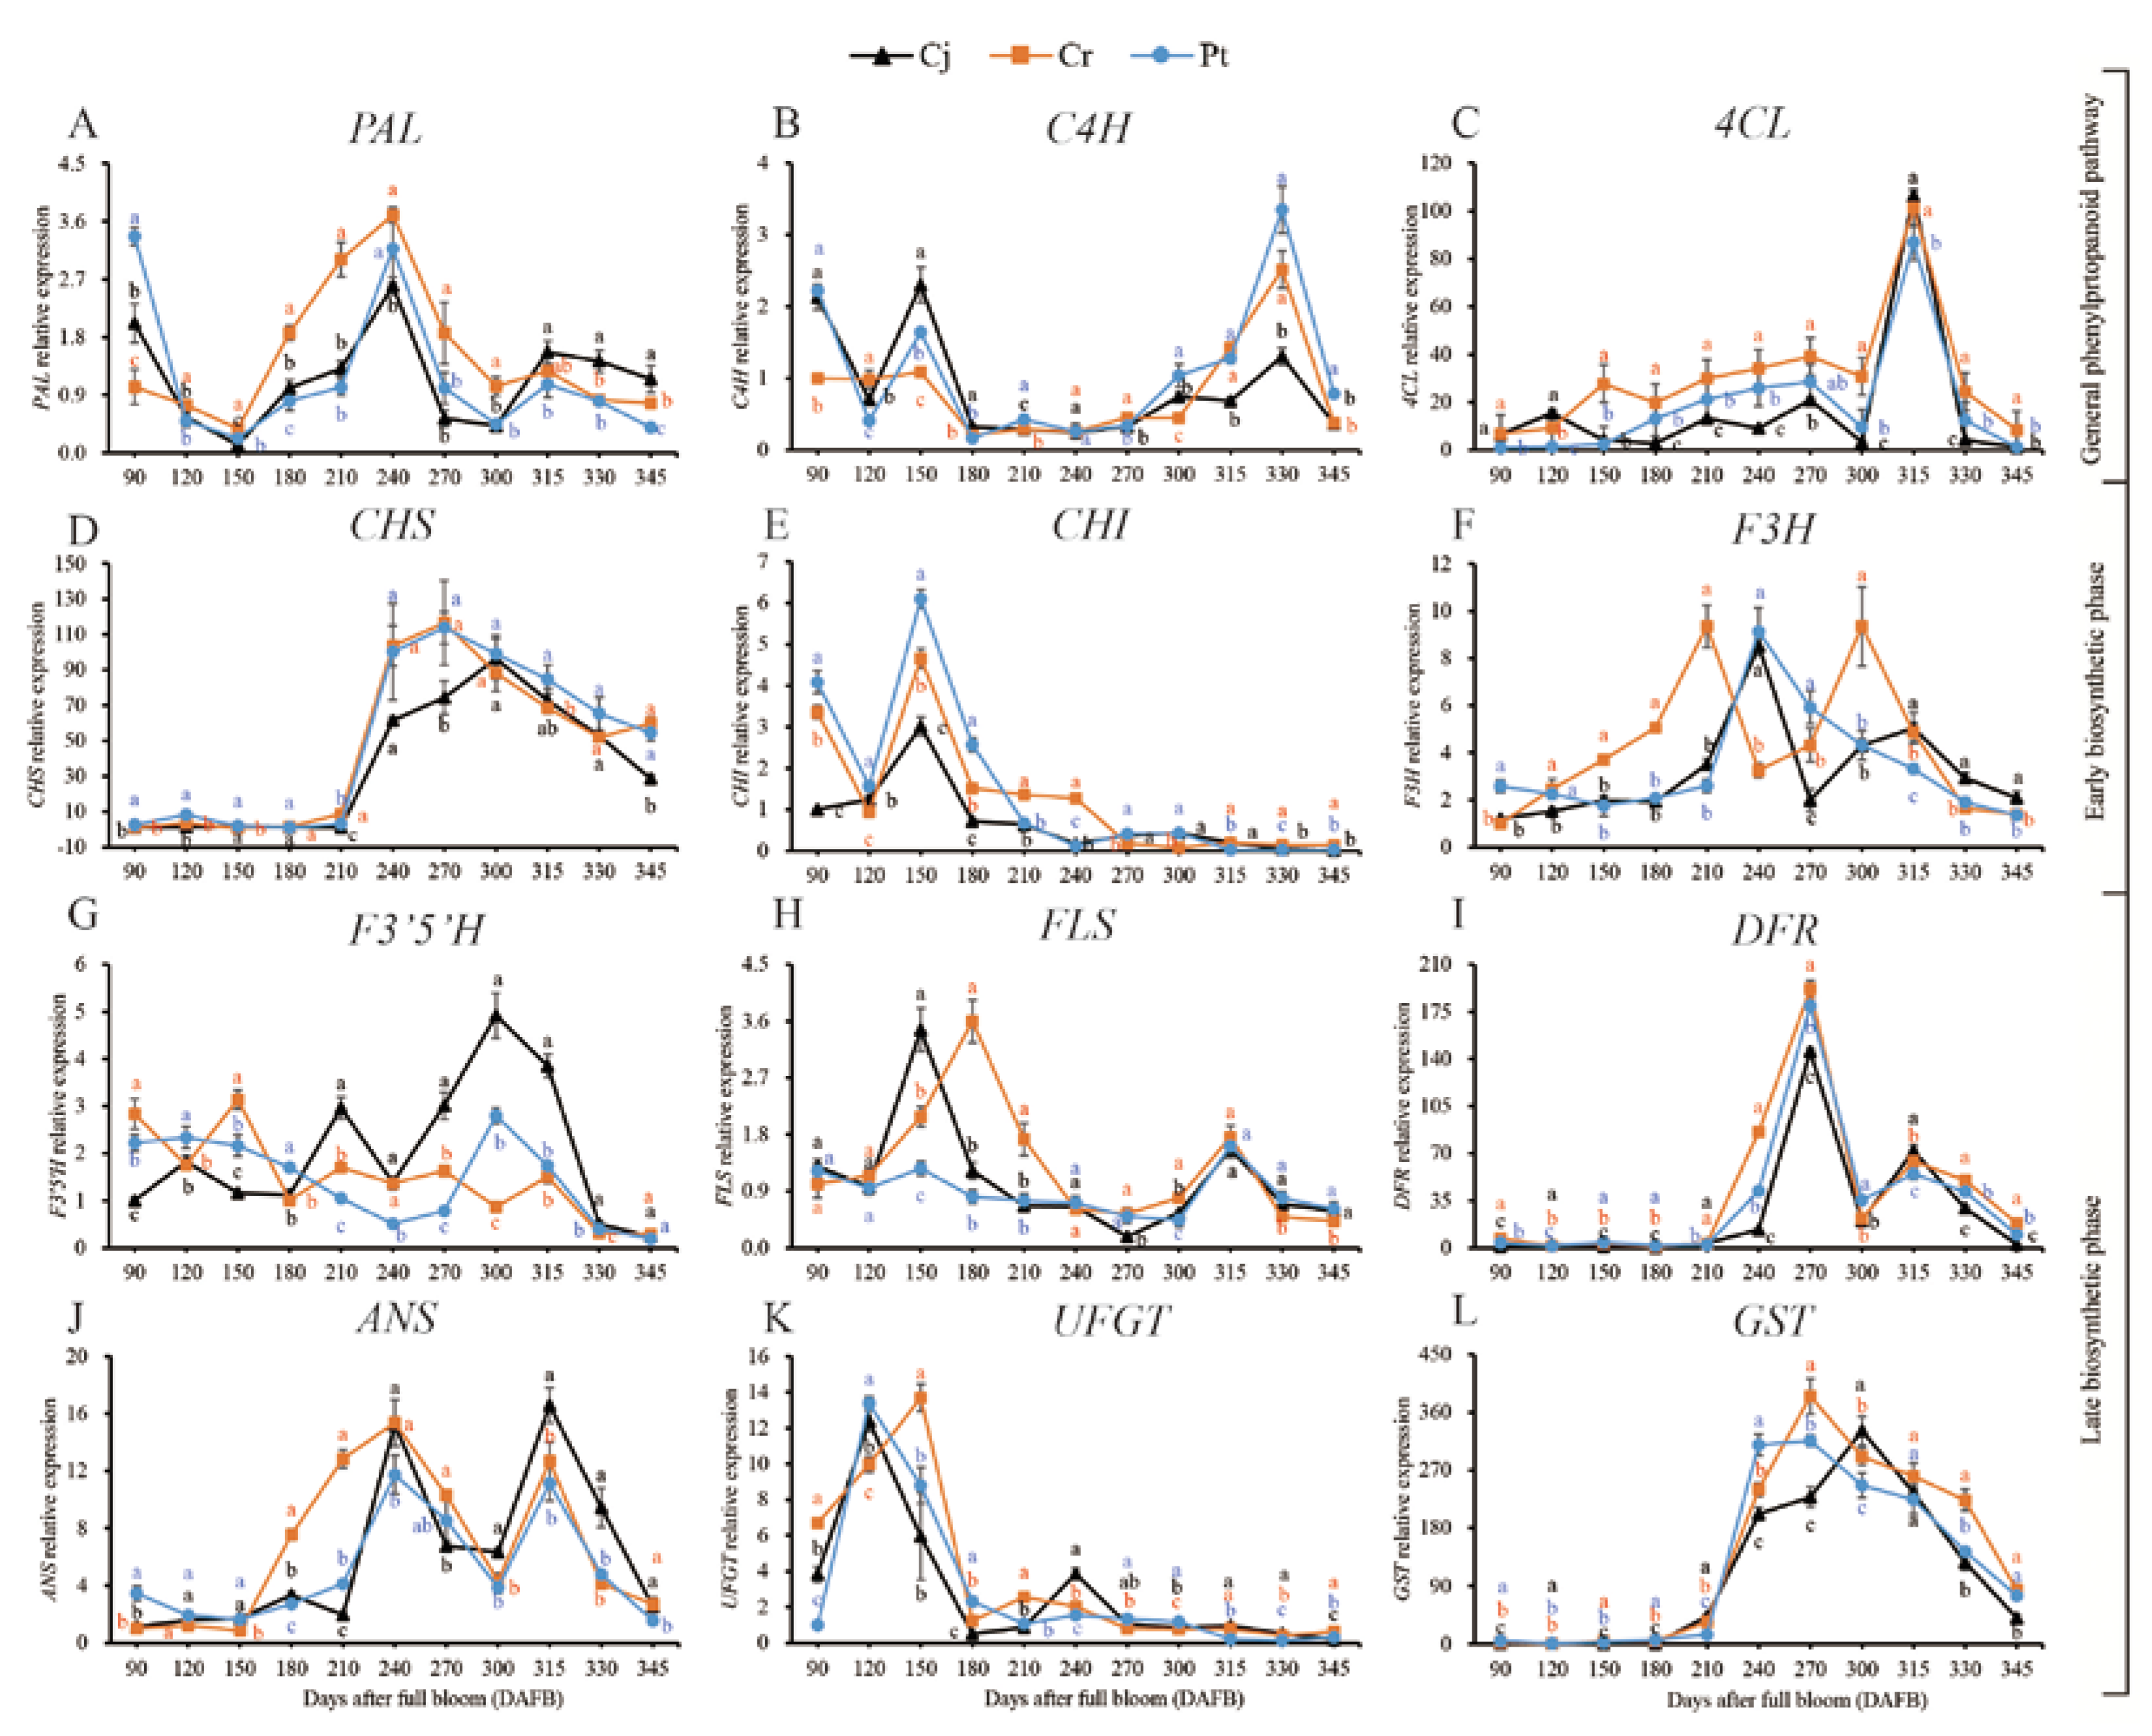
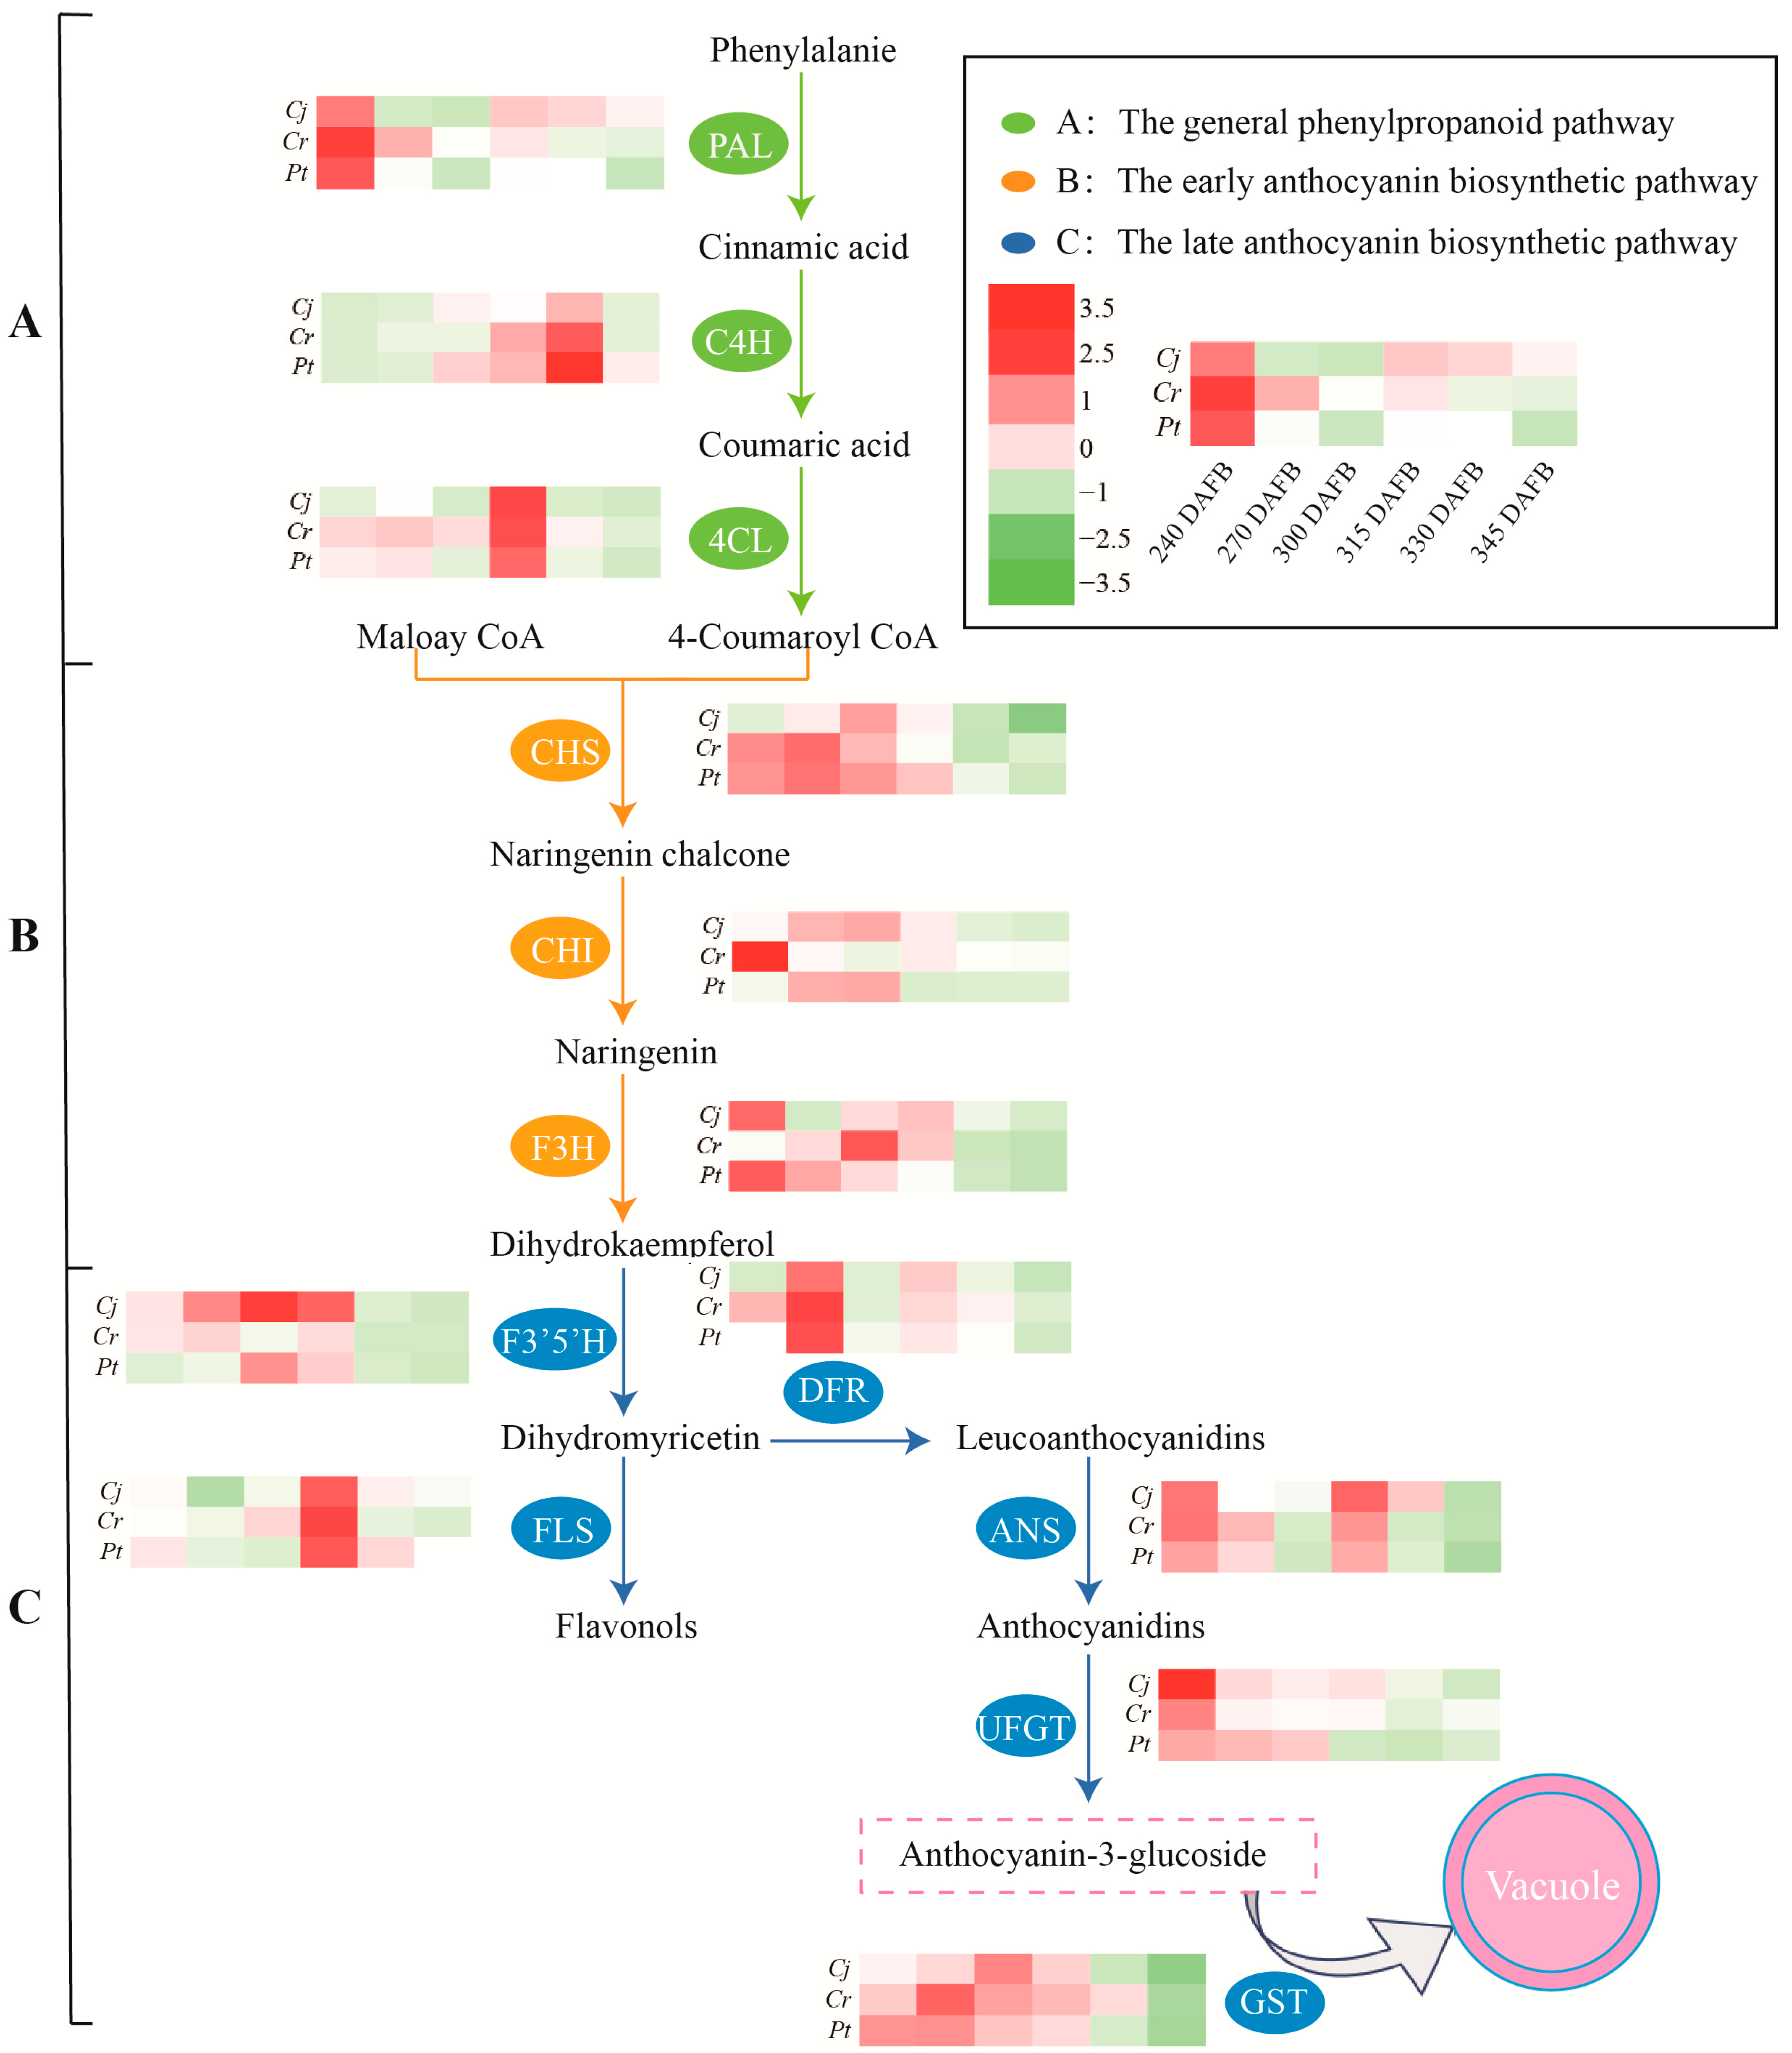
3.7. Expression of Genes for Anthocyanin Biosynthetic

The expressions of key anthocyanin biosynthesis-related genes in blood oranges grafted on different rootstocks during developmental and ripening periods were analyzed using qRT-PCR. According to previous studies [28,29], the anthocyanin biosynthesis pathway can be divided into the phenylpropanoid, early biosynthetic, and late biosynthetic pathways (Figure 7 and Figure 8).
In the phenylpropanoid pathway, PAL was expressed at the beginning of the cell expansion stage before it decreased, reaching the lowest level at 150 DAFB. The expression of PAL thereafter increased, peaking at the veraison stage at 315 DAFB. At the final ripening stages, generally one month before maturity, the PAL expression was significantly (p < 0.05) higher in the Cj than that in both the Cr and Pt groups (Figure 7A). The expression of C4H first peaked at 150 DAFB and remained relatively unchanged over the veraison period. A secondary peak occurred at 330 DAFB. At the final ripening stages, the C4H expression was significantly (p < 0.05) higher in the Pt than in the Cj and Cr group (Figure 7B). The expression of 4CL increased slightly during the cell expansion and veraison phases, peaking at 315 DAFB (Figure 7C). At late developmental stages, the expression of 4CL genes was highest in the Cr group relative to the Cj and Pt (Figure 7C) groups. The expression patterns of C4H and 4CL were highly correlated with the dynamic changes in the anthocyanin concentration. In contrast, there was no correlation between the expression of the PAL gene and the accumulation of anthocyanins (Figure 7A–C). The expressions of PAL, C4H, and 4CL genes were higher at 240, 330, and 315 DAFB, respectively, than at the other five ripening stages of blood orange (Figure 8A).
In the early biosynthetic pathway, CHS expression was very low during the cell expansion stage but sharply increased thereafter, peaking at the onset of the early ripening (270–300 DAFB) phase (Figure 7D). CHI expression was strongly induced at the cell expansion stage, peaking at 150 DAFB, before drastically decreasing and remaining stable at a low level over the ripening time (Figure 7E). There was no difference in the expression of F3H across the three groups. The F3H gene had two expression peaks in the Cj and Cr groups at 240 and 210 DAFB in the Cj and Cr, respectively, and later, at 315 and 300 DAFB in the Cj and Cr groups, respectively. F3H expression was decreased during the initial stages of fruit development, peaking at 240 DAFB, and a further decay with maturation was observed in blood oranges from trees grafted onto Pt (Figure 7F). The expression of CHS, CHI, and F3H genes significantly decreased between 300 and 345 DAFB during the fruit ripening of blood orange (Figure 8B).
Six genes involved in the late anthocyanin biosynthetic pathway were identified, including F3′5′H, FLS, DFR, ANS, UFGT, and GST (Figure 8C). The F3′5′H expression differed remarkably among the three groups. In particular, F3′5′H expression slightly fluctuated before increasing during the cell expansion and veraison stages, peaking at 300 DAFB. A decline followed during the maturation stages in the Cj. In the Cr group, F3′5′H expression initially decreased before increasing and peaking at 150 DAFB followed by a gradual decrease. The expression of F3′5′H in the Pt group gradually decreased during the cell expansion and veraison stages before increasing in the ripening stages, peaking at 300 DAFB (Figure 7G). FLS expression peaked at cell expansion and ripening stages (Figure 7H). DFR expression remained low at the initial developmental stages and thereafter rapidly increased from the veraison stages, peaking at 270 DAFB and the ripening stage (Figure 7I). A similar trend was observed with ANS, whose expression peaked at 240 and 315 DAFB (Figure 7J). The expression of UFGT increased during the early developmental stages but reduced thereafter, reaching the lowest point at the maturity stage (Figure 7K). The GST expression remained relatively low until the veraison stage before increasing and peaking at the late fruit development stages (Figure 7L).

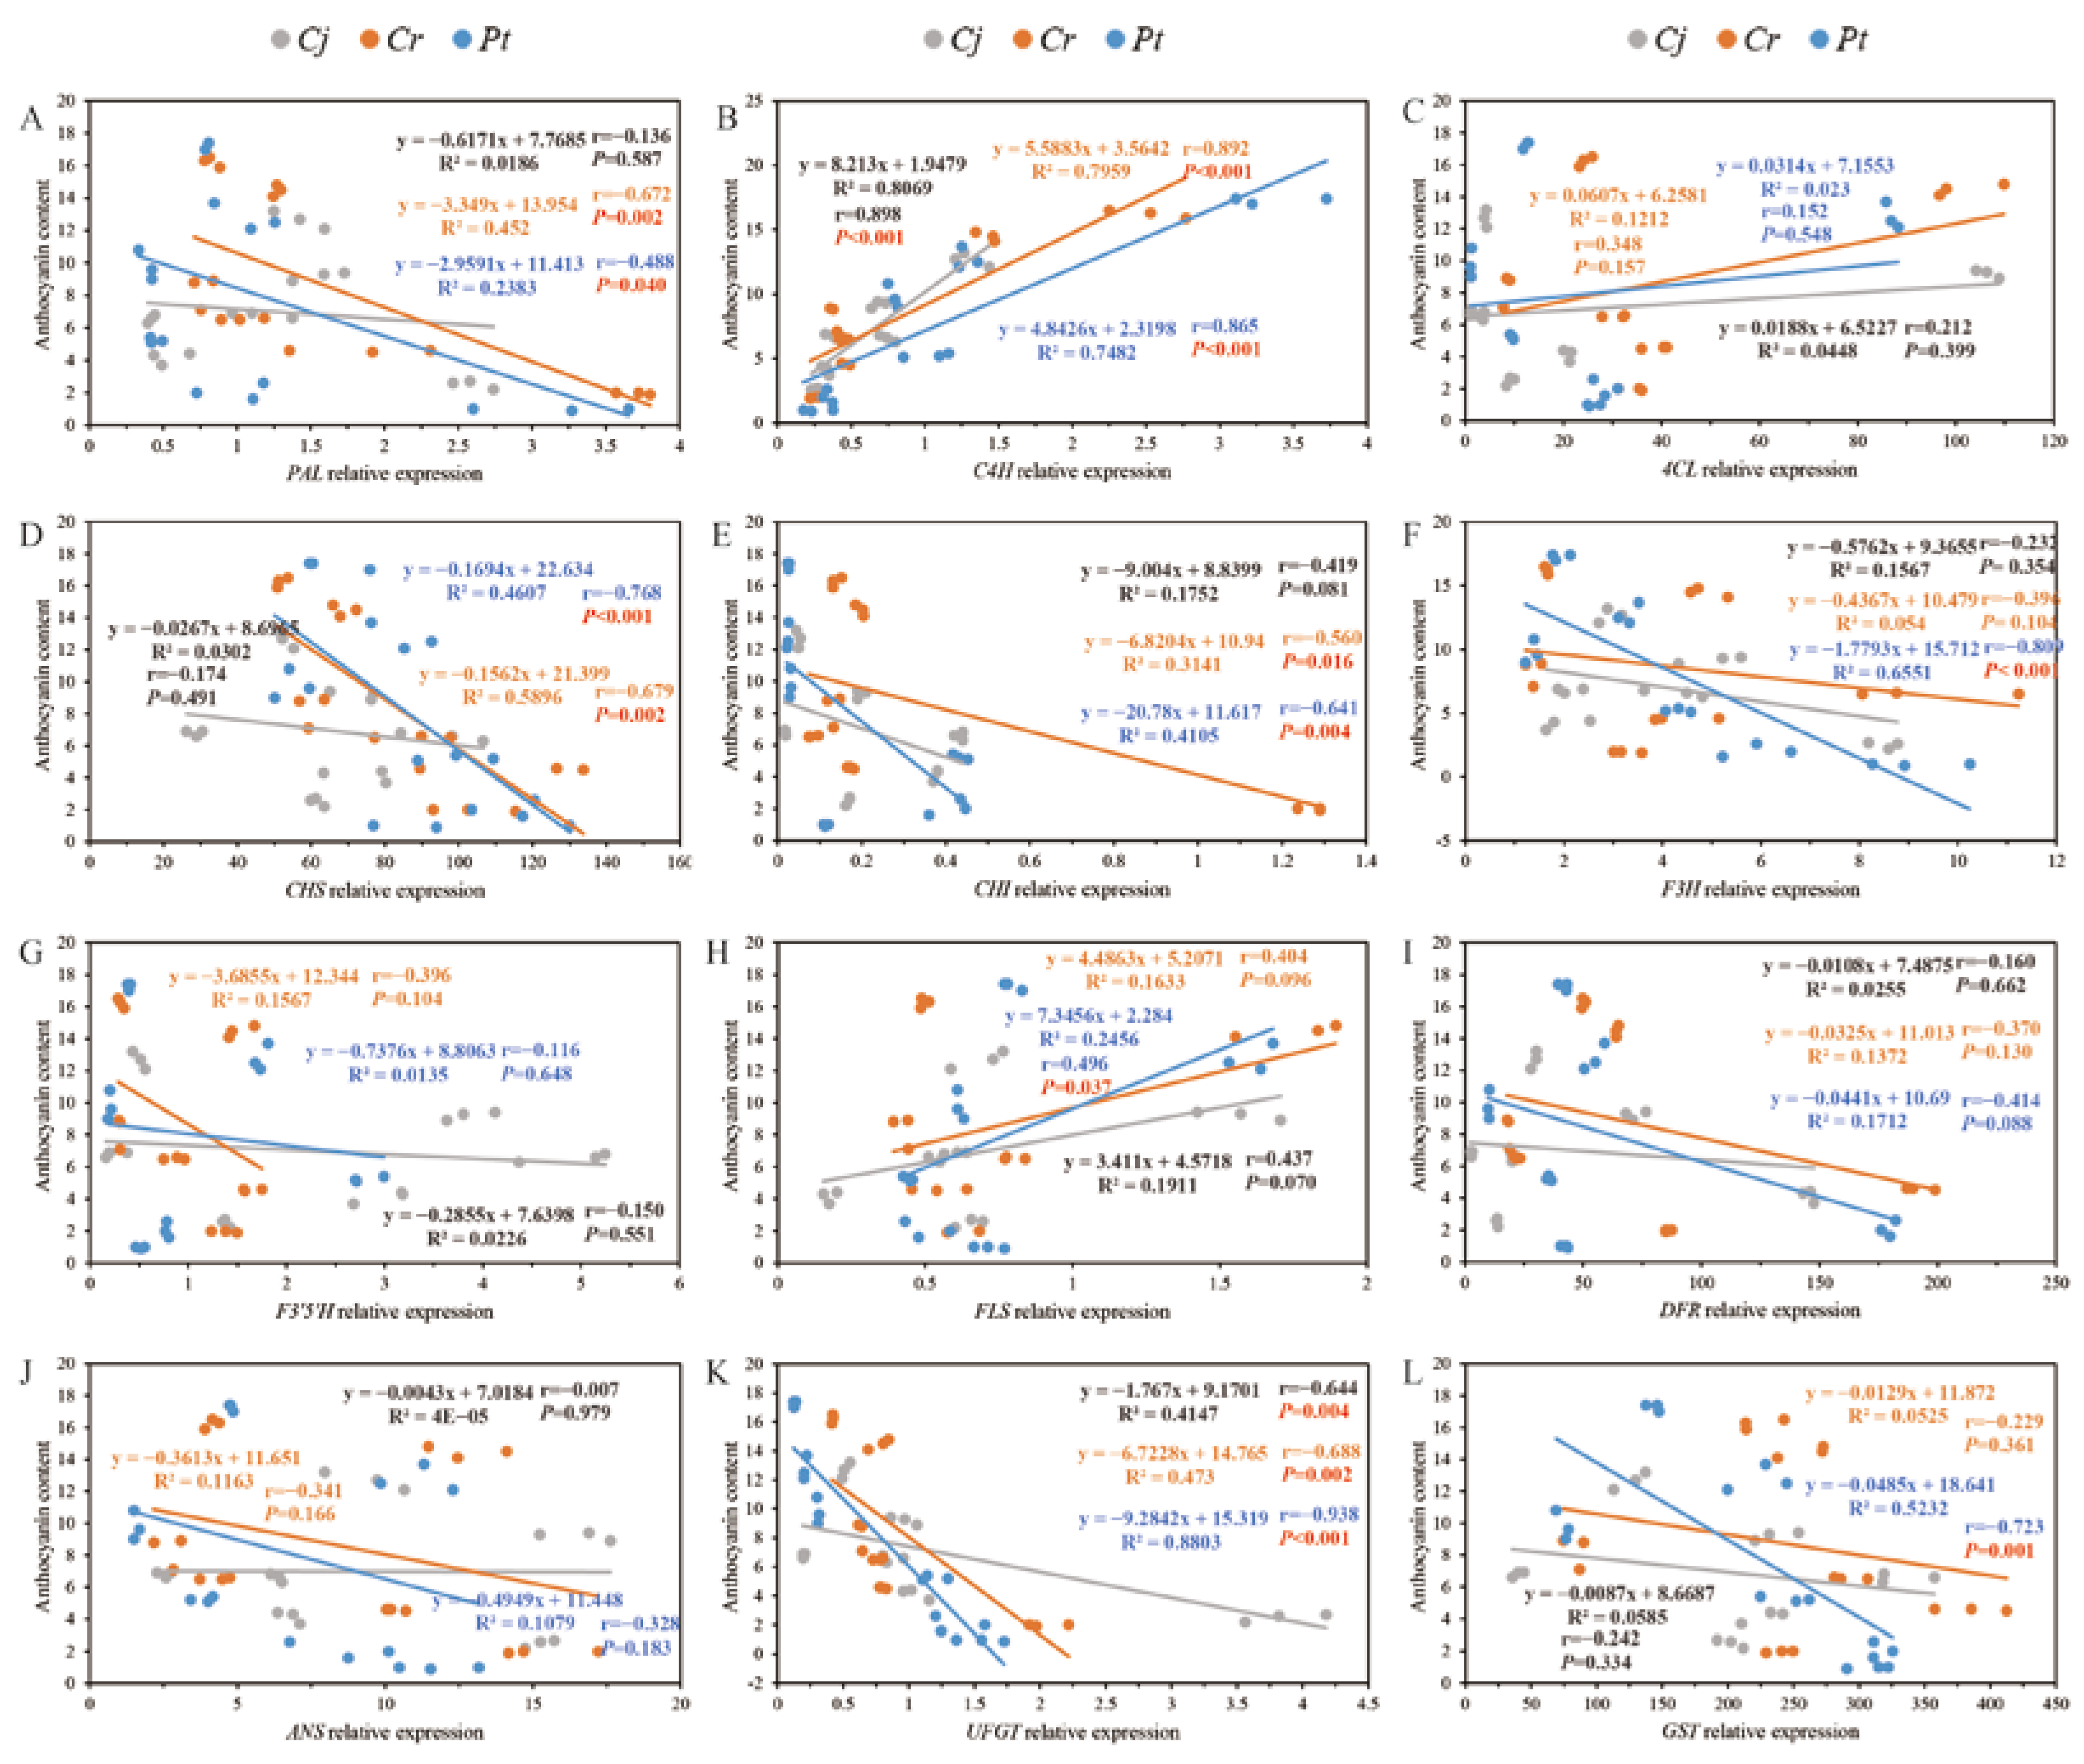
3.8. The Relationship between Anthocyanin Accumulation and Other Parameters (Enzyme Activity and Relative Gene Expression)

The association between anthocyanin concentration and the enzyme activity and expression of the related genes are shown in Figure 9 and Figure 10, respectively. We observed a strong positive correlation (r = 0.592 between anthocyanin concentration and the activity of CHI enzyme in the Cr and Pt (r = 0.662) groups (p < 0.01)). For the Pt group, there was a strong negative correlation between the anthocyanin concentration and the activity of PAL (r = −0.655, p < 0.01) and DFR (r = −0.497, p < 0.05) enzymes. For the Cj group, we found a strong negative correlation between the anthocyanin concentration and the activity of the DFR enzyme (r = −0.519, p < 0.05) (Figure 9).
There was a strong (p < 0.01) positive and negative correlation between the anthocyanin concentration and the expression of C4H and UFGT genes across the three groups. In addition, the anthocyanin concentration significantly (p < 0.05) correlated with PAL (r = −0.672), CHS (r = −0.679), and CHI (r = −0.560) gene expression in the Cr group. In the Pt group, the anthocyanin concentration significantly (p < 0.05) correlated with the expression of PAL (r = −0.488), CHS (r = −0.768), CHI (r = −0.641), F3H (r = −0.809), and GST (r = −0.723) genes (Figure 10).

4. Discussion

Grafting scion on rootstock is a common agronomical practice for improving the quality and yield of citrus fruits [7]. Despite Cj, Cr, and Pt being the main rootstocks for grafting citrus fruits in China, their effect on the content of biochemically essential compounds such as anthocyanin in the grafted blood orange had not been reported. In addition to pigmentation, anthocyanins possess antioxidation, antidiabetic, anticancer, anti-inflammatory, antimicrobial, and anti-obesity properties [5]. This study examined how the Cj, Cr, and Pt rootstocks affect the biochemical properties, anthocyanin concentration, and accumulation patterns, the expression of several anthocyanin biosynthesis-related genes, and the activities of anthocyanin biosynthesis-related enzymes from the cell expansion to the harvesting stages.
Like in other fruits, sugar and acid levels are the two major quality and taste determinants in citrus fruit, directly affecting consumers’ preferences [35]. In the present study, the 10.80–10.97 ° Brix at harvest (Figure 4A) for the ‘Tarocco’ blood orange was slightly lower than those reported in other blood orange cultivars, such as ‘Tarocco scire’, ‘Tarocco Rosso’, ‘Tarocco Ippolito’, and ‘Sanguinello’ which ranged between 12.57 and 15.30° Brix [1,20]. Among the three rootstocks, TSS and TA were the highest in the Pt group. Additionally, the SSC/TA (24.67 ± 2.12) and TSS/TA (18.14 ± 1.56) ratios were highest in the Pt group (Figure 4). The effect of Pt rootstock on SSC, TSS, and TA content in other citrus cultivars was previously reported. For example, Legua et al. found that SSC was highest in Carrizo citrange and trifoliata hybrids (FA 030212 and FA 030230), relative to the Cleopatra mandarin rootstock. High TA contents were also observed in Carrizo citrange and trifoliata hybrids (FA 418 and FA 030212) [36]. Lanal et al. found that the Vc content in ‘Tarocco Sciré’ decreased during the maturation stage, whereas the Vc of BIT rootstock peaked at the fully mature phase in March (304 DAFB) [19], consistent with our findings.
Consumers prefer fruit with attractive colors, with red being the most appealing color [37]. We found that the epicarp of oranges in the Pt group was a deep reddish-orange and blood-colored (Figure 1). Additionally, the pulps of oranges in the Pt group had a more deep/bright color than the other two rootstocks (Cj and Cr) (Figure 3). Previous studies have shown that the concentration of anthocyanins affects the pigmentation pattern of red-fleshed blood orange [4]. In the present study, the total anthocyanin concentration for the three scion/rootstock was the highest at the second last sampling (330 DAFB) stage. The TCA was higher in Pt than in the Cr and Cj groups. Recently, Lanal et al. and Ordóñez-Díaz et al. also observed significant differences in the TCA in blood oranges grafted onto different rootstocks [19,38]. The anthocyanins’ concentration (C3G and CMG) was highest in the Pt group, moderate in the Cr group, and lowest in the Cj group (Figure 5). In the current study, C3G and CMG were the most abundant anthocyanins in blood orange, consistently with previous findings [28].
To elucidate and ascertain the molecular mechanisms underlying the effects of rootstock on anthocyanin accumulation in blood orange, we evaluated the dynamic changes in anthocyanin biosynthesis. The anthocyanin biosynthesis pathway in plants, a branch of flavonoids’ metabolism, has been extensively studied [23]. The highly conserved network can be divided into the general phenylpropanoid pathway and the early and late biosynthetic pathway (Figure 7).
In the general phenylpropanoid pathway, PAL gene and anthocyanin accumulation displayed a negative correlation. Contrarily, C4H and 4CL exhibited a positive correlation with anthocyanin accumulation in blood orange (Figure 7A–C). This may be because PAL encodes for precursors for the biosynthesis of flavonoids in other pathways [21]. As one of the core genes of the phenylpropanoid pathway mediating the synthesis of anthocyanin [22], the expression of C4H (Figure 7B) strongly and positively correlated with that of anthocyanin concentration and was highly correlated with the dynamic changes of anthocyanin (Figure 10). C4H expression in Pt and Cr was higher than in Cj, and there was no significant difference in C4H expression at the ripening stage between groups Pt and Cr (Figure 7B). This may explain why the anthocyanin concentration was higher in the Pt group than in the Cj group. As a downstream gene to PAL activity, 4CL catalyzes the synthesis of phenylpropanoid monomers [22]. There was a strong correlation between 4CL (Figure 7C) activity and anthocyanin concentration, and its dynamic change correlated with anthocyanin concentration change (Figure 10), suggesting that 4CL participates in anthocyanin synthesis. Repression of DFR in blonde oranges [26] and its up-regulation in the pulp of pigmented citrus fruits [39] show that DFR is a key anthocyanin biosynthesis gene. DFR reached the highest expression at 270 DAFB, but its expression was significantly (p < 0.05)) lower in Pt than in Cj and Cr groups at the ripening stage. Thus, the negative correlation between DFR and anthocyanin accumulation in blood orange may explain why the anthocyanin concentration was lower in Cj and Cr groups than in the Pt group. A recent study revealed that the rootstock influences the expression of genes in the scion [40].
Correlation analysis (Figure 9 and Figure 10) revealed that the enzyme activity (Figure 9) and gene expression (Figure 10) strongly influence the anthocyanin concentration. The rootstock influences the activity of PAL in the scion. PAL catalyzes the biosynthesis of phenolic compounds, flavonoid, and anthocyanins [41]. The present study recorded the highest anthocyanin concentration at harvest in the Pt group (Figure 5B). In addition to the positive correlation between the enzymatic activity of CHI and anthocyanin concentration, the anthocyanin concentration in the Pt group was influenced by the activity of PAL and DFR enzymes (Figure 9). CHI is one of the key enzymes that regulate anthocyanin biosynthesis [42]. A strong correlation between CHI activity and the biosynthesis and accumulation of anthocyanins in red apples has been reported (Malus domestica Borkh.) [43]. The activity of PAL, a member of the aromatic amino acid ammonia-lyase enzymes family, is positively correlates with anthocyanin biosynthesis and accumulation in grapes (Vitis vinifera L.) [44], strawberries (Fragaria ananassa Duch) [45], and apples [46,47]. Even so, the role of the PAL enzyme in anthocyanin accumulation in apples remains controversial.
The present work represents a reliable comparative study of different rootstocks on fruit quality since all trees were grown under the same cultural conditions, and extraction and analysis were also performed under similar conditions. The primary sources of variation in the current study emanated from the development stages of the fruits and the rootstocks. The rootstock is an essential consideration in the production of the citrus orchard. Based on our findings, Pt is the best rootstock for producing highly marketable and nutritious blood oranges.

5. Conclusions

Rootstocks significantly influenced the yield and quality of blood oranges. In particular, they affected the color index, physicochemical parameters, and anthocyanin accumulation in ‘Tarocco’ blood orange during the fruit development and ripening stages. The highest anthocyanin concentration in blood orange grafted onto ‘Trifoliate orange’ (Poncirus trifoliata L. Raf., Pt) was observed at the harvest stage. Given the high gene expression and enzyme activity in the scion of ‘Tarocco’ blood orange, Pt is the best rootstock for grafting the orange.

Author Contributions

Conceptualization, H.D. and Z.W.; methodology, Z.C. and S.L.; statistical analysis, Z.C. and H.D.; investigation and data process, Z.C., H.D., L.Y., Y.Y. and L.T.; writing—original draft preparation, Z.C.; writing—review and editing, Z.C., H.D., B.X. and Z.W.; supervision, S.H. and G.S.; project administration, Z.W. All authors have read and agreed to the published version of the manuscript.

Funding

This research was supported by the Sichuan Science and Technology Programs (2021YFN0025 and 2021YFYZ0023) and the National Key R&D Program of China (2021YFD1600802).

Institutional Review Board Statement

Not applicable.

Informed Consent Statement

Not applicable.

Data Availability Statement

Not applicable.

Conflicts of Interest

The authors declare no conflict of interest.

References

  1. Cebadera-Miranda, L.; Domínguez, L.; Dias, M.I.; Barros, L.; Ferreira, I.C.; Igual, M.; Martínez-Navarrete, N.; Fernández-Ruiz, V.; Morales, P.; Cámara, M. Sanguinello and Tarocco (Citrus sinensis [L.] Osbeck): Bioactive compounds and colour appearance of blood oranges. Food Chem. 2014, 270, 395–402. [Google Scholar] [CrossRef] [Green Version]
  2. Grosso, G.; Galvano, F.; Mistretta, A.; Marventano, S.; Nolfo, F.; Calabrese, G.; Buscemi, S.; Drago, F.; Veronesi, U.; Scuderi, A. Red orange: Experimental models and epidemiological evidence of its benefits on human health. Oxidative Med. Cell. Longev. 2013, 2013, 157240. [Google Scholar] [CrossRef] [PubMed]
  3. Fallico, B.; Ballistreri, G.; Arena, E.; Brighina, S.; Rapisarda, P. Bioactive compounds in blood oranges (Citrus sinensis (L.) Osbeck): Level and intake. Food Chem. 2017, 215, 67–75. [Google Scholar] [CrossRef] [PubMed]
  4. Butelli, E.; Licciardello, C.; Zhang, Y.; Liu, J.; Mackay, S.; Bailey, P.; Reforgiato-Recupero, G.; Martin, C. Retrotransposons control fruit-specific, cold-dependent accumulation of anthocyanins in blood oranges. Plant Cell 2012, 24, 1242–1255. [Google Scholar] [CrossRef] [Green Version]
  5. Speer, H.; D’Cunha, N.M.; Alexopoulos, N.I.; McKune, A.J.; Naumovski, N. Anthocyanins and human health—a focus on oxidative stress, inflammation and disease. Antioxidants 2020, 9, 366. [Google Scholar] [CrossRef] [PubMed]
  6. Caruso, M.; Ferlito, F.; Licciardello, C.; Allegra, M.; Strano, M.C.; Di Silvestro, S.; Russo, M.P.; Paolo, D.P.; Caruso, P.; Casas, G.L.; et al. Pomological diversity of the Italian blood orange germplasm. Sci. Hortic. 2016, 213, 331–339. [Google Scholar] [CrossRef]
  7. Bowman, K.D.; Joubert, J. Citrus Rootstocks. In The Genus Citrus; Talon, M., Caruso, M., Gmitter, F., Eds.; Woodhead Publishing: Duxford, UK; Elsevier: Duxford, UK, 2020; pp. 105–127. [Google Scholar] [CrossRef]
  8. Warschefsky, E.J.; Klein, L.L.; Frank, M.H.; Chitwood, D.H.; Londo, J.P.; Von Wettberg, E.J.B.; Miller, A.J. Rootstocks: Diversity, domestication, and impacts on shoot phenotypes. Trends Plant Sci. 2016, 21, 418–437. [Google Scholar] [CrossRef]
  9. Liu, J.; Chen, K.; Hu, Q.; Yang, M.; Zhou, Q.; Li, H.; Jian, H.; Guan, B. Preliminary study on Ziyang xiangcheng (Citrus junos Sieb.ex Tanaka), a special local citrus germplasm. Southwest China J. Agric. Sci. 2008, 21, 1658–1660, (In Chinese with English Abstract). [Google Scholar]
  10. Usman, M.; Fatima, B. Mandarin (Citrus Reticulata Blanco) breeding. In Advances in Plant Breeding Strategies: Fruits; Al-Khayri, J.M., Jain, S.M., Johnson, D., Eds.; Springer International Publishing: Cham, Switzerland, 2018; pp. 465–533. [Google Scholar] [CrossRef]
  11. Guo, W.; Deng, X. Wide somatic hybrids of Citrus with its related genera and their potential in genetic improvement. Euphytica 2001, 118, 175–183. [Google Scholar] [CrossRef]
  12. Swingle, W.T.; Reece, P.C. The Botany of Citrus and Its Wild Relatives. In The Citrus Industry; Reuther, W., Webber, H.J., Batchelor, L., Eds.; University of California Press: Berkeley, CA, USA, 1967; Volume 1, pp. 190–430. [Google Scholar]
  13. Parvaneh, T.; Abedi, B.; Davarynejad, G.H.; Ganji Moghadam, E. Enzyme activity, phenolic and flavonoid compounds in leaves of Iranian red flesh apple cultivars grown on different rootstocks. Sci. Hortic. 2019, 246, 862–870. [Google Scholar] [CrossRef]
  14. Font i Forcada, C.; Gogorcena, Y.; Moreno, M. Fruit sugar profile and antioxidants of peach and nectarine cultivars on almond×peach hybrid rootstocks. Sci. Hortic. 2013, 164, 563–572. [Google Scholar] [CrossRef] [Green Version]
  15. Milošević, T.; Milošević, N.; Mladenović, J. Combining fruit quality and main antioxidant attributes in the sour cherry: The role of new clonal rootstock. Sci. Hortic. 2020, 265, 109236. [Google Scholar] [CrossRef]
  16. Ochmian, I.; Oszmiański, J.; Lachowicz, S.; Krupa-Małkiewicz, M. Rootstock effect on physico-chemical properties and content of bioactive compounds of four cultivars Cornelian cherry fruits. Sci. Hortic. 2019, 256, 108588. [Google Scholar] [CrossRef]
  17. Cheng, J.; Wei, L.; Mei, J.; Wu, J. Effect of rootstock on phenolic compounds and antioxidant properties in berries of grape (Vitis vinifera L.) cv. ‘Red Alexandria’. Sci. Hortic. 2017, 217, 137–144. [Google Scholar] [CrossRef]
  18. Incesu, M.; Çimen, B.; Yesiloglu, T.; Yilmaz, B. Rootstock effects on yield, fruit quality, rind and juice color of “Moro” blood orange. J. Food Agric. Environ. 2013, 11, 867–871. [Google Scholar]
  19. Lana, G.; Modica, G.; Casas, G.L.; Siracusa, L.; La Malfa, S.; Gentile, A.; Sicilia, A.; Distefano, G.; Continella, A. Molecular insights into the effects of rootstocks on maturation of blood oranges. Horticulturae 2021, 7, 468. [Google Scholar] [CrossRef]
  20. Continella, A.; Pannitteri, C.; La Malfa, S.; Legua, P.; Distefano, G.; Nicolosi, E.; Gentile, A. Influence of different rootstocks on yield precocity and fruit quality of ‘Tarocco Scirè’ pigmented sweet orange. Sci. Hortic. 2018, 230, 62–67. [Google Scholar] [CrossRef]
  21. Nakazawa, A.; Nozue, M.; Yasuda, H.; Takeba, G.; Kubo, H. Expression pattern and gene structure of phenylalanine ammonia-lyase in Pharbitis nil. J. Plant Res. 2001, 114, 323–328. [Google Scholar] [CrossRef]
  22. Nishiyama, Y.; Yun, C.S.; Matsuda, F.; Sasaki, T.; Saito, K.; Tozawa, Y. Expression of bacterial tyrosine ammonia-lyase creates a novel p-coumaric acid pathway in the biosynthesis of phenylpropanoids in Arabidopsis. Planta 2010, 232, 209–218. [Google Scholar] [CrossRef]
  23. Winkel-Shirley, B. Flavonoid biosynthesis. A colorful model for genetics, biochemistry, cell biology, and biotechnology. Plant Physiol. 2001, 126, 485–493. [Google Scholar] [CrossRef] [Green Version]
  24. Sicilia, A.; Scialò, E.; Puglisi, I.; Lo Piero, A.R. Anthocyanin biosynthesis and DNA methylation dynamics in sweet orange fruit [Citrus sinensis L. (Osbeck)] under cold stress. J. Agric. Food Chem. 2020, 68, 7024–7031. [Google Scholar] [CrossRef] [PubMed]
  25. Wen, W.; Alseekh, S.; Fernie, A.R. Conservation and diversification of flavonoid metabolism in the plant kingdom. Curr. Opin. Plant Biol. 2020, 55, 100–108. [Google Scholar] [CrossRef] [PubMed]
  26. Lo Piero, A.R.; Puglisi, I.; Petrone, G. Gene isolation, analysis of expression, and in vitro synthesis of glutathione s-transferase from orange fruit [Citrus sinensis L. (Osbeck)]. J. Agric. Food Chem. 2006, 54, 9227–9233. [Google Scholar] [CrossRef] [PubMed]
  27. Tanaka, Y.; Sasaki, N.; Ohmiya, A. Biosynthesis of plant pigments: Anthocyanins, betalains and carotenoids. Plant J. 2008, 54, 733–749. [Google Scholar] [CrossRef]
  28. Lo Piero, A.R. The state of the art in biosynthesis of anthocyanins and its regulation in pigmented sweet oranges [(Citrus sinensis L. (Osbeck)]. J. Agric. Food Chem. 2015, 63, 4031–4041. [Google Scholar] [CrossRef]
  29. Carmona, L.; Zacarías, L.; Rodrigo, M.J. Stimulation of coloration and carotenoid biosynthesis during postharvest storage of “Navelina” orange fruit at 12 °C. Postharvest Biol. Technol. 2012, 74, 108–117. [Google Scholar] [CrossRef]
  30. Chen, M.; Xie, X.; Lin, Q.; Chen, J.; Grierson, D.; Yin, X.; Sun, C.; Chen, K. Differential expression of organic acid degradation-related genes during fruit development of Navel oranges (Citrus sinensis) in two habitats. Plant Mol. Biol. Report. 2013, 31, 1131–1140. [Google Scholar] [CrossRef]
  31. Rapisarda, P.; Fanella, F.; Maccarone, E. Reliability of analytical methods for determining anthocyanins in blood orange juices. J. Agric. Food Chem. 2000, 48, 2249–2252. [Google Scholar] [CrossRef]
  32. Liang, D.; Deng, H.; Deng, Q.; Lin, L.; Lv, X.; Wang, J.; Wang, Z.; Xiong, B.; Zhao, X.; Xia, H. Dynamic changes of phenolic compounds and their associated gene expression profiles occurring during fruit development and ripening of the Donghong kiwifruit. J. Agric. Food Chem. 2020, 68, 11421–11433. [Google Scholar] [CrossRef]
  33. Crifò, T.; Puglisi, I.; Petrone, G.; Recupero, G.R.; Piero, A.R.L. Expression analysis in response to low temperature stress in blood oranges: Implication of the flavonoid biosynthetic pathway. Gene 2011, 476, 1–9. [Google Scholar] [CrossRef]
  34. Liu, C.; Long, J.; Zhu, K.; Liu, L.; Chaoyang, L.; Zhang, H.; Linlin, L.; Xu, Q.; Deng, X. Characterization of a Citrus R2R3-MYB transcription factor that regulates the flavonol and hydroxycinnamic acid biosynthesis. Sci. Rep. 2016, 6, 25352. [Google Scholar] [CrossRef]
  35. Baldwin, E.A.; Bai, J.; Plotto, A.; Ritenour, M.A. Citrus fruit quality assessment; producer and consumer perspectives. Stewart Postharvest Rev. 2014, 10, 1–7. [Google Scholar]
  36. Legua, P.; Bellver, R.; Forner, J.B.; Forner-Giner, M.A. Trifoliata hybrids rootstocks for “Lane Late” navel orange in Spain. Sci. Agric. 2011, 68, 548–553. [Google Scholar] [CrossRef]
  37. Morales, J.; Tárrega, A.; Salvador, A.; Navarro, P.; Besada, C. Impact of ethylene degreening treatment on sensory properties and consumer response to citrus fruits. Food Res. Int. 2020, 127, 108641. [Google Scholar] [CrossRef] [PubMed]
  38. Ordóñez-Díaz, D.; Hervalejo, A.; Pereira-Caro, G.; Muñoz-Redondo, J.M.; Romero-Rodriguez, E.; Arenas-Arenas, F.J.; Moreno-Rojas, J.M. Effect of rootstock and harvesting period on the bioactive compounds and antioxidant activity of two orange cultivars (‘Salustiana’ and ‘Sanguinelli’) widely used in juice industry. Processes 2020, 8, 1212. [Google Scholar] [CrossRef]
  39. Catalano, C.; Ciacciulli, A.; Salonia, F.; Russo, M.P.; Caruso, P.; Caruso, M.; Russo, G.; Distefano, G.; Licciardello, C. Target-genes reveal species and genotypic specificity of anthocyanin pigmentation in citrus and related genera. Genes 2020, 11, 807. [Google Scholar] [CrossRef]
  40. Wu, J.X.; Cao, J.Y.; Su, M.; Feng, G.Z.; Xu, Y.H.; Yi, H.L. Genome-wide comprehensive analysis of transcriptomes and small RNAs offers insights into the molecular mechanism of alkaline stress tolerance in a citrus rootstock. Hortic. Res. 2019, 6, 33. [Google Scholar] [CrossRef] [PubMed] [Green Version]
  41. Nadernejad, N.; Ahmadimoghadam, A.; Hossyinifard, J.; Poorseyedi, S. Effect of different rootstocks on PAL activity and phenolic compounds in flowers, leaves, hulls and kernels of three pistachio (Pistacia vera L.) cultivars. Trees 2013, 27, 1681–1689. [Google Scholar] [CrossRef]
  42. Zhou, L.; Wang, Y.; Ren, L.; Shi, Q.; Zheng, B.; Miao, K.; Guo, X. Overexpression of Ps-CHI1, a homologue of the chalcone isomerase gene from tree peony (Paeonia suffruticosa), reduces the intensity of flower pigmentation in transgenic tobacco. Plant Cell Tissue Organ Cult. 2014, 116, 285–295. [Google Scholar] [CrossRef]
  43. Liu, Y.; Che, F.; Wang, L.; Meng, R.; Zhang, X.; Zhao, Z. Fruit coloration and anthocyanin biosynthesis after bag removal in non-red and red apples (Malus × domestica Borkh.). Molecules 2013, 18, 1549–1563. [Google Scholar] [CrossRef]
  44. Sparvoli, F.; Martin, C.; Scienza, A.; Gavazzi, G.; Tonelli, C. Cloning and molecular analysis of structural genes involved in flavonoid and stilbene biosynthesis in grape (Vitis vinifera L.). Plant Mol. Biol. 1994, 24, 743–755. [Google Scholar] [CrossRef] [PubMed]
  45. Cheng, G.W.; Breen, P.J. Activity of phenylalanine ammonia-lyase (PAL) and concentrations of anthocyanins and phenolics in developing strawberry fruit. J. Am. Soc. Hortic. Sci. 1991, 116, 865–869. [Google Scholar] [CrossRef]
  46. Ju, Z. Fruit bagging, a useful method for studying anthocyanin synthesis and gene expression in apples. Sci. Hortic. 1998, 77, 155–164. [Google Scholar] [CrossRef]
  47. Kim, S.H.; Lee, J.R.; Hong, S.T.; Yoo, Y.K.; An, G.; Kim, S.R. Molecular cloning and analysis of anthocyanin biosynthesis genes preferentially expressed in apple skin. Plant Sci. 2003, 165, 403–413. [Google Scholar] [CrossRef]
Figure 1. The phenotypic dynamics during the development and ripening of blood orange fruit. (A) The change in the external epicarp color. (B) The change in the internal color of fruit flesh. The X axis represents different stages of fruit development and ripening. Scale bar represents 5 cm. Cj, Cr, and Pt in the first column represent ‘Ziyang Xiangcheng’ (Citrus junos Sieb. ex Tanaka), ‘Hongju’ (C. reticulata Blanco), and ‘Trifoliate orange’ (Poncirus trifoliata L. Raf.), respectively. The same applies below.
Agriculture 12 00342 g001
Figure 2. Dynamic changes in the physical properties of blood oranges grafted onto different rootstocks during fruit development and ripening. (A) Individual fruit weight. (B) Vertical diameter. (C) Transverse diameter. (D) Fruit shape index. Means and standard deviations were calculated from three independent biological replicates. Means with different lower-case letters are significantly different. The statistical significance was set at p < 0.05. Vertical bars indicate standard deviations of means. The same applies below.
Agriculture 12 00342 g002
Figure 3. Dynamic changes in the color index of the fruit epicarp (A) and flesh (B) of the blood orange grafted onto different rootstocks during fruit development and ripening. The color index is expressed in a*/b* Hunter ratio.
Agriculture 12 00342 g003
Figure 4. Dynamic changes in the soluble solid content: (A) total soluble sugar; (B) titratable acidity; (C) ripening index; (D) sugar–acid ratio; (E) vitamin C content; and (F) of blood orange grafted onto different rootstocks during fruit development and ripening.
Agriculture 12 00342 g004
Figure 5. Dynamic changes in total anthocyanin and its compositions of blood orange grafted onto different rootstocks during fruit development and ripening: (A) dynamic changes of the total anthocyanin content; (B) HPLC separation of individual anthocyanins monitored at 520 nm; (C) dynamic changes of C3G; (D) regression equation with a correlation coefficient of C3G; (E) dynamic changes of CMG; (F) regression equation with a correlation coefficient of CMG. Peaks numbered 1 and 2 in (B) correspond to C3G and CMG, respectively.
Agriculture 12 00342 g005
Figure 6. Dynamic changes in (A) PAL, (B) CHI, (C) DFR, and (D) UFGT enzyme activities of blood oranges grafted onto different rootstocks during fruit development and ripening.
Agriculture 12 00342 g006
Figure 7. Dynamic changes of gene expression of anthocyanin biosynthesis pathway of blood orange grafted onto different rootstocks during fruit development and ripening: (AL) PAL, C4H, 4CL, CHS, CHI, F3H, F3′5′H, FLS, DFR, ANS, UFGT, GST.
Agriculture 12 00342 g007
Figure 8. Schematic representation of the anthocyanin biosynthesis pathway. The heat map colors are based on the mean values of three biological replicates, whereby red represents higher expression levels while green indicates lower expression levels. DAFB: days after full bloom. (A) the general phenylpropanoid pathway; (B) the early anthocyanin biosynthetic pathway; and (C) the late biosynthetic anthocyanin biosynthetic pathway.
Agriculture 12 00342 g008
Figure 9. The correlations between anthocyanin content and the activity of several enzymes that catalyze anthocyanin synthesis: (A) PAL enzyme; (B) CHI enzyme; (C) DFR enzyme; and (D) UFGT enzyme.
Agriculture 12 00342 g009
Figure 10. Correlations between the anthocyanin content and the expression of genes that regulate anthocyanin biosynthesis: (AL) PAL, C4H, 4CL, CHS, CHI, F3H, F3′5′H, FLS, DFR, ANS, UFGT, GST.
Agriculture 12 00342 g010
Table 1. Specific primers for quantitative real-time PCR.
Accession NumberGenes NameFroward 5′-3′Reverse 5′-3′Reference
XM_006481431.3PALGATTTGAGACATTTGGAGGAATGGATGAAGCTCTCCACTA [33]
NM_001288840.1C4HCGTGGGAAGGCGAAGCTTCACAAGCCCCAAGATTGGT [34]
NM_001288931.1CHIAACAAAGTCGCATTTCCTCGGCGCACGGCGTTCTCCTCCAAGTA [34]
XM_006478851.24CLCCGAAACGCACCTCATCTGTGATGCCGAGATTCGACAAA [34]
XM_006420545.2CHSTCTATCGACGGGCATCTTCTGCCTCGGTTAGGCTTTTC [33]
NM_001288887.1F3HCCCCTAATTTAAGGCTACCCGACATCGTTCACGAAAACATAC [29]
XM_006446247.2F3′5′HGAATGGGGATTGTGCTTGTTGCGAGGCGAGGCCGAAGC [29]
NM_001288931.1DRFGCTGTTCGTGCTACTGTTCGGCTAAATCGGCTTTCCATA [33]
XM_006466120.1FLSGCCTCCGTCTTCTATCAACTACCTACTCCTCATTCACCGCTCG [33]
XM_025097974.1ANSGGGTGACTAAATGTGTTCAAGTCCCCTGTGAAGAATA [33]
NM_001320060.1UFGTTCTTCAGCACTCCGCAATCTCCATCGGATACGTCGTAAG [33]
NM_001288887.1GSTGCAGCAAAGTATGCAAACCGAGCCATTGATCCACCAAAG [33]
XM_006488084.3EF-1αGGCTAGGTACGATGAAATTGGTTGTCACCCTCGAAACC [33]
Publisher’s Note: MDPI stays neutral with regard to jurisdictional claims in published maps and institutional affiliations.

