
Non-Destructive Detection of pH Value of Kiwifruit Based on Hyperspectral Fluorescence Imaging Technology

Abstract
:1. Introduction
2. Materials and Methods
2.1. Samples
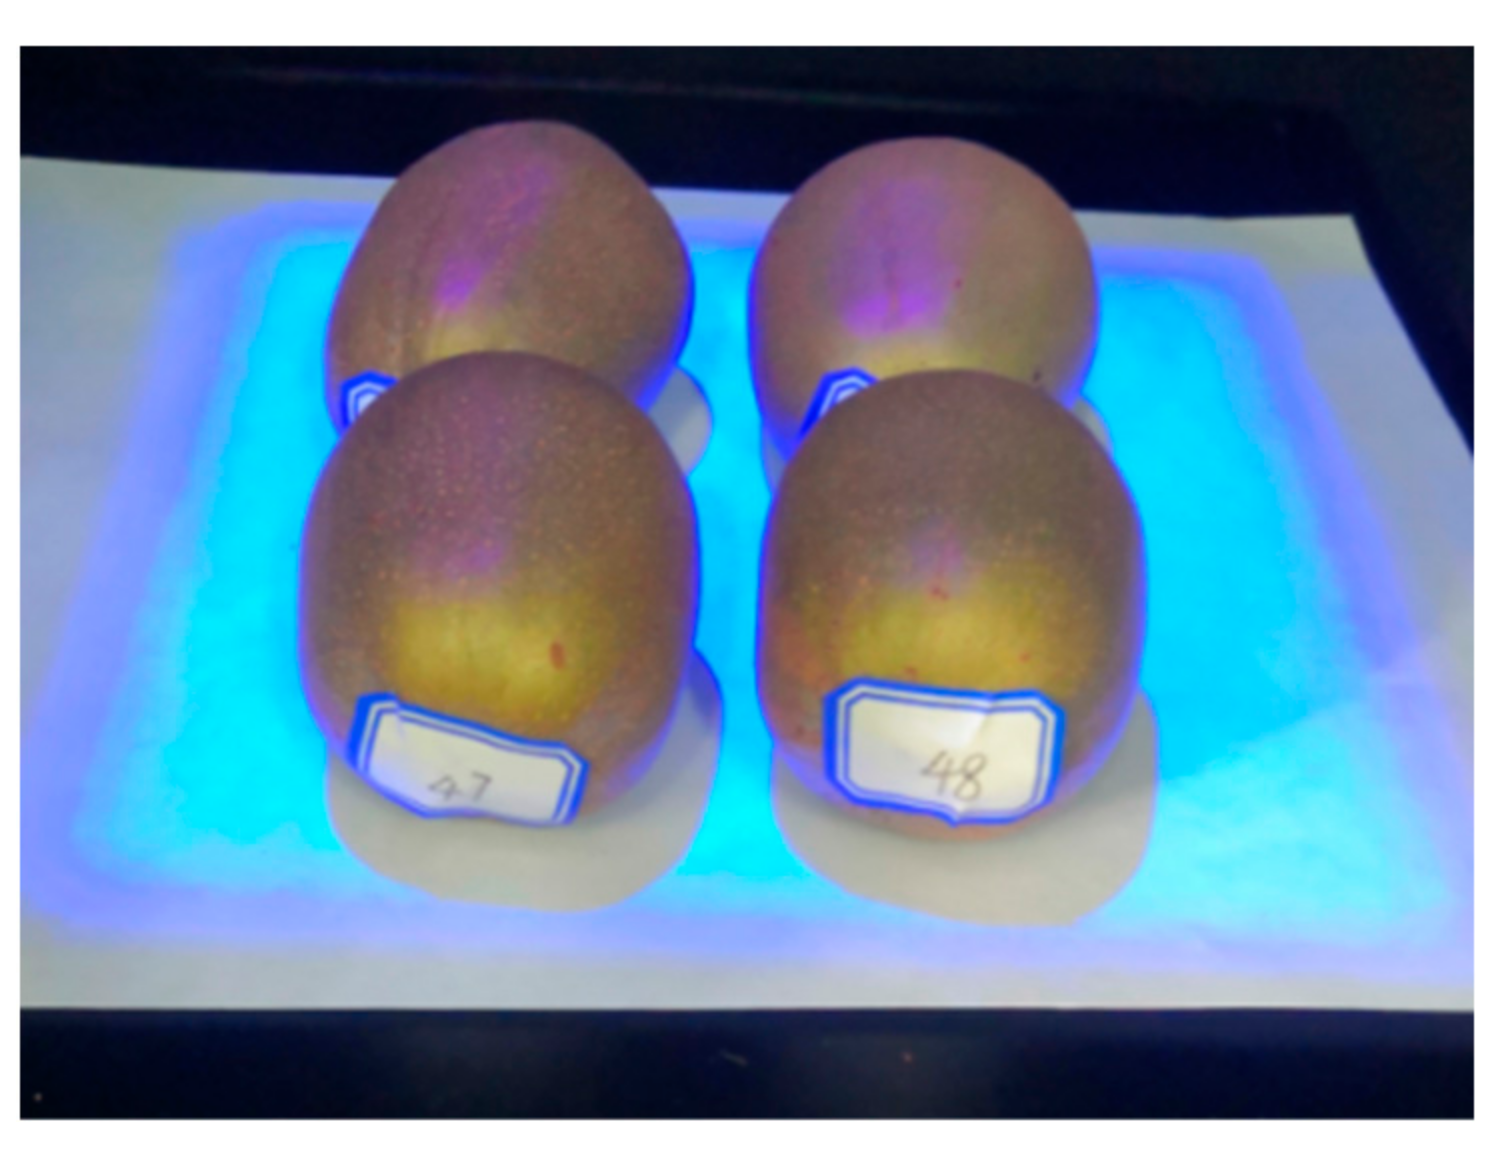
2.2. Instruments and Equipment
2.3. The pH Physicochemical Values Measurement of the Samples
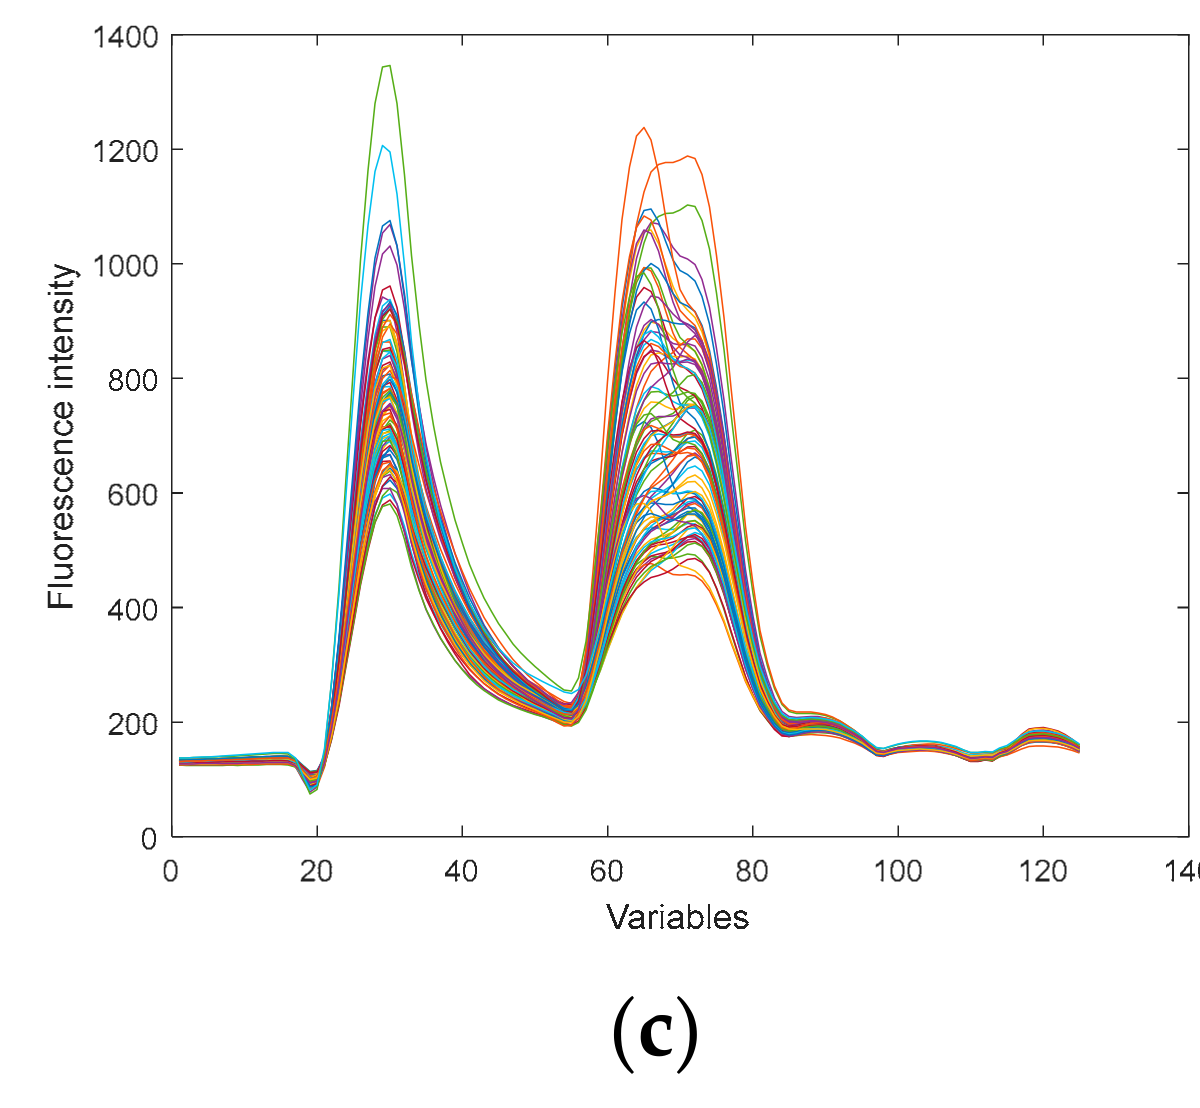
2.4. Extraction of Spectral Data
2.5. Preprocessing Methods of Spectral Data
2.6. Methods of Extracting Effective Variables
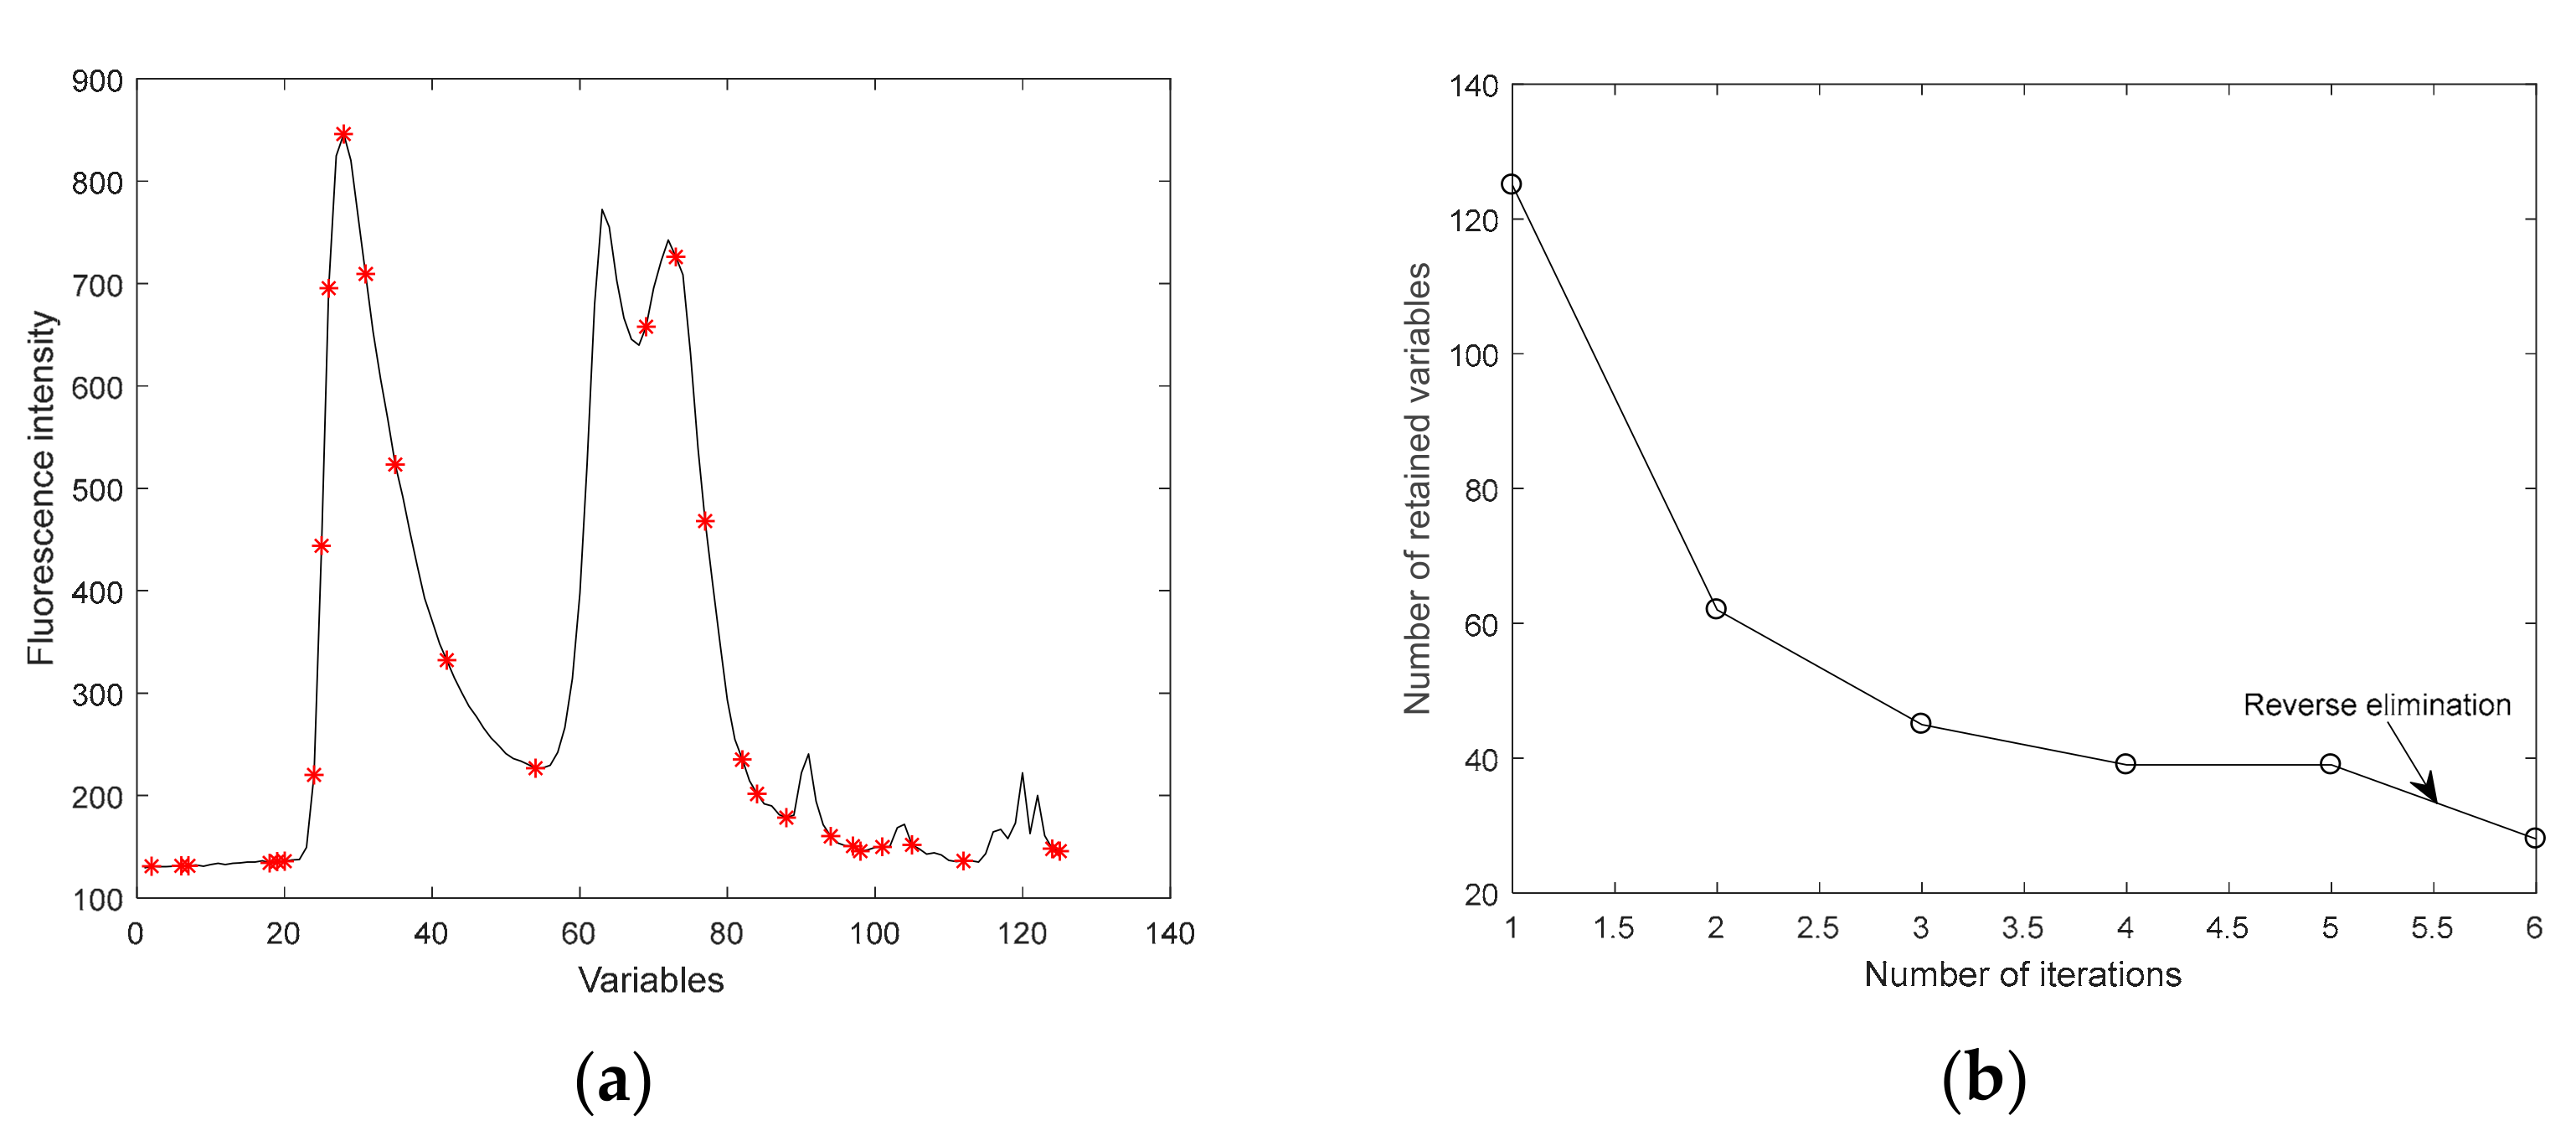
2.6.1. Iteratively Retaining Information Variables
2.6.2. Model Adaptive Space Shrinkage
2.6.3. Variable Iterative Space Shrinkage Approach
2.6.4. Random Frog
3. Results and Discussions
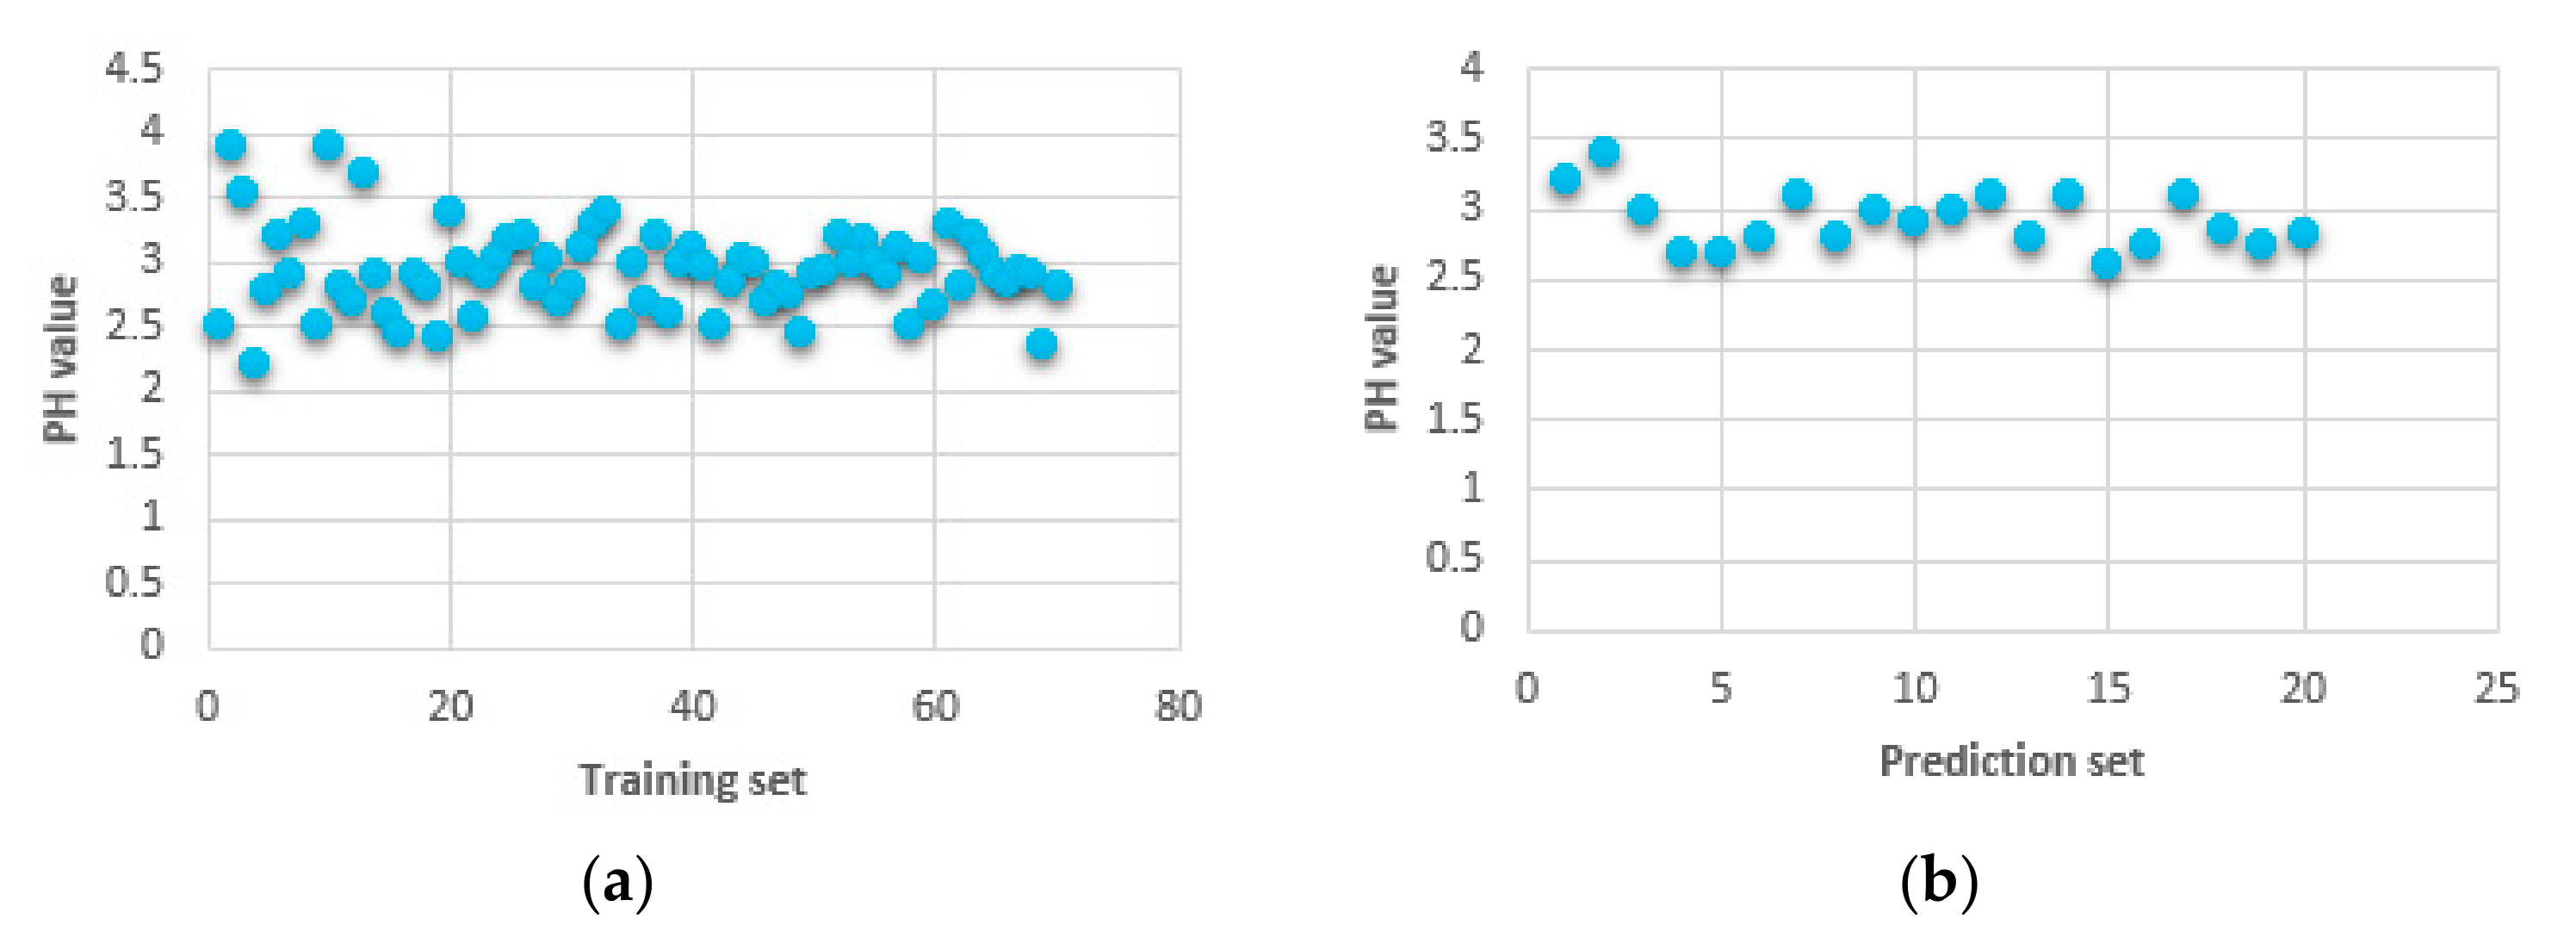
3.1. Sample Division
3.2. Preprocessing the Fluorescence Spectral Data
3.3. Extracting Effective Variables
3.3.1. Effective Variables Extracted by IRIV
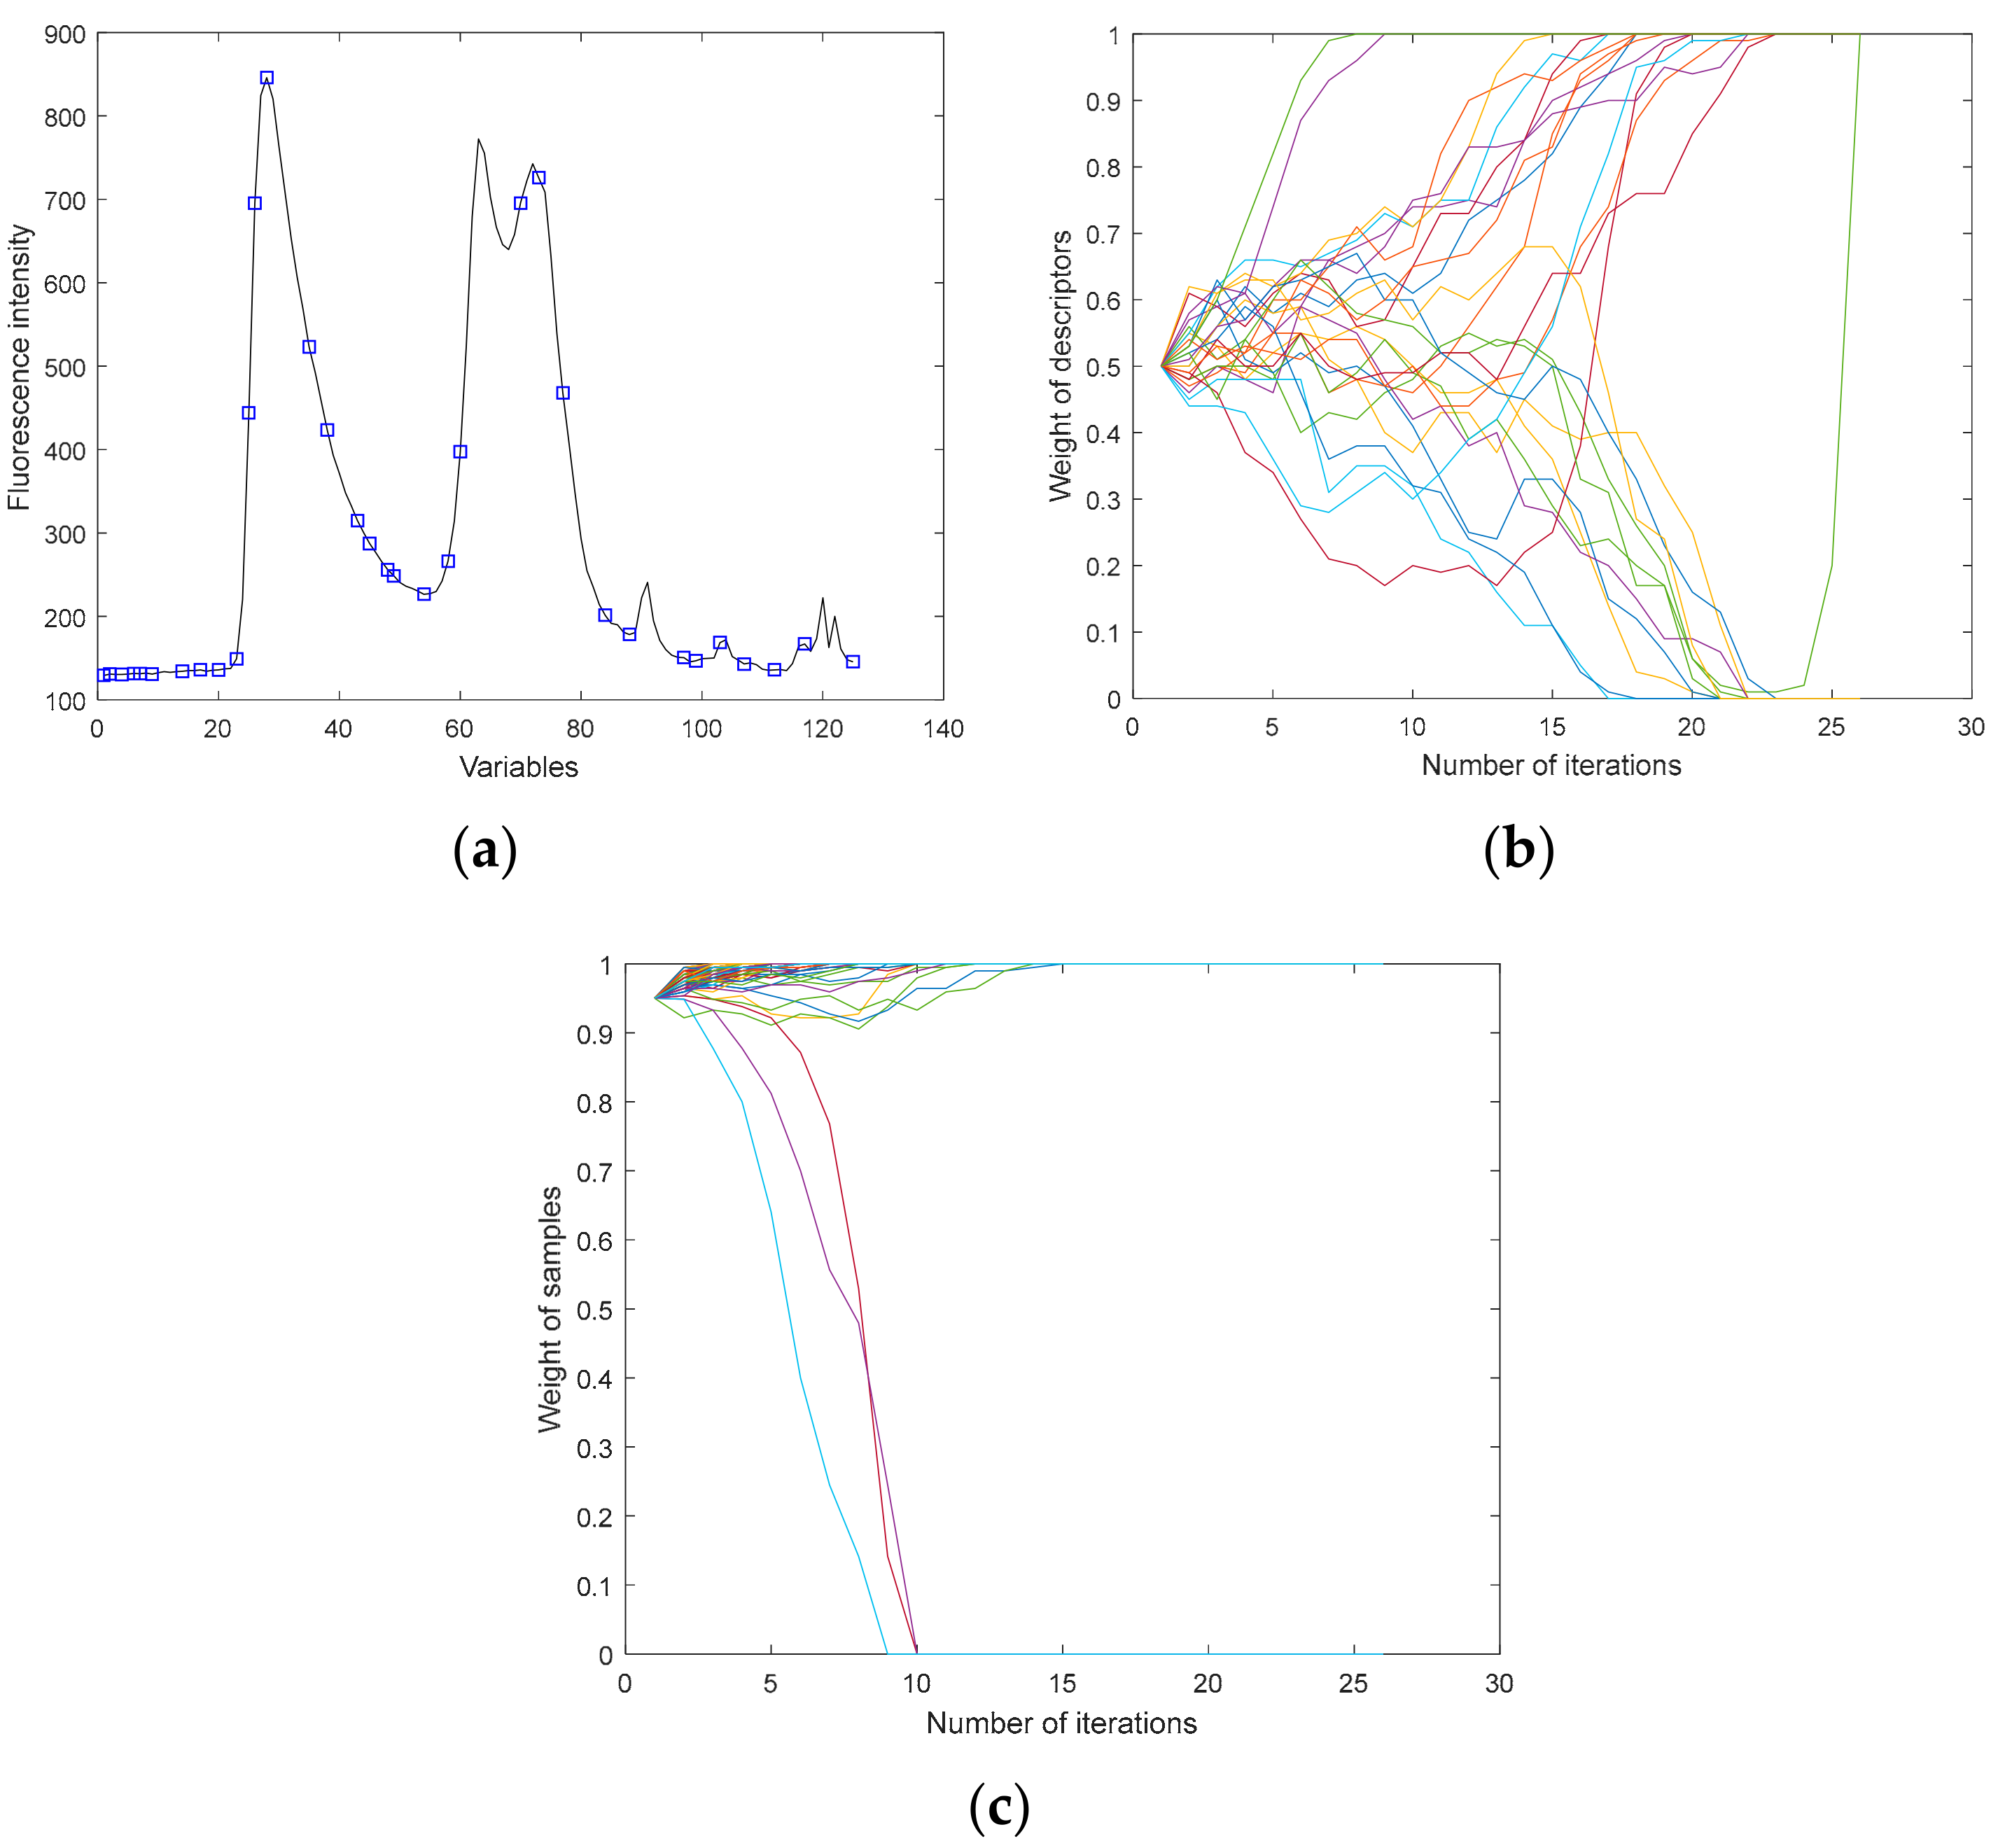
3.3.2. Effective Variables Extracted by MASS
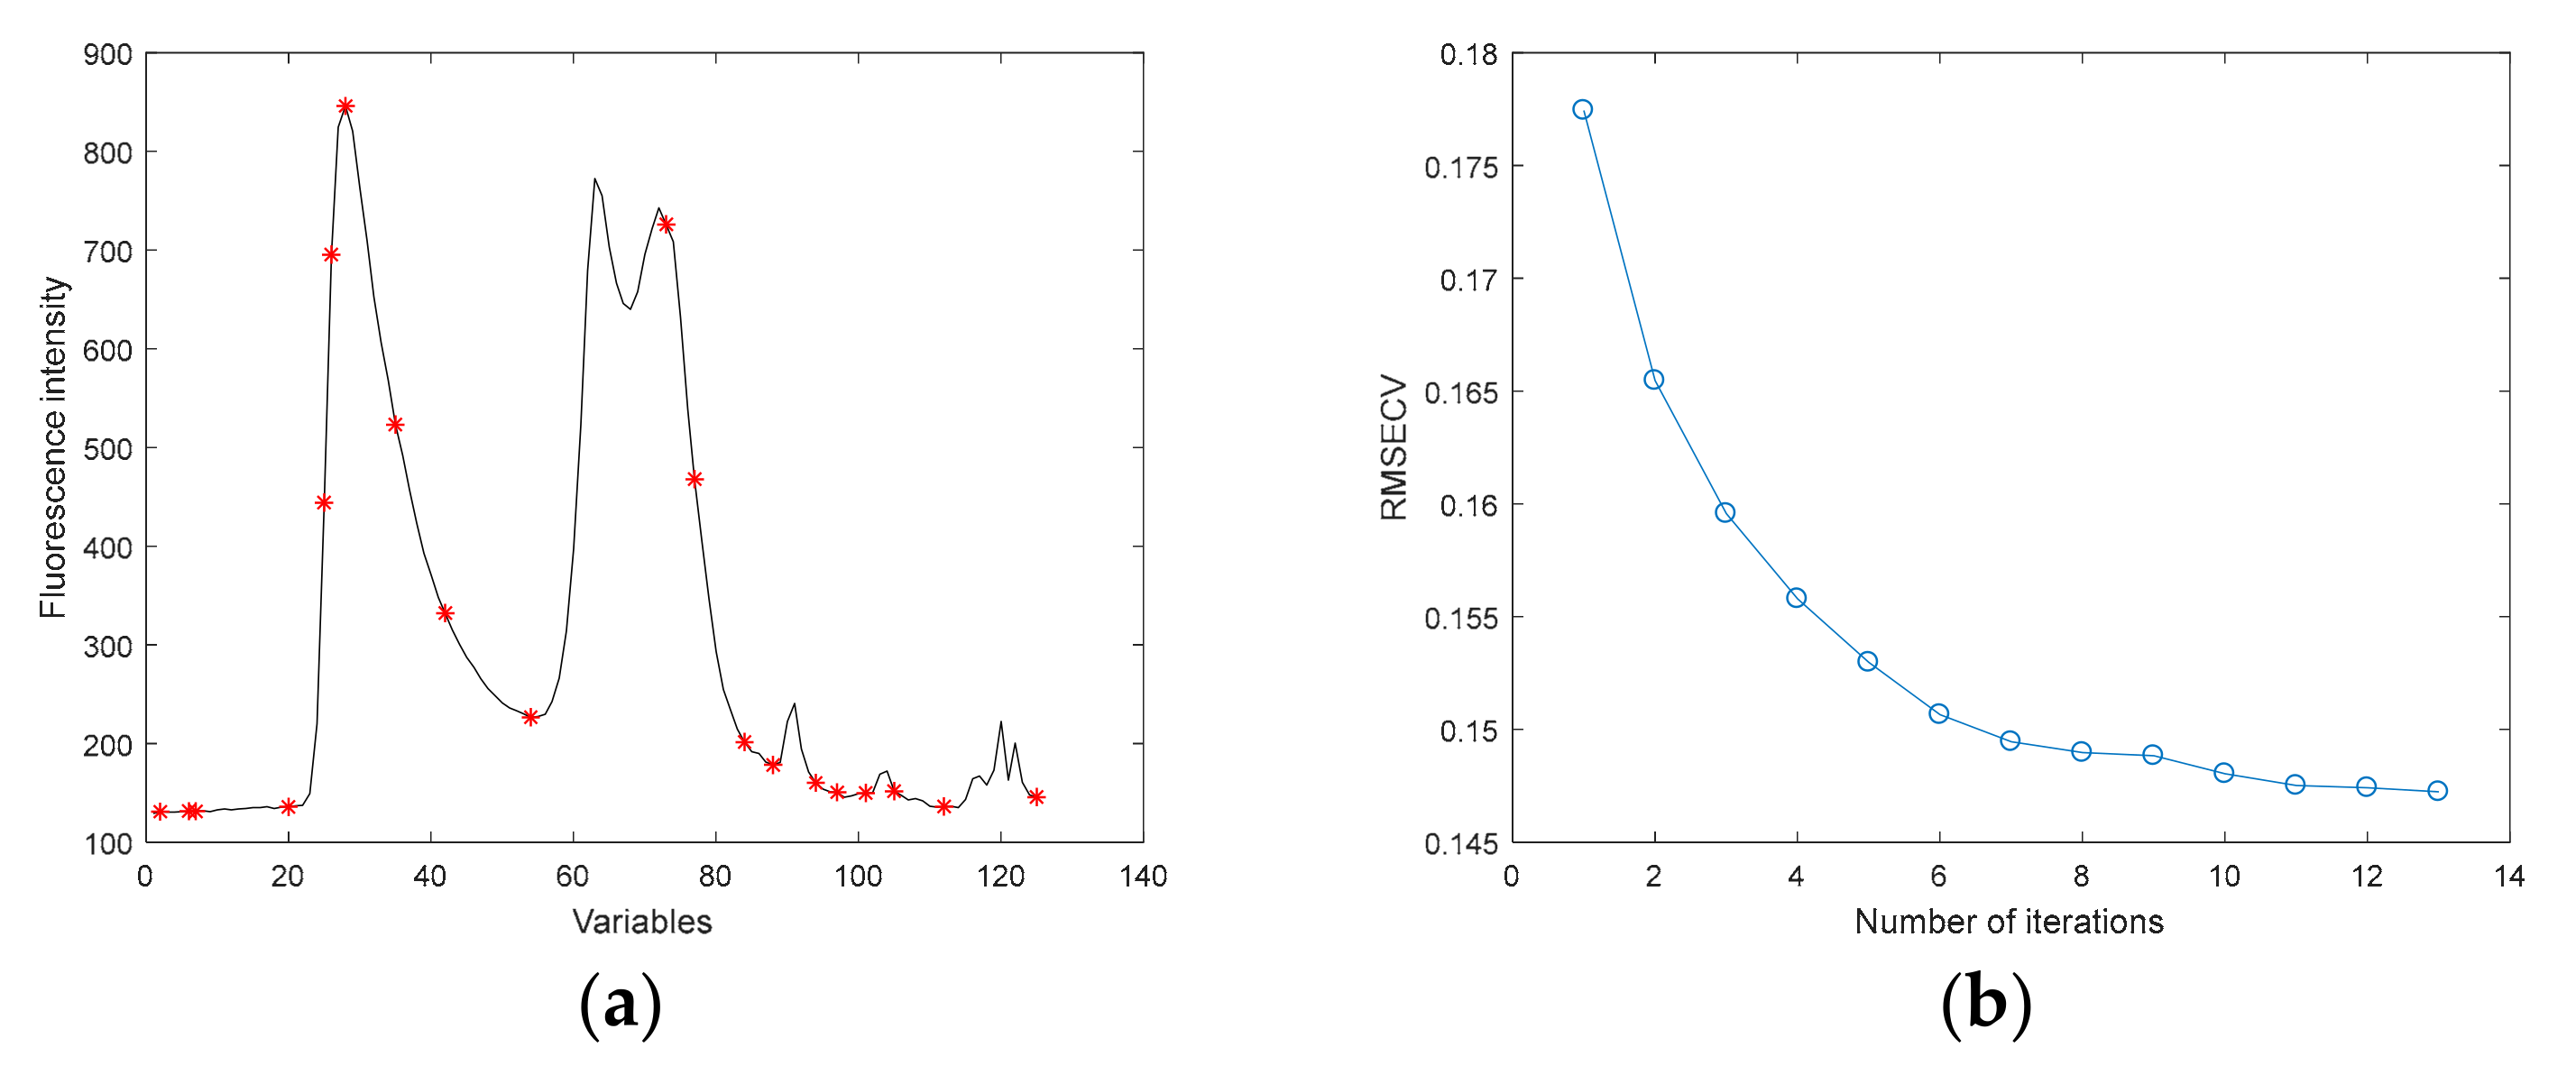
3.3.3. Effective Variables Extracted by VISSA
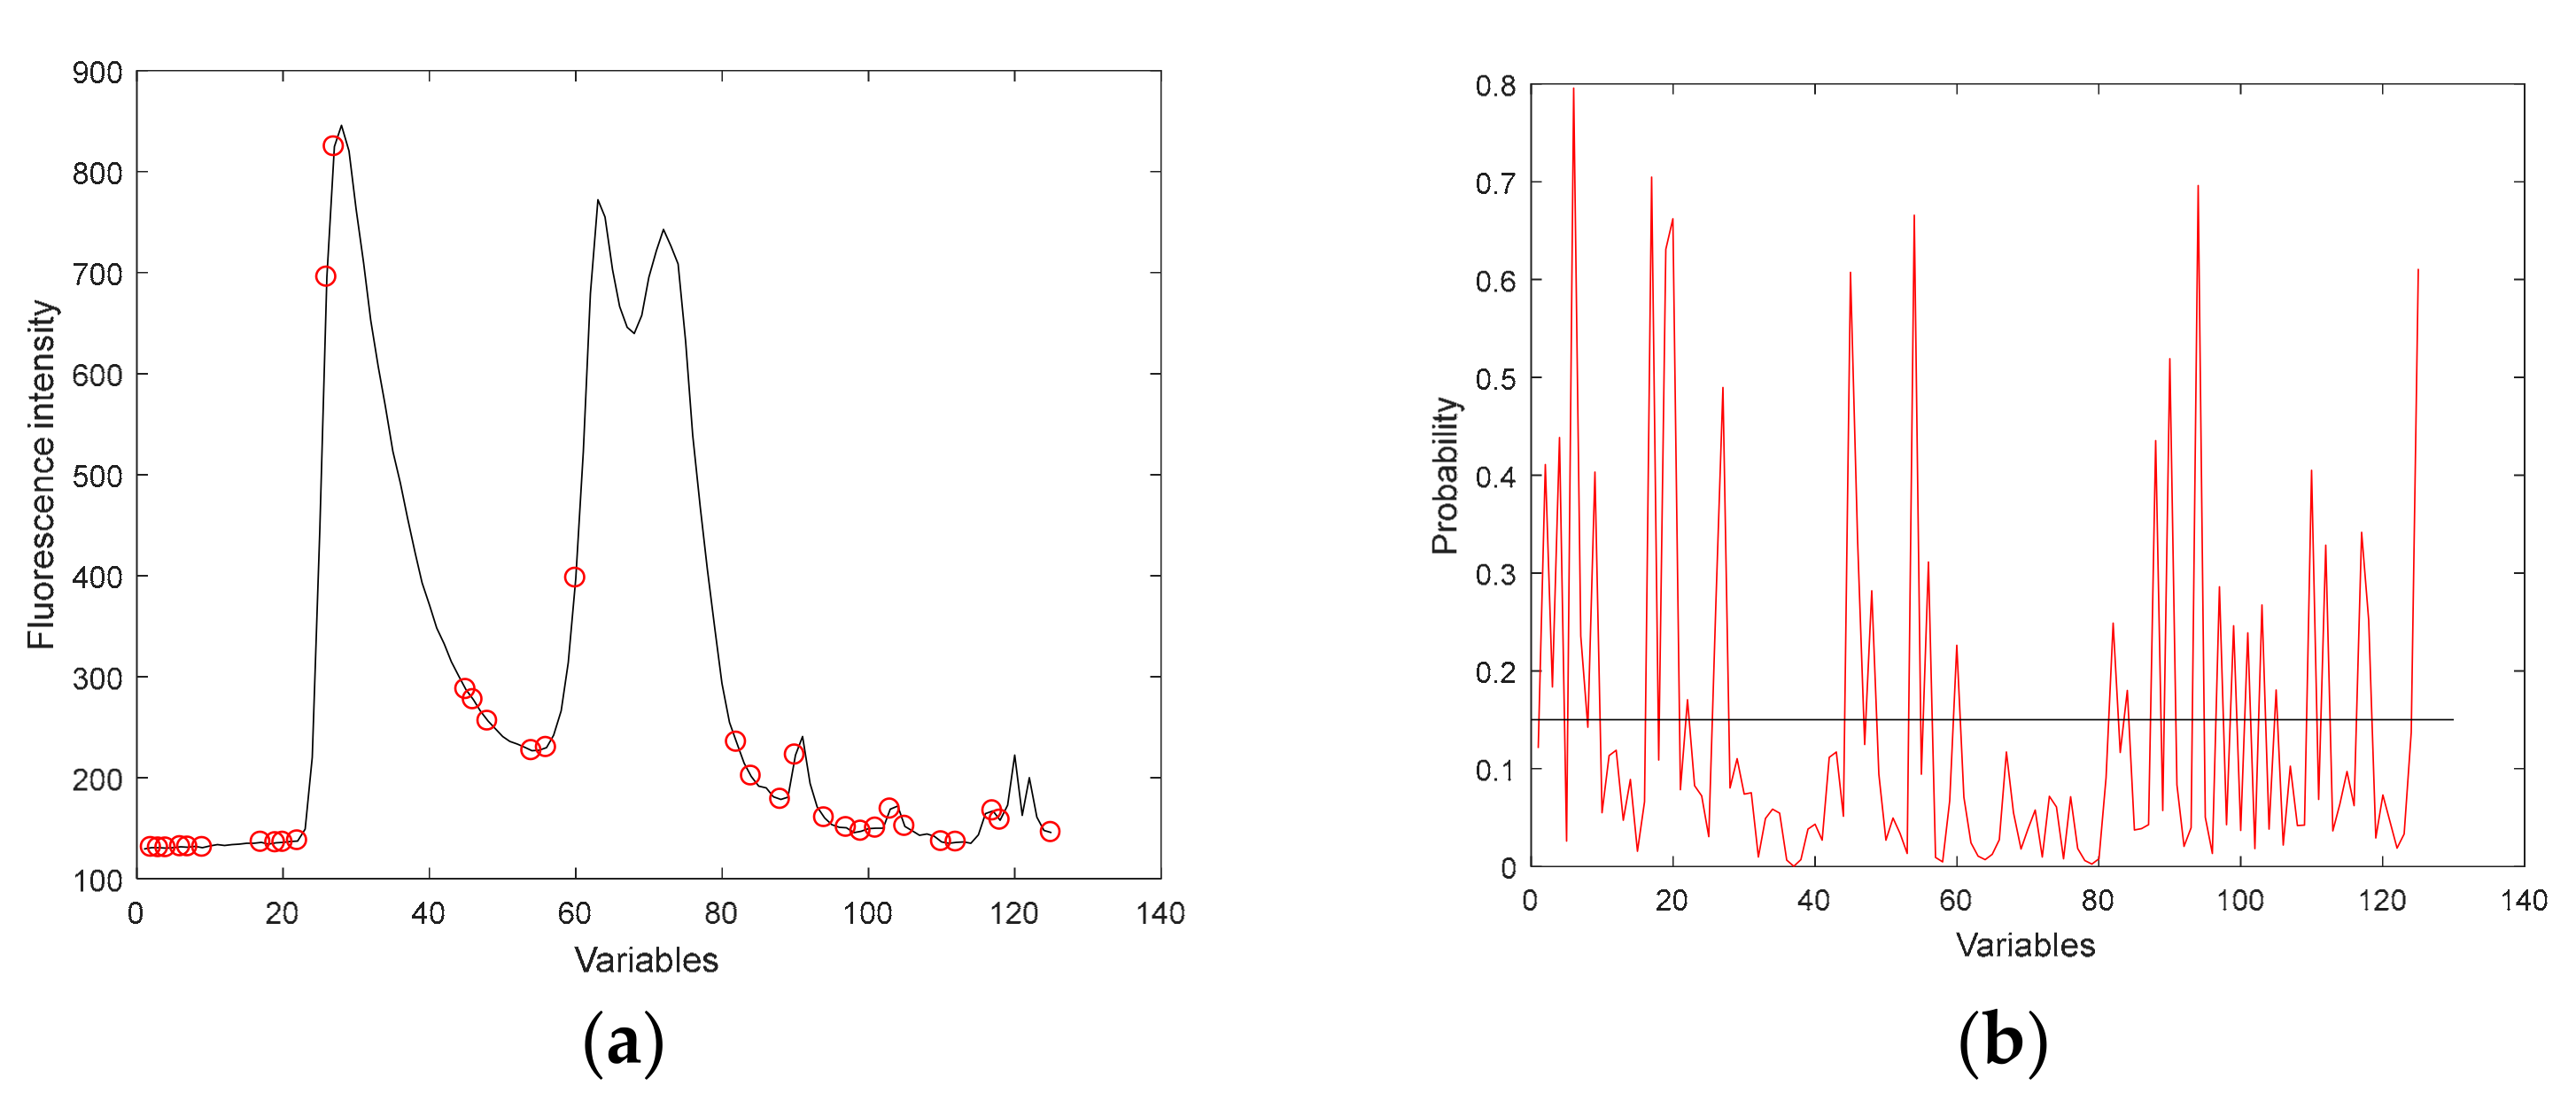
3.3.4. Effective Variables Extracted by RF
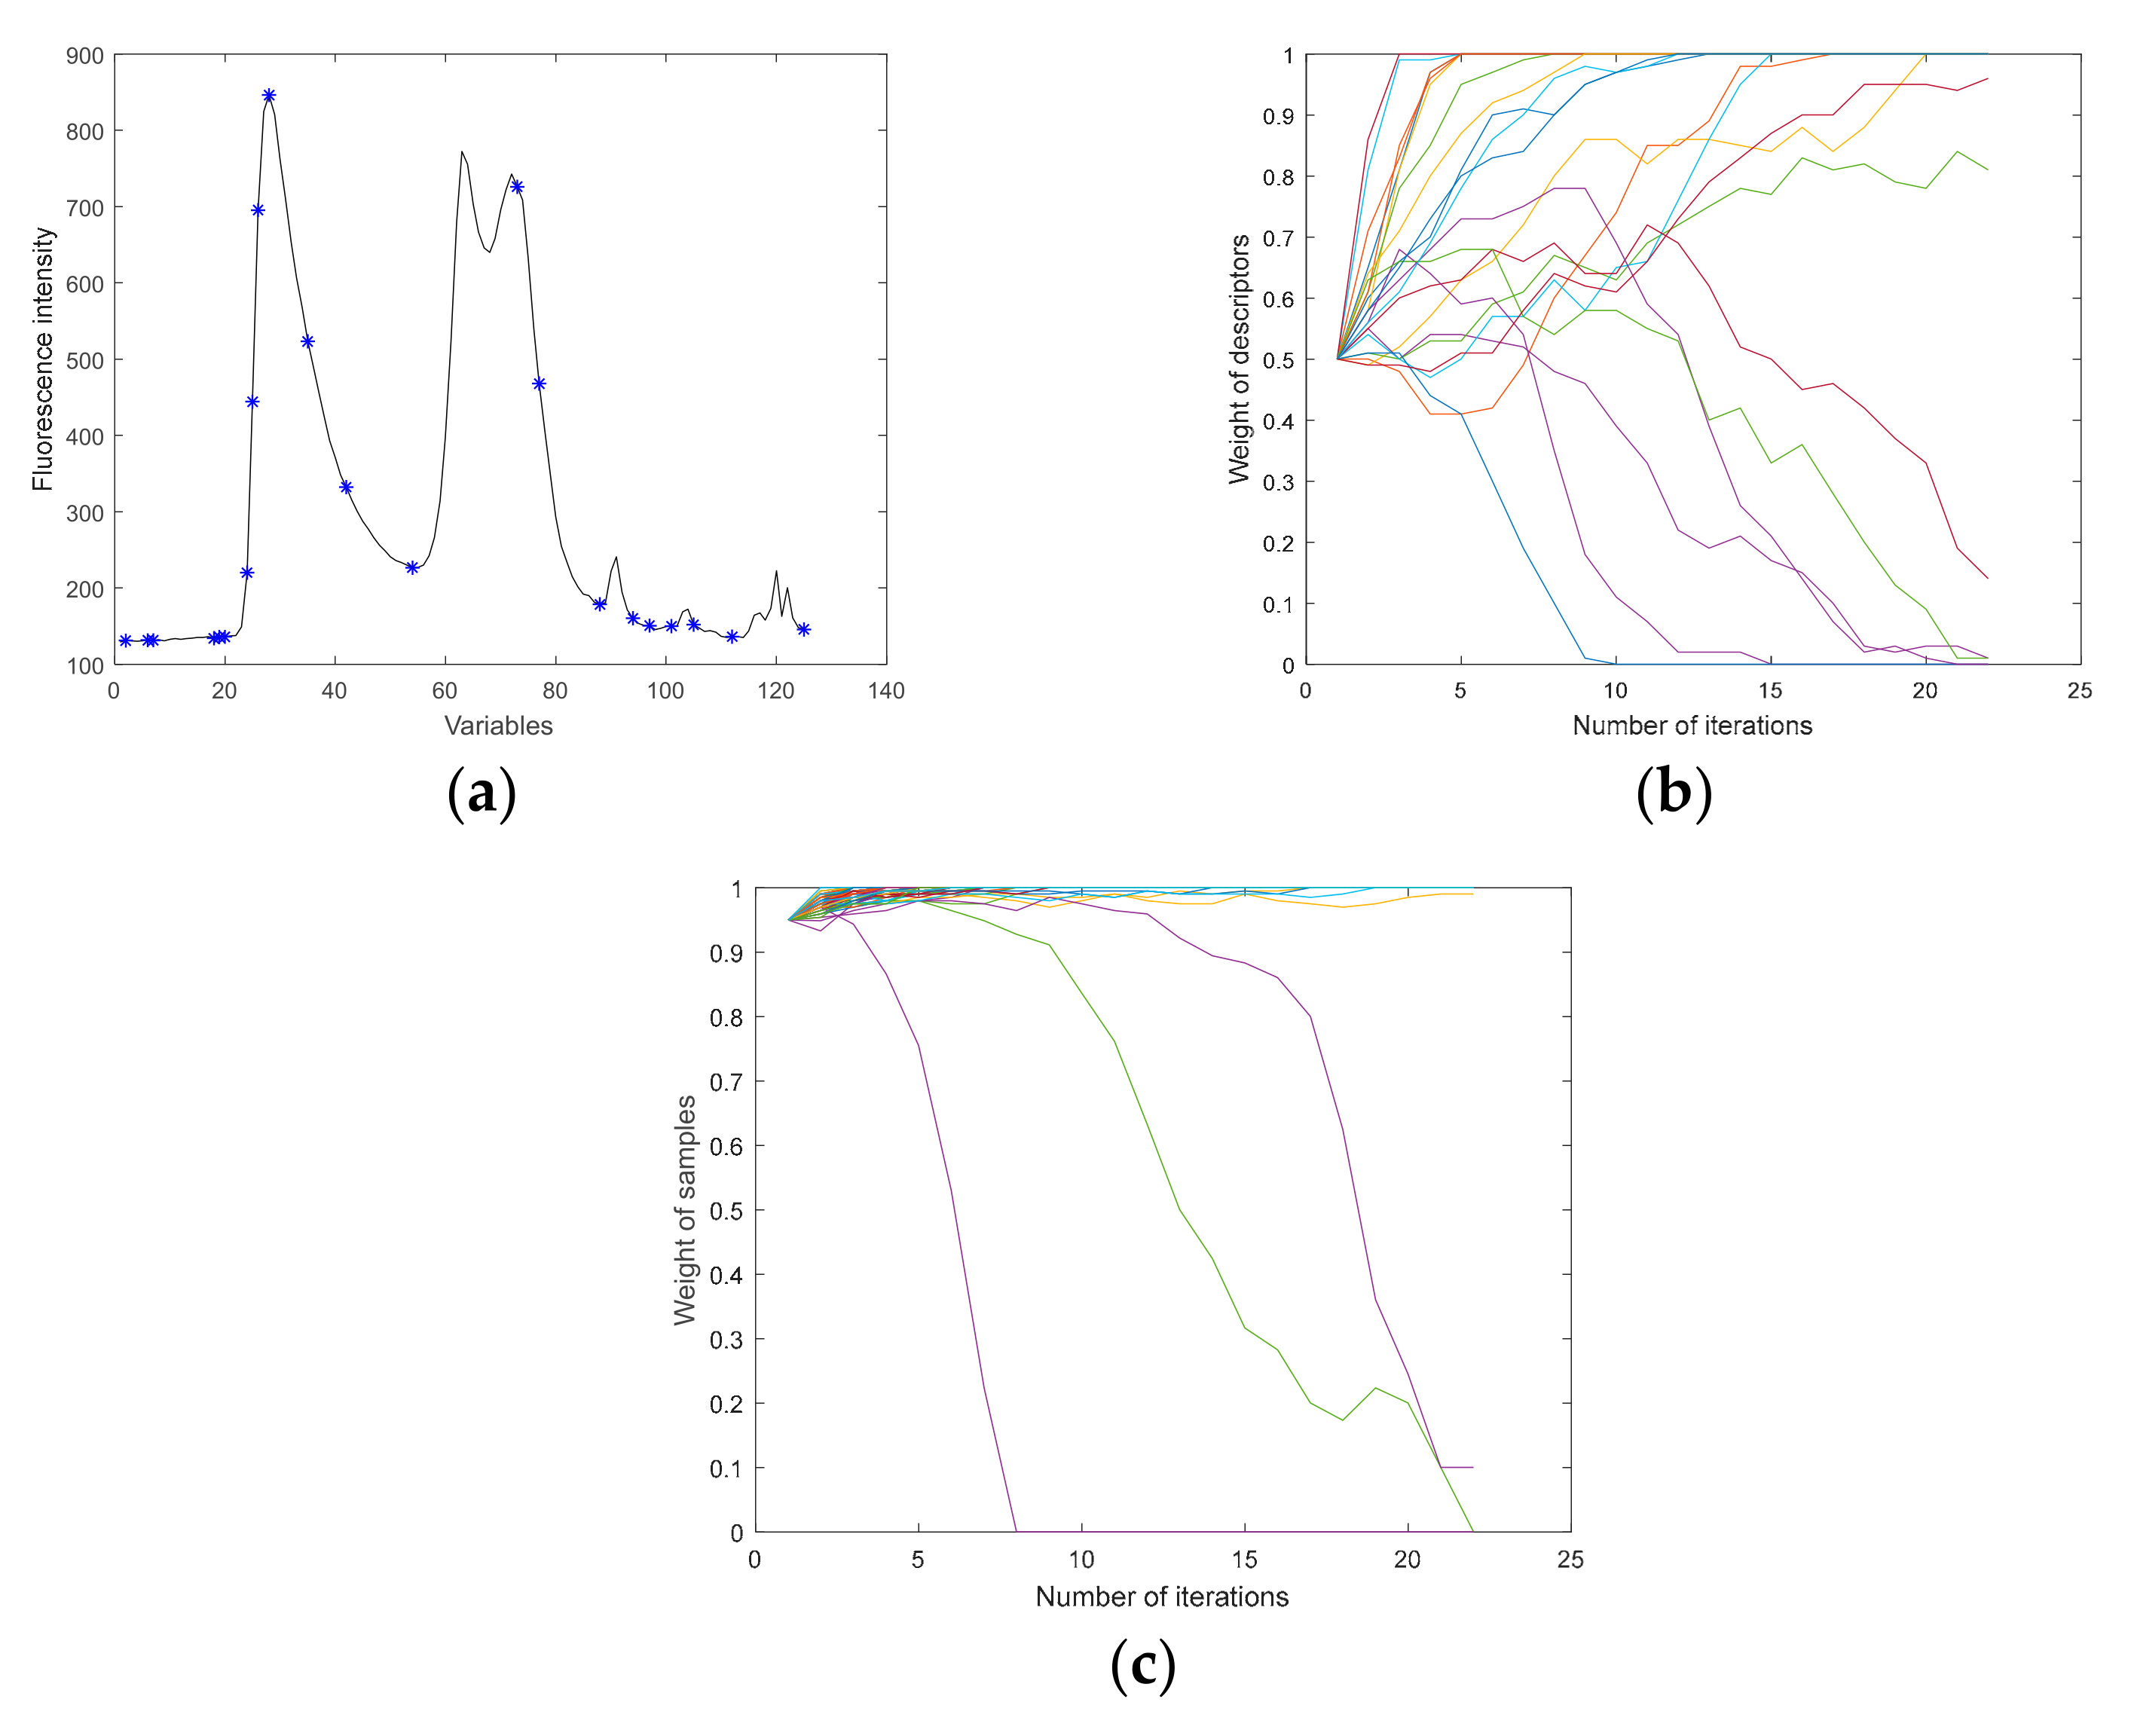
3.3.5. Effective Variables Extracted by IRIV-VISSA
3.3.6. Effective Variables Extracted by IRIV-MASS
3.3.7. Effective Variables Extracted by IVMR-VISSA
3.3.8. Effective Variables Extracted by IVMR-VISSA-IRIV
3.4. Building the Models and Analyzing the Results
3.4.1. RFR Model
3.4.2. PLSR Model
3.4.3. ELM Model
3.4.4. MK-SVR Model
4. Conclusions
- (1)
- By comparing the prediction results of the PLSR built using the raw spectrum data and three preprocessing algorithms, namely, de-trending, S-G, and moving average, it can be seen that DT can effectively eliminate baseline drift and improve the signal-to-noise ratio of the raw spectrum data. Compared with the raw spectral data, the Rp2, Rc2, and RPD of DT-PLSR were increased to 0.7037, 0.7263, and 1.88, respectively. Therefore, DT was selected to preprocess the raw spectrum data.
- (2)
- Different methods were used to extract effective variables from the preprocessed spectral data. The experimental results showed that the second and the third extractions can effectively reduce redundant variables and reduce the collinearity between the variables. The number of extracted effective variables accounts for between 16% and 48% of the full spectrum.
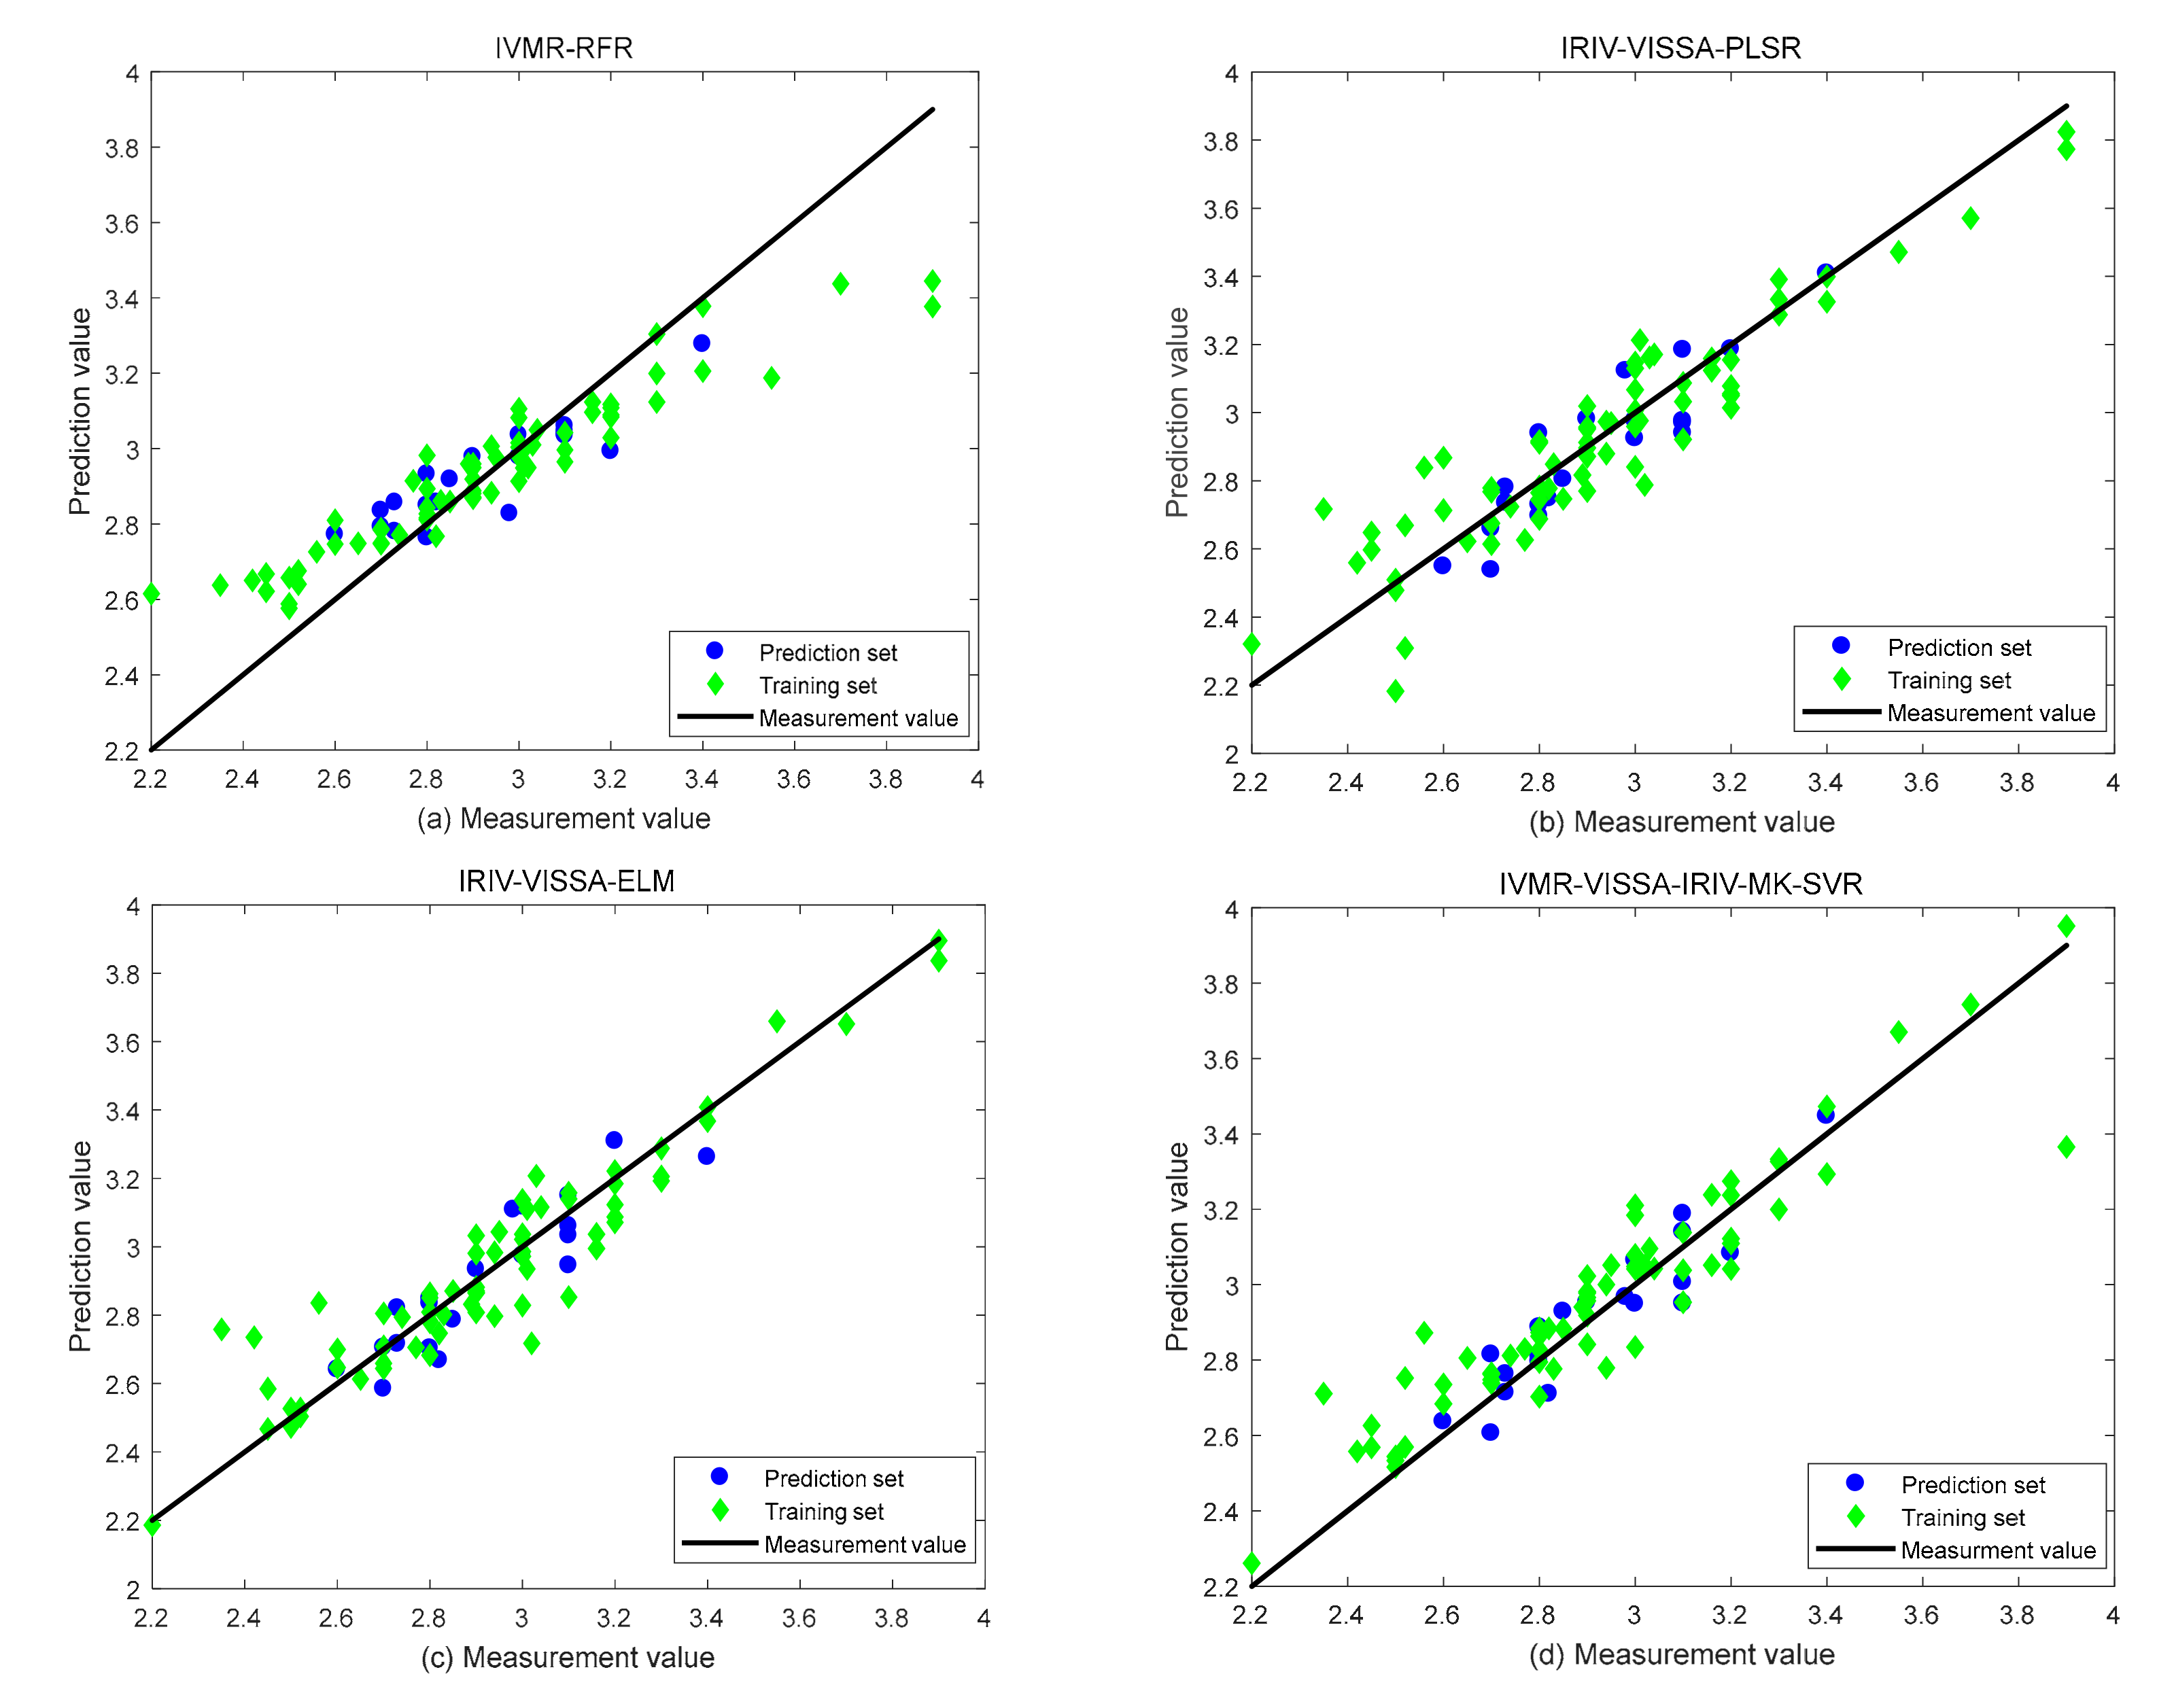
- (3)
- Comparing the prediction results of four regression models, namely, RFR, PLSR, ELM, and MK-SVR, it can be seen that the prediction results of MK-SVR are generally higher than those of other models. Among these, IVMR-VISSA-IRIV-MK-SVR has the best prediction results, with RP2, RC2, and RPD of 0.8512, 0.8580, and 2.66, respectively.
Author Contributions
Funding
Institutional Review Board Statement
Informed Consent Statement
Data Availability Statement
Conflicts of Interest
References
- Gao, M.; Guo, W.; Huang, X.; Du, R.; Zhu, X. Effect of pressing and impacting bruises on optical properties of kiwifruit flesh. Postharvest Biol. Technol. 2021, 172, 111385. [Google Scholar] [CrossRef]
- Ma, T.; Xia, Y.; Inagaki, T.; Tsuchikawa, S. Non-destructive and fast method of mapping the distribution of the soluble solids content and pH in kiwifruit using object rotation near-infrared hyperspectral imaging approach. Postharvest Biol. Technol. 2021, 174, 111440. [Google Scholar] [CrossRef]
- Liu, D.; Guo, W. Identifying CPPU-Treated Kiwifruits Using Near-Infrared Hyperspectral Imaging Technology. Food Anal. Methods 2017, 10, 1273–1283. [Google Scholar] [CrossRef]
- Zhu, H.; Chu, B.; Fan, Y.; Tao, X.; Yin, W.; He, Y. Hyperspectral Imaging for Predicting the Internal Quality of Kiwifruits Based on Variable Selection Algorithms and Chemometric Models. Sci. Rep. 2017, 7, 7845. [Google Scholar] [CrossRef] [Green Version]
- Leiva-Valenzuela, G.; Lu, R.; Aguilera, J. Prediction of firmness and soluble solids content of blueberries using hyperspectral reflectance imaging. J. Food Eng. 2013, 115, 91–98. [Google Scholar] [CrossRef]
- Guo, Z.; Wang, M.; Agyekum, A.; Wu, J.; Chen, Q.; Zou, M.; El-Seedi, H.; Tao, F.; Shi, J.; Ouyang, Q.; et al. Quantitative detection of apple watercore and soluble solids content by near infrared transmittance spectroscopy. J. Food Eng. 2020, 279, 109955. [Google Scholar] [CrossRef]
- Li, J.; Chen, L. Comparative analysis of models for robust and accurate evaluation of soluble solids content in ‘Pinggu’ peaches by hyperspectral imaging. Comput. Electron. Agric. 2017, 142, 524–535. [Google Scholar] [CrossRef]
- Pu, Y.; Sun, D. Vis–NIR hyperspectral imaging in visualizing moisture distribution of mango slices during microwave-vacuum drying. Food Chem. 2015, 188, 271–278. [Google Scholar] [CrossRef]
- Sun, J.; Ma, B.; Dong, J.; Zhu, R.; Zhang, R.; Jiang, W. Detection of internal qualities of hami melons using hyperspectral imaging technology based on variable selection algorithms. J. Food Process Eng. 2017, 40. [Google Scholar] [CrossRef]
- Li, B.; Hou, B.; Zhang, D.; Zhou, Y.; Zhao, M.; Hong, R.; Huang, Y. Pears characteristics (soluble solids content and firmness prediction, varieties) testing methods based on visible-near infrared hyperspectral imaging. Optik 2016, 127, 2624–2630. [Google Scholar] [CrossRef]
- Wold, J.; Jørgensen, K.; Lundby, F. Nondestructive Measurement of Light-induced Oxidation in Dairy Products by Fluorescence Spectroscopy and Imaging. J. Dairy Sci. 2002, 85, 1693–1704. [Google Scholar] [CrossRef]
- Bertani, F.; Businaro, L.; Gambacorta, L.; Mencattini, A.; Brenda, D.; Di Giuseppe, D.; Gerardino, A. Optical detection of aflatoxins B in grained almonds using fluorescence spectroscopy and machine learning algorithms. Food Control 2020, 112, 107073. [Google Scholar] [CrossRef] [Green Version]
- Liu, H.; Ji, Z.; Liu, X.; Shi, C.; Yang, X. Non-destructive determination of chemical and microbial spoilage indicators of beef for freshness evaluation using front-face synchronous fluorescence spectroscopy. Food Chem. 2020, 321, 126628. [Google Scholar] [CrossRef] [PubMed]
- ElMasry, G.; Wang, N.; ElSayed, A.; Ngadi, M. Hyperspectral imaging for nondestructive determination of some quality attributes for strawberry. J. Food Eng. 2007, 81, 98–107. [Google Scholar] [CrossRef]
- Tian, Y.; Sun, J.; Zhou, X.; Wu, X.; Lu, B.; Dai, C. Research on apple origin classification based on variable iterative space shrinkage approach with stepwise regression–support vector machine algorithm and visible-near infrared hyperspectral imaging. J. Food Process Eng. 2020, 43, e13432. [Google Scholar] [CrossRef]
- Wang, H.; Peng, J.; Xie, C.; Bao, Y.; He, Y. Fruit Quality Evaluation Using Spectroscopy Technology: A Review. Sensors 2015, 15, 11889–11927. [Google Scholar] [CrossRef] [Green Version]
- Yuan, R.; Liu, G.; He, J.; Wan, G.; Fan, N.; Li, Y.; Sun, Y. Classification of Lingwu long jujube internal bruise over time based on visible near-infrared hyperspectral imaging combined with partial least squares-discriminant analysis. Comput. Electron. Agric. 2021, 182, 106043. [Google Scholar] [CrossRef]
- Sadeghi, M.; Behnia, F.; Amiri, R. Window Selection of the Savitzky–Golay Filters for Signal Recovery from Noisy Measurements. IEEE Trans. Instrum. Meas. 2020, 69, 5418–5427. [Google Scholar] [CrossRef]
- Yun, Y.; Wang, W.; Tan, M.; Liang, Y.; Li, H.; Cao, D.; Xu, Q. A strategy that iteratively retains informative variables for selecting optimal variable subset in multivariate calibration. Anal. Chim. Acta 2014, 807, 36–43. [Google Scholar] [CrossRef]
- Wei, L.; Yuan, Z.; Yu, M.; Huang, C.; Cao, L. Estimation of Arsenic Content in Soil Based on Laboratory and Field Reflectance Spectroscopy. Sensors 2019, 19, 3904. [Google Scholar] [CrossRef] [Green Version]
- Yun, Y.; Bin, J.; Liu, D.; Xu, L.; Yan, T.; Cao, D.; Xu, Q. A hybrid variable selection strategy based on continuous shrinkage of variable space in multivariate calibration. Anal. Chim. Acta 2019, 1058, 58–69. [Google Scholar] [CrossRef] [PubMed]
- Ren, G.; Ning, J.; Zhang, Z. Intelligent assessment of tea quality employing visible-near infrared spectra combined with a hybrid variable selection strategy. Microchem. J. 2020, 157, 105085. [Google Scholar] [CrossRef]
- Wen, M.; Deng, B.; Cao, D.; Yun, Y.; Yang, R.; Lu, H.; Liang, Y. The model adaptive space shrinkage (MASS) approach: A new method for simultaneous variable selection and outlier detection based on model population analysis. Analyst 2016, 141, 5586–5597. [Google Scholar] [CrossRef] [PubMed]
- Zhou, X.; Sun, J.; Tian, Y.; Wu, X.; Dai, C.; Li, B. Spectral classification of lettuce cadmium stress based on information fusion and VISSA-GOA-SVM algorithm. J. Food Process Eng. 2019, 42, e13085. [Google Scholar] [CrossRef]
- Sun, J.; Tang, K.; Wu, X.; Dai, C.; Chen, Y.; Shen, J. Nondestructive identification of green tea varieties based on hyperspectral imaging technology. J. Food Process Eng. 2018, 41, e12800. [Google Scholar] [CrossRef]
- Deng, B.; Yun, Y.; Ma, P.; Lin, C.; Ren, D.; Liang, Y. A new method for wavelength interval selection that intelligently optimizes the locations, widths and combinations of the intervals. Analyst 2015, 140, 1876–1885. [Google Scholar] [CrossRef] [PubMed]
- Sun, J.; Yang, W.; Zhang, M.; Feng, M.; Xiao, L.; Ding, G. Estimation of water content in corn leaves using hyperspectral data based on fractional order Savitzky-Golay derivation coupled with wavelength selection. Comput. Electron. Agric. 2021, 182, 105989. [Google Scholar] [CrossRef]
- Zhang, D.; Xu, Y.; Huang, W.; Tian, X.; Xia, Y.; Xu, L.; Fan, S. Nondestructive measurement of soluble solids content in apple using near infrared hyperspectral imaging coupled with wavelength selection algorithm. Infrared Phys. Technol. 2019, 98, 297–304. [Google Scholar] [CrossRef]
- Yu, Y.; Zhang, Q.; Huang, J.; Zhu, J.; Liu, J. Nondestructive determination of SSC in Korla fragrant pear using a portable near-infrared spectroscopy system. Infrared Phys. Technol. 2021, 116, 103785. [Google Scholar] [CrossRef]
- Liang, L.; Geng, D.; Yan, J.; Qiu, S.; Di, L.; Wang, S.; Li, L. Estimating Crop LAI Using Spectral Feature Extraction and the Hybrid Inversion Method. Remote Sens. 2020, 12, 3534. [Google Scholar] [CrossRef]
- Wang, S.; Chen, Y.; Wang, M.; Li, J. Performance Comparison of Machine Learning Algorithms for Estimating the Soil Salinity of Salt-Affected Soil Using Field Spectral Data. Remote Sens. 2019, 11, 2605. [Google Scholar] [CrossRef] [Green Version]
- An, G.; Xing, M.; He, B.; Liao, C.; Huang, X.; Shang, J.; Kang, H. Using Machine Learning for Estimating Rice Chlorophyll Content from In Situ Hyperspectral Data. Remote Sens. 2020, 12, 3104. [Google Scholar] [CrossRef]
- Zhang, L.; Wang, Y.; Wei, Y.; An, D. Near-infrared hyperspectral imaging technology combined with deep convolutional generative adversarial network to predict oil content of single maize kernel. Food Chem. 2022, 370, 131047. [Google Scholar] [CrossRef] [PubMed]
- Su, W.; Bakalis, S.; Sun, D. Chemometrics in tandem with near infrared (NIR) hyperspectral imaging and Fourier transform mid infrared (FT-MIR) microspectroscopy for variety identification and cooking loss determination of sweet potato. Biosyst. Eng. 2019, 180, 70–86. [Google Scholar] [CrossRef]
- Jung, A.; Vohland, M.; Thiele-Bruhn, S. Use of a Portable Camera for Proximal Soil Sensing with Hyperspectral Image Data. Remote Sens. 2015, 7, 11434–11448. [Google Scholar] [CrossRef] [Green Version]
- Helsen, K.; Bassi, L.; Feilhauer, H.; Kattenborn, T.; Matsushima, H.; Van Cleemput, E.; Honnay, O. Evaluating different methods for retrieving intraspecific leaf trait variation from hyperspectral leaf reflectance. Ecol. Indic. 2021, 130, 108111. [Google Scholar] [CrossRef]
- Chen, S.; Hu, T.; Luo, L.; He, Q.; Zhang, S.; Li, M.; Li, H. Rapid estimation of leaf nitrogen content in apple-trees based on canopy hyperspectral reflectance using multivariate methods. Infrared Phys. Technol. 2020, 111, 103542. [Google Scholar] [CrossRef]
- Liu, Y.; Li, M.; Wang, S.; Wu, T.; Jiang, W.; Liu, Z. Identification of heat damage in imported soybeans based on hyperspectral imaging technology. J. Sci. Food Agric. 2020, 100, 1775–1786. [Google Scholar] [CrossRef]
- Wang, L.; Zhou, X.; Zhu, X.; Guo, W. Estimation of leaf nitrogen concentration in wheat using the MK-SVR algorithm and satellite remote sensing data. Comput. Electron. Agric. 2017, 140, 327–337. [Google Scholar] [CrossRef]


| Sample Set | The Samples | Max | Min | Mean | S.D. |
|---|---|---|---|---|---|
| Training set | 70 | 3.90 | 2.20 | 2.93 | 0.33 |
| Prediction set | 20 | 3.40 | 2.60 | 2.92 | 0.20 |
| Pretreatment Method | LVs | Rp2 | Rc2 | RMSEC | RMSEP | RPD |
|---|---|---|---|---|---|---|
| Raw | 6 | 0.6489 | 0.7135 | 0.1771 | 0.1174 | 1.73 |
| De-trending | 6 | 0.7037 | 0.7263 | 0.1731 | 0.1078 | 1.88 |
| Moving Average | 9 | 0.6285 | 0.7942 | 0.1501 | 0.1207 | 1.68 |
| Savitzky–Golay Smoothing | 9 | 0.6604 | 0.7446 | 0.1673 | 0.1151 | 1.76 |
| Extraction Method | Effective Variables |
|---|---|
| IRIV | 2, 6, 7, 18, 19, 20, 24, 25, 26, 28, 31, 35, 42, 54, 69, 73, 77, 82, 84, 88, 94, 97, 98, 101, 105, 112, 124, 125 |
| VISSA | 73, 28, 26, 42, 54, 25, 77, 125, 69, 112, 48, 45, 2, 88, 97, 90, 120, 27, 35, 101, 84, 7, 94, 124, 68, 38, 1, 98, 85, 31, 22, 105, 118, 123, 9, 17, 20, 122, 99, 3, 6, 93 |
| MASS | 73, 26, 28, 25, 35, 54, 112, 48, 58, 125, 77, 97, 17, 84, 45, 60, 88, 7, 70, 103, 38, 6, 9, 49, 2, 1, 23, 4, 14, 43, 20, 99, 117, 107 |
| RF | 2, 3, 4, 6, 7, 9, 17, 19, 20, 22, 26, 27, 45, 46, 48, 54, 56, 60, 82, 84, 88, 90, 94, 97, 99, 101, 103, 105, 110, 112, 117, 118, 125 |
| IVMR | 1, 2, 3, 4, 6, 7, 9, 17, 19, 20, 22, 25, 26, 27, 28, 31, 35, 38, 42, 45, 48, 54, 60, 69, 73, 77, 82, 84, 88, 90, 94, 97, 98, 99, 101, 103, 105, 112, 117, 118, 124, 125, 18, 24, 58, 70, 49, 23, 14, 43, 107, 46, 56, 110, 120, 68, 85, 123, 122, 93 |
| Extraction Method | Number of Effective Variables |
|---|---|
| IRIV | 28 |
| VISSA | 42 |
| MASS | 34 |
| RF | 33 |
| IVMR | 60 |
| IRIV-VISSA | 20 |
| IRIV-MASS | 22 |
| IVMR-VISSA | 27 |
| IVMR-VISSA-IRIV | 23 |
| Extraction Method | Number of Decision Trees | Rp2 | Rc2 | RMSEC | RMSEP | RPD |
|---|---|---|---|---|---|---|
| IRIV | 336 | 0.6638 | 0.8025 | 0.1471 | 0.1149 | 1.77 |
| VISSA | 42 | 0.6807 | 0.7594 | 0.1623 | 0.1119 | 1.82 |
| MASS | 7 | 0.7201 | 0.6925 | 0.1835 | 0.1048 | 1.94 |
| IVMR | 161 | 0.7406 | 0.7937 | 0.1503 | 0.1009 | 2.01 |
| RF | 135 | 0.6613 | 0.7855 | 0.1533 | 0.1153 | 1.76 |
| IRIV-VISSA | 390 | 0.6824 | 0.7905 | 0.1515 | 0.1116 | 1.82 |
| IRIV-MASS | 449 | 0.6588 | 0.7988 | 0.1484 | 0.1157 | 1.76 |
| IVMR-VISSA | 60 | 0.6057 | 0.7388 | 0.1691 | 0.1244 | 1.63 |
| IVMR-VISSA-IRIV | 12 | 0.7160 | 0.6548 | 0.1944 | 0.1056 | 1.93 |
| Extraction Method | LVs | Rp2 | Rc2 | RMSEC | RMSEP | RPD |
|---|---|---|---|---|---|---|
| IRIV | 15 | 0.7526 | 0.8406 | 0.1321 | 0.0985 | 2.06 |
| VISSA | 7 | 0.7259 | 0.7966 | 0.1493 | 0.1037 | 1.96 |
| MASS | 6 | 0.6739 | 0.7907 | 0.1514 | 0.1131 | 1.80 |
| RF | 8 | 0.6314 | 0.8646 | 0.1218 | 0.1203 | 1.69 |
| IVMR | 6 | 0.6224 | 0.8067 | 0.1455 | 0.1217 | 1.67 |
| IRIV-VISSA | 18 | 0.7790 | 0.8568 | 0.1252 | 0.0931 | 2.18 |
| IRIV-MASS | 20 | 0.7788 | 0.8619 | 0.1230 | 0.0932 | 2.18 |
| IVMR-VISSA | 12 | 0.6614 | 0.8970 | 0.1062 | 0.1153 | 1.76 |
| IVMR-VISSA-IRIV | 10 | 0.7496 | 0.8699 | 0.1194 | 0.0991 | 2.05 |
| Extraction Method | Neurons Number | Rp2 | Rc2 | RMSEC | RMSEP | RPD |
|---|---|---|---|---|---|---|
| IRIV | 9 | 0.7855 | 0.8073 | 0.1453 | 0.0917 | 2.22 |
| VISSA | 94 | 0.7194 | 0.8088 | 0.1447 | 0.1049 | 1.94 |
| MASS | 11 | 0.5911 | 0.8056 | 0.1459 | 0.1267 | 1.60 |
| RF | 72 | 0.7450 | 0.7964 | 0.1493 | 0.1000 | 2.03 |
| IVMR | 94 | 0.6913 | 0.8381 | 0.1331 | 0.1101 | 1.85 |
| IRIV-VISSA | 41 | 0.7980 | 0.8856 | 0.1119 | 0.0890 | 2.28 |
| IRIV-MASS | 98 | 0.7790 | 0.7996 | 0.1482 | 0.0931 | 2.18 |
| IVMR-VISSA | 83 | 0.7216 | 0.8385 | 0.1330 | 0.1045 | 1.94 |
| IVMR-VISSA-IRIV | 57 | 0.7901 | 0.8616 | 0.1231 | 0.0908 | 2.24 |
| Extraction Method | C | Rp2 | Rc2 | RMSEC | RMSEP | RPD |
|---|---|---|---|---|---|---|
| IRIV | 103.7 | 0.7705 | 0.7632 | 0.1610 | 0.0949 | 2.14 |
| VISSA | 103.8 | 0.7782 | 0.7597 | 0.1622 | 0.0933 | 2.18 |
| MASS | 103.6 | 0.7266 | 0.7458 | 0.1669 | 0.1036 | 1.96 |
| RF | 103.7 | 0.7730 | 0.7959 | 0.1495 | 0.0944 | 2.15 |
| IVMR | 104.8 | 0.5301 | 0.6653 | 0.1915 | 0.1358 | 1.50 |
| IRIV-VISSA | 104.0 | 0.8306 | 0.8489 | 0.1286 | 0.0815 | 2.49 |
| IRIV-MASS | 104.1 | 0.8395 | 0.8693 | 0.1197 | 0.0794 | 2.56 |
| IVMR-VISSA | 105.0 | 0.8203 | 0.8199 | 0.1405 | 0.0840 | 2.42 |
| IVMR-VISSA-IRIV | 105.3 | 0.8512 | 0.8580 | 0.1247 | 0.0764 | 2.66 |
| Regression Model | Extraction Method | RP2 | RC2 | RMSEC | RMSEP | RPD |
|---|---|---|---|---|---|---|
| RFR | IVMR | 0.7406 | 0.7937 | 0.1503 | 0.1009 | 2.01 |
| PLSR | IRIV-VISSA | 0.7790 | 0.8568 | 0.1252 | 0.0931 | 2.18 |
| ELM | IRIV-VISSA | 0.7980 | 0.8856 | 0.1119 | 0.0890 | 2.28 |
| MK-SVR | IVMR-VISSA-IRIV | 0.8512 | 0.8580 | 0.1247 | 0.0764 | 2.66 |
Publisher’s Note: MDPI stays neutral with regard to jurisdictional claims in published maps and institutional affiliations. |
© 2022 by the authors. Licensee MDPI, Basel, Switzerland. This article is an open access article distributed under the terms and conditions of the Creative Commons Attribution (CC BY) license (https://creativecommons.org/licenses/by/4.0/).
Share and Cite
Wang, X.; Xu, L.; Chen, H.; Zou, Z.; Huang, P.; Xin, B. Non-Destructive Detection of pH Value of Kiwifruit Based on Hyperspectral Fluorescence Imaging Technology. Agriculture 2022, 12, 208. https://doi.org/10.3390/agriculture12020208
Wang X, Xu L, Chen H, Zou Z, Huang P, Xin B. Non-Destructive Detection of pH Value of Kiwifruit Based on Hyperspectral Fluorescence Imaging Technology. Agriculture. 2022; 12(2):208. https://doi.org/10.3390/agriculture12020208
Chicago/Turabian StyleWang, Xiaohui, Lijia Xu, Heng Chen, Zhiyong Zou, Peng Huang, and Bo Xin. 2022. "Non-Destructive Detection of pH Value of Kiwifruit Based on Hyperspectral Fluorescence Imaging Technology" Agriculture 12, no. 2: 208. https://doi.org/10.3390/agriculture12020208
APA StyleWang, X., Xu, L., Chen, H., Zou, Z., Huang, P., & Xin, B. (2022). Non-Destructive Detection of pH Value of Kiwifruit Based on Hyperspectral Fluorescence Imaging Technology. Agriculture, 12(2), 208. https://doi.org/10.3390/agriculture12020208