1. Introduction
Agriculture places substantial burdens on land, contributing to environmental problems related to biodiversity losses, climate change, and pollution. Often, these consequences are directly caused by agricultural production practices or land use change. These effects can include, but are certainly not limited to, contaminated farmland, degraded soils, or destroyed habitats [
1,
2]. In response, policymakers emphasize the necessity of mitigating the environmental impacts of agriculture while providing economic support to farmers. One notable policy intervention includes green payment programs or financial incentives paid to farmers adopting agricultural practices that protect the environment [
3]. Green payment programs such as the Conservation Reserve Program (CRP) in the United States enrolls 9.8 million hectares of farmland at an annual cost of USD 1.8 billion [
4]. Similarly, the European Union dedicates 30% of their income support in agriculture on comparable programs [
5].
Given this sheer amount of financial spending, green payment programs have important impacts on agriculture. It is reasonable to hypothesize that these impacts are also likely to extend to farmland prices. On the one hand, if the financial support provided by green payment programs can increase agricultural profits (e.g., higher prices for farmers or reduced production costs), then green payment programs will be positively capitalized into farmland prices [
6]. On the other hand, if the financial support provided by green payment programs is unable to offset the economic losses from adopting environmentally friendly agricultural practices, then they might have null or even negative effects on farmland prices [
6]. Although many studies have examined the impact of green payment programs on agricultural and economic outcomes ranging from agricultural productivity to farm income, there is little research on the effects of these policies on farmland prices [
7,
8,
9,
10]. Because green payment programs are being considered as a potential solution to the environmental impacts caused by agriculture, it is essential to understand their impact on financial assets such as farmland prices.
This paper examines the impact of green payment programs on farmland prices. Although government support programs in agriculture such as direct payments are capitalized into farmland prices, participation in green payment programs can have negative effects on agricultural and economic outcomes. Thus, it is unknown whether these policies will increase or decrease farmland prices. In 2015, the Taiwanese government implemented the Green Environmental Payment Program to reduce the environmental damage caused by excessive paddy rice production on the island. The Green Environmental Payment Program encourages farmers to produce an optimal amount of production while providing financial incentives for them to adopt agricultural practices protecting the environment [
11]. We use the ordinary least squares (OLS) method and the semi-parametric smooth coefficient model with farmland market transactions data to quantify the causal impact of this policy on farmland prices in Taiwan. The smooth coefficient model allows us to evaluate the non-linear effect of green payment programs on farmland prices across the farmland size distribution. This evaluation is important as green payment programs are likely to have heterogeneous effects on small, medium, and large farms based on their economic returns from agriculture. Finally, we also consider the policy’s effect on urban and rural farmland prices.
This paper connects the literature on government support programs in agriculture and green payment programs in several ways. First, we examine the impact of green payment programs on farmland prices. Prior research has only considered the effect of direct payments on farmland prices [
12,
13,
14,
15]. The distinction between direct payments and green payment programs is that the former only pays farmers based on farmland size. However, the latter pays farmers based on their adoption of environmentally friendly agricultural practices [
3]. Thus, the extent to which green payment programs affect farmland prices is unclear because they include additional production requirements that are not applicable to other common government support programs in agriculture. Second, we expand on the literature related to the effects of green payment programs on agricultural and economic outcomes. Studies have estimated the impact of green payment programs on agricultural productivity and farm income [
7,
8,
9]. However, these studies only calculate the average effects of these policies by controlling for farmland size. Thus, these studies do not consider their heterogeneous effects [
8,
9]. As an example, larger (smaller) farms could be more (less) likely to incur benefits from government support programs depending on whether they can achieve economies of scale.
To provide further insight on the impacts of these policies, we use the semi-parametric smooth coefficient model. This empirical specification allows us to examine the effect of green payment programs across different quantiles of the farmland size distribution, relaxing the linearity assumption of an interacted variable. We also present causal estimates because the implementation and timing of the Green Environmental Payment Program was decided by the Council of Agriculture. In other words, the empirical specification used in our paper is akin to a natural experiment. Finally, we use administrative farmland transactions data on all farmland transactions affected by this policy during our study period in Taiwan. The total number of observations used in this paper includes 109,453 farmland transactions. This data reduces the measurement error associated with the small sample sizes from the existing literature relying on representative surveys with only 1535 and 146 observations from the United States and Europe [
7,
8].
This paper is structured as follows. The following section reviews the literature. Next, we introduce the Green Environmental Payment Program. Then, we present the results. Finally, we discuss the results and conclude.
2. Literature Review
There are two strands of literature that are closely related to this paper. The first strand of literature considers the capitalization effect of government support programs in agriculture on farmland prices. The second strand of literature examines the impact of green payment programs on agricultural and economic outcomes. We review these closely related studies in this section.
The first strand of literature evaluates the capitalization effect of government support programs in agriculture on farmland prices. The capitalization effect occurs when subsidies from government support programs in agriculture increases farmland prices. Weersink [
6] observes that government support programs in agriculture are capitalized at a rate from 5 to 25%. Prior research has mostly focused on the effect of direct payments on farmland prices. In most studies, direct payments are defined as financial payments provided to farmers from governments. They are usually based on cultivation areas or farmland size. Ifft et al. [
12] considers the impact of direct payments from the Farmland Bill on crop values in the United States. Using field-level data with the fixed effects model from the National Agricultural Statistics Survey, an additional dollar of direct payments is associated with an increase of USD 18 per acre in cropland values. Patton et al. [
13] finds that most direct payments for livestock enterprises, such as beef, sheep, and sucker cow slaughter schemes, are capitalized into farmland rents at a rate of 41 pence per pound in Ireland using their generalized method of moments (GMM) model. However, Karlsson and Nilsson [
14] find that direct payments do not affect the prices of small and medium-sized farms using their spatial-membership model in Sweden. Varacca et al. [
15] conclude in their meta-analysis that direct payments are capitalized into farmland prices based on the implementation scheme of respective member states in the European Union. Although direct payments are usually correlated with farmland prices, the specific provisions of these policies will affect their capitalization rate into farmland prices.
The second strand of literature studies the impact of green payment programs on agricultural and economic outcomes. Chang et al. [
7] examines the effect of participating in the Conservation Reserve Program (CRP) on economic well-being in the United States. The authors employ an econometric model combining the endogenous treatment variable with the quantile regression model, finding that participation in the CRP is associated with lower levels of household consumption and income and higher levels of savings. Udagawa et al. [
8] evaluates the impact of participating in the Entry Level Stewardship (ELS) program on cereal farm incomes in England. Their differences-in-differences model combined with propensity score matching concludes that the scheme negatively impacts cereal farm incomes, likely through facilitating land use changes. Mennig and Sauer [
9] use a similar model and find that agri-environmental schemes reduce agricultural productivity on arable and dairy farms in Germany. Fraser [
10] notes that farmland heterogeneity is likely to result in over or underpayments from governments to farmers participating in these policies.
3. Background on the Green Environmental Payment Program in Taiwan
The Green Environmental Payment Program was implemented by the Council of Agriculture in 2015. Prior to Taiwan’s membership of the World Trade Organization (WTO), the government subsidized paddy rice production and established price floors in agriculture. This support resulted in substantial financial costs to the government, which was forced to purchase surpluses from farmers. It also caused environmental damage to farmland from the excessive application of pesticides and fertilizers.
Subsequently, green payment programs were enacted to address these concerns in Taiwan [
7]. The policy encourages farmers to produce an optimal amount of production while providing financial incentives for them to adopt agricultural practices protecting the environment. The key components include facilitating the adoption of environmentally friendly agricultural practices, improving the diversity and quality of crops, and guaranteeing the sustainable development of farmland.
First, farmers may receive payments for producing high-quality paddy rice, rather than relying on price subsidies [
16]. The payments issued to these farmers range from NTD 10,000 to 13,500 per hectare. Unlike with price floors, farmers no longer have any incentives to overproduce. Farmers may receive up to an additional NTD 30,000 if they adopt additional environmentally friendly agricultural practices when producing high-quality rice. Second, farmers are incentivized to diversify crop production to allow farmland to recover from constant monoculture harvesting cycles. The Council of Agriculture rewards up to NTD 60,000 per hectare for farmers producing crops for import substitution, export potential, or specialty crops, which includes 40 listed crops [
16]. Local governments also encourage contract farming between farmers and producers. Finally, farmers may receive subsidies to guarantee the sustainable development of farmland. Farmers are paid from NTD 34,000 to 45,000 for cultivating landscapes, planting green manure, and storing water. Additionally, farmers producing organic products receive NTD 60,000 to 80,000 per hectare annually for up to three years. Family farms receive an additional NTD 30,000 per hectare annually [
16]. The number of townships initially piloting green payment programs has slowly expanded across Taiwan. We use this variation in the implementation of the policy to identify its causal effects on farmland prices.
4. Materials and Methods
4.1. Data
The primary dataset was drawn from the Actual Price Registration System (APRS) managed by the Ministry of Interior in Taiwan. According to the Land Administration Law passed in August 2012, property transactions must be reported to the Ministry of Interior within 14 days of the sale. Thus, the APRS records information on all property transactions and serves as an important resource for understanding the farmland market and farmland prices in Taiwan.
Although the APRS includes data on farmland size, geographic location, land use purpose, sales price, and the month and year of the transaction, it does not include any information on the agricultural and environmental characteristics where each parcel of farmland is located. Given that the price of farmland will also be determined by these characteristics, we created geographic maps using ArcGIS to measure the agricultural and environmental characteristics where each parcel of farmland is located. The geographic maps include information on the location of polluted areas, farmland quality, priority agricultural zones, general agricultural zones, highways, and farmer’s associations. Because agricultural productivity is correlated with farmland prices, we denote a continuous variable for farmland productivity ranging from 1 to 11. Higher scores are more favorable for agricultural production. Two variables indicate whether the farmland is located in priority or general agricultural zones. Finally, we specify variables measuring the distance of the farmland to the nearest irrigation zone, polluted area, highway, farmer’s association, and city planning zone.
The dependent variable is the logarithm of farmland sales prices. Importantly, we include a dummy variable based on whether the farmland was sold in a township where the Green Environmental Payment Program was implemented at the time of the sale. The value of this variable equals to 1 at time t, and 0 otherwise. The Council of Agriculture began piloting the Green Environmental Payment Program in 2015. The priority and implementation date of the policy across townships was also determined by authorities. Thus, we leverage the timing of the township-by-township rollout of the Green Environmental Payment Program to identify its causal effect on farmland prices. The final dataset includes 109,453 parcels of farmland sold between January 2015 and December 2019 in Taiwan.
Table 1 presents definitions and summary statistics of farmland prices sold before and after the policy was implemented. Among the 109,453 farmland transactions sold from January 2015 to December 2019, 25,231 parcels of farmland (23%) were sold in townships where the policy was implemented at the time of the sale. A total of 84,222 parcels of farmland (77%) were sold in townships where the policy was
not implemented at the time of the sale. The average price of farmland sold in townships where the policy was implemented is slightly higher than their non-eligible counterparts (NTD 6.70/m
2 vs. NTD 6.43/m
2). Farmland sold in townships where the policy was implemented at the time were further away in distance from the nearest irrigation zone and city planning zone. The summary statistics provide suggestive evidence that the green payments program increased farmland prices in Taiwan, although it is necessary to control for other confounding variables using an econometric model.
4.2. Econometric Model
The main purpose of this study is to investigate the causal effect of green payment programs on farmland prices. As a township’s eligibility to participate in this policy was determined by the government, the policy’s implementation is exogenous to other factors affecting the farmland market. In other words, endogeneity bias is less likely to occur in this setting. The econometric model is based on the hedonic price theory, which models the price of a property based on its characteristics or traits [
17]. In this case, the agricultural and environmental features of farmland determine its price. We estimate the standard farmland price equation as:
where log(
yijt) is the log of farmland price for
ith parcel of farmland located in the
jth township sold at time
t;
Gjt is a binary indicator equal to 1 if the
jth township implemented the green payment program at time
t;
Xijt is a vector of other explanatory variables associated with farmland prices;
uj and
vt are township and time fixed effects, and
εi is the random error term.
are the parameters to be estimated. The parameter
γ measures the change in farmland prices in percentage points due to the implementation of the policy, other things being equal. The parameters specified in Equation (1) are estimated using the ordinary least squares (OLS) method.
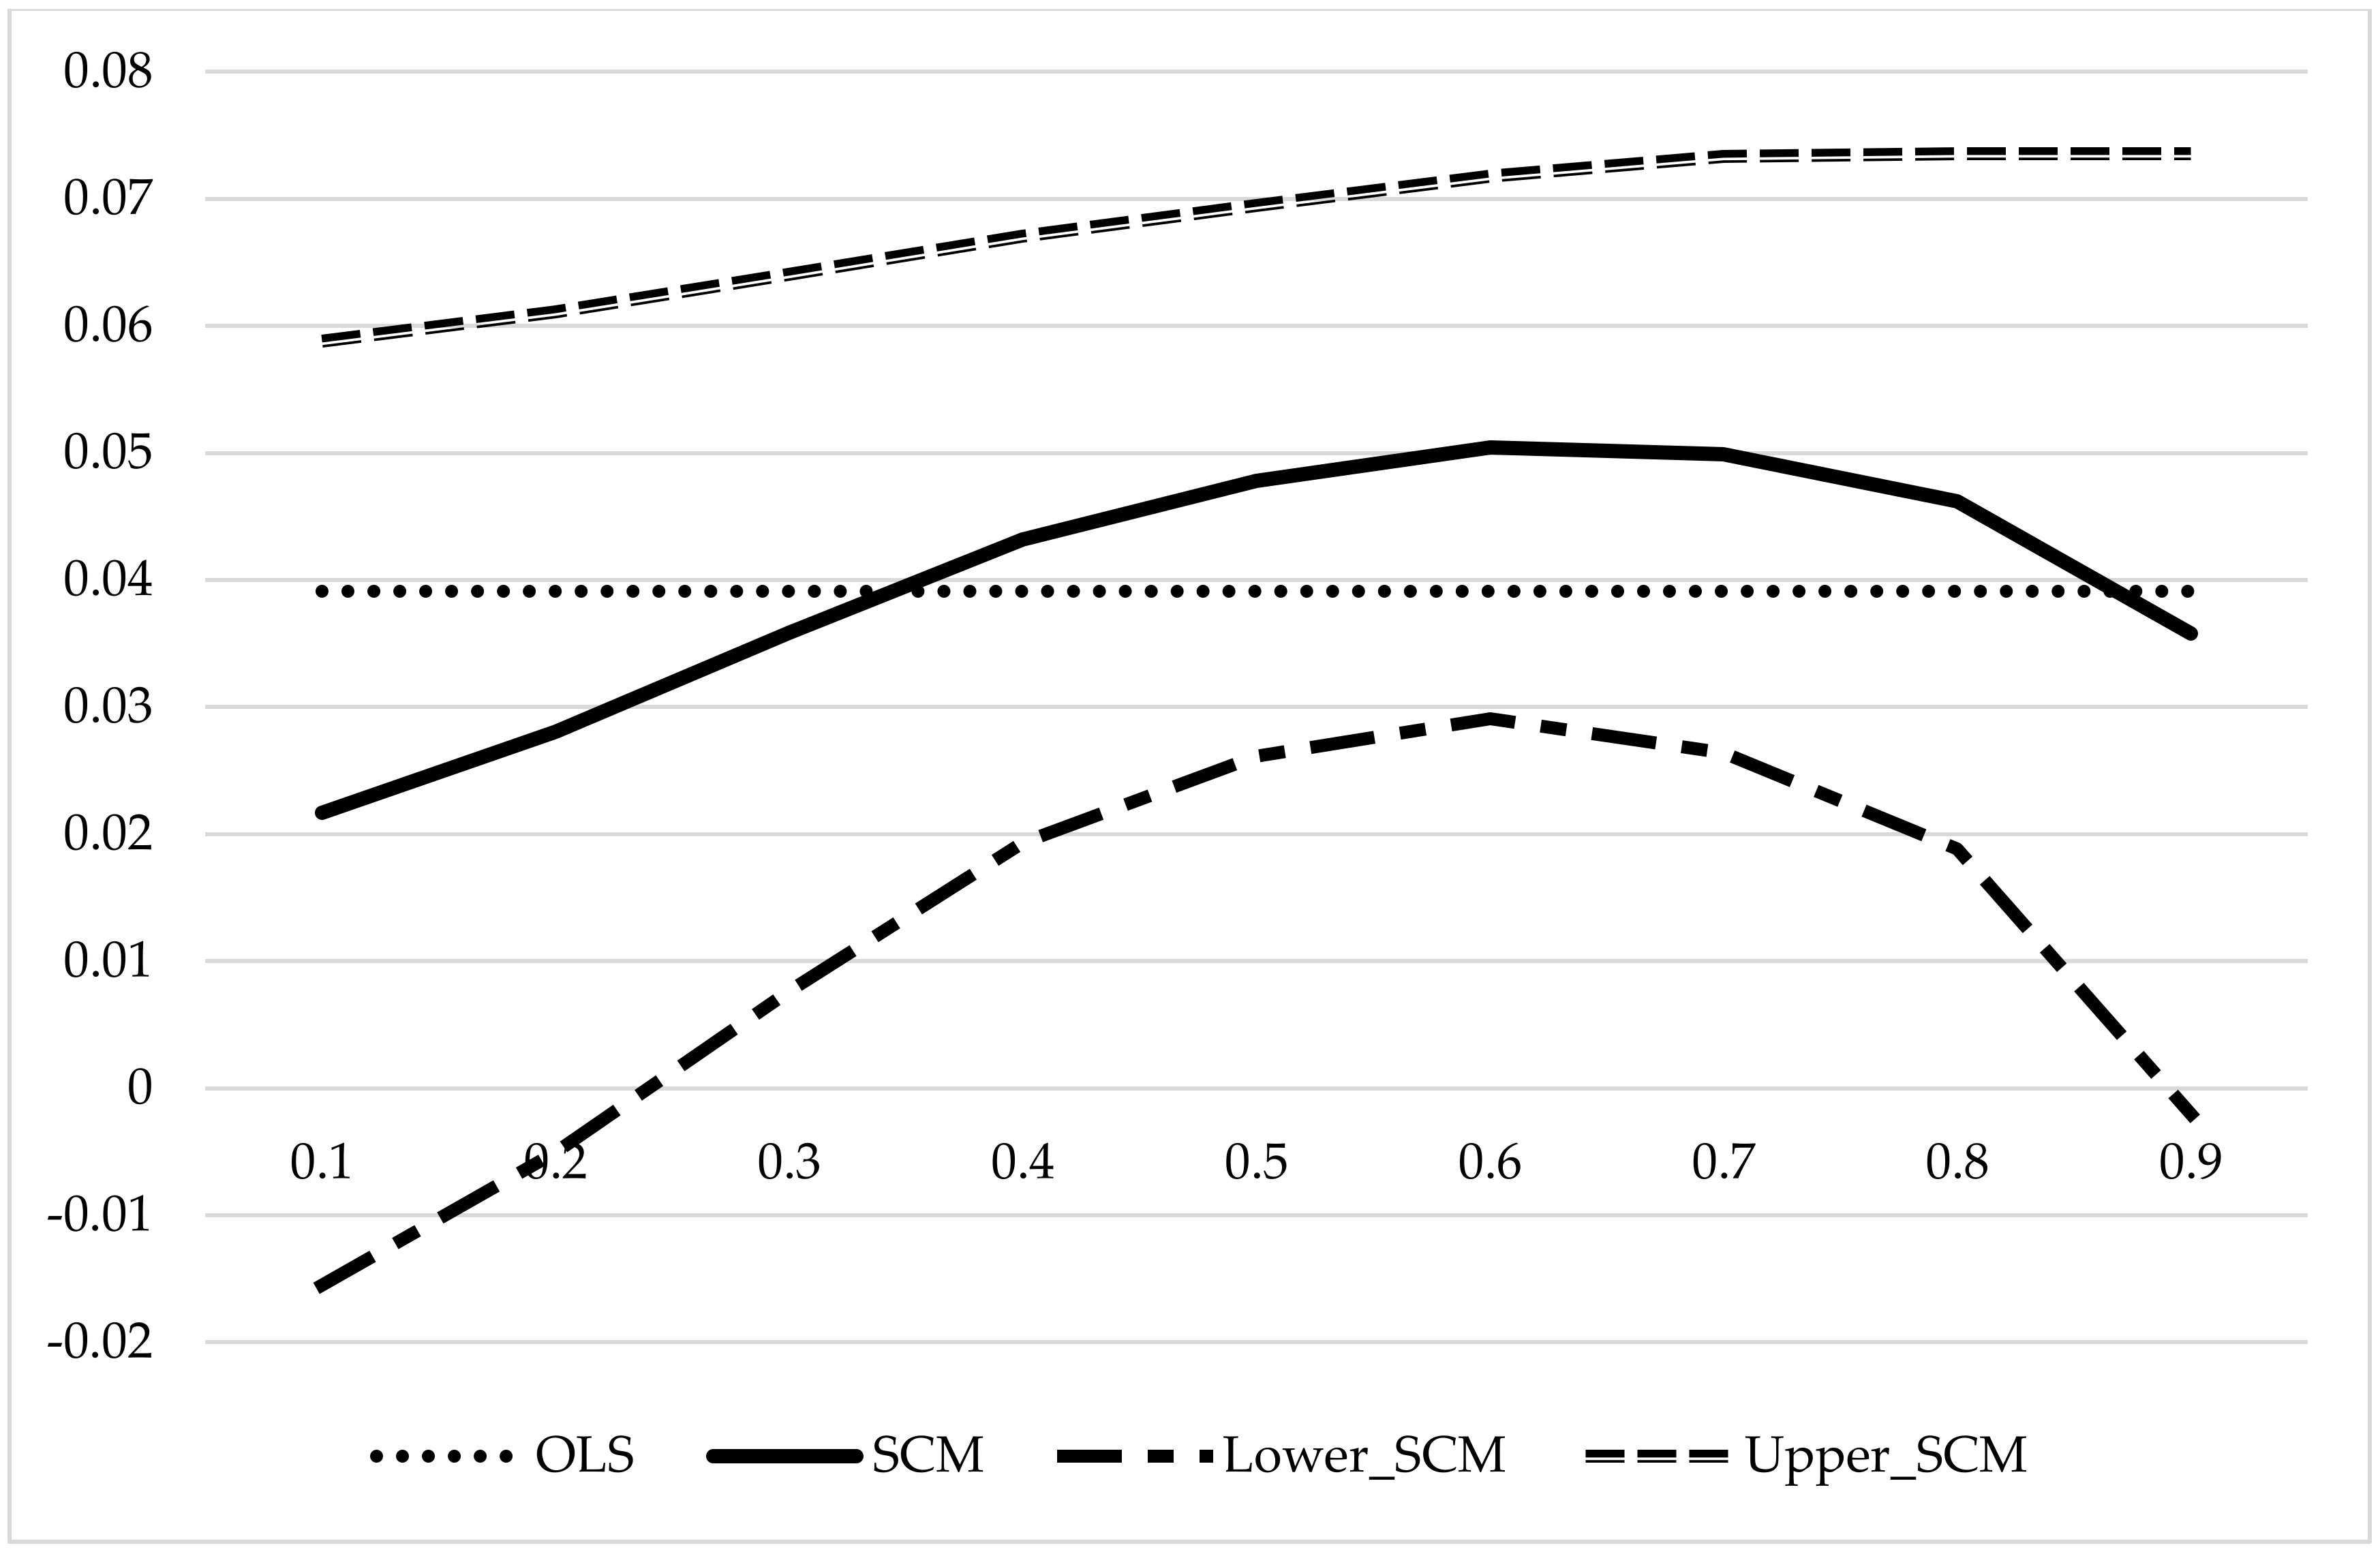
To further investigate the effect of green payment programs on farmland prices, we extend Equation (1) using the semi-parametric smooth coefficient (SCM) model. This method evaluates the impact of green payment programs at different points of the farmland size distribution. In other words, we examine the non-linear effects of the policy on farmland prices, allowing us to quantify the heterogeneous effect on small, medium, and large farms. Assume that output
yijt is a function of the two sets of variables
Xijt and
zijt, where the influence of
Xijt on
yijt follows an unspecified smoothing function of
zijt. The SCM model is akin to multiplicative interactive models where the variable
zijt is used to relax the linearity assumption of the interaction [
18,
19]. The model has also been widely employed in other empirical studies. Li et al. [
20] use it to study the production function of China’s non-metallic mineral industry. The authors apply the SCM model because the effect of labor and capital inputs on mineral production can vary depending on the amount of research and development adopted by individual enterprises. The standard farmland price equation using the SCM model is specified as:
where
zijt is the size of farmland and
r1(zijt) is a vector of unspecified smoothing function of
zijt. The coefficient
γ1 captures the effect of the policy on farmland prices at specific quantiles of the farmland size distribution. We used the STATA statistical software to estimate the OLS method and SCM model.
6. Discussion and Conclusions
This paper examines the impact of the Green Environmental Payment Program on farmland prices in Taiwan. We estimate the OLS method and SCM model to evaluate the average and heterogeneous effects of the policy. The policy increased farmland prices, particularly on larger farms and urban farms.
The policy increased farmland prices because it allows farmers to receive an additional benefit from selling farmland located in designated townships in Taiwan. Although prior research has suggested that these policies have decreased agricultural productivity and farm income in the United States and Europe, participation in this policy remains optional for farmers in Taiwan [
7,
8,
9]. Our results suggest that green payment programs can still have positive agricultural and economic outcomes on other assets such as farmland prices. As farmland prices are one of the most important indicators of financial well-being in agriculture, governments can remain confident that these policies will be capitalized into farmland prices. The policy also increased farmland prices for larger farms across the farmland size distribution. These results are consistent with the literature examining the relationship between agricultural productivity and farm size. Sumner and Key [
24] and Key [
25] observe that farmland size increases agricultural productivity in the corn and other industries in the United States. Larger farms can take advantage of economies of scale, reducing their production costs while maximizing their yields [
24,
25]. Similarly, Gonzales et al. [
26] and Latruffe and Piet [
27] note that smaller farms are usually less efficient and productive because of the size and shape of their farmland. These problems are particularly applicable to Taiwan, where most farms are family run and cultivate an average of 1.1 hectares [
28]. Thus, green payments are further capitalized into the farmland prices of larger farms because they have the capital and labor inputs to adopt environmentally friendly agricultural practices at more profitable scales.
Finally, the policy substantially increased rural farmland prices while having no effect on urban farmland prices. These results are consistent with prior research demonstrating that government support programs in agriculture are capitalized at higher rates for farmland located further away from metropolitan areas [
23]. Rural farmland is more often dedicated to agriculture because urban farmland can be used for non-agricultural purposes such as illegal manufacturing factories or real estate investments in Taiwan [
22,
29]. These non-agricultural purposes provide higher economic returns from farmland in comparison to agriculture. Thus, green payment programs increased rural farmland prices while having no effect on urban farmland prices because the policy is unlikely to be capitalized into farmland prices used for non-agricultural purposes.
The findings from this paper have several implications for green payment programs. First, governments should emphasize the capitalization effect of green payment programs on farmland prices when encouraging farmers to enroll in the policy. This result is particularly relevant as case studies have indicated that these policies have negative impacts on agricultural and economic outcomes [
7,
8,
9]. Second, governments should also consider providing small farmers additional financial support from these policies. Although the policy provides family-run farms with an additional NTD 30,000 per hectare, this payment should be increased to ensure equitable benefits from the policy across the farmland size distribution. The amount of financial support provided to family-run farms could be further increased for the first hectare or conditioned on the proportion of farmland enrolled in the policy. Authorities should also provide further technical assistance to small farmers who adopt environmentally friendly agricultural practices to reduce the capital and labor costs incurred by these farms. Given that urban farmland prices were not affected by this policy, governments should consider supplementary measures to increase the financial incentives provided by this policy for these farms. These measures would also increase the likelihood that urban farms are used for agriculture, rather than for non-agricultural purposes such as real estate.
Finally, this paper complements the literature examining how direct payments can be reformed to improve environmental outcomes. Sadłowski et al. [
30] find that the 2015 Common Agricultural Policy (CAP) Reform redistributed funds from environmentally friendly agricultural practices, rather than supporting them, in Poland. Similarly, Scown et al. [
31] indicate that government support programs in the CAP must be more explicitly linked to climate and environmental outcomes. We complement these studies by providing some evidence on how policies facilitating environmentally friendly agricultural practices would still yield economic benefits to farmers through farmland prices.
In conclusion, although we are among the first to estimate the impact of green payment programs on farmland prices, several caveats remain. First, we do not have any information on which farms enrolled in the policy. Future studies can evaluate how green payment programs affect agricultural productivity and farm income in Taiwan. Second, we cannot identify the exact channel responsible for these results. Future studies can examine these mechanisms in other countries implementing similar government support programs in agriculture. Regardless, this paper is among the first to examine the effect of green payment programs on farmland prices.


