Article

Sorghum-Based Power Generation in Southern Ukraine: Energy and Environmental Assessment

1
Department of Tractors and Agricultural Machines, Operating and Maintenance, Mykolaiv National Agrarian University, 54020 Mykolaiv, Ukraine
2
Department of Entrepreneurship and Marketing, Institute of Economics and Management, Ivano-Frankivsk National Technical Oil and Gas University, 76019 Ivano-Frankivsk, Ukraine
3
SCIRE Foundation, 00867 Warsaw, Poland
*
Author to whom correspondence should be addressed.
Agriculture 2022, 12(12), 2148; https://doi.org/10.3390/agriculture12122148
Submission received: 25 October 2022 / Revised: 11 December 2022 / Accepted: 12 December 2022 / Published: 14 December 2022
(This article belongs to the Special Issue Green and Sustainable Agricultural Ecosystem)

Abstract

:
An increase in energy demand, fossil fuel reserves depletion, and environmental issues are primary reasons for renewable energy use, including power generation. Bioenergy is the primary alternative to conventional hydrocarbon fuels. Biomass-based power generation is increasing due to some reasons, including a gradual decrease in the levelized cost of electricity and a reduction of carbon dioxide emissions. Sorghum is a promising energy crop for semi-arid climate zones, including southern Ukraine. It can be used for both biofuel production and power generation. However, there is a lack of methodology for energy and environmental assessments of sorghum-based power generation. Some possible technologies were analyzed. The novelty of this study is the accounting of energy consumed and carbon dioxide emissions during crop cultivation. We have determined that sorghum-based power plants can generate from 2 to 12 MWh per hectare. Their operation significantly reduces carbon dioxide emissions (from 613 to 3652 kg of carbon dioxide per hectare of sorghum silage cultivation). Sorghum-based biogas plants have energy and environmental advantages if they use co-generation technologies and utilize digestate as a biofertilizer. The utilization of digestate (obtained from silage production per hectare) substitutes up to 12.8 MWh of indirect energy. The results obtained can be used by farmers and authorities for bioenergy development.

1. Introduction

In 2020, the world’s electricity generation was 26,823 TWh, wherein the share of renewables reached 11.7%. The world leader in renewables is the Asia-Pacific region. It generated 1,322 TWh. Despite the low renewable power generation (921 TWh), European countries have their highest share of 23.8%. The global tendency is an increase in renewables in power generation [1].
In the world, the share of installed renewable capacity, including hydropower, was around 38.3%. In Europe, this indicator was 52.2%. It allows European renewable power systems and hydroelectric to generate up to 40% of the total electricity generation (including 23.8% of renewables) [2,3]. The steady growth of renewables, including bioenergy, is stipulated by some significant factors. Power generation based on conventional fuels is accompanied by numerous associated issues, such as the exhaustibility of fossil fuels, greenhouse gas emissions, an increase in fuel prices, etc. The first factor is a decrease in the levelized cost of electricity (LCOE). Thus, in 2021, the average LCOE of bioenergy was USD 67/MWh [4]. In 2022, the competitiveness of all renewable technologies was improved due to the global energy crisis [4]. This crisis caused a significant increase in wholesale electricity prices. In December 2021, they varied from EUR100/MWh (Finland and Ukraine) [5,6] to EUR270/MWh (Italy) [7,8]. The statistics show that since 2008 electricity prices have increased by around 30% [9]. Thereby, high market prices promote the expansion of renewable power generation.
After the Russian invasion of Ukraine, the European Union speeded up the development of renewable power generation [10]. By the end of 2022, authorities of European countries plan to increase the share of renewable electricity (without hydroelectric) to 25% [11].
The valuable advantage of bioenergy is a higher capacity factor compared to hydropower, Solar PV, and wind power plants [4]. Moreover, renewables create new jobs. In 2021, world employment was 12.7 million, including 1.23 million in bioenergy (solid biomass and biogas) [12].
Ukrainian electricity generation primarily relies on uranium and coal. In 2021, the share of renewables was 10.7%. Their capacity was 13.8 GW or 24% of the total national power capacity. Among renewables, hydroelectricity held the first position. The share of biomass-based power plants was 2%. These plants generated 3% of the total electricity generated [13].
Conventional power plants emit plenty of carbon dioxide. The average carbon dioxide emission factors are as follows, kgCO2/kWh: coal-fired power plants—1.105; nuclear power plants—0.029; and combined heat and power plants—0.499 [14,15,16,17,18,19,20]. The average national carbon dioxide emission factor is 0.318 kgCO2/kWh [20]. This value is lower than the average carbon dioxide emission factor in countries in the European Union [21].
Since 2020, wholesale electricity prices have increased. A rise in fossil fuel prices is the primary reason [9]. In 2022, the average fuel-only costs for fossil fuel-fired power generation were fairly high. Thus, they varied from USD 50/MWh to USD 268/MWh for natural gas-fired power plants and from USD 77/MWh to USD 127/MWh for coal-fired power plants. These costs are higher compared to bioenergy [4]. Moreover, the burning of fossil fuels results in carbon dioxide emissions. This greenhouse gas spurs global warming. The use of biomass for power generation significantly reduces carbon dioxide emissions. That is why bioenergy can be a competitive alternative to conventional power generation.
Issues of greenhouse gas emissions and expensive fossil fuels are driving forces for biomass-based power generation, including sorghum-based ones. In the European Union, agricultural biomass is used as the primary feedstock for bioenergy [22,23,24,25]. Sorghum can be a feedstock for power generation too. This crop is suitable for different technologies, such as direct burning, anaerobic digestion, and fermentation [25,26,27,28].
Direct biomass burning and co-firing technologies are widespread for power generation. Biomass contains mineral compounds that cause combustion problems. Methanation, fermentation, gasification, and pyrolysis are used to improve the quality of biofuels [29]. Derived biofuels (gaseous and liquid) are used in power generation technologies such as boilers, internal combustion engines, gas turbines, and fuel cells. However, technological and economic problems hinder the distribution of gasification and pyrolysis technologies [30,31].
Sorghum can be converted into bioethanol. Further, fuel cells or internal combustion engine generators are fueled by bioethanol. Despite the high electric efficiency (up to 40–50%), high production costs of bioethanol and expensive equipment are the primary drawbacks of these technologies [30,32,33].
Biogas-based power generation is currently a mature technology. Biogas is used in both generation and co-generation plants. As a rule, biogas power plants use internal combustion engine generators with high electric efficiency (up to 50%) [34,35]. Biogas and combustion-based technologies are currently at a mature commercial stage, and they are the subject of this study.
Sorghum is a promising energy crop. In semi-arid climate zones, such as southern Ukraine, sorghum silage has a higher yield compared to corn silage [36]. Thus, the corn silage yield is around 22 t/ha. At the same time, sorghum silage gives a 40 t/ha yield. Although, unlike corn, the current production of sorghum is from 100 to 275 thousand metric tons per year [37].
Sorghum as an energy crop is a spotlight of numerous research. Sorghum is estimated to be a valuable resource for producing biofuels and biodegradable materials [38]. Krzystek et al. [39] investigated the biomethane yield and energy efficiency of sorghum cultivation. They revealed that reducing the application of nitrogen fertilizers increases the energy efficiency of sorghum production. In most cases, the low inputs of fertilizers (80 kg N per ha) raise the biomethane yield from one metric ton of sorghum silage. This fact allows farmers to implement resource-saving technologies. Matsakas et al. [40] evaluated the methane potential of dried sorghum stalks. They reported that even dried sweet sorghum stalks are suitable for anaerobic digestion. Salimbeni [41] focused on biofertilizer production by sorghum-based biogas plants. He proposed an integrated anaerobic digestion technology to improve the nutrient content of biofertilizers. That increases the economic attractiveness of sorghum-based biogas plants. Life cycle assessment and the potential greenhouse gas savings in a coal-fired power plant by co-firing with sorghum pellets were studied in Indonesia [42]. Researchers studied sorghum cultivation on marginal land in Indonesia. They found that the co-firing of sorghum pellets and coal can reduce carbon dioxide emissions by 85%. The energy yield of sorghum as a bioenergy feedstock has been analyzed by Ren et al. [43]. The energy efficiency of sweet sorghum for biomethane production was evaluated by Jankowski et al. [44]. Biboum and Yilanci [45] carried out a feasibility study of sorghum-fired power plants in the Sub-Saharan region. They found that the levelized cost of electricity generated by sorghum power plants is competitive and ranges from USD 6.8/MWh to USD 12.9/MWh.
Adequate utilization of indigenous sorghum biomass requires knowledge of energy and environmental indicators for power supply systems. Despite the numerous research, there is a lack of energy and environmental assessment of sorghum-based power generation for semi-arid climate zones, for example, southern Ukraine. The novelty of this study is the determination of such indicators as energy-specific costs, carbon dioxide emissions savings, the embodied energy of sorghum silage, the carbon dioxide emission factor associated with sorghum silage production, and energy costs of bioenergy.
The purpose of this study was to determine the energy efficiency and carbon dioxide savings of sorghum-based power plants. To reach this purpose, the following objectives were set up:
  • To find the carbon dioxide emission factor, embodied energy, and production costs of sorghum silage based on a field experiment;
  • To compare sorghum to other biomass-based and fossil fuels (coal and natural gas);
  • To determine the energy-specific cost for different power generation technologies;
  • To evaluate the carbon dioxide savings.

2. Materials and Methods

This study was carried out based on the following scientific sources: the results of our own field experiments and a review of the literature of relevant publications. The results of our field experiments were used to determine some indicators, such as sorghum silage yield, production costs, embodied energy, and Well-to-Tank (WTT) carbon dioxide emissions.
In this study, we used the following units. The power was measured in kW and MW. Energy generated is presented in kWh and MWh. We used kgCO2/kWh, kgCO2/ha, and kgCO2/MJ to measure carbon dioxide emissions. The mass was measured in kg and tons. The relationship between these units is as follows: 1 ton = 1000 kg. The energy-specific costs were presented in MJ/kWh, and the specific fuel costs were measured in USD/kWh.

2.1. Crop Properties

In this study, we compared energy and environmental indicators of sorghum silage and other biomass, such as maize silage, cereal straw, and maize stalk. Their primary properties (lower heating values and moisture) were taken from different sources [43,44,46,47]. Energy consumption and carbon dioxide footprint associated with straw formation were determined by the methods of Mishra et al. [48] and Fix et al. [49].

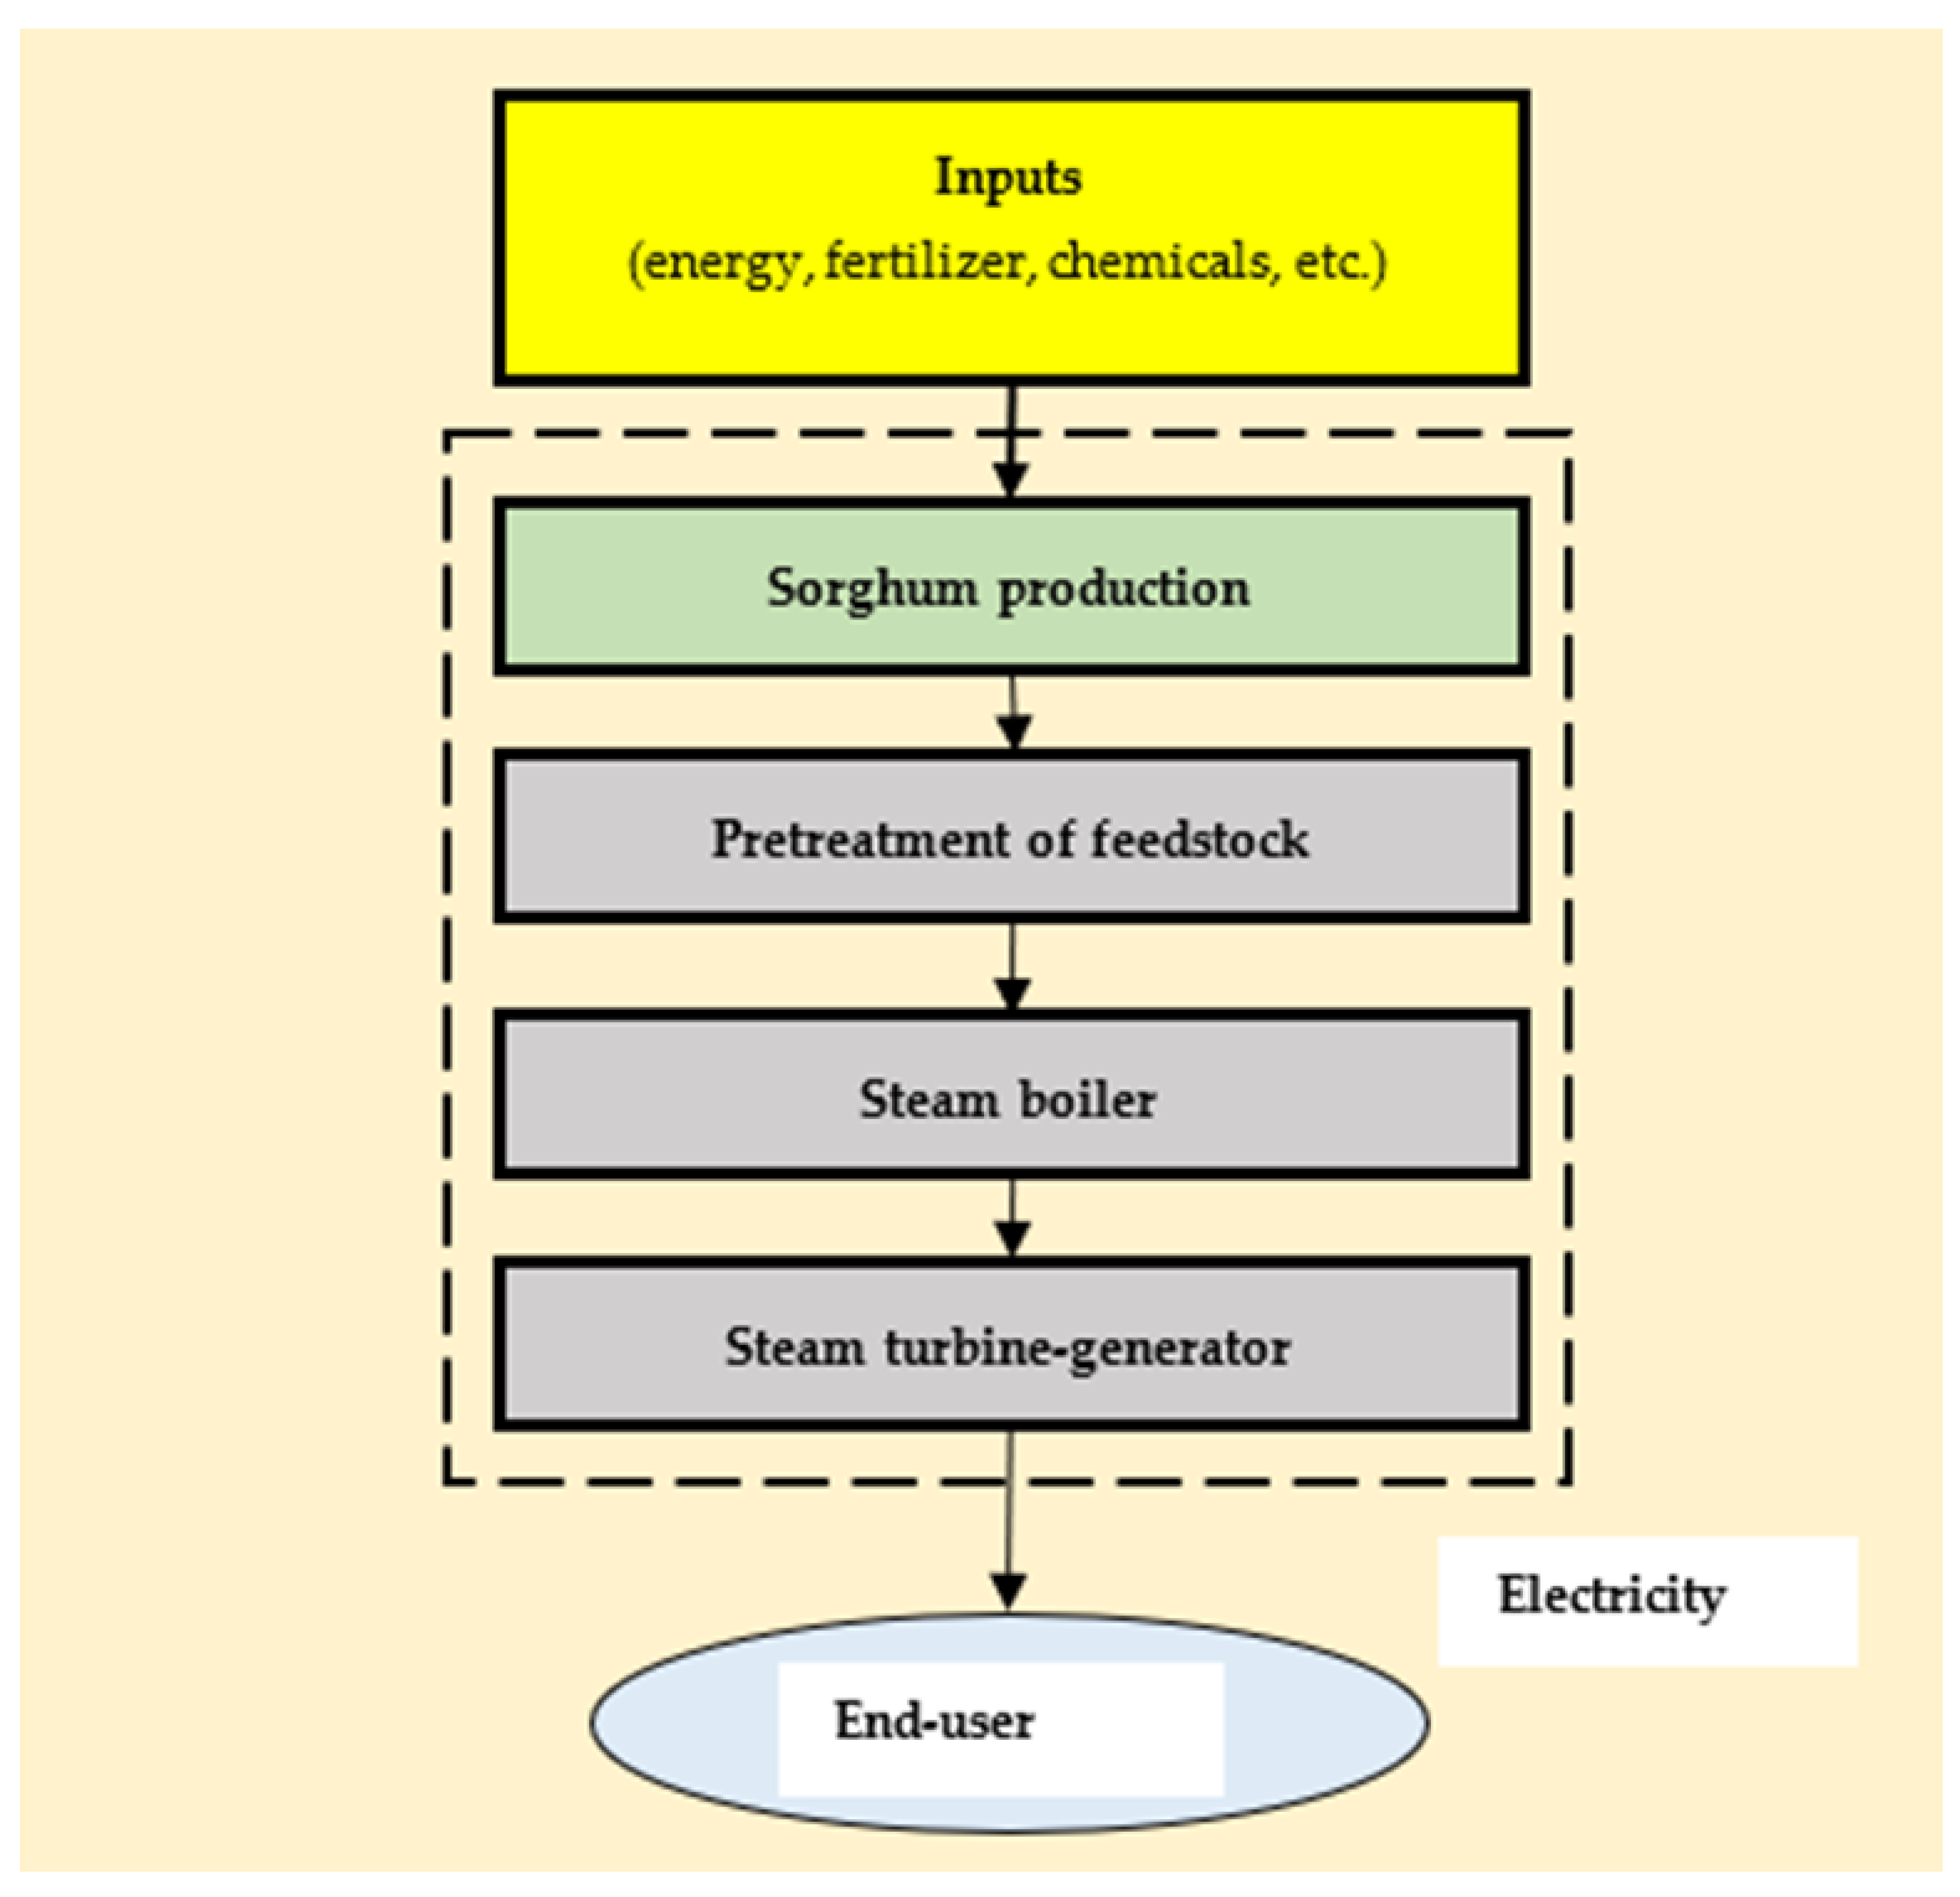
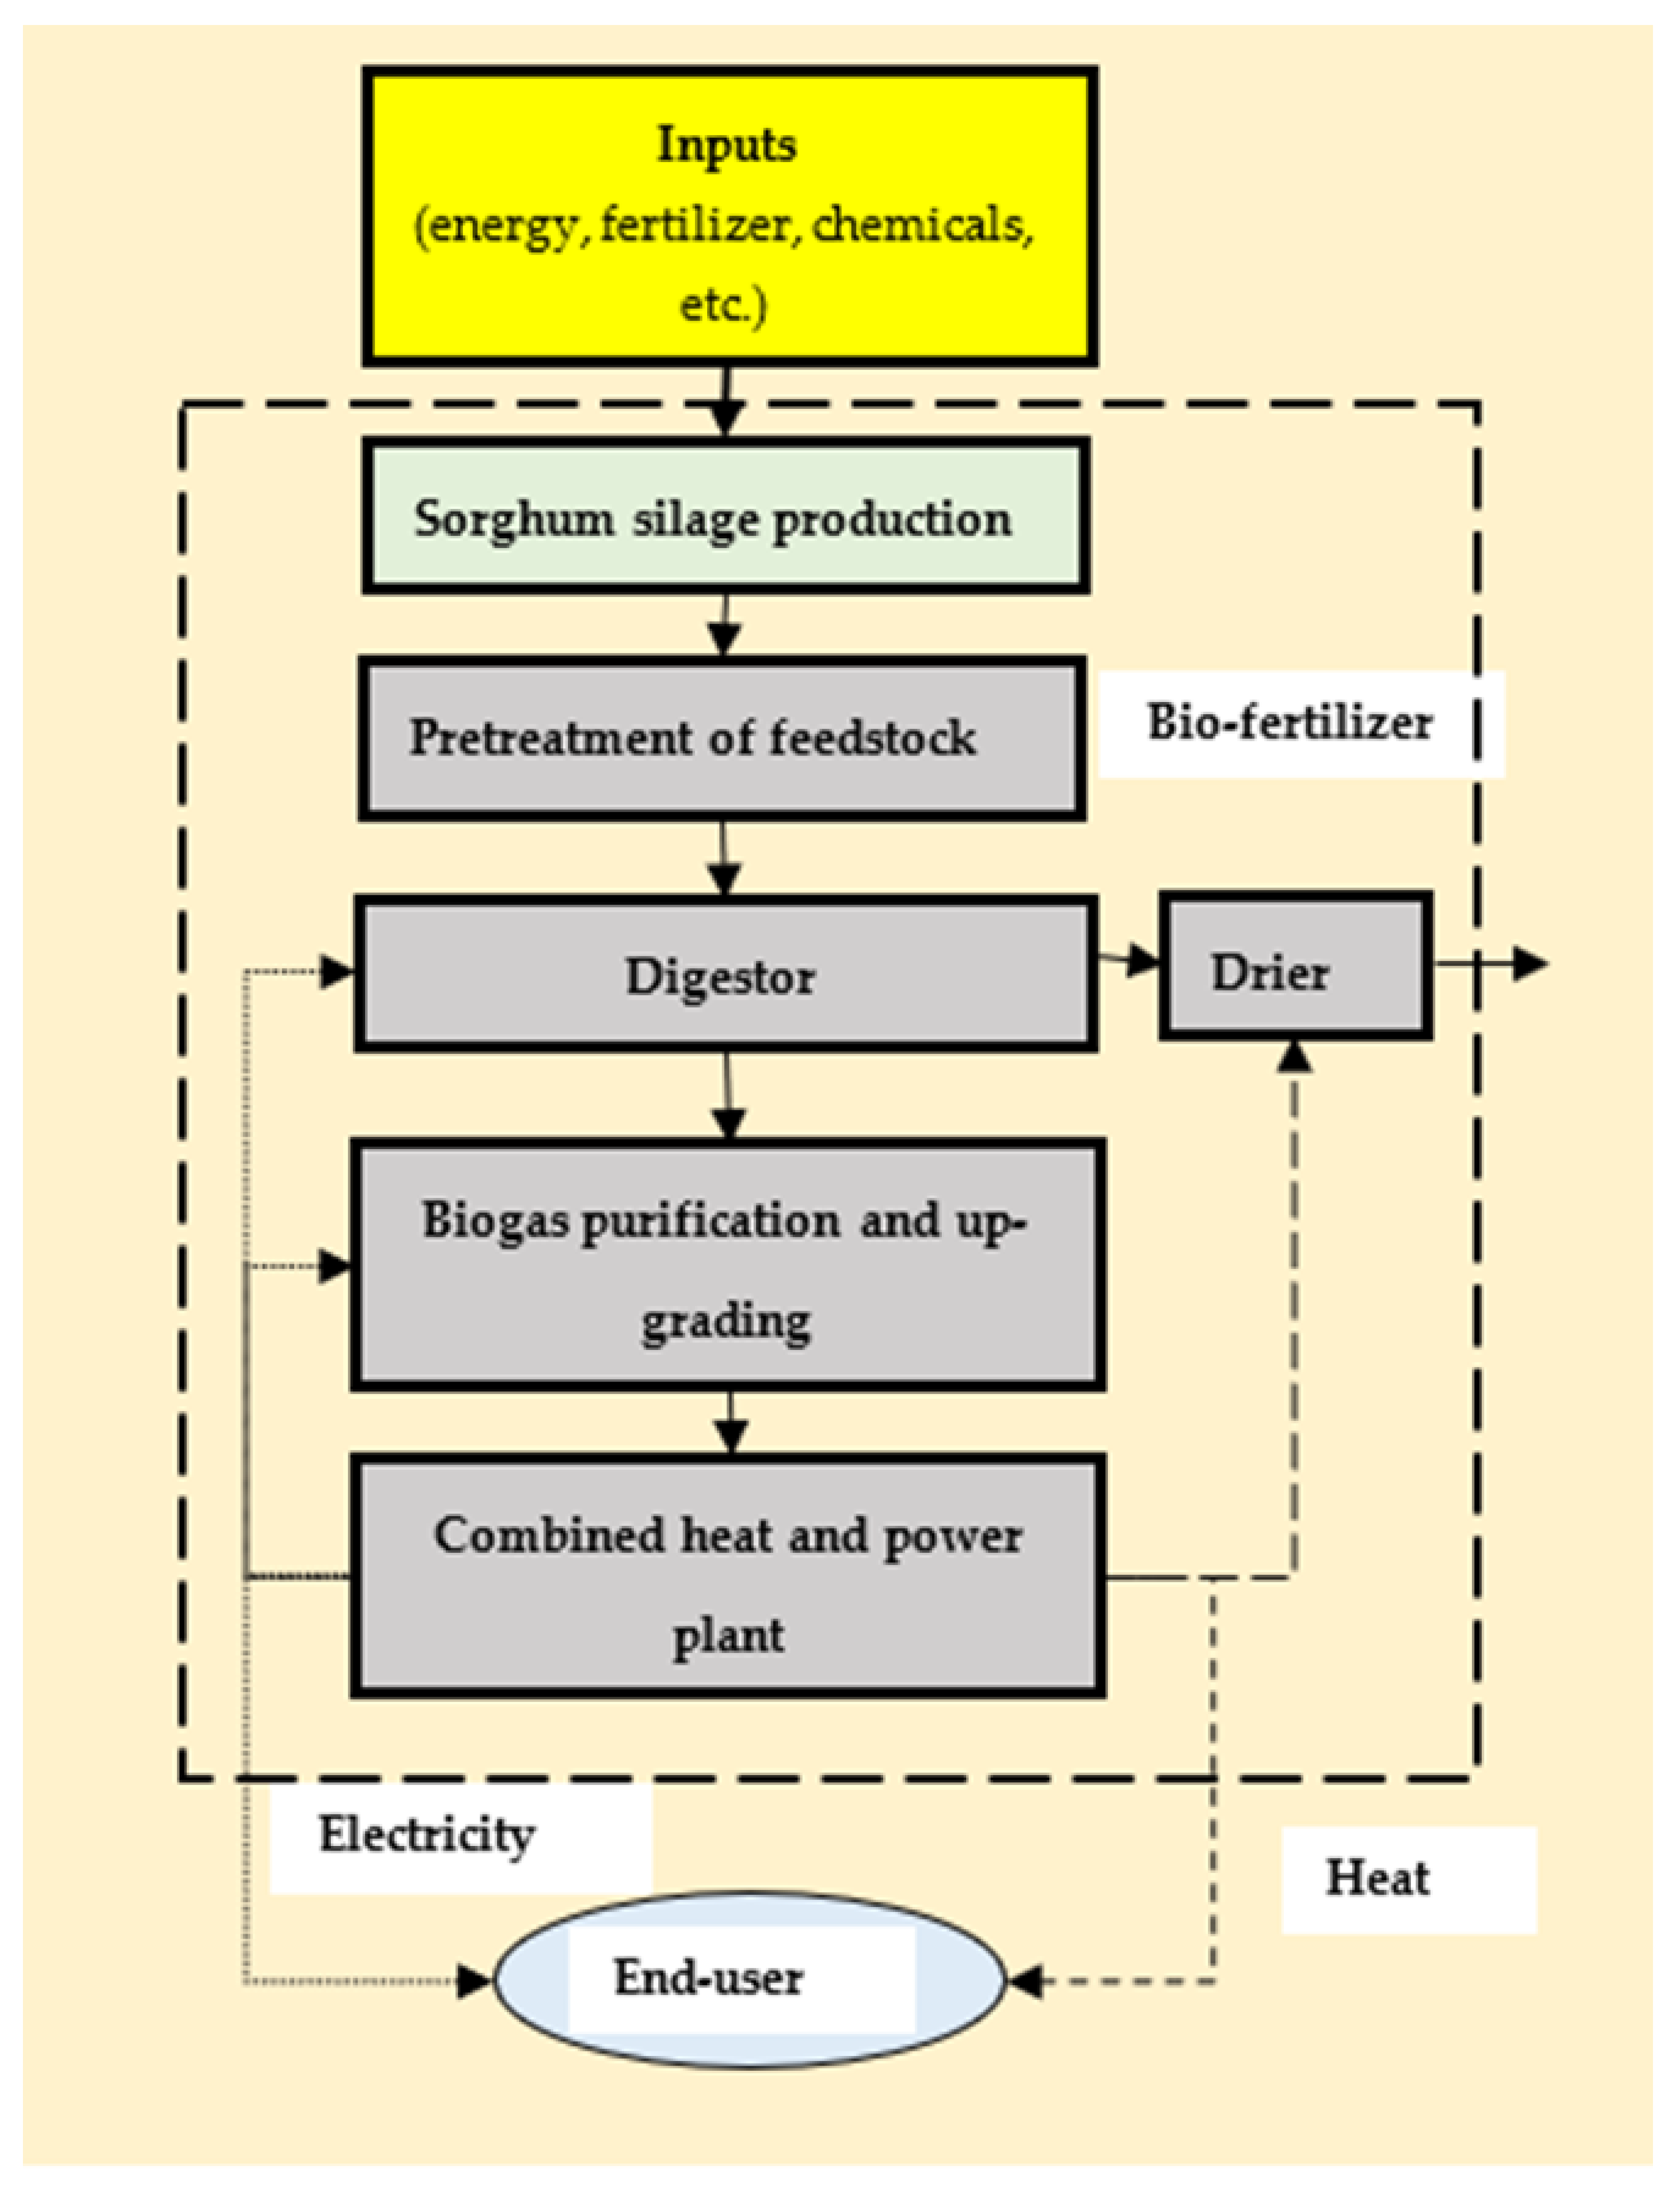
2.2. System Boundary

In this paper, we analyze two power supply systems. The first system is the combustion-based power plant. Its system boundary is depicted in Figure 1. A system boundary of a biogas plant is presented in Figure 2. Biogas is generated by the digester from sorghum silage. Digestate is dried and used as a biofertilizer. Upgraded biogas feeds an internal combustion engine generator. Exhaust heat is recovered and used to heat the digester and dry the digestate. The biogas plant consumes part of the electricity and heat to meet its energy requirements. The biogas plant delivers to consumers around 89% of electricity and 35% of the heat generated [40,50].

2.3. Energy Indicators

Experience shows that the electric efficiency of power plants ranges from 12% to 40% [51]. The total efficiency of combined heat and power plants is up to 85% (including electricity efficiency) [52]. The energy-specific costs for any power generation system is [53]
E S C = 3.6 η e [ 1 + E E L H V s ] ,   MJ / kWh ,
where ηe is the efficiency of power generation; LHVs is the lower heating value of biofuel, MJ/kg; EE is the energy used for biofuel production, MJ/kg.
Sorghum silage yield, its embodied energy, the carbon dioxide emission factor associated with silage production and its production costs were determined by field experiment. The experiment was performed on a farm of Mykolaiv National Agrarian University (the Mykolaiv region, Ukraine). The embodied energy was calculated with the following formula
E E = I E S S Y ,   MJ / kg ,
where IE is the input energy, MJ/ha; SSY is the sorghum silage yield, kg/ha.
Lower heating values of biofuels vary in a wide range from 8 to 18 MJ/kg [43,44,46,47]. We suggest applying the ratio of embodied energy to a lower heating value for correct comparison. This indicator can be calculated with the following formula
E E L H V = 1000 E E L H V ,   kJ / MJ ,
where LHV is the lower heating value, MJ/kg.
To estimate economical attractiveness of any fuel, a fuel energy cost is used [54]
F E C = F M P L H V t ,   USD / GJ ,
where FMP is the fuel market price, USD/t; LHVt is the lower heating value, GJ/t.

2.4. Environmental Indicators

The carbon dioxide savings can be calculated with the formula [53]
S C D E = E F c f 3.6 η e L H V s E F s ,   kgC O 2 / kWh ,
where EFcf is the carbon dioxide emissions factor conventional power plant, kgCO2/kWh; EFs is the carbon dioxide emission factor associated with biofuel production, kgCO2/kg.
Sorghum feedstock can be used to generate electricity and/or heat. Moreover, digestate (a co-product of biogas production) can be converted into a biofertilizer. In general, the total carbon dioxide emissions savings are calculated by the expressing
C D S = E F e W e + E F h W h + i = 1 n ( W T W f i M B F i ) ,   kgC O 2 / ha ,
where EFe is the emission factor for power generation, kgCO2/kWh; EFh is the emission factor for heat generation, kgCO2/kWh; We is the power generated from biomass harvested from one hectare, kWh/ha; Wh is the heat generated from biomass harvested from one hectare, kWh/ha; WTWfi is the well-to-wake carbon dioxide emissions of the ith mineral fertilizer, kgCO2/kg; MBF is the mass of the ith mineral fertilizer substituted by biofertilizer, kg/ha.
The the carbon dioxide emission factor associated with sorghum silage production is equal to
E F s = 10 3 C D E S S Y ,   kgC O 2 / kg ,
where CDE is the carbon dioxide emissions during sorghum cultivation, kgCO2/ha.
We also used an emission factor per lower heating value. This indicator is calculated with the following formula
E F L H V = 10 3 E F s L H V ,   gC O 2 / MJ ,
The emission factor per lower heating value and embodied energy per lower heating value are useful indicators to compare fuels (biomass) with different physical properties.

2.5. Energy, Environmental and Economic Indicators of Sorghum Silage Production

In our current study, we used data obtained from our field experiments [55]. The input and output flows are summarized in Table 1. Based on the input materials flows, total energy inputs and carbon dioxide emissions were determined. Total costs included energy, labor, equipment operating costs, chemicals, etc. Carbon dioxide emissions were calculated as a sum of direct and indirect emissions (fuel combustion, power generation, and manufacturing of chemicals).
To analyze sorghum power generation systems, we use the following properties of sorghum silage (fresh mass): a lower heating value —3.1 MJ/kg [44]; biomethane yield—from 52 to 84 m3/t [56,57]. By-products of sorghum biogas plants are biofertilizers. The nutrient content of original sorghum is as follows: nitrogen—from 1.58% to 2.71%; phosphorus—from 0.19% to 0.27%; potassium—from 0.92% to 1.19% [52]. They can be returned to the soil.

3. Results and Discussion

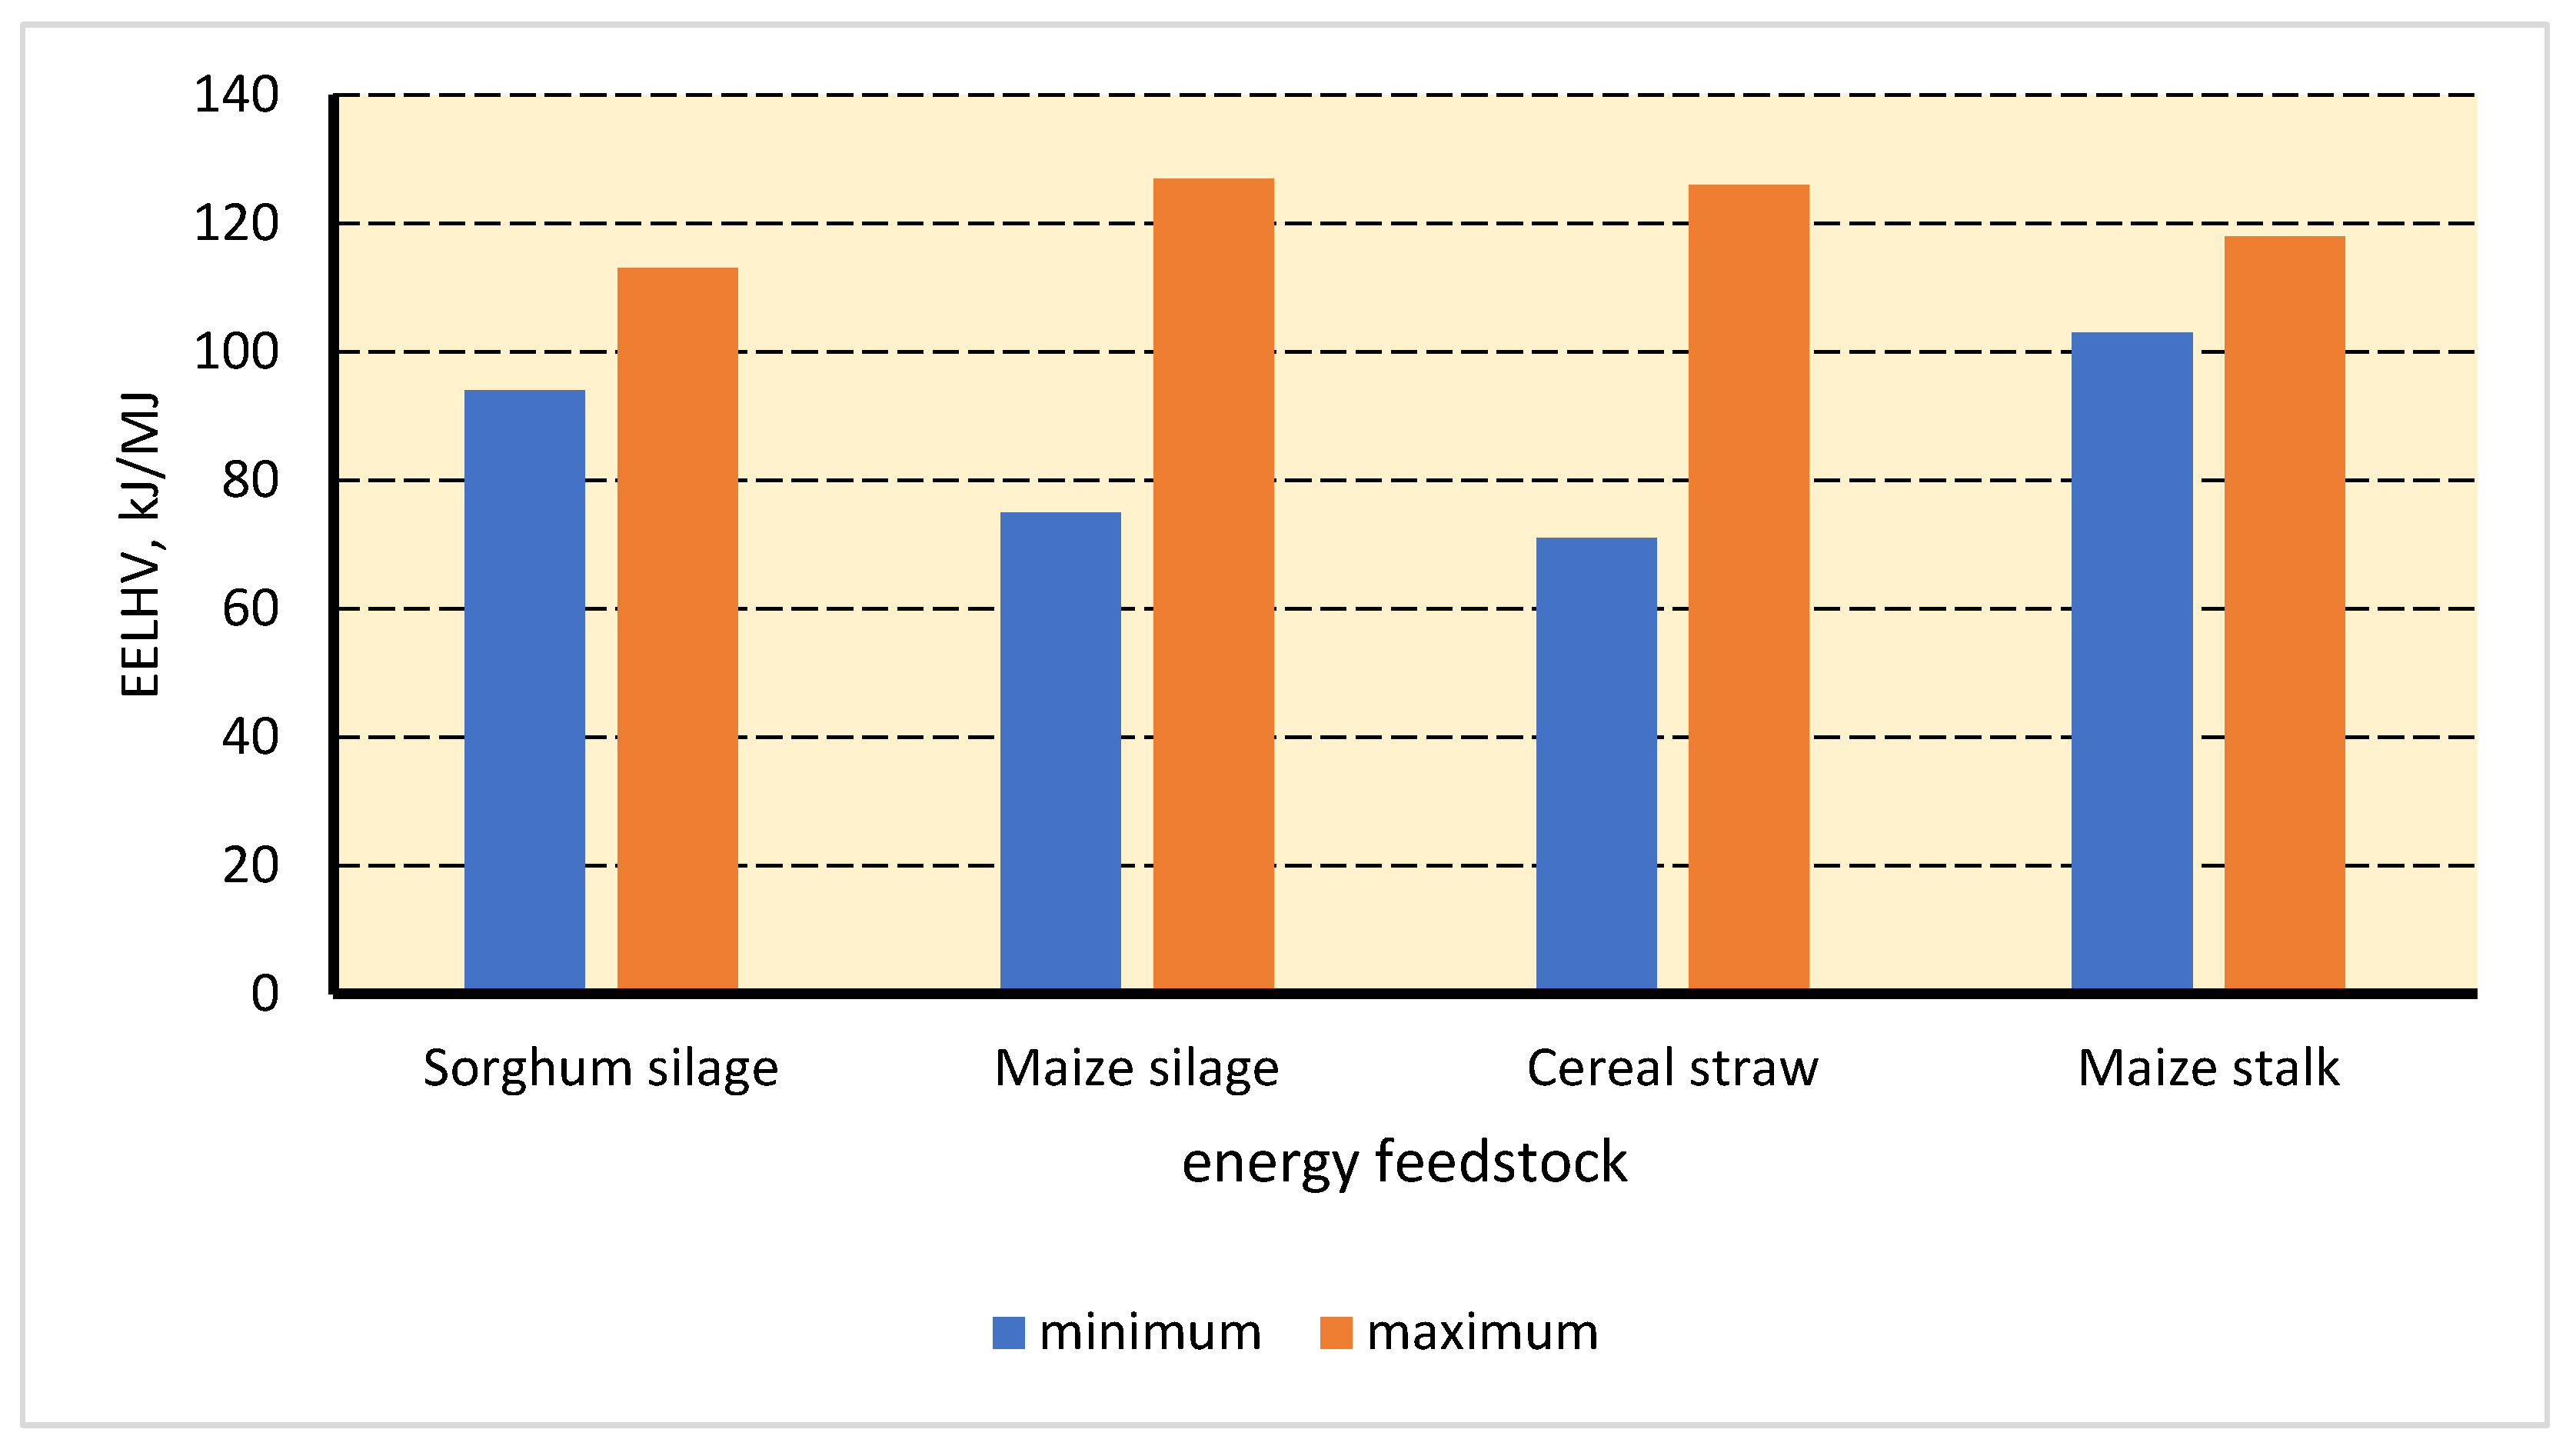
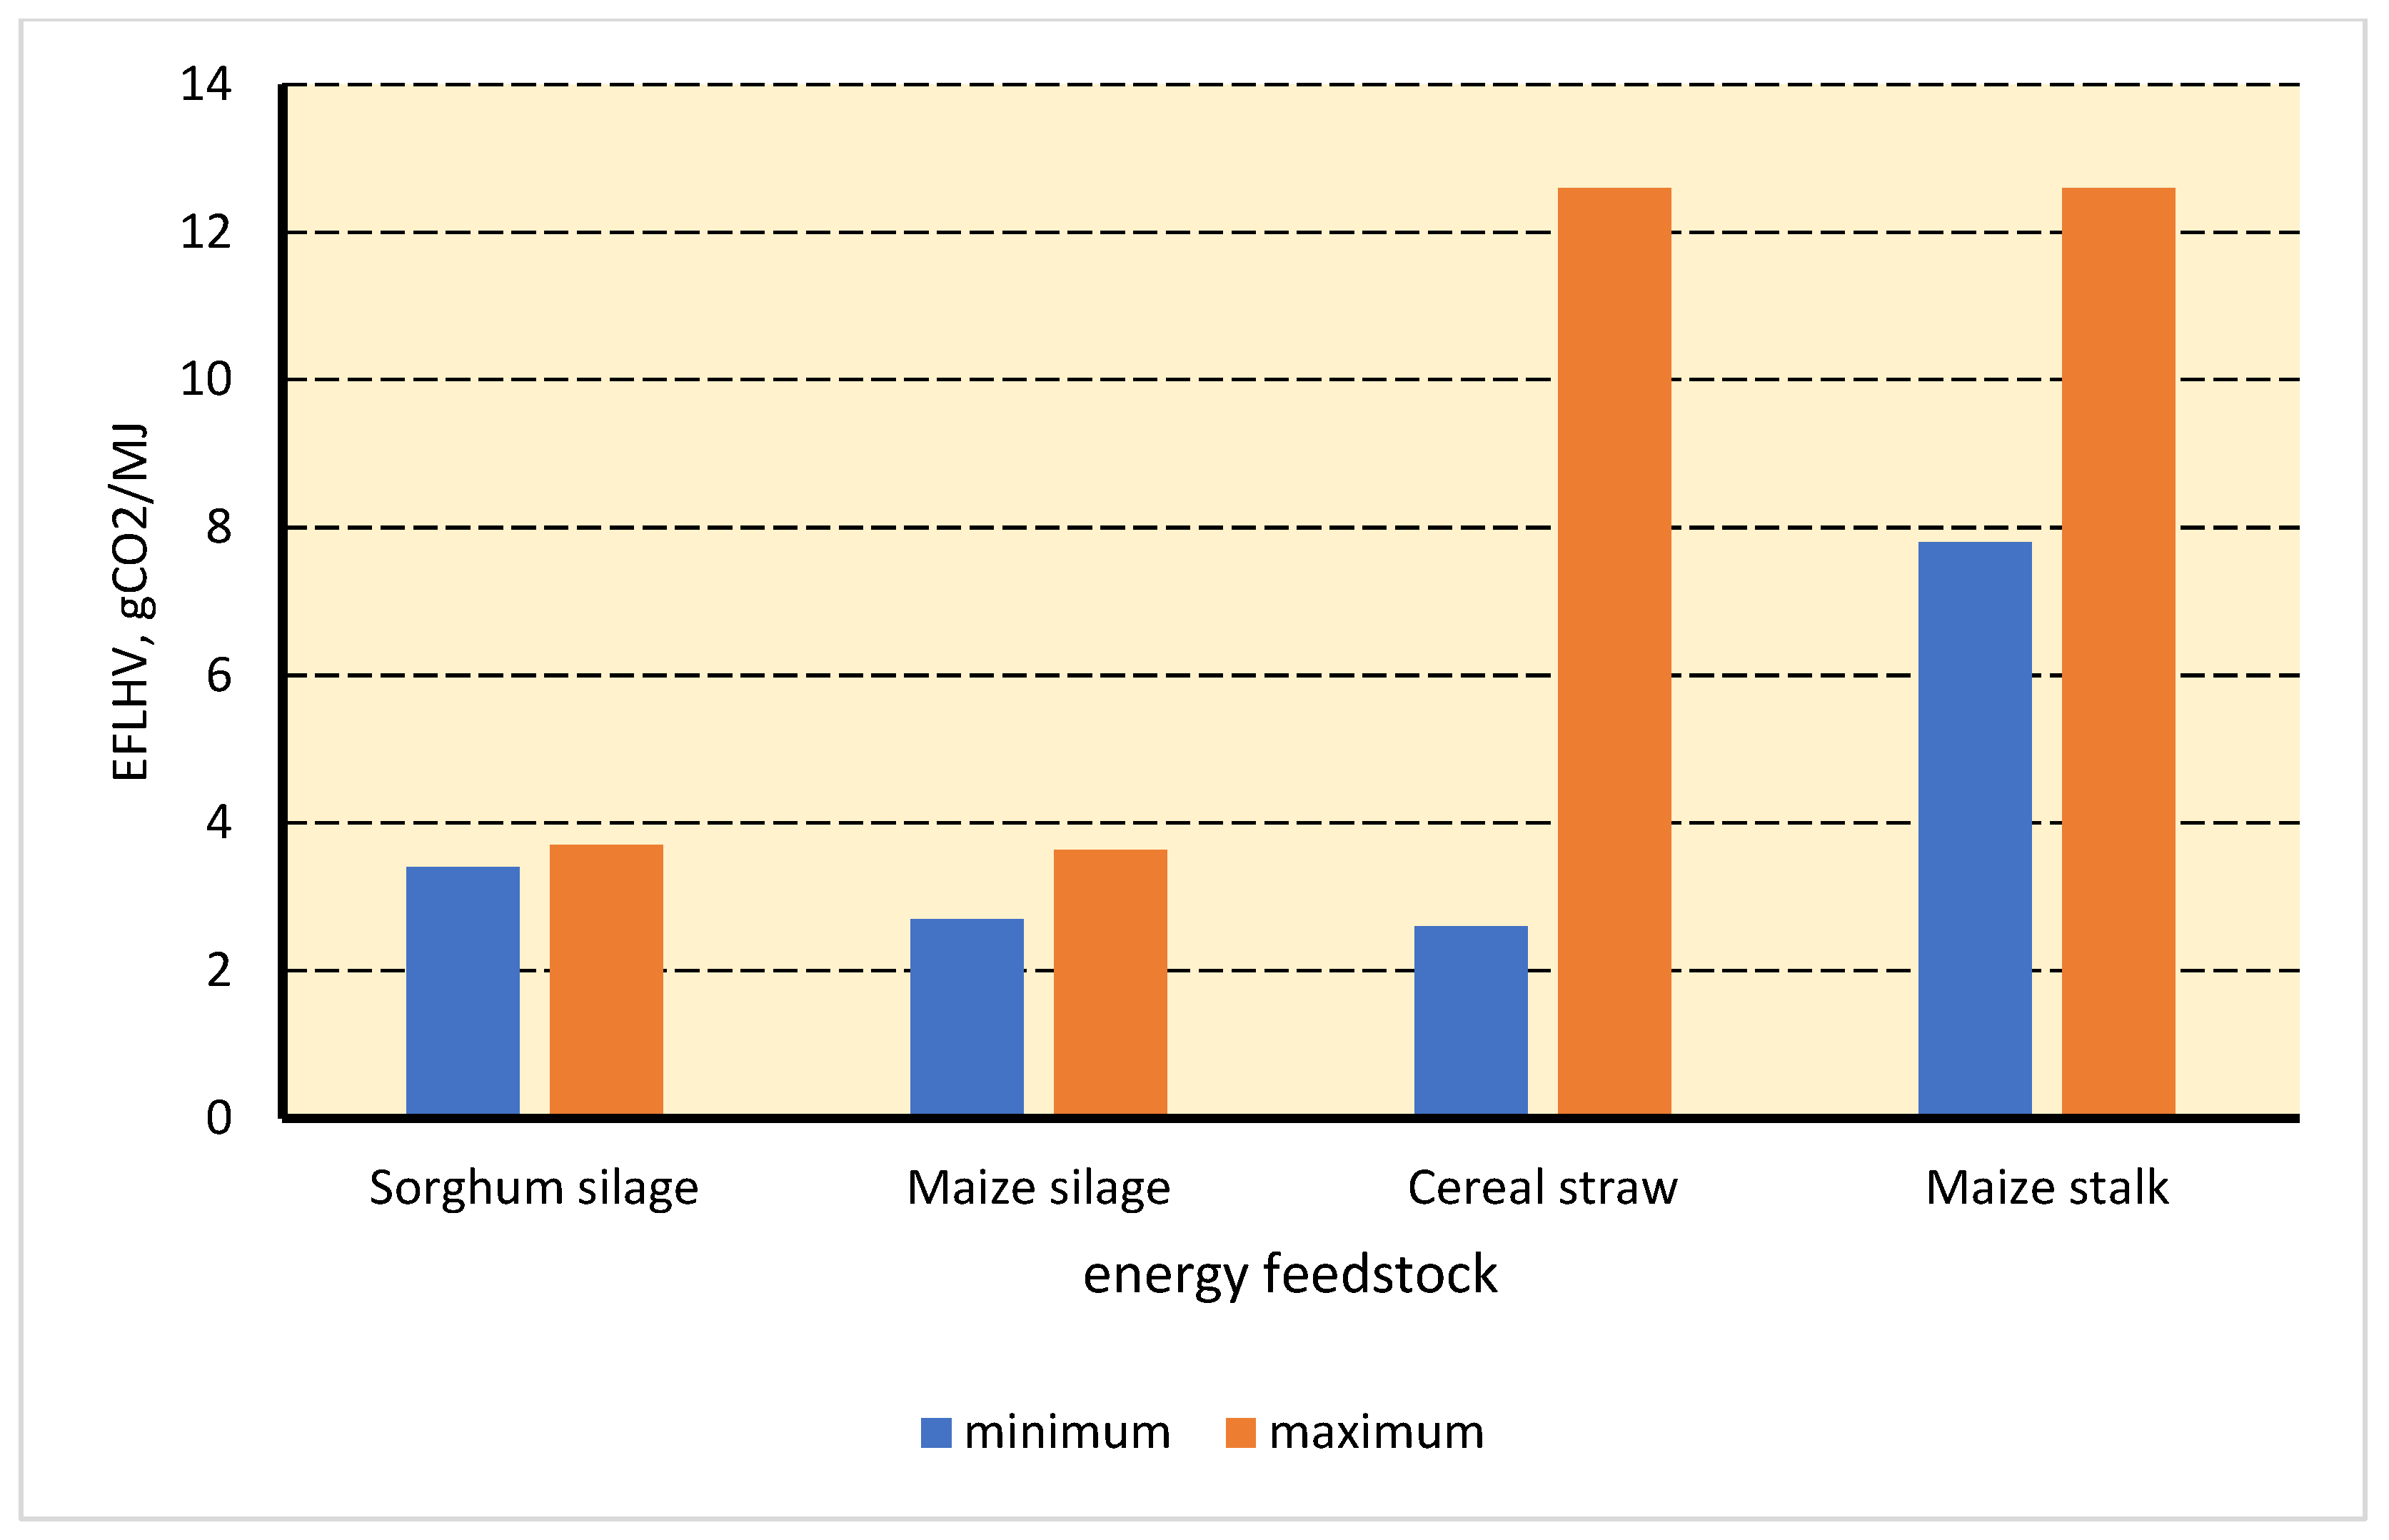
3.1. Embodied Energy and Well-to-Tank Carbon Dioxide Emissions of Feedstock

We carried out field experiments to determine the necessary data. The average sorghum silage yield was found to be 40.6 t/ha. The technology of sorghum silage production consumed diesel fuel—63.5 kg/ha; gasoline—8 kg/ha; electricity—11.38 kWh/ha; and mineral fertilizer—187 kg/ha. The total energy inputs were 12.27 GJ/ha [55]. The calculated specific energy consumption or embodied energy was 0.302 GJ/t (fresh mass) or 0.302 MJ/kg (97.4 kJ/MJ). Agricultural practice emitted 438.32 kgCO2/ha or 0.0108 kgCO2/kg.
The costs of growing sorghum silage have the following structure: energy (diesel fuel, gasoline, and electricity)—7.19%; fertilizer, herbicide, and insecticide—50.08%; labor—14.58%; seed—8.91%; and other (repair, amortization, etc.)—19.24%. The total silage production costs were found of USD 1279.5/ha or USD 31.52/t. It is slightly less than in different countries. For example, in California, the total costs of sorghum silage are USD 39.5/t and higher [58]. Its market prices reach the value of USD 65/t [59]. In Ukraine, the energy costs of sorghum silage are around USD 9.93/GJ. For comparison, the energy costs of some energy resources are as follows, USD/GJ: diesel fuel—27.60; natural gas—29.67; electricity—29.76; power coal—15.54; straw pellets—9.06; sunflower pellets—9.50 [60].
Jankowski et al. [44] studied the energy efficiency of sorghum and maize silage in Poland. Having obtained data, we estimated embodied energy and Field-to-Tank (WTT) carbon dioxide emissions. The embodied energy ranged from 0.312 to 0.428 MJ/kg or from 100.6 to 138.1 kJ/MJ. WTT was around 0.0124 kgCO2/kg or 4 gCO2/MJ.
Ren et al. [43] investigated the energy productivity of sorghum in China. Their data obtained allowed us to estimate the embodied energy of 0.428 MJ/kg. WTT carbon dioxide emissions were found of 0.0141 kgCO2/kg or 3.7 gCO2/MJ.
Embodied energy and WTT carbon dioxide emission of maize silage and cereal straw were compared (Figure 3 and Figure 4). We used data reported by Nguyen et al. [61], Ou et al. [62], Kim et al. [63,64], Bazaluk et al. [55], Ren et al. [43], Jankowski et al. [44]. Different biomass feedstock has similar ratios of embodied energy to lower heating value. Ratios of emission factor to lower heating value differ significantly. Sorghum and maize have the least values. Therefore, their use for power generation results in lower carbon dioxide emissions. The main reason for this difference is the higher silage yield.

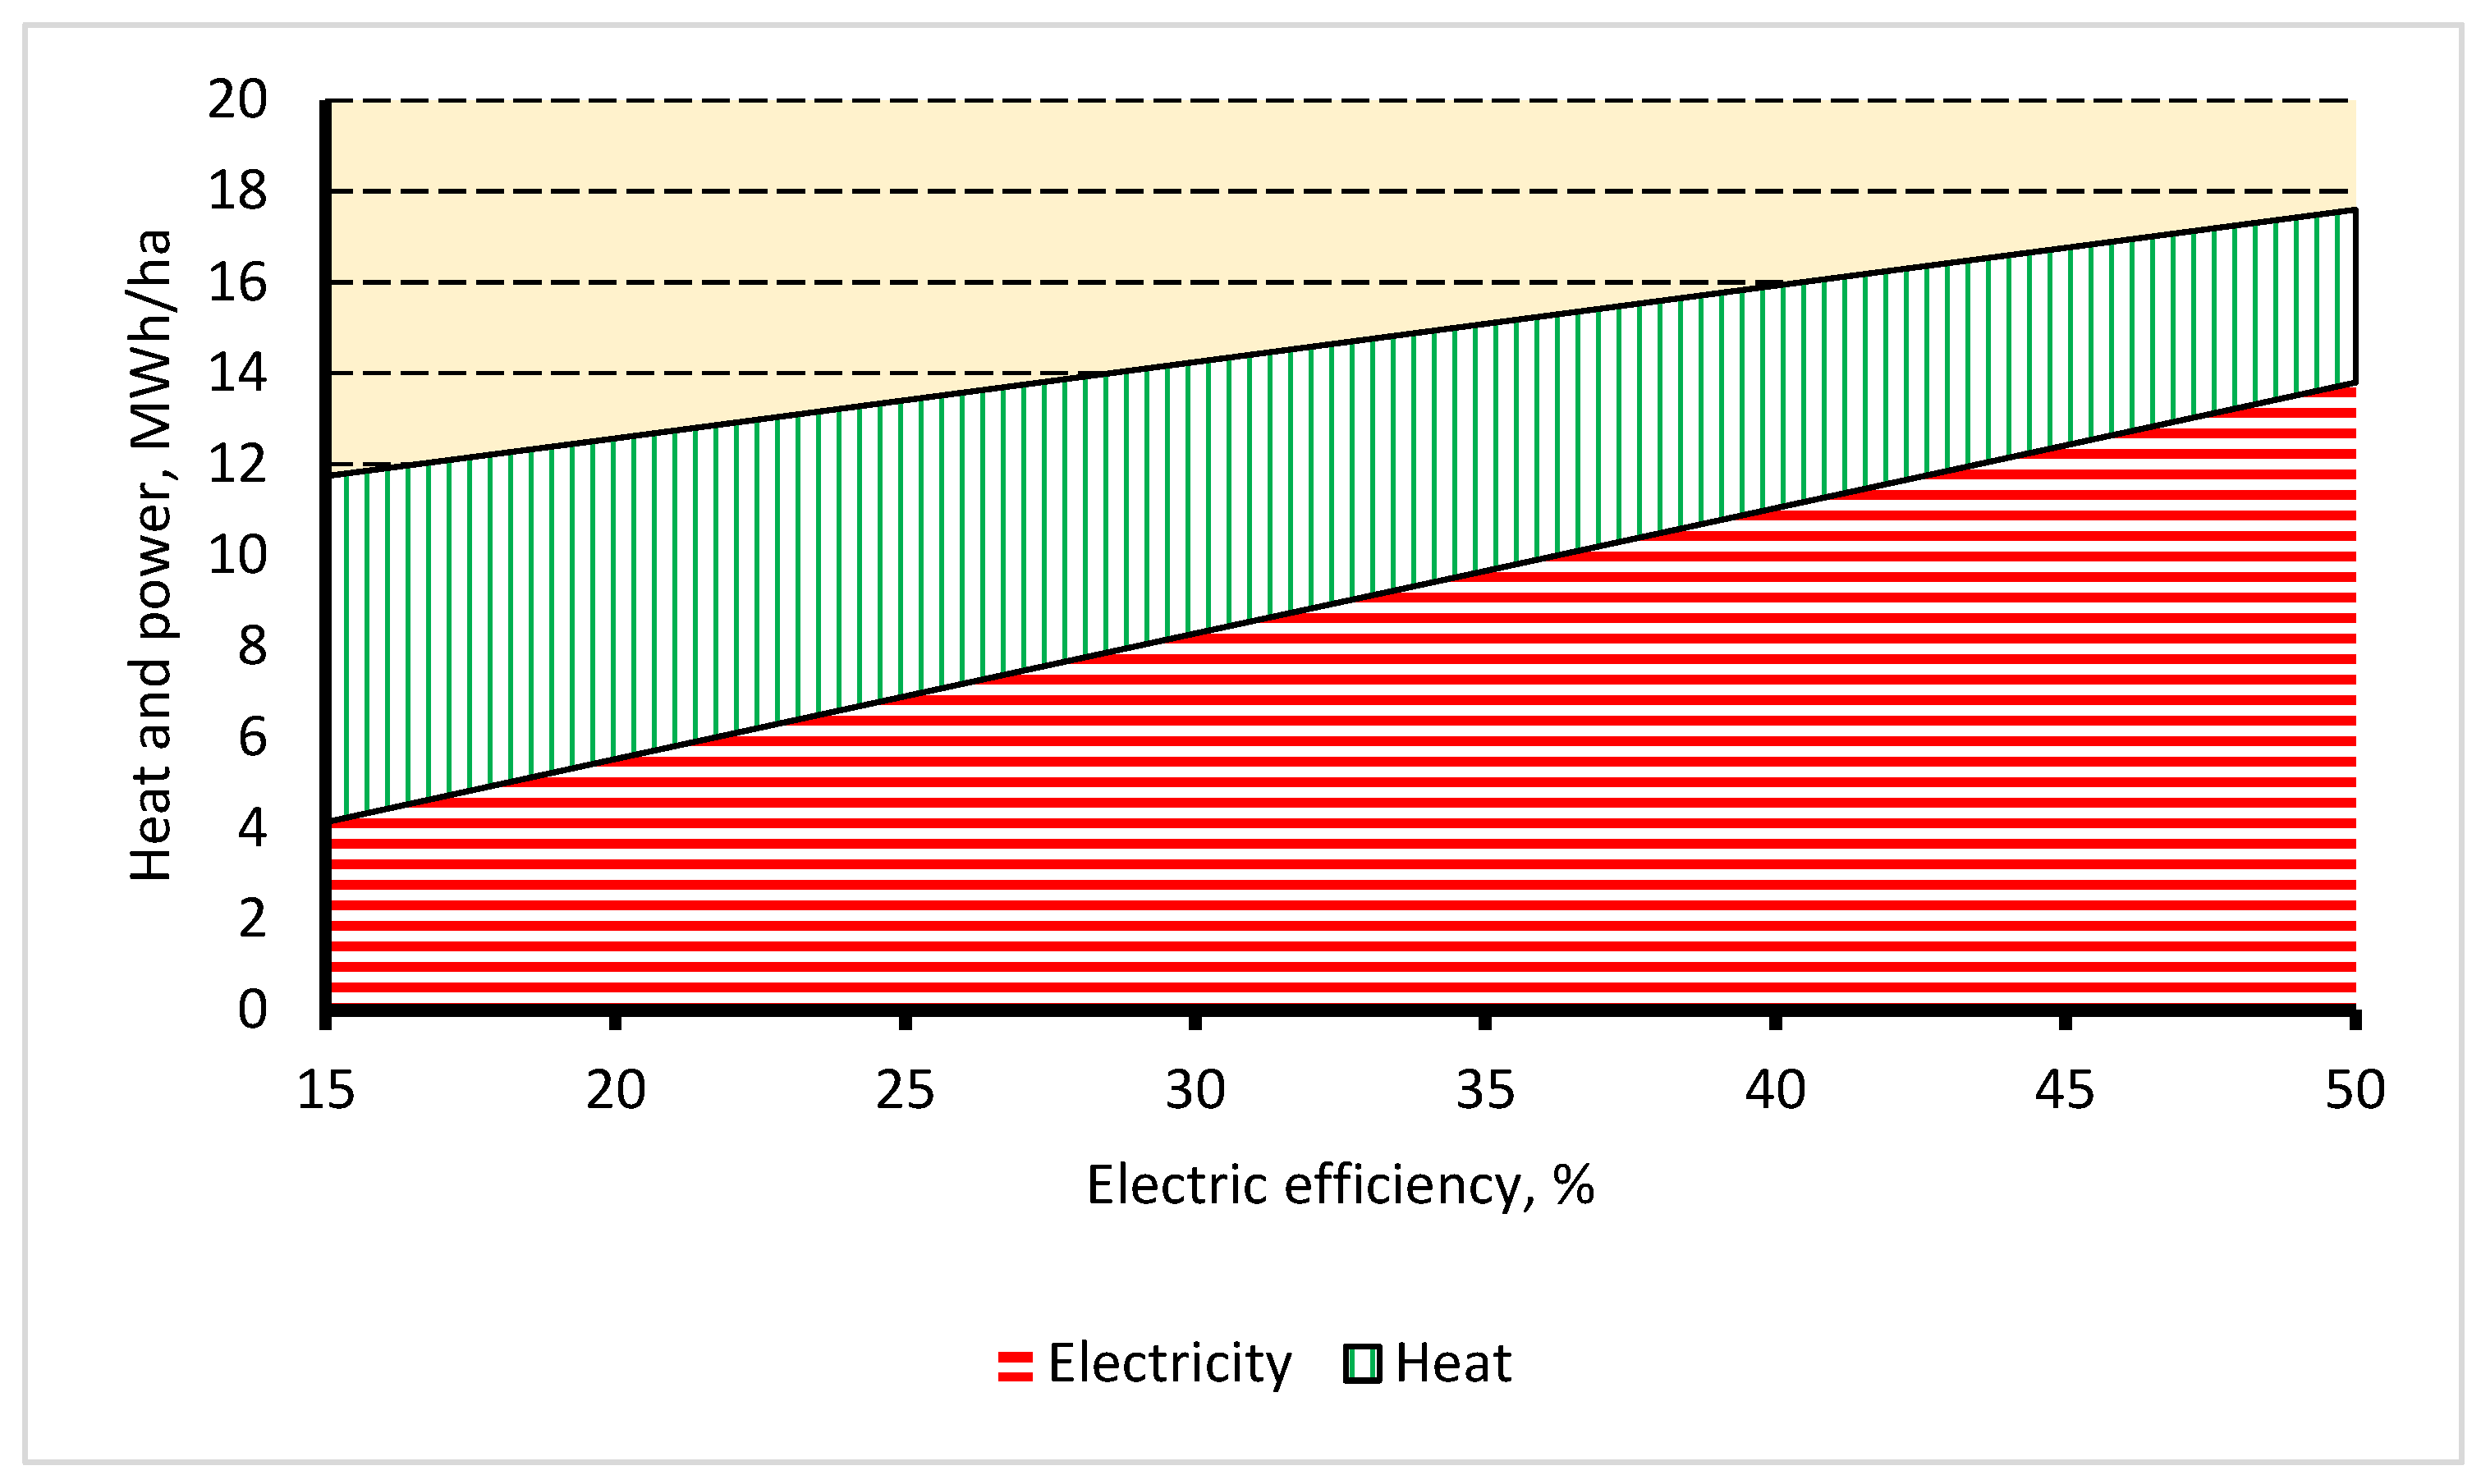
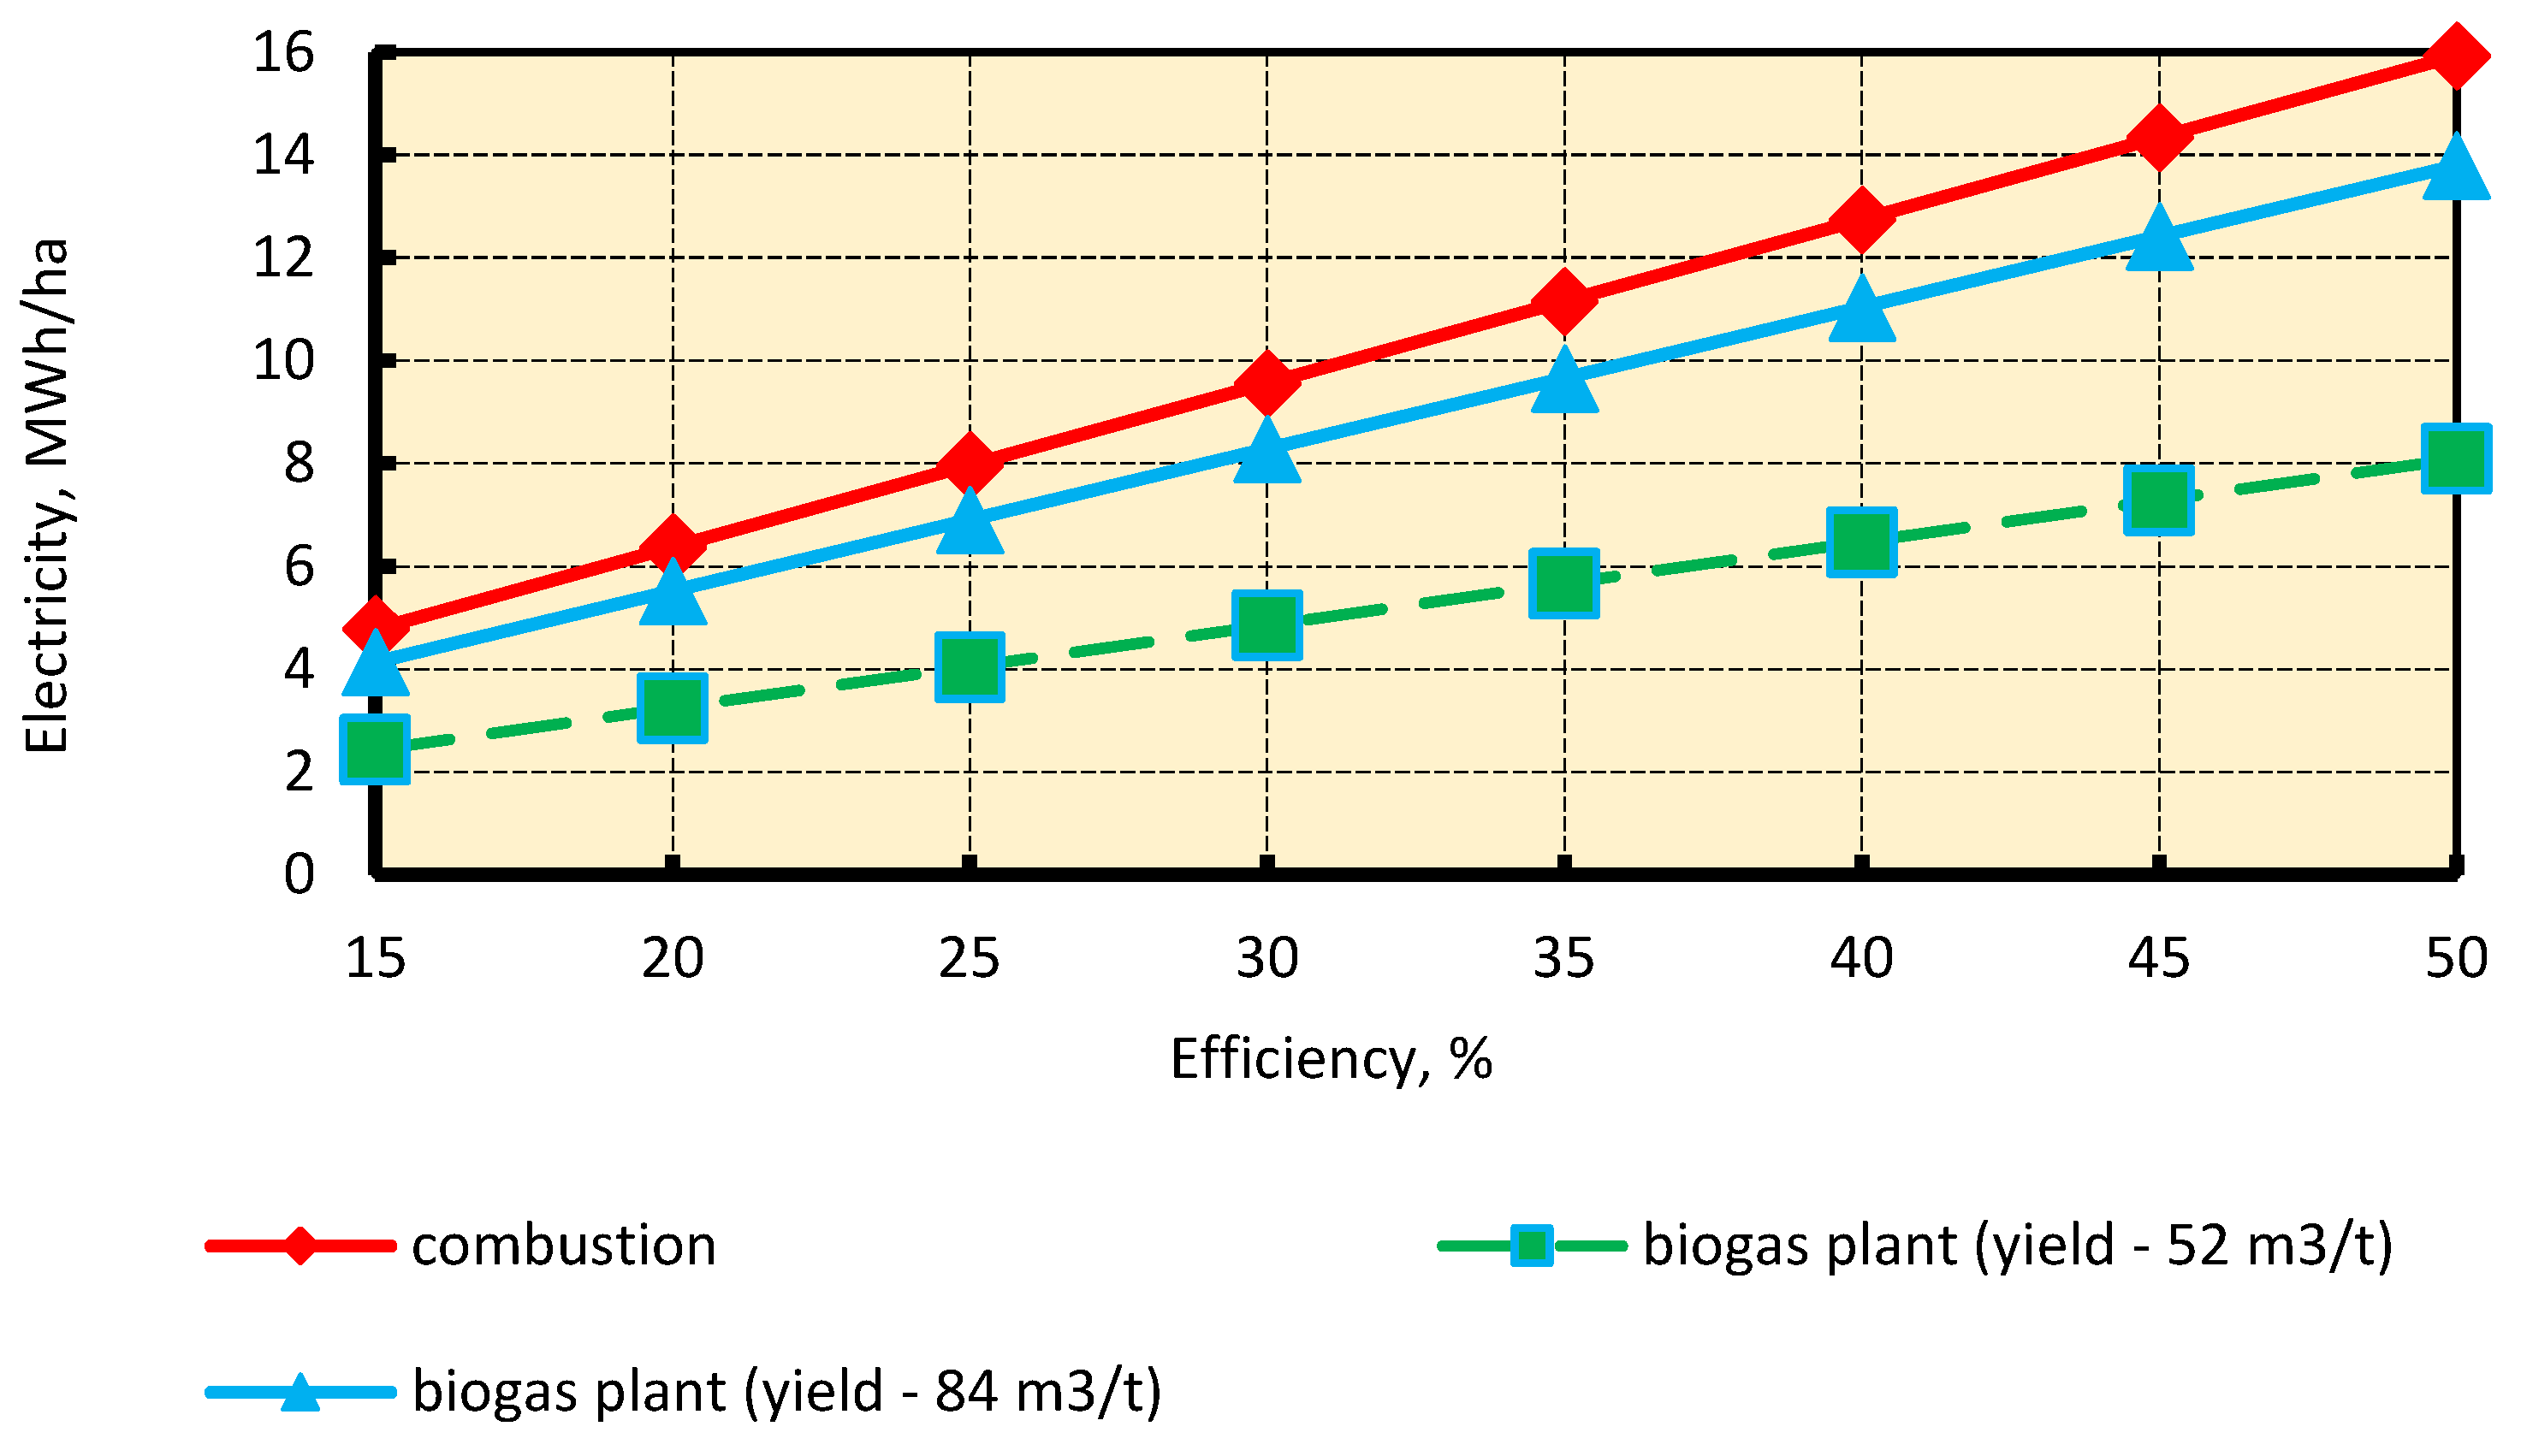
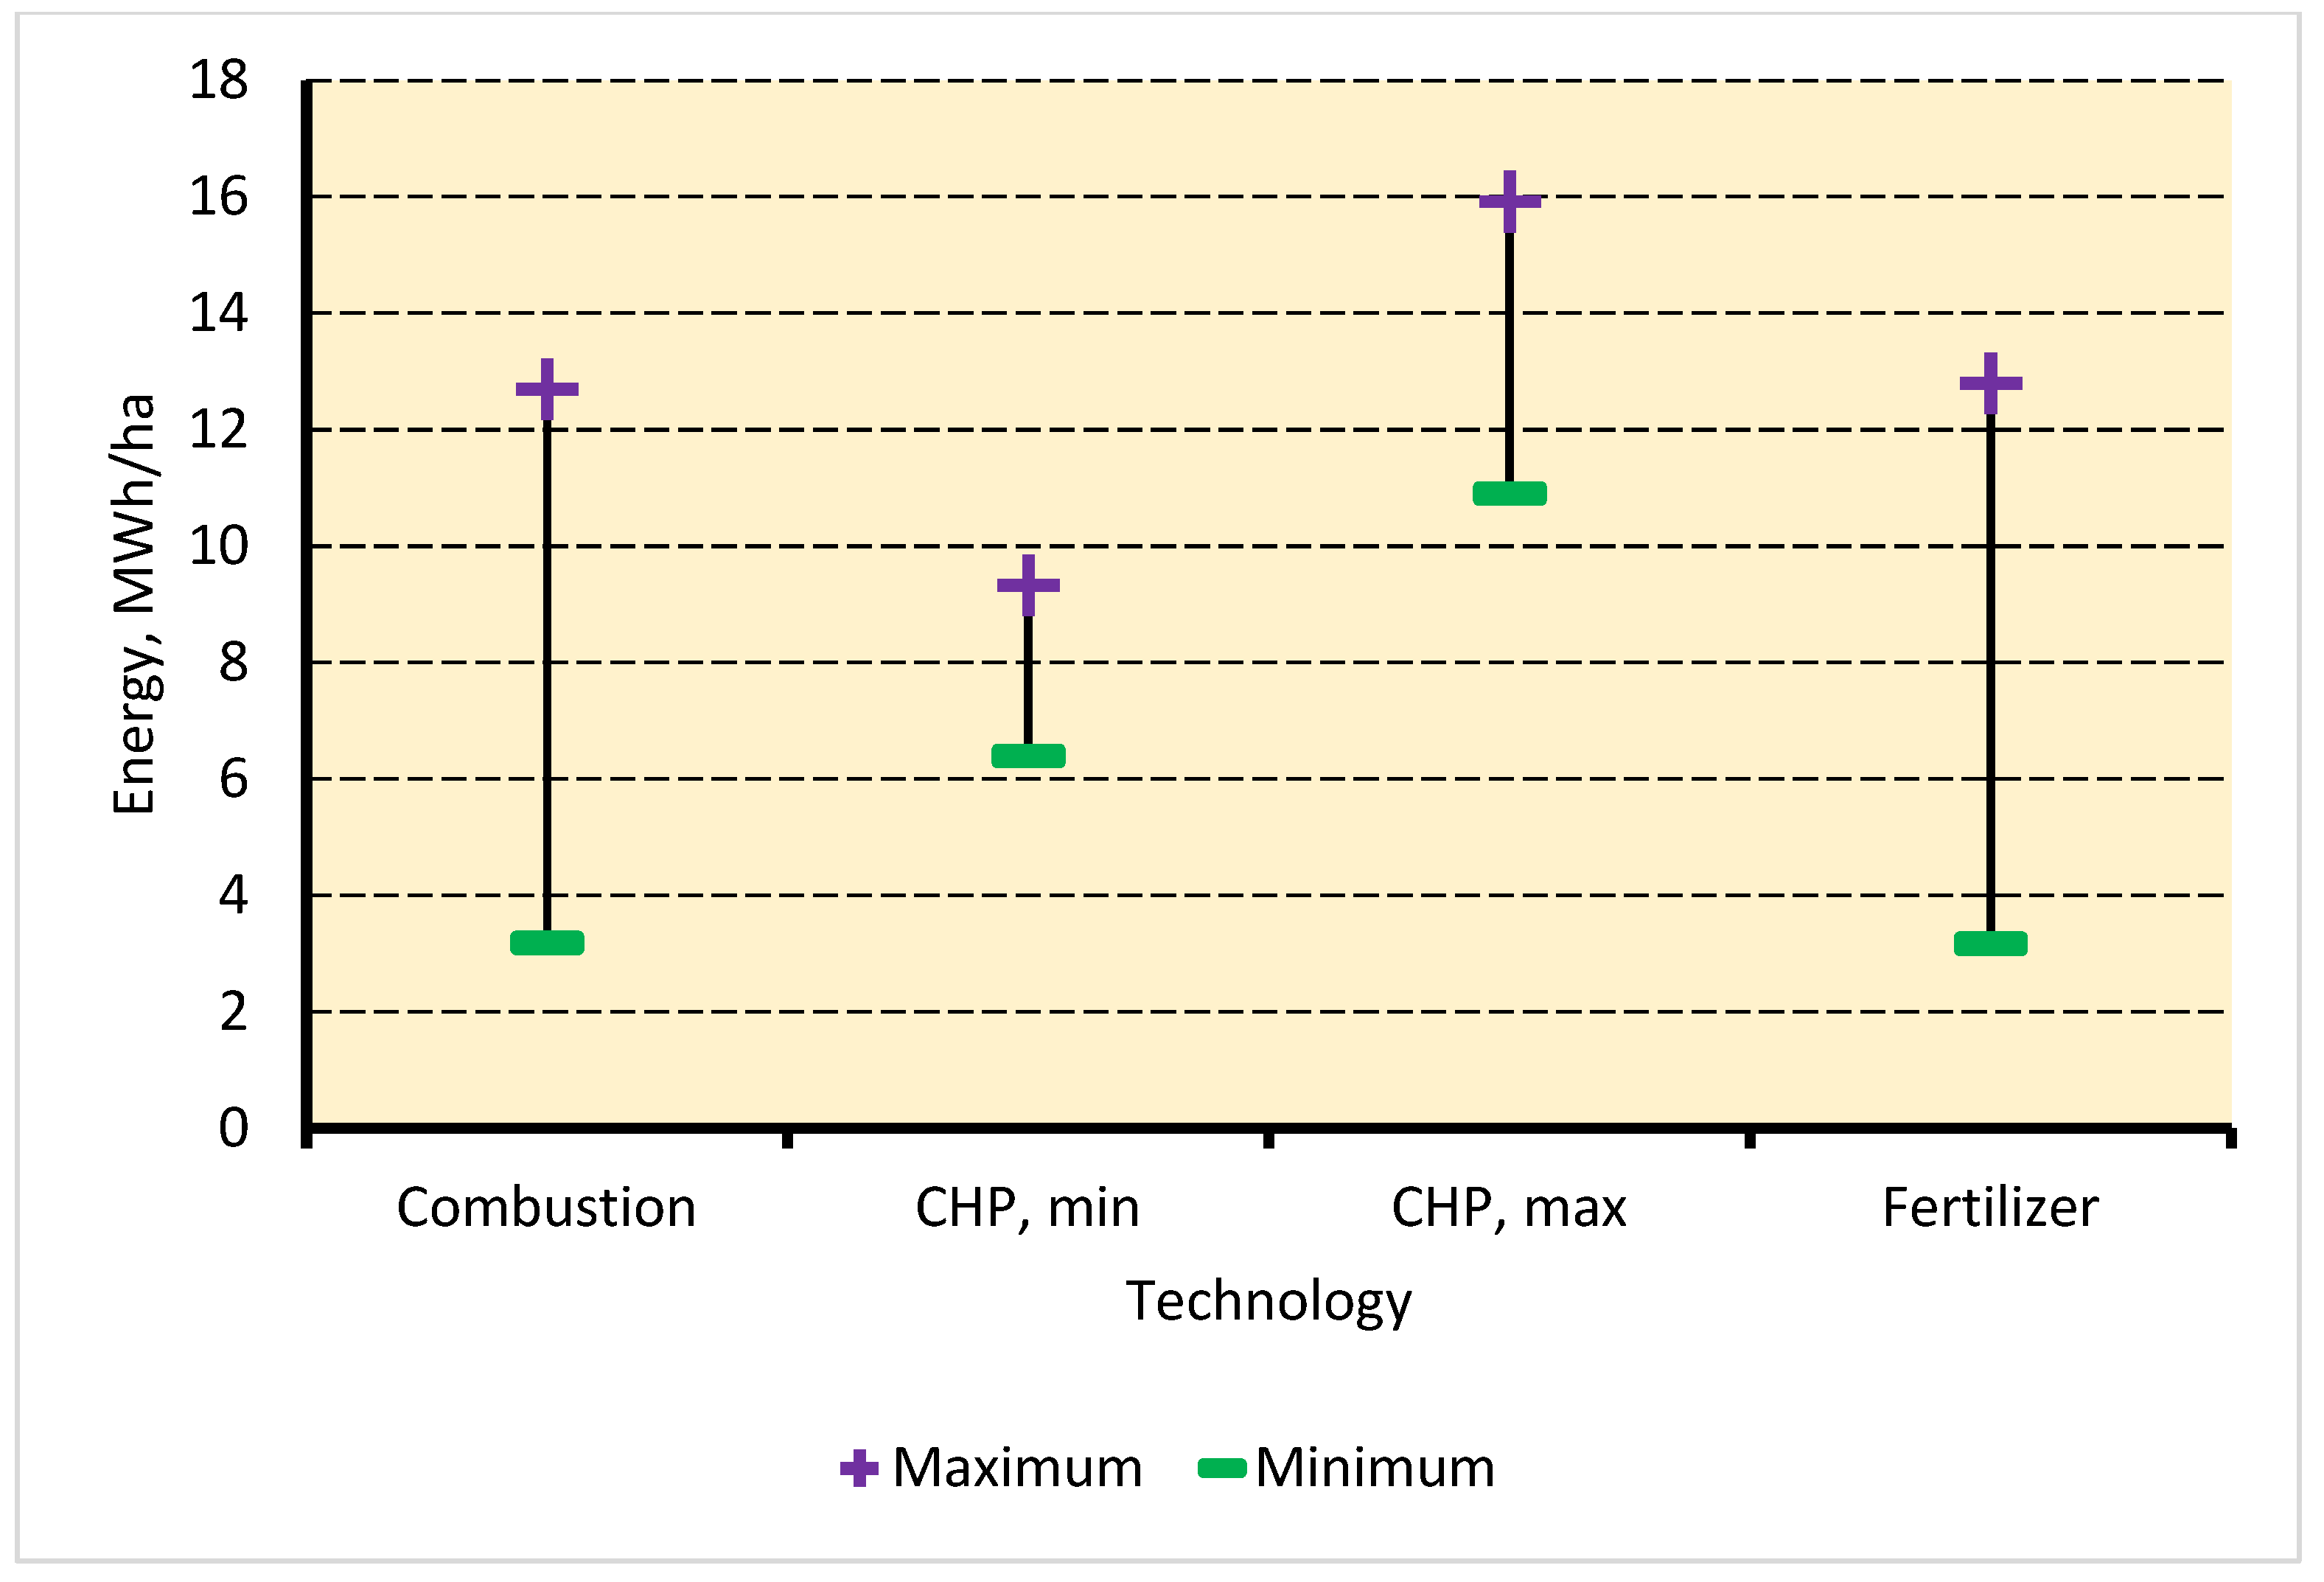
3.2. Energy Indicators

The energy-specific costs, electricity generated by one hectare of sorghum, and heat produced by one hectare of sorghum as indicators were analyzed. The electric efficiency of biomass-fired power plants varies from 18 to 32% [42,65]. Biogas power plants use internal combustion engines. These engines can reach an electric efficiency of 50% [34,35]. That is why we assumed an electric efficiency of 15 to 50%. We found that for combustion-based power plants, the energy-specific costs range from 7.9 to 26.3 MJ/kWh. It depends on the electric efficiency. Conventional power plants have almost the same energy-specific costs. However, some kinds of power plants have lower ones (Figure 5) [66]. We estimated the power generated by sorghum silage grown on one hectare. We suggest calculating this indicator with the following formula
W h a = 0.001 S S Y L H V s E S C ,   MWh / ha ,
Hence, the sorghum-based power plant can generate from 4.6 to 15.8 MWh/ha.
Sorghum silage is a suitable substrate. The specific methane yield of fresh silage ranges from 52 to 84 m3/t. For comparison, maize silage (widespread feedstock for biogas plants) ensures a biomethane yield of 109 to 185 m3/t [56,57]. Outputs of a biogas plant are electricity, heat, and biofertilizer. Energy-specific costs of power generated vary from 7.9 to 27.9 MJ/kWh (Figure 5). Sorghum-based biogas plants can generate electricity from 2.3 to 18.6 MWh/ha.
The waste heat of internal combustion engines can be recovered. Waste heat recovery systems provide heat to both internal and external consumers. It improves the energy efficiency of biogas plants. The total power and heat generation (if the methane yield is 84 m3/t) are presented in Figure 6. If there is a minimum methane yield (52 m3/t), the total energy production is reduced by 38.1%.
Electricity generated by sorghum-based power plants is the function of electric efficiency, sorghum silage yield, and biomethane yield. It varies from 3.1 to 12.7 MWh/ha for biomass-fired power plants and from 1.62 to 11.04 MWh/ha for biogas plants (Figure 7). However, we would like to underline that the electric efficiency of 40% is possible only for biomass-fired power plants having a capacity of more than 10 MWe. Combustion-based technologies are superior compared to biogas-based technologies. However, biogas co-generation plants can be preferable if there are heat consumers.
Biogas plants have a co-product called digestate. It can be dried and used as a biofertilizer. Sorghum stalks contain nitrogen (from 1.58% to 2.71%), phosphorus (from 0.19% to 0.27%), and potassium (from 0.92% to 1.29%) [52]. The following formula was used to find indirect energy substituted
I D E S = S S Y i = 1 n ( α i E E F i ) ,   MJ / ha ,
where αi is the ith nutrient content in sorghum, %; EEFi is the embodied energy of ith nutrient component, MJ/kg.
The embodied energy of mineral fertilizer ranges from 6.7 MJ/kg (potassium) to 121.21 MJ/kg (nitrogen) [66,67,68]. We calculated indirect energy inputs substituted by digestate. It constitutes from 3.17 to 12.84 MWh/ha (Figure 8). Therefore, combined heat and power plants that produce biofertilizers have better energy indicators than biomass-fired power plants.

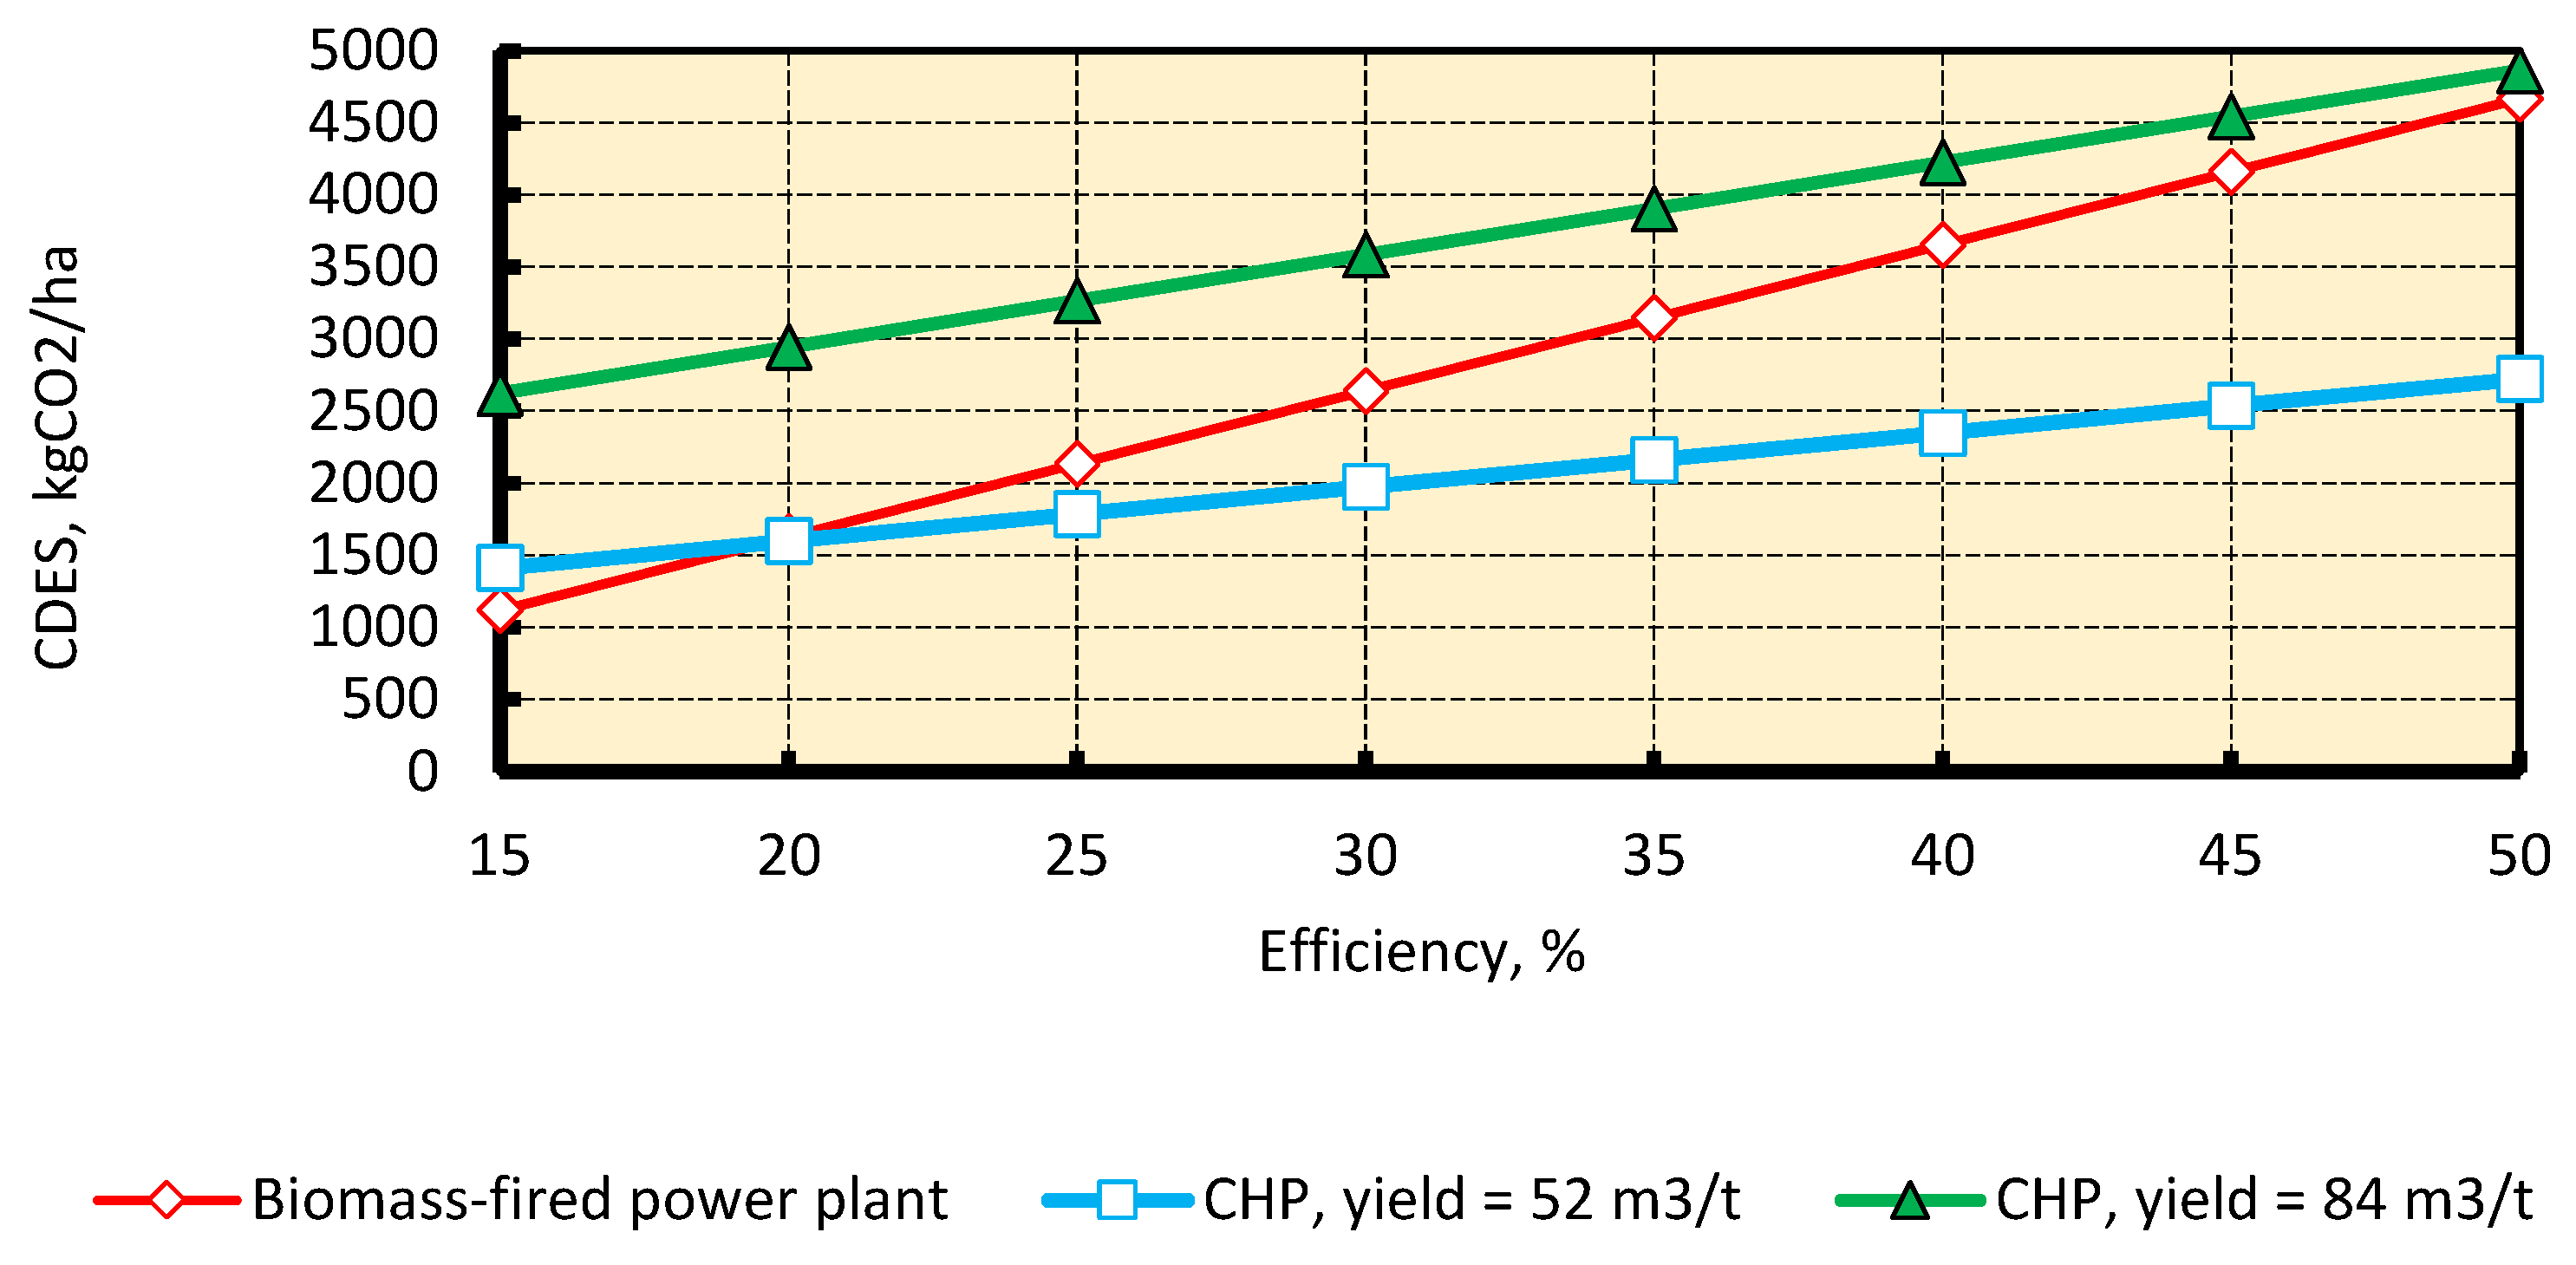
3.3. Carbon Dioxide Emissions Savings

The Ukrainian power generation system ensures an average carbon dioxide emission factor of 0.318 kgCO2/kWh [19,20,21]. If we use sorghum silage from one hectare, biomass-fired power plants can provide carbon dioxide savings from 613 to 3652 kgCO2/ha. Conventional heat supply systems are fueled by natural gas. Thermal efficiencies of natural gas-fired boilers vary from 85 to 95% [69,70]. In our calculations, we assumed a 90% efficiency. At 90% efficiency, their carbon dioxide emission factor is 0.219 kgCO2/kWh. Combined heat and power plants produce both heat and electricity. It improves their environmental indicators. It is necessary to determine the specific carbon dioxide savings of sorghum-based power plants. We calculated a decrease in carbon dioxide emissions if a power plant uses sorghum silage from one hectare. Biogas plants (if a methane yield is 84 m3 per ton of sorghum) have higher carbon dioxide savings (Figure 9). The use of digestate as a biofertilizer reduces carbon dioxide emissions. This is a result of decreasing in fossil fuel consumption for mineral fertilizer production. The anticipated carbon dioxide savings are around 1098 kgCO2/ha.

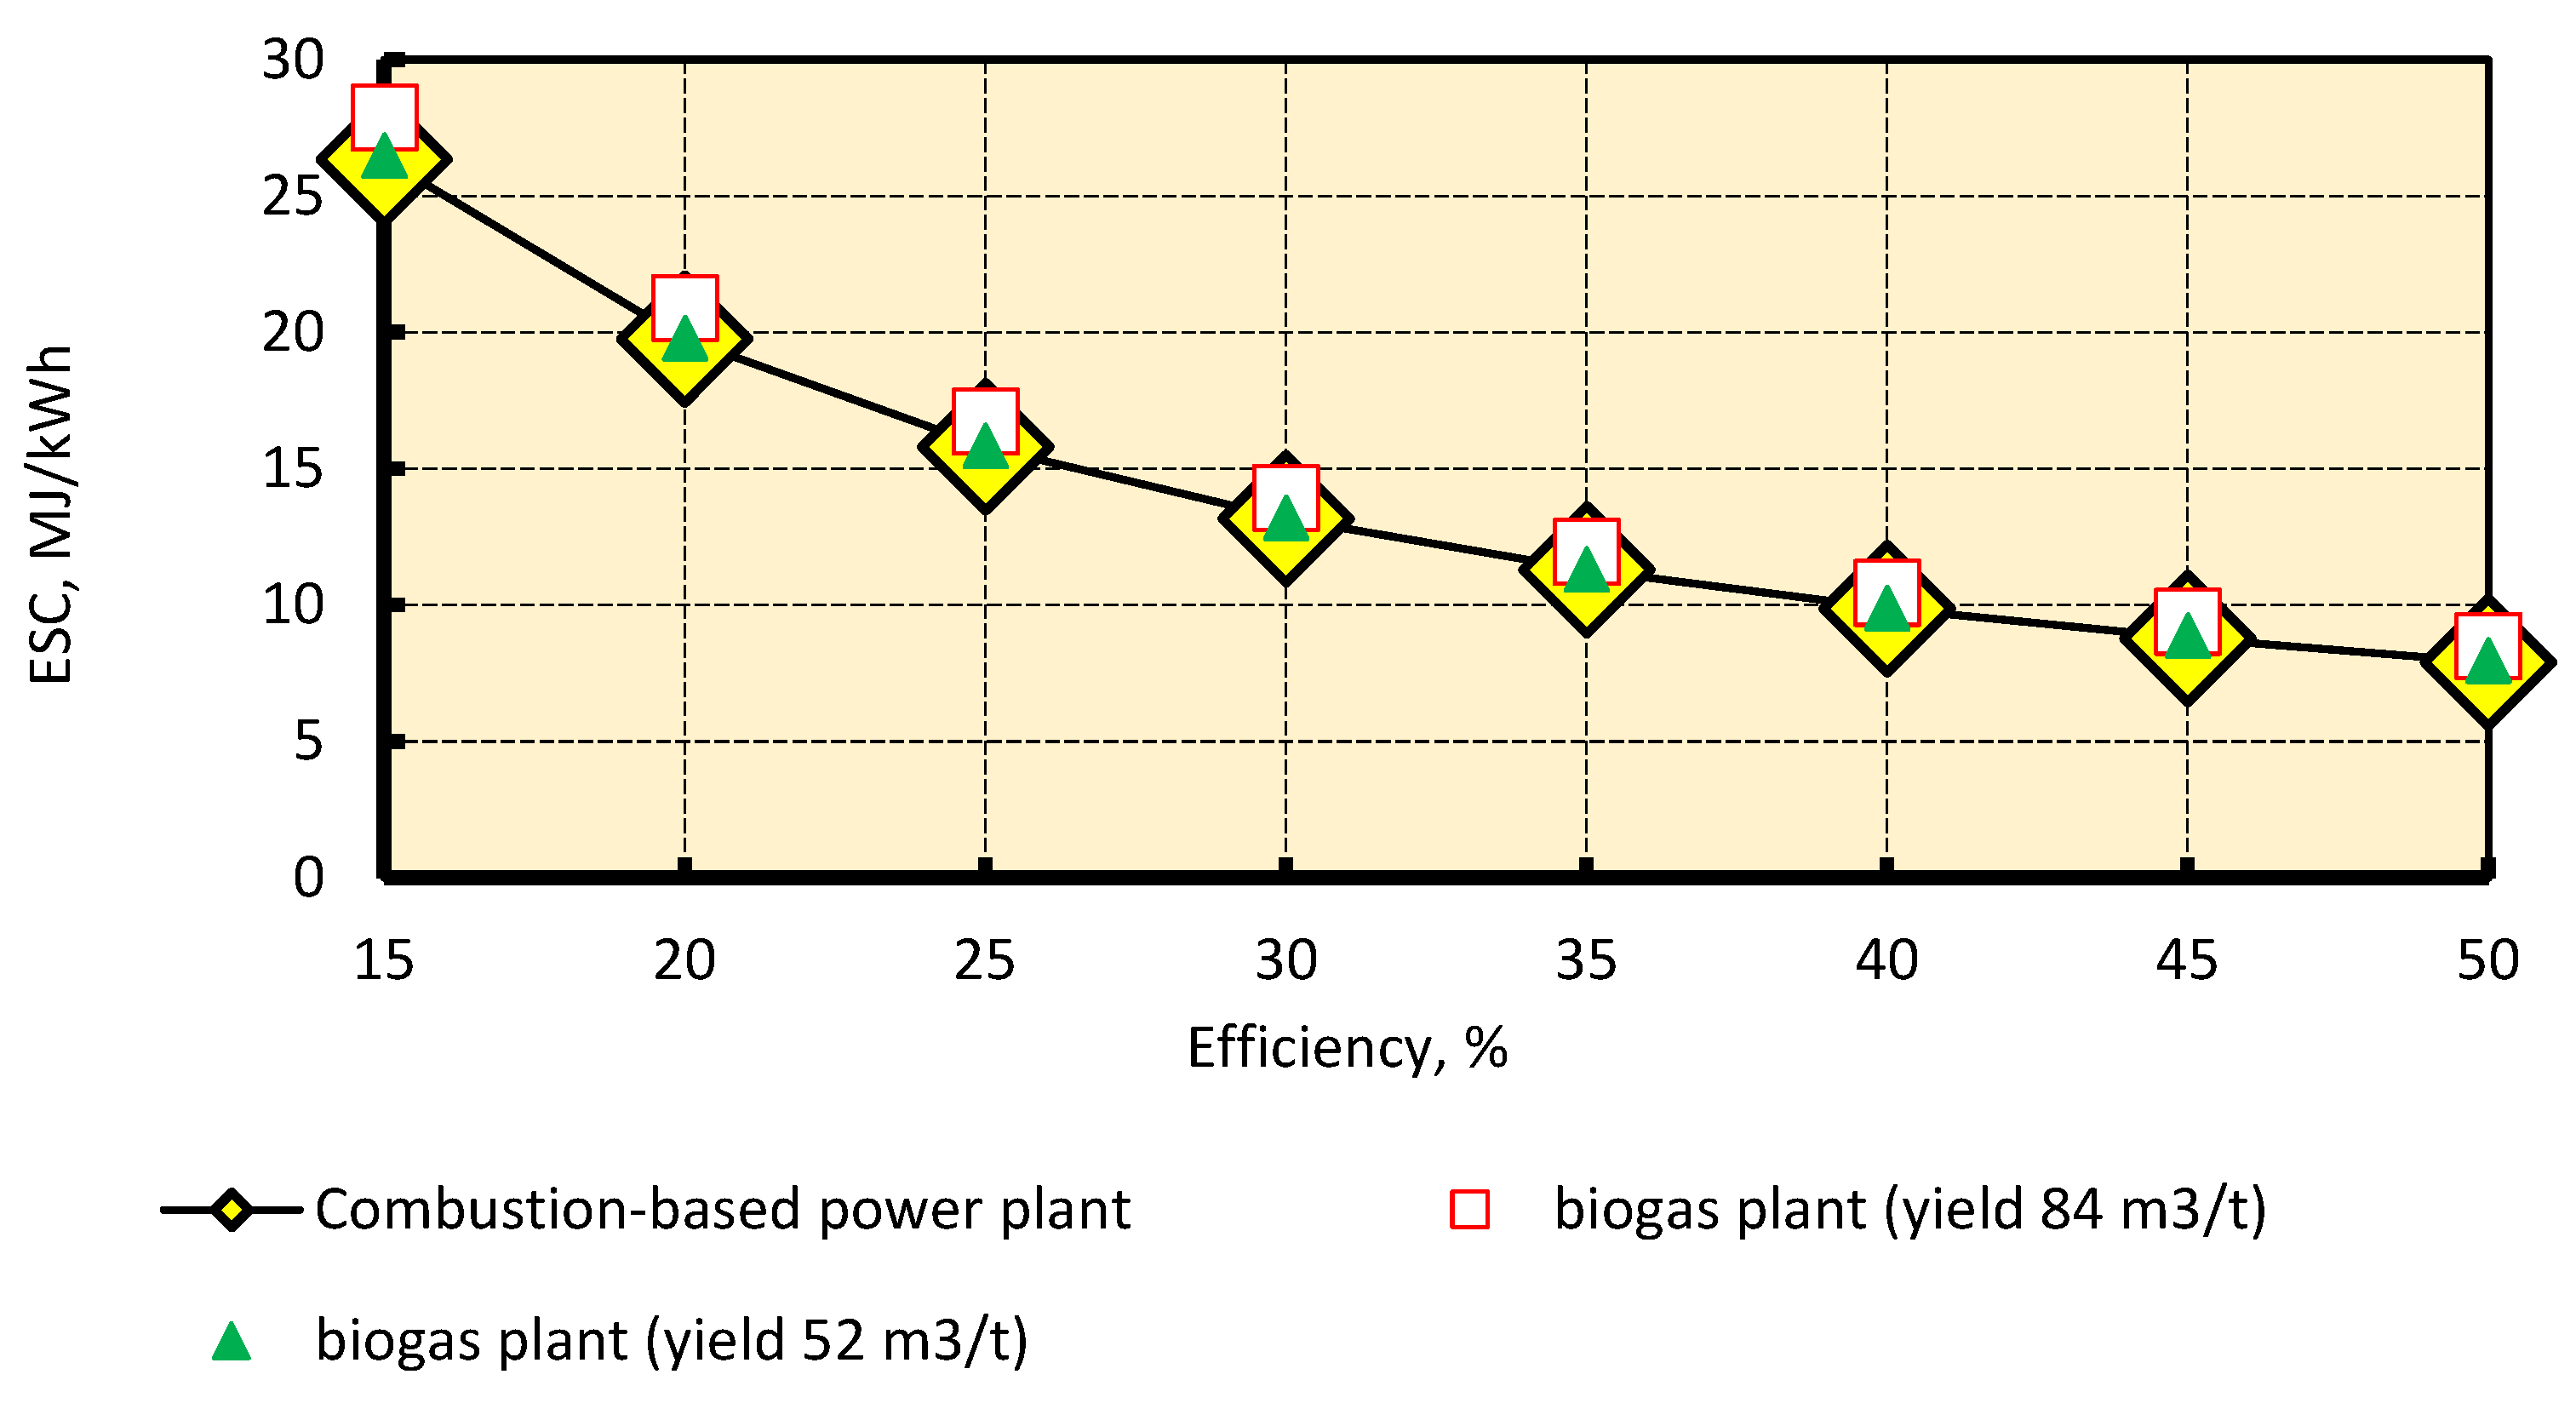
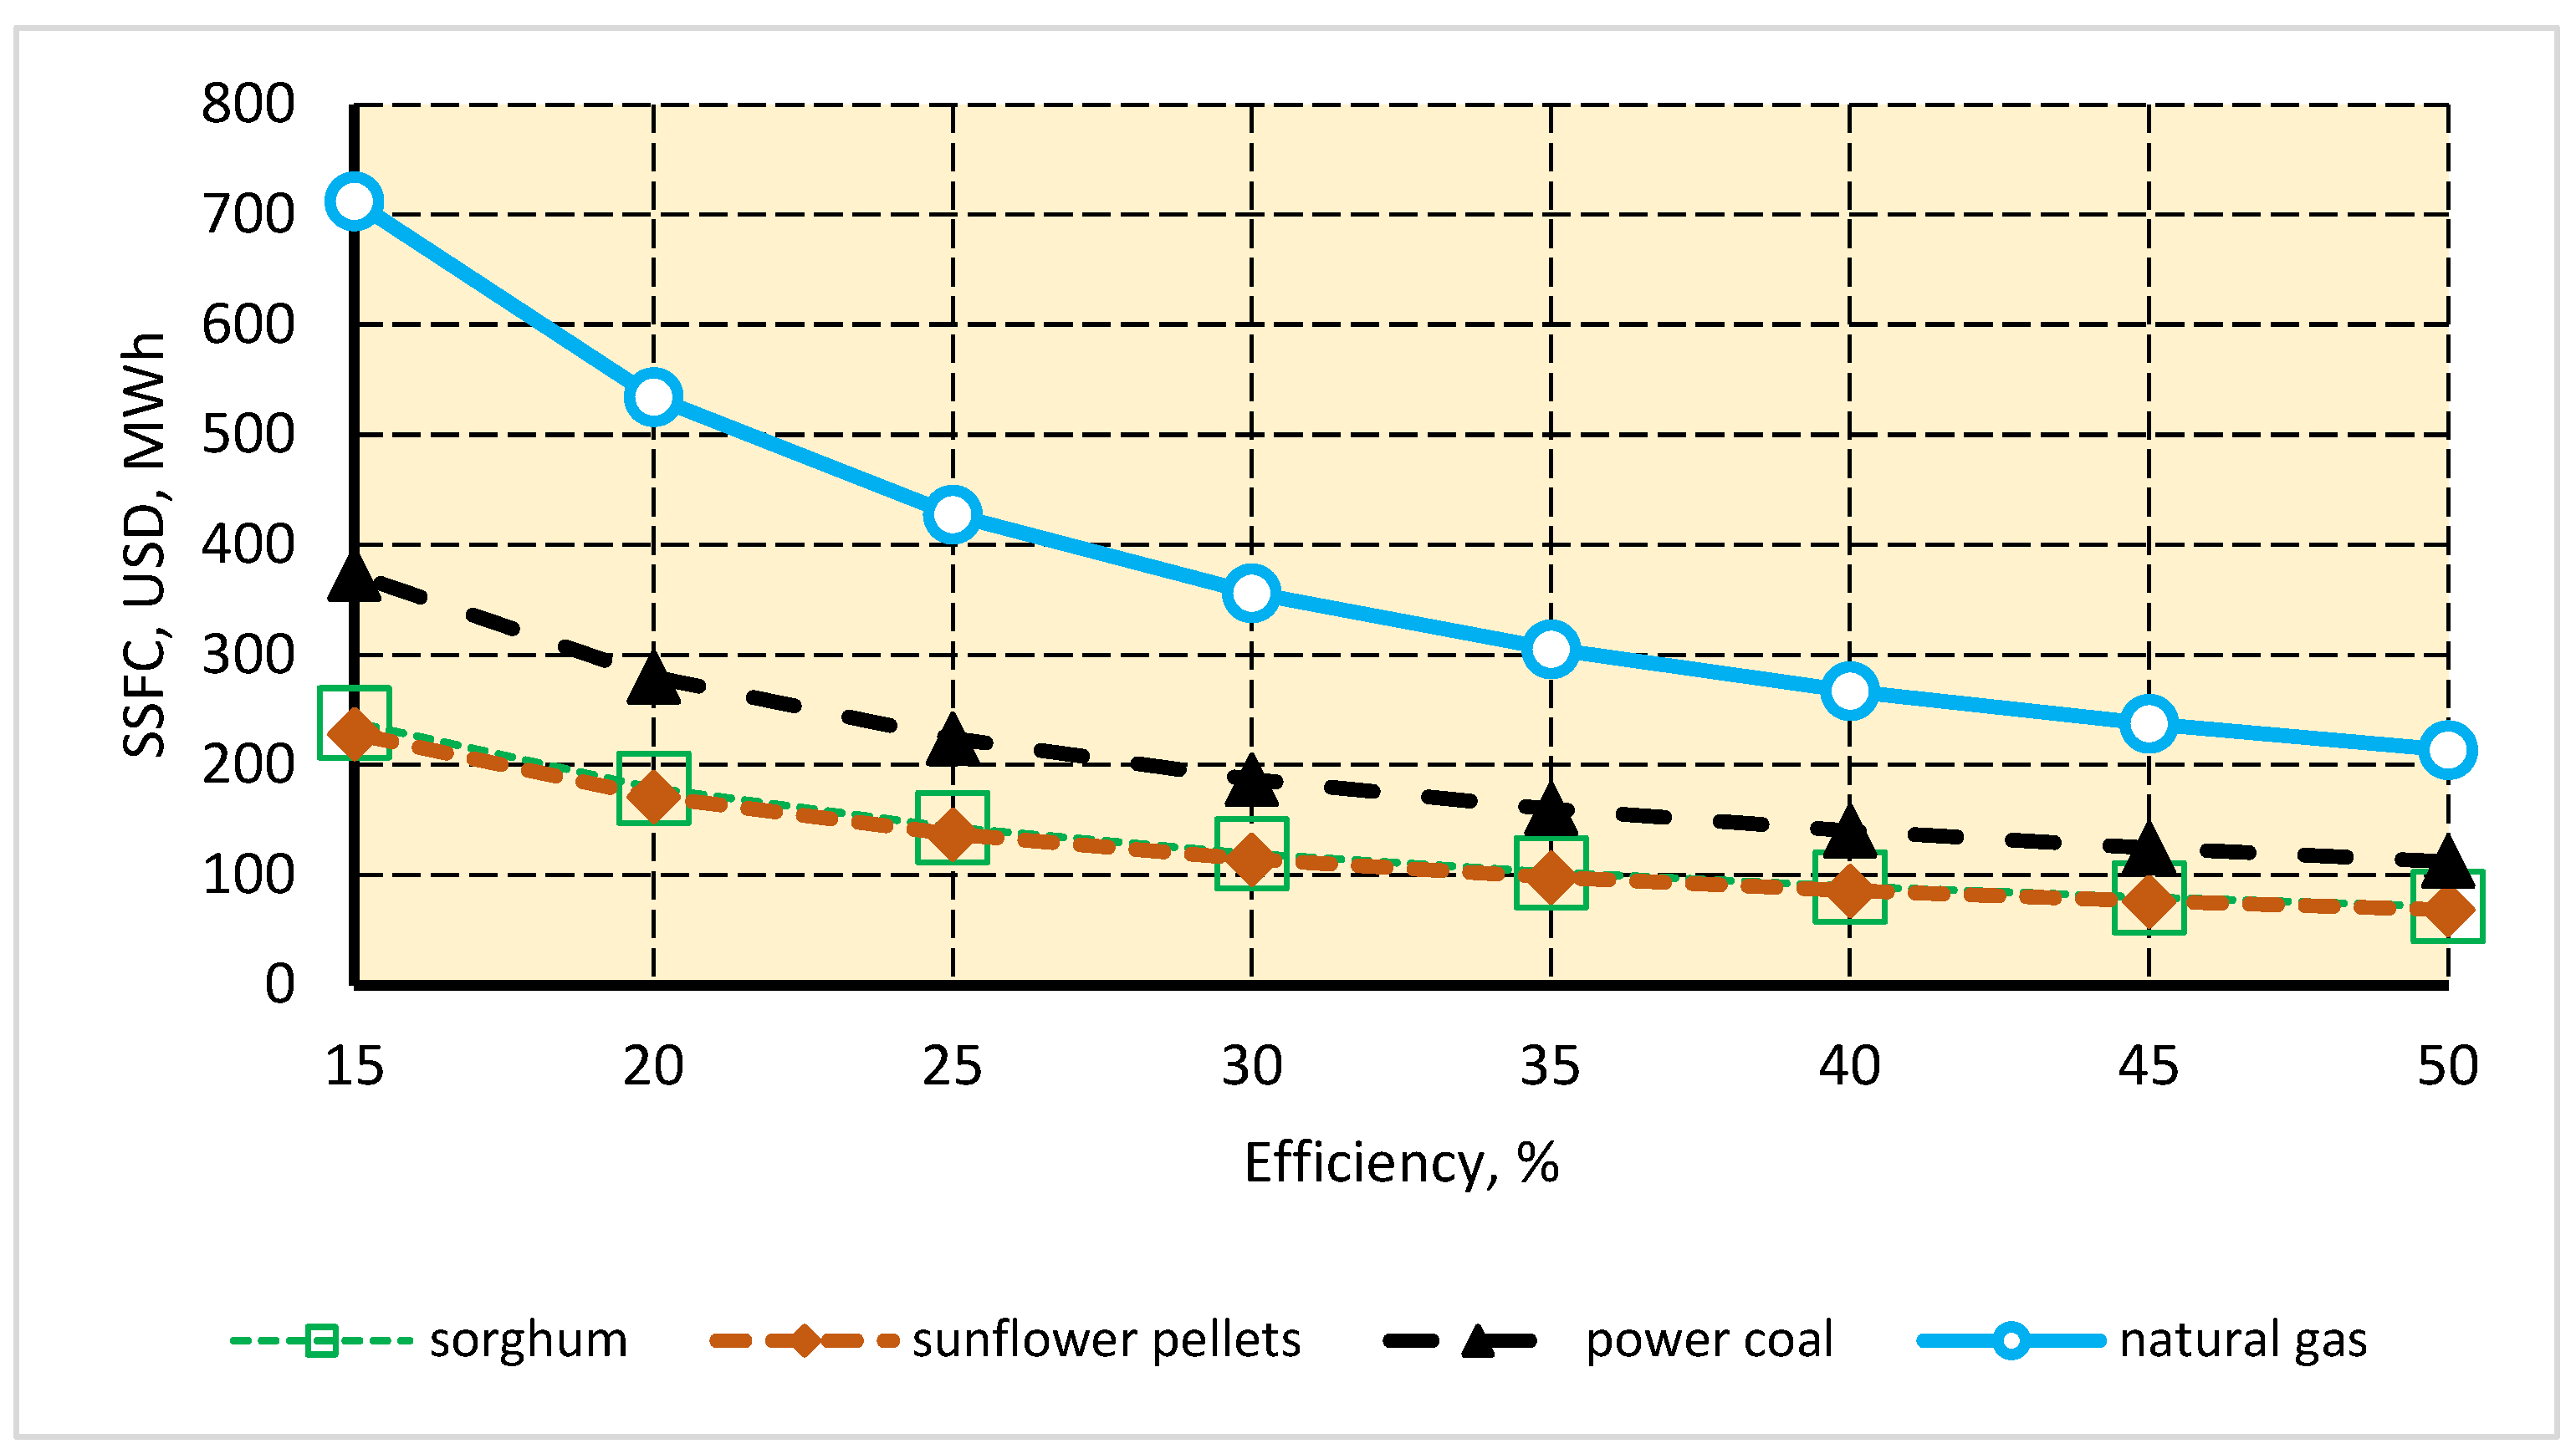
3.4. Economic Efficiency

In our economic analysis, we considered only fuel (biomass) costs. Accounting for investment costs in a sorghum-based power plant is a subject of our further study. The specific fuel costs per power generated are calculated according to the formula proposed by the authors
S S F C = b e F C ,   USD / kWh ,
where be is the specific fuel consumption, kg/kWh (m3/kWh); FC is the fuel costs, USD/kg (USD/m3).
After transformation, we get the following equation
S S F C = b e F C L H V L H V = E S C F E C ,   USD / kWh ,
where FEC is the fuel energy costs, USD/MJ.
The specific fuel costs per power generated for different fuels are shown in Figure 10. It can be seen that biofuels have lower costs. Therefore, they can be recommended for power generation based on local biomass feedstock. Currently, natural gas is not a suitable fuel for power generation. Coal-based power generation can be cheaper if biomass-based power plants have an electrical efficiency of less than 20…25%.

4. Conclusions

Biomass-based power generation systems are being developed to decrease the reliance on fossil fuels and carbon dioxide emissions. Sorghum is a promising crop to be energy feedstock due to its drought resistance, high biomass yield, and ability to be cultivated on marginal land. This crop can be used by different power generation technologies. In this study, direct burning and anaerobic digestion were considered.
Due to the field experiment, embodied energy (0.302 MJ/kg), carbon dioxide emission factor (0.0108 kgCO2/kg), yield (40.6 t/ha), and production costs (USD 31.52/t) of sorghum silage have been found. Energy and environmental indicators of biomass-fired and anaerobic digestion-based power plants were analyzed and compared. We determined that embodied energy increases energy-specific costs by around 10%.
We revealed that biogas co-generation plants have higher efficiency and carbon dioxide savings than combustion-based technology. Moreover, anaerobic digestion produces more energy, including direct (electricity and heat) and indirect (biofertilizer).
It is determined that sorghum-based power plants can reduce carbon dioxide emissions by 600–4000 kgCO2/ha. Biomass-fired power plants have lower carbon dioxide savings than biogas co-generation ones.
It was found that sorghum energy costs were similar to other biofuels and cheaper than fossil fuels. This study has confirmed that sorghum is a suitable biofuel for local power generation and co-generation plants. The direction of further studies is the evaluation of the economic effectiveness of sorghum-based energy supply systems.

Author Contributions

Conceptualization, V.H. (Valerii Havrysh) and V.H. (Vasyl Hruban); methodology, V.N.; validation, V.H. (Valerii Havrysh) and V.H. (Vasyl Hruban); formal analysis, V.N.; investigation, V.H. (Valerii Havrysh); resources, V.H. (Vasyl Hruban); writing—original draft preparation, V.H. (Valerii Havrysh); writing—review and editing, V.H. (Vasyl Hruban) and V.N.; supervision, V.H. (Valerii Havrysh) All authors have read and agreed to the published version of the manuscript.

Funding

This research received no external funding.

Institutional Review Board Statement

Not applicable.

Data Availability Statement

Not applicable.

Acknowledgments

The authors thank the reviewers and editors for their valuable contributions that significantly improved this manuscript.

Conflicts of Interest

The authors declare no conflict of interest.

References

  1. Statistical Review of World Energy. 2021. Available online: https://www.bp.com/content/dam/bp/business-sites/en/global/corporate/pdfs/energy-economics/statistical-review/bp-stats-review-2021-full-report.pdf (accessed on 18 October 2022).
  2. Renewable Energy Statistics 2022. IRENA. Available online: https://www.irena.org/publications/2022/Jul/Renewable-Energy-Statistics-2022 (accessed on 18 October 2022).
  3. Renewable Capacity Statistics 2022. IRENA. Available online: https://www.irena.org/-/media/Files/IRENA/Agency/Publication/2022/Apr/IRENA_RE_Capacity_Statistics_2022.pdf (accessed on 18 October 2022).
  4. Renewable Power Generation Costs in 2021. IRENA. Available online: https://irena.org/publications/2022/Jul/Renewable-Power-Generation-Costs-in-2021 (accessed on 18 October 2022).
  5. Wholesale Prices of Electricity in Poland from 2018 to 2022 (in Zloty/MWh). Available online: https://www.statista.com/statistics/1066654/poland-wholesale-electricity-prices/ (accessed on 20 October 2022).
  6. Polish Zloty to Euro Spot Exchange Rates for 2021. Available online: https://www.exchangerates.org.uk/PLN-EUR-spotexchange-rates-history-2021.html (accessed on 20 October 2022).
  7. Average Monthly Electricity Wholesale Prices in Selected Countries in the European Union (EU) from January 2020 to January 2022. Available online: https://www.statista.com/statistics/1267500/eu-monthly-wholesale-electricity-price-country/ (accessed on 15 October 2022).
  8. Purchase Prices on the Day-Ahead Market for Group b Consumers in 2021. Available online: https://tek.energy/electricity/prices (accessed on 20 October 2022).
  9. Electricity Prices for Non-Household Consumers. Available online: https://ec.europa.eu/eurostat/statistics-explained/index.php?title=Electricity_price_statistics#Electricity_prices_for_non-household_consumers (accessed on 20 October 2022).
  10. Hosseini, S.E. Transition Away from Fossil Fuels toward Renewables: Lessons from Russia-Ukraine Crisis. Future Energy 2022, 1, 2–5. Available online: https://fupubco.com/fuen/article/view/8 (accessed on 30 October 2022). [CrossRef]
  11. Scientific American: Science News, Expert Analysis, Health Research—Scientific American. Available online: https://www.scientificamerican.com/ (accessed on 30 October 2022).
  12. Renewable Energy and Jobs. Annual Review 2022. Available online: https://www.irena.org/publications/2022/Sep/Renewable-Energy-and-Jobs-Annual-Review-2022 (accessed on 30 October 2022).
  13. Energy Profile of Ukraine. IRENA. 2021. Available online: https://www.irena.org/IRENADocuments/Statistical_Profiles/Europe/Ukraine_Europe_RE_SP.pdf (accessed on 20 October 2022).
  14. Zachmann, G. Reaching Ukraine’s Energy and Climate Targets. Berlin Economics. Available online: https://www.lowcarbonukraine.com/wp-content/uploads/LCU_Reaching-Ukraines-energy-and-climate-targets.pdf (accessed on 20 October 2022).
  15. Shlapak, M. Carbon Emission Factor for Ukrainian Electricity Grid. 2017. Available online: https://www.linkedin.com/pulse/carbon-emission-factor-ukrainian-electricity-grid-mykola-shlapak/?articleId=6324279390976962560 (accessed on 20 October 2022).
  16. Warner, E.S.; Heath, G.A. Life Cycle Greenhouse Gas Emissions of Nuclear Electricity Generation. J. Ind. Ecol. 2012, 16 (Suppl. 1), 73–92. [Google Scholar] [CrossRef]
  17. Kadiyala, A.; Kommalapati, R.; Huque, Z. Evaluation of the Life Cycle Greenhouse Gas Emissions from Hydroelectricity Generation Systems. Sustainability 2016, 8, 539. [Google Scholar] [CrossRef] [Green Version]
  18. Comparison of Lifecycle Greenhouse Gas Emissions of Various Electricity Generation Sources. World Nuclear Association Report. July 2011. Available online: http://www.world-nuclear.org/uploadedFiles/org/WNA/Publications/Working_Group_Reports/comparison_of_lifecycle.pdf (accessed on 18 October 2022).
  19. In 2020, the Installed Capacity of WPPs and SPPs Increased by 41% and Their Share in the Generation Mix Doubled. Ukrenergo. Available online: https://ua.energy/general-news/in-2020-the-installed-capacity-of-wpps-and-spps-increased-by-41-and-their-share-in-the-generation-mix-doubled/ (accessed on 18 October 2022).
  20. Havrysh, V.; Kalinichenko, A.; Szafranek, E.; Hruban, V. Agricultural Land: Crop Production or Photovoltaic Power Plants. Sustainability 2022, 14, 5099. [Google Scholar] [CrossRef]
  21. Moro, A.; Lonza, L. Electricity carbon intensity in European Member States: Impacts on GHG emissions of electric vehicles. Transp. Res. Part D 2018, 64, 5–14. [Google Scholar] [CrossRef]
  22. Bórawski, P.; Bełdycka-Bórawska, A.; Szymańska, E.J.; Jankowski, K.J.; Dubis, B.; Dunn, J.W. Development of renewable energy sources market and biofuels in the European Union. J. Clean. Prod. 2019, 228, 467–484. [Google Scholar] [CrossRef]
  23. Marks-Bielska, R.; Bielski, S.; Novikova, A.; Romaneckas, K. Straw Stocks as a Source of Renewable Energy. A Case Study of a District in Poland. Sustainability 2019, 11, 4714. [Google Scholar] [CrossRef] [Green Version]
  24. Stolarski, M.J.; Śnieg, M.; Krzyżaniak, M.; Tworkowski, J. Short rotation coppices, grasses and other herbaceous crops: Productivity and yield energy value versus 26 genotypes. Biomass Bioenergy 2018, 119, 109–120. [Google Scholar] [CrossRef]
  25. Kołodziej, B.; Antonkiewicz, J.; Stachyra, M.; Bielińska, E.J.; Wiśniewski, J.; Luchowska, K.; Kwiatkowski, C. Use of sewage sludge in bioenergy production—A case study on the effects on sorghum biomass production. Eur. J. Agron. 2015, 69, 63–74. [Google Scholar] [CrossRef]
  26. Dar, R.A.; Dar, E.A.; Kaur, A.; Phutela, U.G. Sweet sorghum-a promising alternative feedstock for biofuel production. Renew. Sustain. Energy Rev. 2018, 82, 4070–4090. [Google Scholar] [CrossRef]
  27. Cattani, M.; Sartori, A.; Bondesan, V.; Bailoni, L. In vitro degradability, gas production, and energy value of different hybrids of sorghum after storage in mini-silos. Ann. Anim. Sci. 2016, 16, 769–777. [Google Scholar] [CrossRef] [Green Version]
  28. Ostovareh, S.; Karim, K.; Zamani, A. Efficient conversion of sweet sorghum stalks to biogas and ethanol using organosolv pretreatment. Ind. Crops Prod. 2014, 66, 170–177. [Google Scholar] [CrossRef]
  29. Maximising the Yield of Biomass from Residue of Agricultural Crops and Biomass from Forestry. Final Report, Project Number: BIENL15082. Ecofys 2016. Available online: https://ec.europa.eu/energy/sites/ener/files/documents/Ecofys%20-%20Final_%20report_%20EC_max%20yield%20biomass%20residue%2020151214.pdf (accessed on 17 November 2022).
  30. Zhang, Z.; Zhao, W.; Zhao, W. Commercialization Development of Crop Straw Gasification Technologies in China. Sustainability 2014, 6, 9159–9178. [Google Scholar] [CrossRef] [Green Version]
  31. Perkins, G.; Bhaskar, T.; Konarova, M. Process development status of fast pyrolysis technologies for the manufacture of renewable transport fuels from biomass. Renew. Sustain. Energy Rev. 2018, 90, 292–315. [Google Scholar] [CrossRef]
  32. Ataei, A.; Azimi, A.; Kalhori, S.B.; Abari, M.F.; Radnezhad, H. Performance analysis of a co-gasifier for organic waste in agriculture. Int. J. Recycl. Org. Waste Agric. 2012, 1, 6. [Google Scholar] [CrossRef] [Green Version]
  33. Obernberger, I.; Thek, G. Cost assessment of selected decentralized CHP applications based on biomass combustion and biomass gasification. In Proceedings of the 16th European Biomass Conference Exhibition, Valencia, Spain, 2–6 June 2008; Valencia, ETA-Renewable Energies: Florence, Italy, 2008. Available online: https://bios-bioenergy.at/uploads/media/Paper-Obernberger-Cost-assessment-CHP-BM-comustiongasification-2008-05-30.pdf (accessed on 17 November 2022).
  34. Benato, A.; Macor, A. Biogas Engine Waste Heat Recovery Using Organic Rankine Cycle. Energies 2017, 10, 327. [Google Scholar] [CrossRef]
  35. Dolz, V.; Novella, R.; García, A.; Sánchez, J. HD Diesel engine equipped with a bottoming Rankine cycle as a waste heat recovery system. Part 1: Study and analysis of the waste heat energy. Appl. Therm. Eng. 2012, 36, 269–278. [Google Scholar] [CrossRef] [Green Version]
  36. State Statistics Service of Ukraine. Agriculture of Ukraine. Statistical Yearbook 2019; State Statistics Service of Ukraine: Kyiv, Ukraine, 2020. Available online: http://www.ukrstat.gov.ua/druk/publicat/kat_u/2020/zb/09/zb_sg_Ukr_2019.pdf (accessed on 17 November 2022).
  37. Ukraine Sorghum Production by Year. Available online: https://www.indexmundi.com/agriculture/?country=ua&commodity=sorghum&graph=production (accessed on 17 November 2022).
  38. Yu, J.; Zhang, T.; Zhong, J.; Zhang, X.; Tan, T. Biorefinery of sweet sorghum stem. Biotechnol. Adv. 2012, 30, 811–816. [Google Scholar] [CrossRef]
  39. Krzystek, L.; Wajszczuk, K.; Pazera, A.; Matyka, M.; Slezak, R.; Ledakowicz, S. The Influence of Plant Cultivation Conditions on Biogas Production: Energy Efficiency. Waste Biomass Valor 2022, 11, 513–523. [Google Scholar] [CrossRef] [Green Version]
  40. Matsakas, L.; Rova, U.; Christakopoulos, P. Evaluation of Dried Sweet Sorghum Stalks as Raw Material for Methane Production. BioMed Res. Int. 2014, 2014, 731731. [Google Scholar] [CrossRef]
  41. Salimbeni, A. Sweet sorghum biogas plant in temperate regions (Belgium)—Demonstration plant for biogas and high value biofertilizer production. In Proceedings of the 21st European Biomass Conference and Exhibition, Copenhagen, Denmark, 3–7 June 2013; Available online: http://www.eubia.org/cms/download/sweet-sorghum-biogas-plant-in-temperate-regions-belgium-demostration-plant-for-biogas-and-high-value-biofertilizer-production/ (accessed on 18 October 2022).
  42. Wiloso, E.; Setiawan, A.; Prasetia, H.; Wiloso, A.; Sudiana, I.; Lestari, R.; Nugroho, S.; Hermawan, D.; Fang, K.; Heijungs, R. Production of sorghum pellets for electricity generation in Indonesia: A life cycle assessment. Biofuel Res. J. 2020, 7, 1178–1194. [Google Scholar] [CrossRef]
  43. Ren, L.T.; Liu, Z.X.; Wei, T.W.; Xie, G.H. Evaluation of energy input and output of sweet sorghum grown as a bioenergy crop on coastal saline-alkali land. Energy 2012, 47, 166–173. [Google Scholar] [CrossRef]
  44. Jankowski, K.J.; Dubis, B.; Sokólski, M.M.; Załuski, D.; Bórawski, P.; Szempliński, W. Productivity and energy balance of maize and sorghum grown for biogas in a large-area farm in Poland: An 11-year field experiment. Ind. Crops Prod. 2020, 148, 112326. [Google Scholar] [CrossRef]
  45. Biboum, A.; Yılancı, A. Feasibility study of Biomass power plant fired with maize and sorghum stalk in the Sub-Saharan region: The case of the northern part of Cameroon. Eur. Mech. Sci. 2019, 3, 102–111. [Google Scholar] [CrossRef] [Green Version]
  46. Adapa, P.; Tabil, L.; Schoenau, G. Grinding performance and physical properties of non-treated and steam-exploded barley, canola, oat, and wheat straw. Biomass Bioenergy 2011, 35, 549–561. [Google Scholar] [CrossRef]
  47. Physico-Mechanical Properties of Corn. Available online: http://razvitie-pu.ru/?page_id=6629 (accessed on 12 September 2022).
  48. Mishra, A.; Kumar, A.; Ghosh, S. Energy assessment of second generation (2G) ethanol production from wheat straw in Indian scenario. 3 Biotech 2018, 8, 142. [Google Scholar] [CrossRef]
  49. Fix, J.; Tynan, S.; Kissinger, M. Carbon Footprint Analysis for Wood & Agricultural Residue Sources of Pulp. Final Report. 2011. Available online: https://www1.agric.gov.ab.ca/$Department/deptdocs.nsf/all/sag13757/$FILE/Final_Report_CFA.pdf (accessed on 14 October 2022).
  50. Havrysh, V.; Kalinichenko, A.; Mentel, G.; Olejarz, T. Commercial Biogas Plants: Lessons for Ukraine. Energies 2020, 13, 2668. [Google Scholar] [CrossRef]
  51. Biomass for Heat and Power Technology Brief. IEA-ETSAP and IRENA Technology Brief E05. 2015. Available online: https://biomasspower.gov.in/document/Reports/IRENA_Biomass%20for%20Heat%20and%20Power.pdf (accessed on 20 October 2022).
  52. Geletukha, G.; Drahniev, S.; Zheliezna, T.; Bashtovyi, A. Prospects of Sunflower Residues Use for Energy. Available online: https://uabio.org/wp-content/uploads/2020/10/uabio-position-paper-25-en-1.pdf (accessed on 20 October 2022).
  53. Havrysh, V.; Kalinichenko, A.; Brzozowska, A.; Stebila, J. Life Cycle Energy Consumption and Carbon Dioxide Emissions of Agricultural Residue Feedstock for Bioenergy. Appl. Sci. 2021, 11, 2009. [Google Scholar] [CrossRef]
  54. Goncharuk, A.G.; Havrysh, V.I.; Nitsenko, V.S. National features for alternative motor fuels market. Int. J. Energy Technol. Policy 2018, 14, 226–249. [Google Scholar] [CrossRef]
  55. Bazaluk, O.; Havrysh, V.; Fedorchuk, M.; Nitsenko, V. Energy Assessment of Sorghum Cultivation in Southern Ukraine. Agriculture 2021, 11, 695. [Google Scholar] [CrossRef]
  56. Herrmann, C.; Idler, C.; Heiermann, M. Biogas crops grown in energy crop rotations: Linking chemical composition and methane production characteristics. Bioresour. Technol 2016, 206, 23–35. [Google Scholar] [CrossRef] [PubMed] [Green Version]
  57. Battista, F.; Frison, N.; Bolzonella, D. Energy and Nutrients’ Recovery in Anaerobic Digestion of Agricultural Biomass: An Italian Perspective for Future Applications. Energies 2019, 12, 3287. [Google Scholar] [CrossRef] [Green Version]
  58. Sample Costs to Produce Sorghum Silage. University of California Cooperative Extension. 2016. Available online: https://coststudyfiles.ucdavis.edu/uploads/cs_public/c2/a9/c2a9d0ea-f089-48a9-a9b2-64ec58355b46/2016sorghumsilagesjvfinaldraftmar23.pdf (accessed on 14 October 2022).
  59. Pricing for 2022 Summer Texas Crops—Some at Record Highshs. Available online: https://agrilife.org/texasrowcrops/2022/05/06/pricing-for-2022-summer-texas-crops-some-at-record-highshs/#:~:text=Some%20preliminary%202022%20silage%20prices,%2465%2Fton%20for%20forage%20sorghum (accessed on 18 October 2022).
  60. Stanytsina, V.; Artemchuk, V.; Bogoslavska, O.; Zaporozhets, A.; Kalinichenko, A.; Stebila, J.; Havrysh, V.; Suszanowicz, D. Fossil Fuel and Biofuel Boilers in Ukraine: Trends of Changes in Levelized Cost of Heat. Energies 2022, 15, 7215. [Google Scholar] [CrossRef]
  61. Van Nguyen, H.; Nguyen, C.D.; Van Tran, T.; Hau, H.D.; Nguyen, N.T.; Gummert, M. Energy efficiency, greenhouse gas emissions, and cost of rice straw collection in the mekong river delta of vietnam. Field Crop. Res. 2016, 198, 16–22. [Google Scholar] [CrossRef] [Green Version]
  62. Ou, X.; Xiaoyu, Y.; Zhang, X. Life-cycle energy consumption and greenhouse gas emissions for electricity generation and supply in China. Appl. Energy 2011, 88, 289–297. [Google Scholar] [CrossRef]
  63. Kim, S.; Dale, B.E.; Jenkins, R. Life cycle assessment of corn grain and corn stover in the United States. Int. J. Life Cycle Assess. 2009, 14, 160–174. [Google Scholar] [CrossRef]
  64. Technical Annex to the SEAP: The Emission Factors. Available online: https://www.ces-med.eu/publications/technical-annexseap (accessed on 2 October 2022).
  65. Hansen, M.T. Biomass based Combined Heat and Power Generation. 2014. Available online: http://www.videncenter.dk/exportcat/combined_heat_and_power.pdf (accessed on 17 November 2022).
  66. Aguilera, E.; Guzmán, G.I.; Infante-amate, J.; García-ruiz, R.; Herrera, A.; Villa, I. Embodied Energy in Agricultural Inputs. Incorporating a Historical Perspective. DT-SEHA 15. 2015. Available online: http://hdl.handle.net/10234/141278 (accessed on 5 October 2022).
  67. Skowrońska, M.; Filipek, T. Life cycle assessment of fertilizers: A review. Int. Agrophysics 2014, 28, 101–110. [Google Scholar] [CrossRef]
  68. Wood, S.; Cowie, A. A Review of Greenhouse Gas Emission Factors for Fertiliser Production. June 2004. For IEA Bioenergy Task 38. Available online: https://www.sciencetheearth.com/uploads/2/4/6/5/24658156/2004_wood_a_review_of_greenhouse_gas_emission_factors.pdf (accessed on 17 November 2022).
  69. Factsheet Boiler Efficiency. Available online: https://www.energy.gov.au/sites/default/files/hvac-factsheet-boiler-efficiency.pdf (accessed on 18 October 2022).
  70. Vakkilainen, E.K. 3—Boiler Processes. In Steam Generation from Biomass: Construction and Design of Large Boilers; Vakkilainen, E.K., Ed.; Butterworth-Heinemann: Oxford, UK, 2017; pp. 57–86. [Google Scholar] [CrossRef]
Figure 1. A system boundary of combustion-based biomass power plant.
Agriculture 12 02148 g001
Figure 2. A system boundary of a biogas power plant.
Agriculture 12 02148 g002
Figure 3. Embodied energy per lower heating value.
Agriculture 12 02148 g003
Figure 4. Emission factor per lower heating value.
Agriculture 12 02148 g004
Figure 5. Energy-specific costs.
Agriculture 12 02148 g005
Figure 6. Power and heat generation (methane yield is 84 m3/t)
Agriculture 12 02148 g006
Figure 7. Power generated by sorghum-based power plant.
Agriculture 12 02148 g007
Figure 8. Energy produced per sorghum silage grown on one hectare.
Agriculture 12 02148 g008
Figure 9. Carbon dioxide savings.
Agriculture 12 02148 g009
Figure 10. Specific fuel costs versus electric efficiency.
Agriculture 12 02148 g010
Table 1. Input and output flows.
IndicatorUnitValue
Input flows
Diesel fuelkg/ha63.5
Gasoline kg/ha8.0
Electricity kWh/ha11.38
Sweet sorghum seedskg/ha6.0
Mineral fertilizer (10:40 N:P2O5)kg/ha187.0
Herbicides kg/ha8.0
Total energy inputsGJ/ha12.27
Total costsUSD/ha1279.5
Output flows
Sorghum silaget/ha40.6
Carbon dioxide emissionskgCO2/ha438.32
Publisher’s Note: MDPI stays neutral with regard to jurisdictional claims in published maps and institutional affiliations.

