1. Introduction
As a new direction of current agricultural development, intelligent agriculture [
1,
2,
3,
4] not only changes the industrial model that must rely on environmental planting in traditional agriculture, but also improves the quality of agricultural products, efficiently uses various agricultural resources, achieves considerable economic and social benefits, and realizes agricultural refinement, high efficiency, and greening. Crop phenotype [
5,
6,
7] is a key link in the analysis of crop growth environment, which is used to comprehensively evaluate the growth morphology and traits of crops in complex and changeable farmland environments. It is an effective way to improve the field operation of agricultural machinery and equipment. Traditional soybean plant phenotypic [
8] measurement and analysis, and the manual collection of soybean plant information on the farmland are time-consuming and labor-intensive. The complex and changeable field environment and the diverse characteristics of soybean plants [
9] make it difficult to obtain soybean plant phenotypic information, which increases the difficulty of accurate identification of soybean plants [
10,
11]. In recent years, three-dimensional reconstruction technology [
12] has played an increasingly important role in the study of soybean plant phenotype. Applying three-dimensional reconstruction to the field operation of agricultural machinery and equipment, a model closer to the actual soybean plant phenotype is constructed, and the growth morphology and traits of soybean plants are evaluated quickly and efficiently. It provides accurate information for agricultural machinery and equipment to accurately identify soybean plants, effectively solves the problems of the complex production environment in soybean fields and the diverse characteristics of soybean plants and accurate soybean plant information, and meets the important needs of refinement and high efficiency of intelligent agriculture.
The existing crop reconstruction methods mainly use two-dimensional images of crops taken from different perspectives to match by extracting features, so as to reconstruct the point cloud model of crops [
13]. In practical applications, the two-dimensional images are easily constrained by illumination during the imaging process. The brightness and contrast of the acquired images are generally low and there is noise, which reduces the reconstruction accuracy of the three-dimensional morphological characteristics of crops and seriously affects the analysis of crop phenotypes. For the reconstruction of crops under low illumination, it is necessary to increase the brightness of the light. The traditional illumination brightness enhancement algorithm can be divided into the histogram equalization [
14,
15]-based method and the Retinex [
16] theory-based method. The histogram equalization method is based on the optimization of a single pixel to achieve overall brightness and contrast enhancement, but it ignores the correlation between regional pixels and leads to the destruction of detailed information. The method based on the Retinex theory recovers image brightness and color information from image illumination information and considers the correlation of image regional features. However, for uneven illumination, it will cause color distortion and artifacts. With the significant effect of deep learning in image denoising [
17] and image recognition [
18], it has also been widely used in image enhancement [
19]. Wei et al. [
20] proposed a convolutional neural network model RetinexNet based on Retinex theory. The algorithm decomposes the input low-light image into a reflection image and an illumination image and then enhances and adjusts the image. The illumination-enhanced illumination image and the denoised reflectivity image are recombined to generate a corrected image. Zhang et al. [
21] proposed a simple and effective KinD low-light image enhancement network. The network framework is similar to the RetinexNet architecture, and the core is to introduce more training loss constraints. Jiang et al. [
22] introduced the GAN algorithm into image enhancement and proposed an efficient unsupervised generative adversarial network EnlightenGAN algorithm, which can be directly applied to network training without using low-light illumination or normal image blocks, with a better generalization effect. Marco Tulio Ribeiro et al. [
23] proposed the LIME algorithm, which estimates the illumination of each pixel by finding the maximum value in the three channels of the RGB image. A structural prior is then applied to refine the initial image as the final illumination map to generate the final enhanced image. Lv et al. [
24] proposed the MBLLEN algorithm, which is a multi-branch low-light image enhancement network. By extracting rich image features from different levels for enhancement and fusing the output images generated by multiple branches, the image quality is improved from different directions.
At present, the three-dimensional reconstruction method based on SFM (structure from motion) [
25] and MVS (multi-view stereo) [
26] is used to obtain the three-dimensional data of the whole crop. GUAN et al. [
27], using an RGB camera and a photon mixing detector (PMD), carried out three-dimensional reconstruction of soybean plants with color information and used a density-based spatial clustering algorithm (DBSCAN) to extract canopy information from the original three-dimensional point cloud. Then, principal component analysis (PCA) and an iterative closest point (ICP) algorithm were used to register multi-source images to complete the three-dimensional reconstruction of soybean plants. WANG et al. [
28] constructed soybeans at different growth stages through a multi-image acquisition system based on the Kinect sensor and generated comprehensive point cloud data of soybeans from three perspectives. Conditional filtering and K-nearest neighbor filtering (KNN) algorithms were used to preprocess the original three-dimensional point cloud. Finally, random sample consensus (RANSAC) and iterative closest point (ICP) algorithms were used to complete point cloud matching and fusion. SU et al. [
29] developed a plant localization technology based on systematic crop signals for the weeds that cannot be controlled by the existing cultivation techniques in the crop row and are highly competitive with the early stage of soybean growth. By applying different concentrations of a signal compound with a unique fluorescent appearance to soybeans in different periods, the automatic detection of soybean appearance is realized, and the fluorescence images of multiple plant views are analyzed. A three-dimensional plant localization algorithm is established to accurately determine the position of soybeans in the field, which helps to perform automatic weeding tasks in weeding machines. Under low-illumination conditions, it is difficult to complete the reconstruction task by using the SFM method for the three-dimensional reconstruction of crops. When the input crop image is constrained by illumination, it will produce incorrect spatial point cloud shape estimation, inaccurate camera trajectory, and in some scenes, there is no detection of real features or pseudo-features that cannot be matched with features in other images. Aiming at the accurate phenotypic information of soybean plants obtained by agricultural machinery and equipment in the environment of insufficient illumination, this paper proposes the reconstruction and trait perception of soybean plants under low illumination. With soybean plants as the center, the camera is used to collect the images of soybean plants under low illumination in an orderly manner. Through the EnlightenGAN image enhancement network, the illumination brightness conditions of the soybean plant images are adjusted, and the image noise and color distortion are removed, so as to improve the accuracy of soybean plant feature detection and matching under low illumination and reduce the feature mismatch. The spatial point cloud information and camera pose are obtained by combining the internal and external parameters of the camera. The problem of inaccurate estimation of spatial point cloud shape and inaccurate camera pose caused by illumination constraints is solved. Finally, the SFM algorithm and the PMVS (the patch-based MVS algorithm) [
30] algorithm are used to reconstruct the three-dimensional soybean plant, so as to realize the perception of soybean plant growth environment in low-illumination working environment.
In this paper on low-illumination soybean plant reconstruction and trait perception, the following main contributions are provided:
- (1)
The soybean plant image under low illumination is adjusted by the EnlightenGAN image enhancement network to remove the image noise and color distortion. The enhanced soybean plant image is closer to the actual illumination brightness, and the color is real. It highlights the contour structure, feature points, and boundary information of the soybean plants in the image, which is conducive to the subsequent image analysis and processing such as feature point extraction and matching.
- (2)
The soybean plant image after the illumination brightness enhancement can detect a large number of fine soybean plant feature points, including more abundant and detailed plant information, which solves the problem of the detection of the soybean plant feature points in low illumination environment being less and the corresponding relationship between soybean plants under different perspectives being difficult to establish and the color of the reconstructed point cloud model being singular. A large number of fine soybean plant feature points are matched to optimize the reconstructed soybean plant model.
- (3)
A large number of fine soybean plant feature points can reduce the mismatch of soybean plant feature points and construct a point cloud model close to the actual soybean plant. The recovery of soybean plant phenotypic structure is very excellent, and the texture is rich and colorful. Detailed soybean plant phenotypic analysis is conducive to evaluating soybean plant morphology and traits and accurately sensing soybean plant growth information.
2. Three Dimensional Reconstruction of Soybean Plants under Low Illumination
During the operation of farmland, the complex production environment of a soybean field, the diversity of soybean plants, and how to obtain accurate information on those soybean plants have caused troubles for the operation of agricultural machinery and equipment. Agricultural machinery and equipment can easily cause irreparable damage to soybean plants during the collection of soybean growth information. In addition, the complex and changeable field environment and the diversity of soybean plants make it impossible for agricultural machinery and equipment to monitor the growth status of soybean crops in real time, which increases the difficulty of collecting information on soybean plants. By applying three-dimensional reconstruction technology to the perception process of agricultural machinery and equipment on soybean plants, a three-dimensional model close to the actual soybean plants was constructed to generate fine soybean plant phenotypes, to achieve non-contact collection of more comprehensive and specific accurate information of soybean plants, to quickly and efficiently evaluate the growth status of soybean plants, and to provide accurate information for agricultural machinery and equipment to carry out field soybean plant operations. In the reconstruction of a soybean plant model under low illumination, as shown in
Figure 1, through the EnlightenGAN image enhancement network for the collected multi-view samples of soybean plants under low illumination, the brightness-enhanced soybean plant image is obtained by illumination adjustment. The SIFT (scale-invariant feature transform) [
31] algorithm is used for image feature detection. The feature points are different from other ordinary pixels on the image. It contains more key information needed for three-dimensional reconstruction. The quality of feature point detection directly determines the accuracy of the three-dimensional reconstruction model. The effective and low error rate feature points are used to match the feature points of images from different perspectives. According to the paired matching feature points, the SFM algorithm is used to determine the three-dimensional structure of soybean plants, and the sparse point cloud of soybean plants [
32] is generated. The dense three-dimensional point cloud of soybean plants is restored by the patch-based PMVS algorithm, and a three-dimensional model close to the actual soybean plants is reconstructed.
2.1. Soybean Plant Image Acquisition
The definition of low illumination in this paper is that the illumination of the camera when shooting soybeans makes the output video signal level lower than the specified brightness value of the soybean image, so that the light intensity of the soybean is relatively low and the brightness is relatively dark. In this light condition, the camera can vaguely see the available image of the soybean contour under the condition of a certain degree of darkness, and the illumination is used as the measurement unit of the light brightness. If the brightness value of the soybean image is lower than the minimum illumination of the camera, the amplitude of the output video signal will not reach the specified brightness value of the soybean image. The collected soybean image is dark and it is difficult to distinguish the contour level of the soybean. Even if the method of this paper is used to enhance the brightness of the image to reconstruct the soybean plant, the soybean information is inaccurate and partially missing, so that the three-dimensional model of the soybean plant cannot be reconstructed.
In this paper, the three-dimensional soybean plant model is reconstructed. When collecting the required soybean plant image data set, it is recommended to take the soybean plant grown for about two months as the shooting object. Because the soybean plant structure at this stage is obvious and the contour is clear, it is convenient to compare and analyze before and after the experimental treatment. Moreover, when shooting soybean plants, the three-dimensional model of soybean plants reconstructed by selecting farmland scenes with small plant density and dense plant scenes to evaluate the growth status of the current plants will be affected by adjacent plants. In order to meet the actual application environment, the soybean shooting process was selected in the farmland environment at night, and the environment brightness was set by controlling the input current of the adjustable LED lamp to simulate the soybean growth environment under low illumination. Through the Intel Realsense D435i camera, the multi-view shooting is carried out with the center of the soybean plant to be reconstructed under low illumination. The low-illumination soybean image is collected around the soybean plant in an orderly manner. During the collection process, the soybean is collected as far as possible from the near and far distance perspectives. In this way, a large number of low-illumination soybean plant images collected contain different height information, which is conducive to the accurate reconstruction of soybean plants. When shooting soybean plants, the camera captures an image every 10 degrees per revolution and retains more of the same soybean plant structure in the adjacent image, which is not only beneficial to completing the image stitching of soybean plants, but also makes the soybean plant reconstruction rich in details and reduces the time spent on image matching. A total of 826 multi-view images of soybean plants under low illumination were collected in the experiment. The number of point clouds obtained from each angle should not be less than 10. If the number of point clouds is too small, the images of adjacent frames cannot be matched. The experiment obtained 9166 point clouds of soybean plants. In addition, the experiment carried out data collection under a normal lighting environment, and 796 soybean images were collected. About 3200 point clouds could be obtained from each angle. There were 2,623,616 soybean plant point clouds collected under the normal lighting environment. As shown in
Figure 2, some images under normal light collected in the experiment can clearly observe the fine knot structure and rich texture of the soybean in the image of the soybean plant under normal light as shown below, while the light brightness of the soybean plant image under low light is very low and fuzzy, which makes it difficult to observe the shape and character of the soybean plant, and the captured value information of the soybean plant is very limited. It is not easy to reconstruct a 3D model close to the real soybean plant, which greatly improves the difficulty of environmental perception of the current growth state of soybean plants.
2.2. Low-Illumination Soybean Plant Image Enhancement
When agricultural machinery and equipment are working at night, the collected images of soybean plants under low illumination have the problems of detail loss and insufficient contrast and low-illumination conditions, which greatly affect the visual quality of the images. In order to improve the image quality as much as possible, this paper uses the low-illumination image enhancement network, EnlightenGAN, based on deep learning. Its main function is to improve the brightness of low-illumination soybean plant images, and at the same time retain the effective information of soybean plants to the greatest extent in the enhancement process. The high-brightness pixels will not be overbrightened, and the image noise will be suppressed, thus solving the problem of insufficient illumination conditions. The enhanced image is more prominent in the soybean plant image structure characteristics, which is conducive to the soybean plant image feature detection and image matching and further enhances the effect of three-dimensional reconstruction based on multi-view.
The EnlightenGAN image enhancement network uses an attention-guided U-Net as a generator to guide soybean plant information through a global and local dual discriminator, using self-feature retention losses to guide the training process, as shown in
Figure 3. The generator network is composed of a feature extraction module, an information reconstruction module, and a brightness adaptive module. The feature extraction module mainly extracts image feature information. The information reconstruction module recovers the image information from the extracted image feature map through deconvolution operation. The brightness adaptive module adjusts the illumination brightness freely, so that the enhanced image will not have overexposure or underexposure. In order to improve the global illumination while adaptively enhancing the local area illumination, the global-local structure dual discriminator uses PatchGAN [
33] to identify the normal-illumination image and the enhanced image. The judgment information of the two discriminators will be fed back to the generator to continuously adjust the image enhancement effect, so that the enhanced image and the normal-illumination image cannot be distinguished by the two discriminators, thus completing the adaptive enhancement of the image. The local discriminator randomly cuts five local blocks from the enhanced soybean plant image and the normal-illumination soybean plant image and learns to distinguish them from the normal-illumination image or the enhanced image. The global-local structure can make the local blocks of the enhanced image close to the normal-illumination image, which is the key to avoiding local overexposure or underexposure. The global discriminator uses the relativistic discriminator structure to estimate the probability that the normal-illumination soybean plant image is more realistic than the enhanced soybean plant image, so that the generator synthesizes the enhanced soybean plant image more realistic than the normal-illumination soybean plant image. The generator normalizes the illumination channel of the input RGB image, uses the difference between the elements to generate the self-regularized attention map, adjusts the size of the attention map to extract the multi-level features of different depth layers, retains the rich texture information of the image, and uses the multi-scale context information to synthesize high-quality enhanced images, combined with the discriminator feedback identification information. So that the output image dark area will not be overexposed or underexposed, it effectively removes the noise hidden in the dark area, color distortion and other degradation problems, and adjusts the appropriate lighting conditions to maintain the texture and structure of soybean plants.
2.3. Point Cloud Reconstruction of Soybean Plant
2.3.1. Feature Detection and Matching
With image feature detection and matching as a key part of the three-dimensional reconstruction, the establishment of the corresponding relationship between soybean plant images obtained from different observation angles and the corresponding relationship between images obtained from different perspectives is the key information to generating three-dimensional reconstruction of subsequent point cloud reconstruction. For the soybean plant image feature detection and matching, as shown in
Figure 4: Firstly, building a Gaussian differential pyramid for the input enhanced soybean plant images achieves the multi-scale space construction of soybean plant images. Secondly, the key points of the soybean plant are determined by the detection of extreme points in the scale space of the soybean plant image, and the main direction of feature points is established to generate the feature description vector of the soybean plant and complete the feature matching task of the soybean plant.
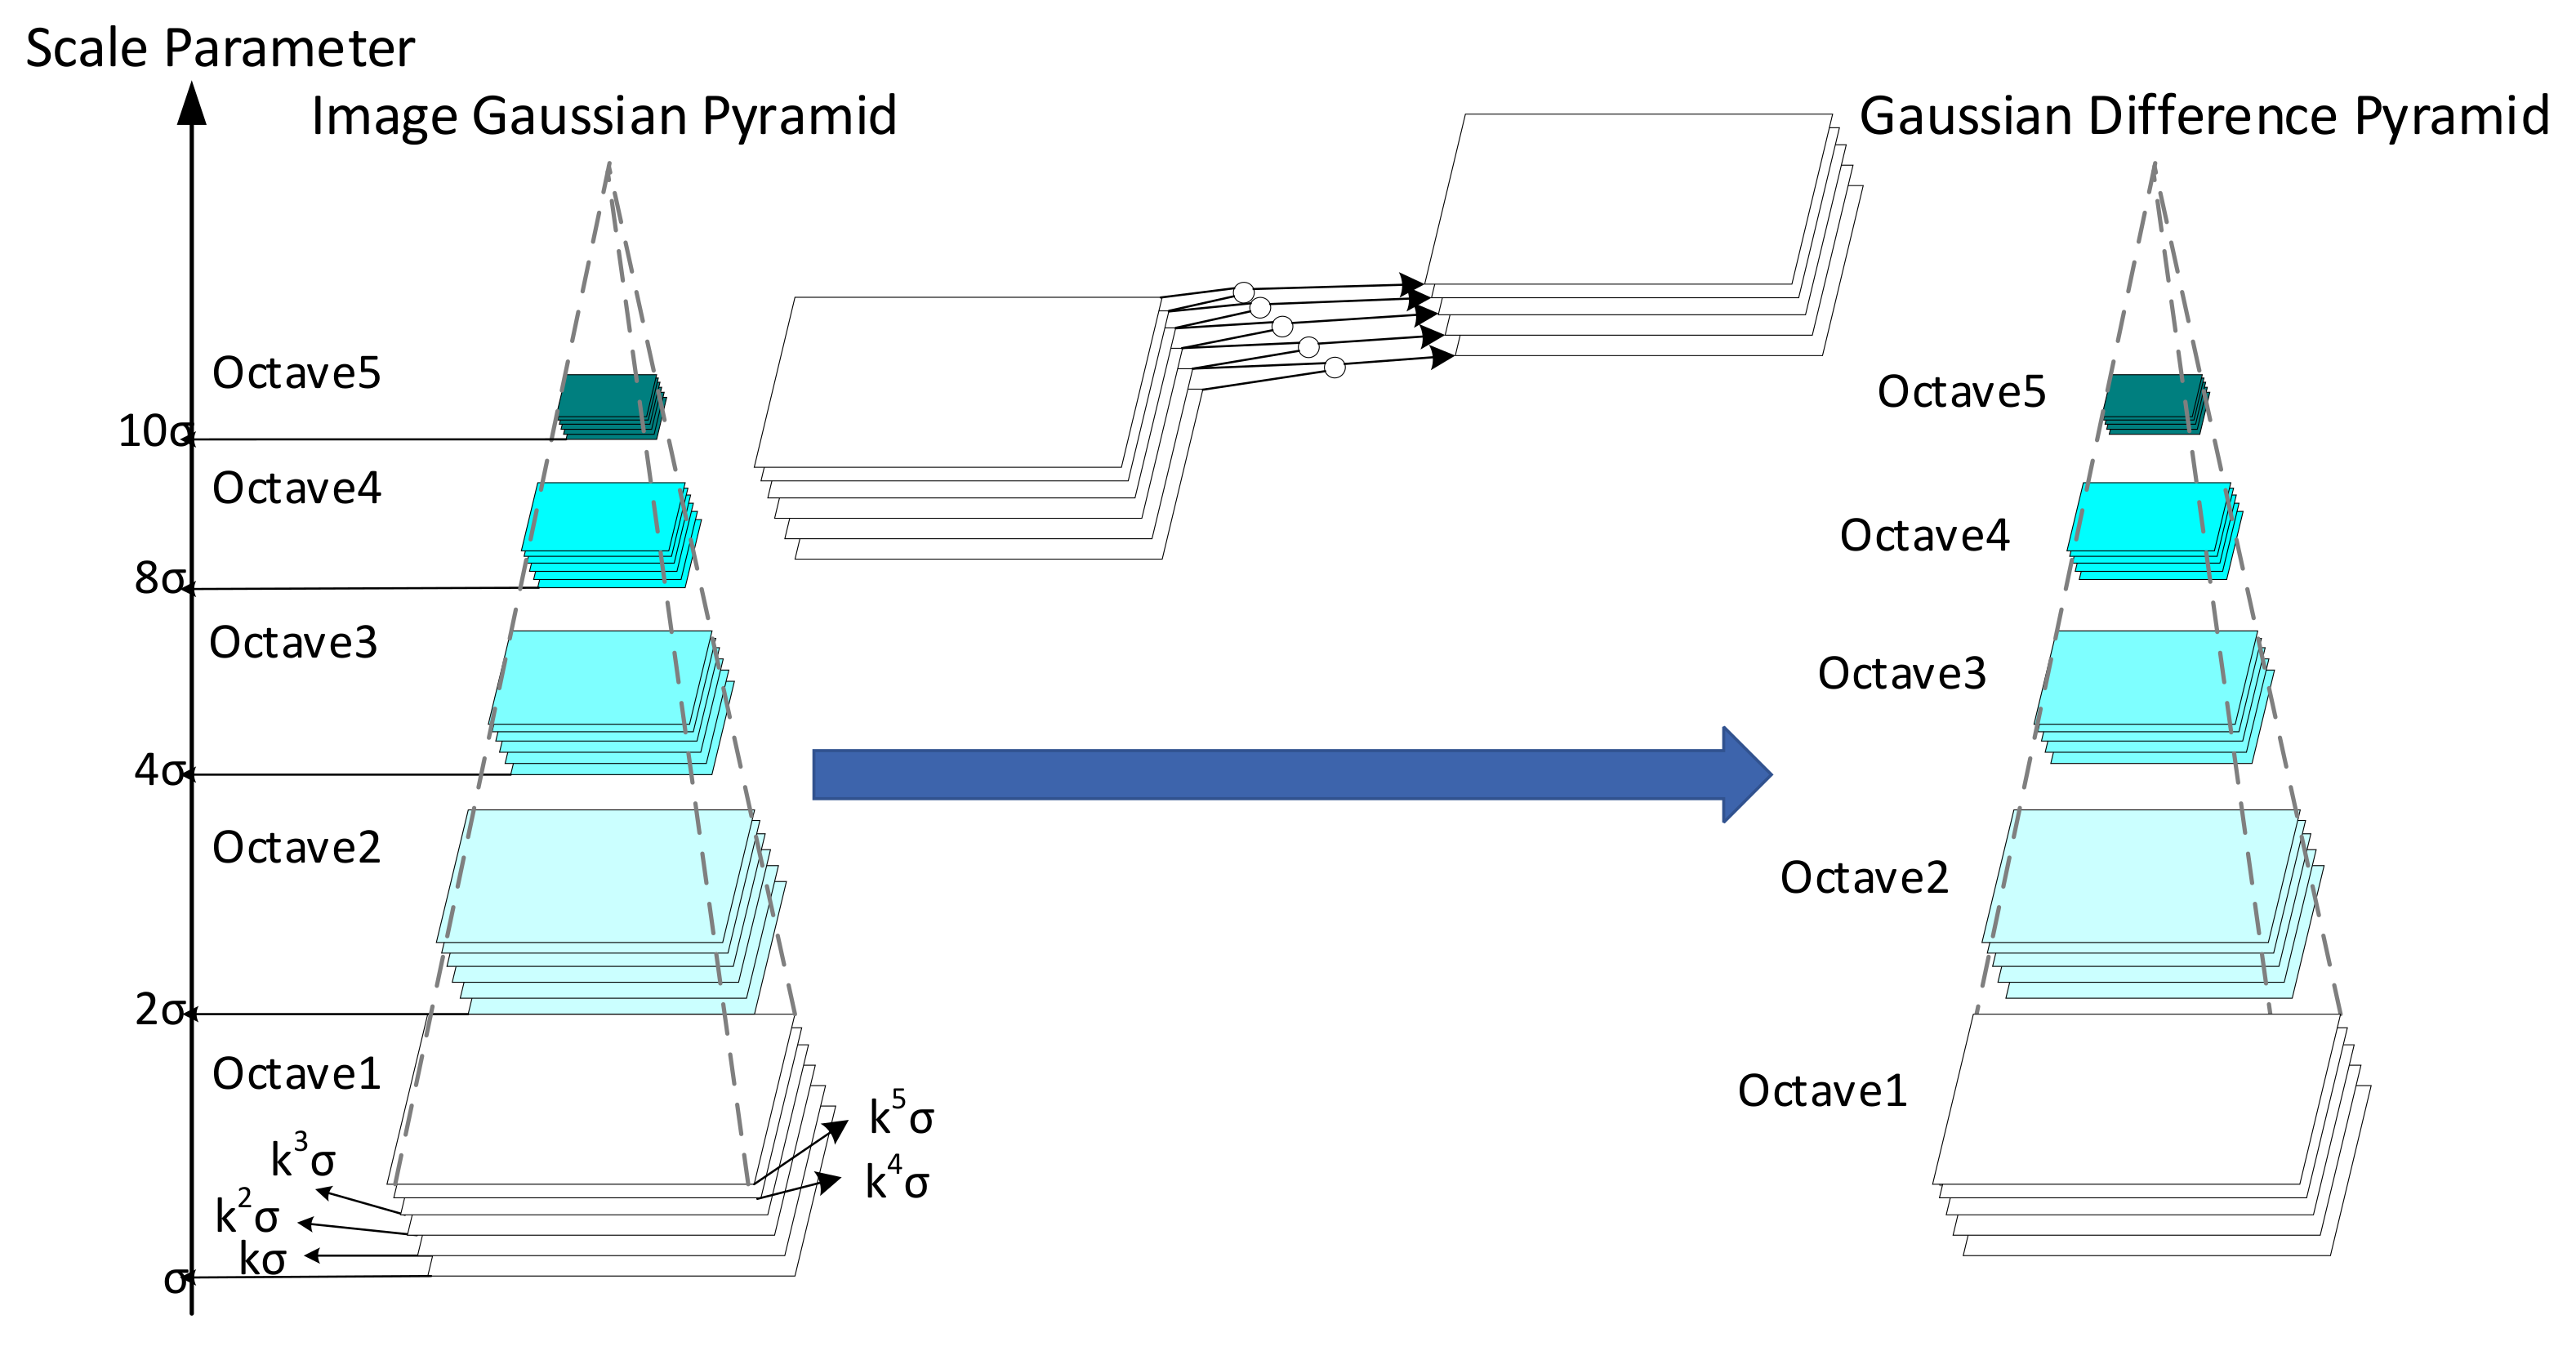
Gaussian difference pyramid is the premise of detecting the extreme points of soybean plant image in the later stage. As shown in
Figure 5, the Gaussian difference pyramid of the soybean plant image is obtained by subtracting the adjacent layers in each group of image sequences in the Gaussian pyramid composed of multiple groups of soybean plant image sequences. Each group of soybean plant image sequences in the Gaussian pyramid is calculated by convolution of the basic image
in the group and the Gaussian function
that changes the scale factor
multiple times. The adjacent layers in the same group of image sequences are subtracted to form the Gaussian difference pyramid convolution
, thus constructing a multi-scale space where
and
is the scale factor of different layers.
denotes a Gaussian function with a scaling factor. Formulas (1)–(3) are:
represents the Gaussian blur coefficient of the corresponding soybean plant image: that is, the scale factor of the corresponding layer, where is the index number of each image sequence group of the Gaussian pyramid; is the scale image layer index number in a set of image sequences; and is the Gaussian blur initial value.
The extreme point detection of the soybean plant scale space is performed by comparing the
value of 26 adjacent points between the adjacent two layers of images in the same group of the points to be detected in the Gaussian difference pyramid; to ensure that the
value of the detection point is the maximum or minimum value of its adjacent points, the detection point is determined to be a key point of the image at this scale, and the feature information coordinates
and scale
of the point are recorded. Through histogram statistics, the gradient amplitude and direction corresponding to the pixels in the neighborhood of the key points of soybean plants are calculated. The cumulative peak of the gradient amplitude is the main direction of the key points, and the corresponding feature point descriptors are generated to make them not change with various changes, to improve the probability of the correct matching of feature points. After screening and normalization, the final soybean plant feature description vector is obtained, in which the gradient amplitude
and direction
calculation Formulas (4) and (5) are:
After the feature description vectors of two soybean plant images are generated, a feature description vector
in one image is taken, and the first two feature description vectors
and
with the closest Euclidean distance in the other image are found, and the distance is
. If the ratio of the nearest distance to the second nearest distance in these two feature points is less than the set proportional threshold
, the nearest distance feature description vector is matched with the feature description vector. The calculation Formulas (6) and (7) are:
A large number of two soybean plant images with arbitrary scale, rotation, and brightness changes are matched. The optimal proportion threshold is set between 0.4 and 0.6. In the process of soybean plant matching, the proportion threshold is set to 0.5. For the matching with high accuracy requirements, the proportion threshold is 0.4; when the number of matching points requires more matching, the ratio threshold is 0.6.
2.3.2. Space Point Cloud Reconstruction
The sparse point cloud of soybean plants can reflect the general morphology and traits of current soybean plants. After observing the surrounding soybean plants, the three-dimensional appearance of the soybean plants is perceived. The point cloud is used to represent the three-dimensional structure of the soybean plants. The camera pose is obtained by the motion recovery structure. A large number of multi-view soybean plant images are used to obtain the sparse point clouds of soybean plants. The multi-view dense matching method based on patch is used to generate the dense point cloud model of soybean plants.
Because the original EXIF (exchangeable image file format) information of the collected images will be lost in the process of image enhancement, it is difficult to determine the camera pose, which seriously affects the effect of reconstructing the three-dimensional model of soybean plants. In this paper, the SFM algorithm is used to restore the three-dimensional point cloud model from multi-view soybean plant images, as shown in
Figure 6. Firstly, the EXIF information of each soybean plant image is extracted, which contains the attribute information and shooting data of each image, so as to obtain the internal reference information of the camera. Secondly, the feature detection and matching of the soybean plant image adjusted by illumination are carried out to obtain the feature point pairs. Combined with the epipolar constraint between the two soybean plant images, the matching pairs are optimized by the algorithm, and the singular value decomposition of the essential matrix is carried out to solve the camera pose and obtain the external reference information. In this process, the distance between the source point cloud set
and the target point cloud set
is minimized by finding a spatial optimal transformation matrix composed of a rotation matrix
and a translation matrix
. The above matching process is iterated continuously to form an image trajectory around the soybean plant. The calculation Formula (8) is:
The angle between the feature points of the same soybean plant is observed from two perspectives, and the position relationship of the point is determined. The three-dimensional coordinates of the feature points of the soybean plant in the world coordinate system are solved. The camera pose and the point cloud of the soybean plant are optimized by bundle adjustment in turn to reduce the difference between the projection and reprojection of the real three-dimensional space points on the image plane. After the bundle adjustment optimization, the accurate camera pose and the three-dimensional coordinates of the soybean plant point cloud are obtained, and the sparse point cloud model of the soybean plant is generated.
Because the sparse point cloud of the soybean plant is different from the real soybean plant in appearance, it cannot fully express the real shape and character of the soybean plant. Therefore, it is necessary to make the sparse point cloud of the soybean plant denser, so that the reconstructed soybean plant model is closer to the actual soybean plant. Through the relevant information provided by the sparse point cloud, the patch-based PMVS algorithm is used to restore the dense point cloud of soybean plants, and the point cloud model of the soybean plants is generated accurately and efficiently. According to the spatial points in the sparse point cloud of soybean plants, the surface slices of the soybean plant model are generated in order of the distance from the point to the camera optical center from near to far, and the neighborhood image set that conforms to its certain constraints is set for each surface slice. The existing surface slices are iterated continuously to generate more slices, and the individual or wrong surface slices are eliminated to generate a dense point cloud model of soybean plants closer to the real soybean plant morphology and traits.
4. Discussion
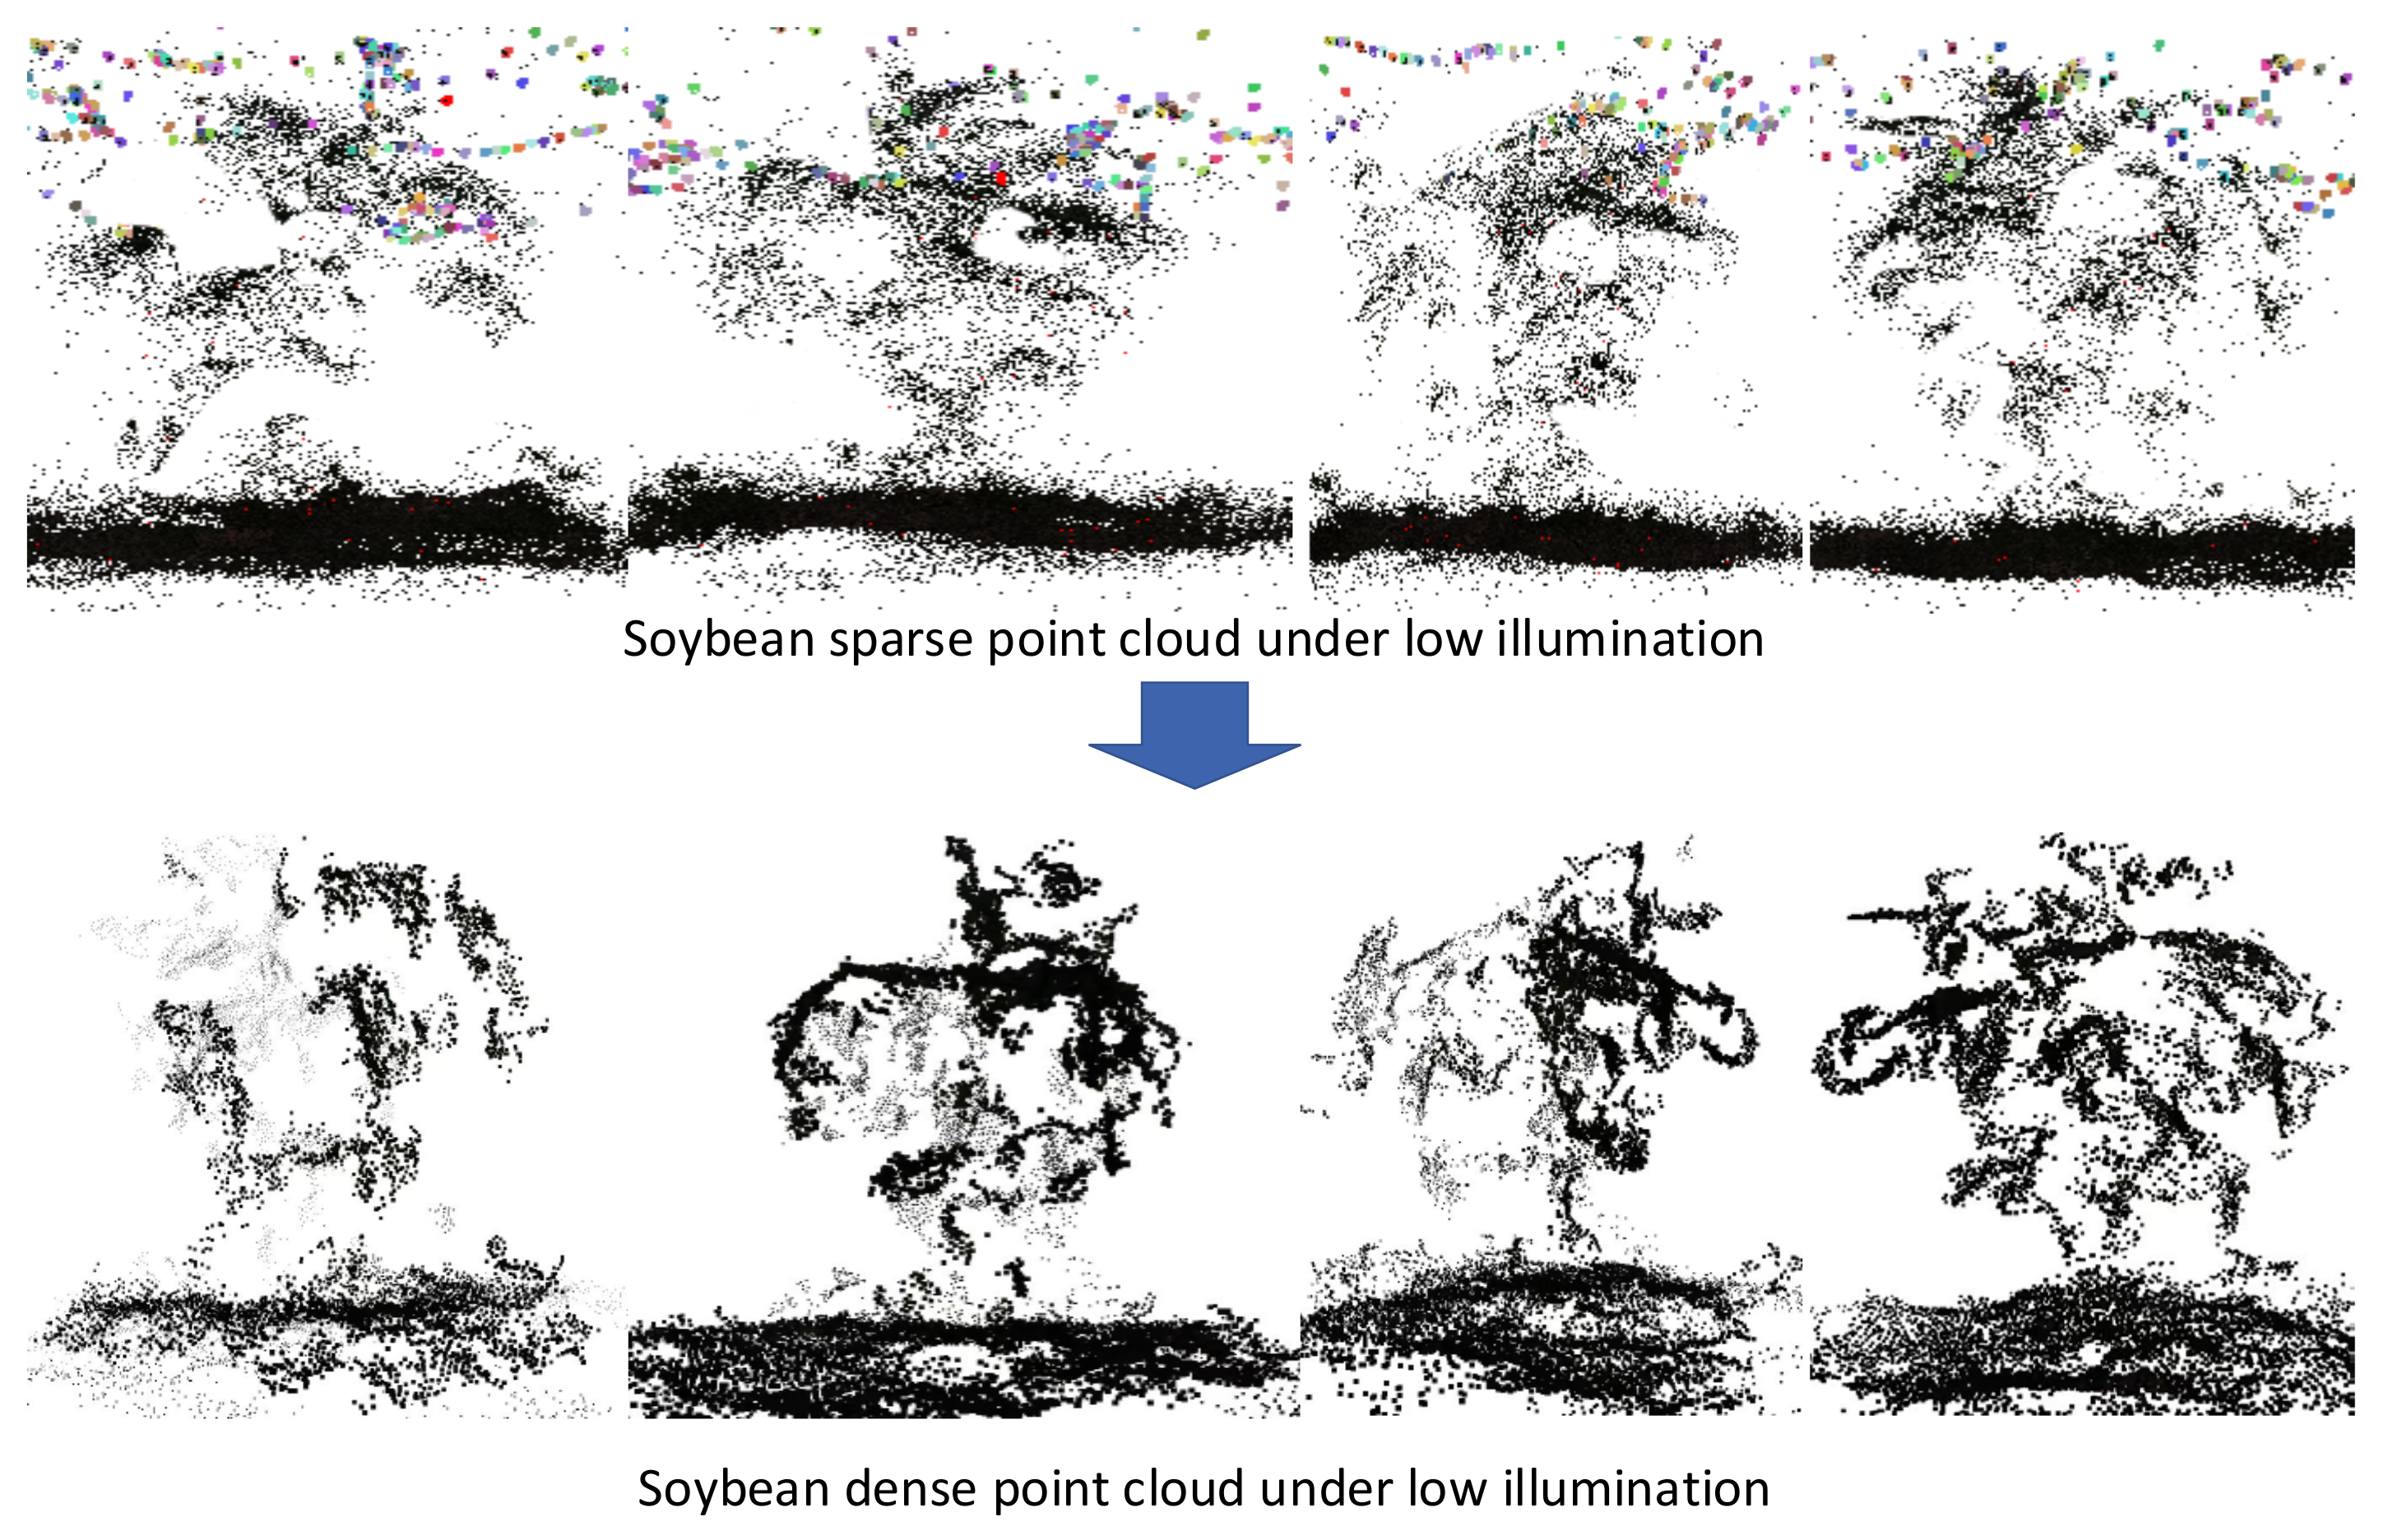
In this study, we performed three-dimensional reconstruction of a soybean plant environment by adjusting the illumination conditions of soybean plant images and compared the impact of the illumination conditions on the reconstruction effect of the soybean plant model. It showed that the adjustment of the appropriate illumination environment brings the reconstructed soybean plant model closer to the real soybean plant, and the reconstructed soybean plant phenotype has the detailed soybean plant current growth morphology and traits. In
Figure 11, it shows the sparse point cloud model reconstructed from the same soybean plant under low illumination and the dense point cloud model of its corresponding view, in which a large number of different color dots constitute the structural characteristics of soybean plants. The sparse point cloud of a soybean plant at low illumination is observed from the sparse point cloud of a soybean plant at low illumination above the image. The generated sparse point clouds of soybean plants contain fewer soybean point clouds. The soybean plant information with limited illumination constraints produces incorrect spatial point cloud estimation and inaccurate camera trajectory. The correct rate of matching between different image features is very low. After surface slicing, a dense point cloud of soybean plants in low illumination is constructed below the image, where it is difficult to observe the general outline of soybean plants. It was found that because the soybean plant image cannot obtain the texture information of the leaves under low illumination, the reconstructed dense point cloud model of the soybean plant is more unable to observe the morphology and traits of the soybean plant, and it is difficult to evaluate the current growth status of the soybean plant.
The experiment conducted the reconstruction of the sparse point cloud model of the same soybean plant and the dense point cloud model of its corresponding view under normal light conditions, as shown in
Figure 12. The soybean sparse point cloud model reconstructed under normal light at the top of the figure can be clearly observed. The rebuilt soybean sparse point cloud model under light can easily see the general outline and growth structure of soybean plants. The model with the dense point cloud of the soybean plant under normal light in the lower part of the figure simulates a model similar to the actual soybean plant in appearance. Additionally, compared with the soybean plant model reconstructed under low illumination, it is obvious that the structure and color of the soybean appearances are diverse, the rich texture surface is also clearly visible, and the characteristics of the soybean plant leaves can be observed in detail.
The illumination environment of the collected soybean plant images is adjusted to generate a sparse point cloud based on the paired matched feature points of the soybean plant, and the dense three-dimensional point cloud of the soybean plant is recovered by surface slicing, as shown in
Figure 13, where the sparse point cloud model reconstructed from the same soybean plant after enhancement and the dense point cloud model from the corresponding perspective are shown. For the sparse point cloud model reconstructed from the multi-view image, due to the increase in the number of feature points that are adjusted for the detection of light brightness and correctly matched, the light-adjusted soybean sparse point cloud reconstructed from the top of the figure is almost the same as the sparse point cloud of soybean plants under normal light, and the contour of the soybean plants can also be observed, and the general characteristics of soybean plants can be seen. The model of the soybean plants with dense point clouds at the bottom of the figure is, in appearance, also very close to the actual soybean plant. In addition, the reconstructed soybean plant model is similar to the soybean plant reconstructed under normal lighting conditions in appearance. It also has a complex and detailed structure, various colors, and rich texture surface. However, it is difficult to extract information from the image under low illumination. The acquired multi-view soybean plant image is subject to light adjustment, which can reduce the noise information of the image to a certain extent. The contour structure, feature points, and boundary information of the soybean plants in the image are more prominent. The distinct three-dimensional model of soybean plant structure information reconstruction makes the differences between the reconstructed soybean plant model and the model reconstructed under normal light small and realizes the perception of soybean plant growth in a low-light environment.
5. Conclusions
In order to acquire data on plant growth in low illumination, we enhanced the 3D reconstruction method often employed for crop trait perception for agricultural equipment. We used the EnlightenGAN image enhancement technique to improve low-light photos of soybean plants and highlight their structural characteristics. After picture detection and alignment, we completed the reconstruction of the sparse and dense point clouds of soybeans to actualize the perception of the current growth conditions of soybean plants by agricultural machinery in low-illumination working contexts, such as at night. Using a motion recovery structure method and a multi-view stereo approach, the reconstruction of soybean sparse point clouds and dense point clouds was completed.
We evaluated the impacts of reconstructing soybeans under low illumination, under normal illumination, and after augmentation. We then showed that our method—in which soybean plants are enhanced when exposed to low illumination—performs better at identifying and matching soybean features. Our approach demonstrates that soybean plants under low illumination can be accurately recreated from models employing a high level of refinement, making them nearly comparable to soybean plants grown under normal lighting conditions. With the help of this technique, we hope to increase the range of applications for crop reconstruction and enhance 3D reconstruction performance under more difficult low-light conditions, allowing us to perceive plant growth even in dim lighting. With this effort, the issue of crop reconstruction in low light has taken a stride in the right direction.


