Article

Red Light Emitting Transition Metal Ion Doped Calcium Antimony Oxide for Plant Growth Lighting Applications

by
Lankamsetty Krishna Bharat
1,2,
Harishkumarreddy Patnam
2,
Alexander Sokolov
1,
Sergey V. Gudkov
1,3,* and
Jae Su Yu
2,*
1
Federal State Budgetary Scientific Institution “Federal Scientific Agroengineering Center VIM”, 1st Institutsky Proezd 5, 109428 Moscow, Russia
2
Department of Electronic Engineering, Institute for Wearable Convergence Electronics, Kyung Hee University, Yongin-si 17104, Republic of Korea
3
Prokhorov General Physics Institute of the Russian Academy of Sciences, Vavilova Str. 38, 119991 Moscow, Russia
*
Authors to whom correspondence should be addressed.
Agriculture 2022, 12(12), 2066; https://doi.org/10.3390/agriculture12122066
Submission received: 20 October 2022 / Revised: 22 November 2022 / Accepted: 25 November 2022 / Published: 1 December 2022
(This article belongs to the Special Issue Engineering Innovations in Agriculture)

Abstract

:
In this work, we synthesized Mn4+-doped CaSb2O6 phosphors using the conventional solid-state reaction method for plant growth lighting applications. The morphological, structural, and optical properties were analyzed based on the results obtained from scanning electron microscope, X-ray diffraction, and spectrophotometer. The results of the spectrophotometer illustrate that the phosphors showed a red emission band in 550–800 nm wavelength range with peak maxima at 642 nm. The red emission in these phosphors is attributed to the 2Eg4A2g transition of Mn4+ ions. The emission intensity is increased with the doping of a charge compensator. The emission range of the phosphor covers the absorption range of photosynthetic pigments such as chlorophyll a, chlorophyll b, phytochrome Pr, and phytochrome Pfr. The results signify that the prepared phosphor materials are suitable candidates for application in plant growth lighting.

1. Introduction

Recently, luminescent materials have been the focus of interest of the research community due to their vast suitability for applications, namely, display, solar cells, biomedical, sensing, etc. [1,2,3]. The benefits of these luminous materials in a variety of applications have prompted scientists to look for new and better materials with enhanced luminescence capabilities [4]. This artificial luminescence is used for plant growth and development in greenhouses [5]. The lighting conditions in plant growth are directly related to the success of the production. Plant lighting demand and energy usage are growing in tandem with the advancement of modern agriculture. Generally, in plant production systems, traditional light sources such as fluorescent lamps, incandescent lamps, and high-pressure sodium lamps are used [6]. However, traditional light sources were primarily designed to support human activities based on the sensitivity of the human eye rather than the absorption spectra of plants. This type of traditional lamp for crop systems suffers from high energy consumption and a serious spectral mismatch between its emitting spectra and the absorption spectra of plants. Hence, light-emitting diodes (LEDs) have become an unavoidable choice in comparison to traditional light sources due to their quick response time, long lifetimes, energy savings, low cost, and reliability [7,8,9]. LED wavelengths can be modified using various phosphors to fit the spectral range of plant photosynthesis and photo morphogenesis, potentially affecting plant growth and development through modulating phytochrome. It is known that light impacts various developmental processes in plants, including seed germination, blooming, fruiting, and other morphogenesis, in addition to being a vital energy source for photosynthesis [10,11]. Blue (400–500 nm), red (620–690 nm), and far-red (700–740 nm) lights are responsible for photosynthesis, phototropism, and photo morphogenesis, respectively [12]. It is important to note that plants’ photoreceptor systems are particularly sensitive to red and far-red light, which are involved in the entire growth process [13,14]. As a result, the spectrum required for plant growth must correspond to that of photosensitive pigments.
Typically, Eu3+- and Eu2+-doped phosphors were reported for red emission. Eu3+-doped materials show sharp and narrow peaks with peak maxima in the wavelength range of 610 to 620 nm, which is considerably far from deep to far-red emission [15,16]. Similarly, Eu2+doped nitride phosphors are also confined due to precise and rigorous synthesis conditions and the high cost of rare-earths [17,18]. To overcome difficulties, transition metal ions such as Cr3+, Mn4+ can be chosen as alternative dopants for plant growth applications [19,20,21]. In this work we studied the optical properties of Mn4+doped CaSb2O6 materials. Mn4+ with a 3d3 electronic configuration generally stabilizes in an octahedron environment in most of the host materials. The optical properties of Mn4+ ions were significantly affected by the crystal field which is stronger in oxide- than in fluoride-based host materials [22]. The Mn4+ doped host materials show a broad excitation band due to the O2−-Mn4+ charge transfer and the 4A2g4T1g, 4A2g2T2g, and 4A2g4T2g transitions. Likewise, the emission is seen in the red region (550–800 nm) due to the 2Eg4A2g transition of the Mn4+ ion [23]. On this account, we can say that the similarity of the red or far-red emission of the Mn4+ doped oxide host materials and the desired spectral range of plants make the Mn4+ doped oxide materials an ideal choice for the LED application of plant growth.
In this context, we prepared an Mn4+doped CaSb2O6 (CSO: Mn4+) sample using the conventional high-temperature solid-state method. The sample was characterized to study the crystal structure, morphology, elemental composition, and luminescence properties. The emission of the CSO: Mn4+ sample was further compared with the absorption spectra of the photosensitive pigments of the plant to portray their use for plant growth LED application. Furthermore, the effect of the charge compensator on the luminescence properties was also studied.

2. Materials and Methods

2.1. Experimental Procedure

The Mn4+doped CaSb2O6 (CSO: Mn4+) phosphors with different concentrations (CaSb2-xO6: xMn4+ (x = 0.25, 0.5, 0.75, 1, 2, and 3 mol %)) were prepared by a conventional solid-state reaction method. All analytical grade chemicals, i.e., calcium carbonate (CaCO3), antimony oxide (Sb2O3), and manganese carbonate (MnCO3) were purchased from Sigma Aldrich Co, Gangnam-gu, Seoul, Korea. Raw materials were used as received without further purification. Initially, the stoichiometric ratios of the desired raw materials were weighed and put in an agate mortar for grinding with the support of the pestle. After homogeneous mixing, the powders were carefully transferred to alumina crucibles and calcined at 1000 °C for 6 h. After the completion of the calcination process, the obtained powders were ground smooth for characterizations.

2.2. Characterizations

The crystal structure of the optimized Mn4+activated CaSb2O6 (CSO: 2Mn4+) phosphor sample was analyzed by X-ray diffraction (XRD) (Mac Science, M18XHF-SRA, Yokohama, Japan) with Cu kα (λ = 1.5406 Å). The morphology of the CSO: 2Mn4+ phosphor sample was studied using a field-emission scanning electron microscope (FE-SEM) (ZEISS, LEO SUPRA 55, Oberkochen, Baden-Württemberg, Germany). The elemental analysis was performed using an energy dispersive X-ray (EDX) spectrometer attached with FE-SEM. The oxidation states of the elements were found using X-ray Photoelectron spectroscopy (XPS) (K-alpha, Thermo electron, Gangnam-gu, Seoul, Korea). The photoluminescence excitation (PLE) and PL emission (PL) properties were investigated using a Sinco FluoroMate FS-2 spectrofluorometer, Gwangju, Korea. The lifetime was measured on a Photon Technology International (PTI) fluorimeter, Kyoto, Japan, which was equipped with a phosphorimeter attachment to the main system along with a 25 watt Xe-flash lamp.

3. Results and Discussion

Figure 1 shows the morphology and composition analysis of the CSO: 2Mn4+ sample. The FE-SEM image shown in Figure 1a depicts that the particles formed were of sub-micrometer size. The particles have irregular shapes with a smooth surface. The elemental analysis of the as-prepared sample was performed using the EDX attachment of FE-SEM. The EDX spectrum of the sample is shown in Figure 1b and contains all elements, i.e., Ca, Sb, O, and Mn. The Ca, O, and Mn occupy K-shell and show peaks at 3.7, 0.52, and 5.9 eV, respectively. Sb and Mn occupy the M-shell and show peaks at 0.73 and 0.64 eV, respectively, and Mn also occupies the K shell with a peak at 5.9 eV. Elemental mapping of a small area is also presented in the figure which shows the elemental distribution in the sample. From Figure 1c–f it can be said that the elements Ca, Sb, O, and Mn were uniformly distributed in the sample. A layered image of all the elements present in the sample for the measured area is shown in the inset of Figure 1b.
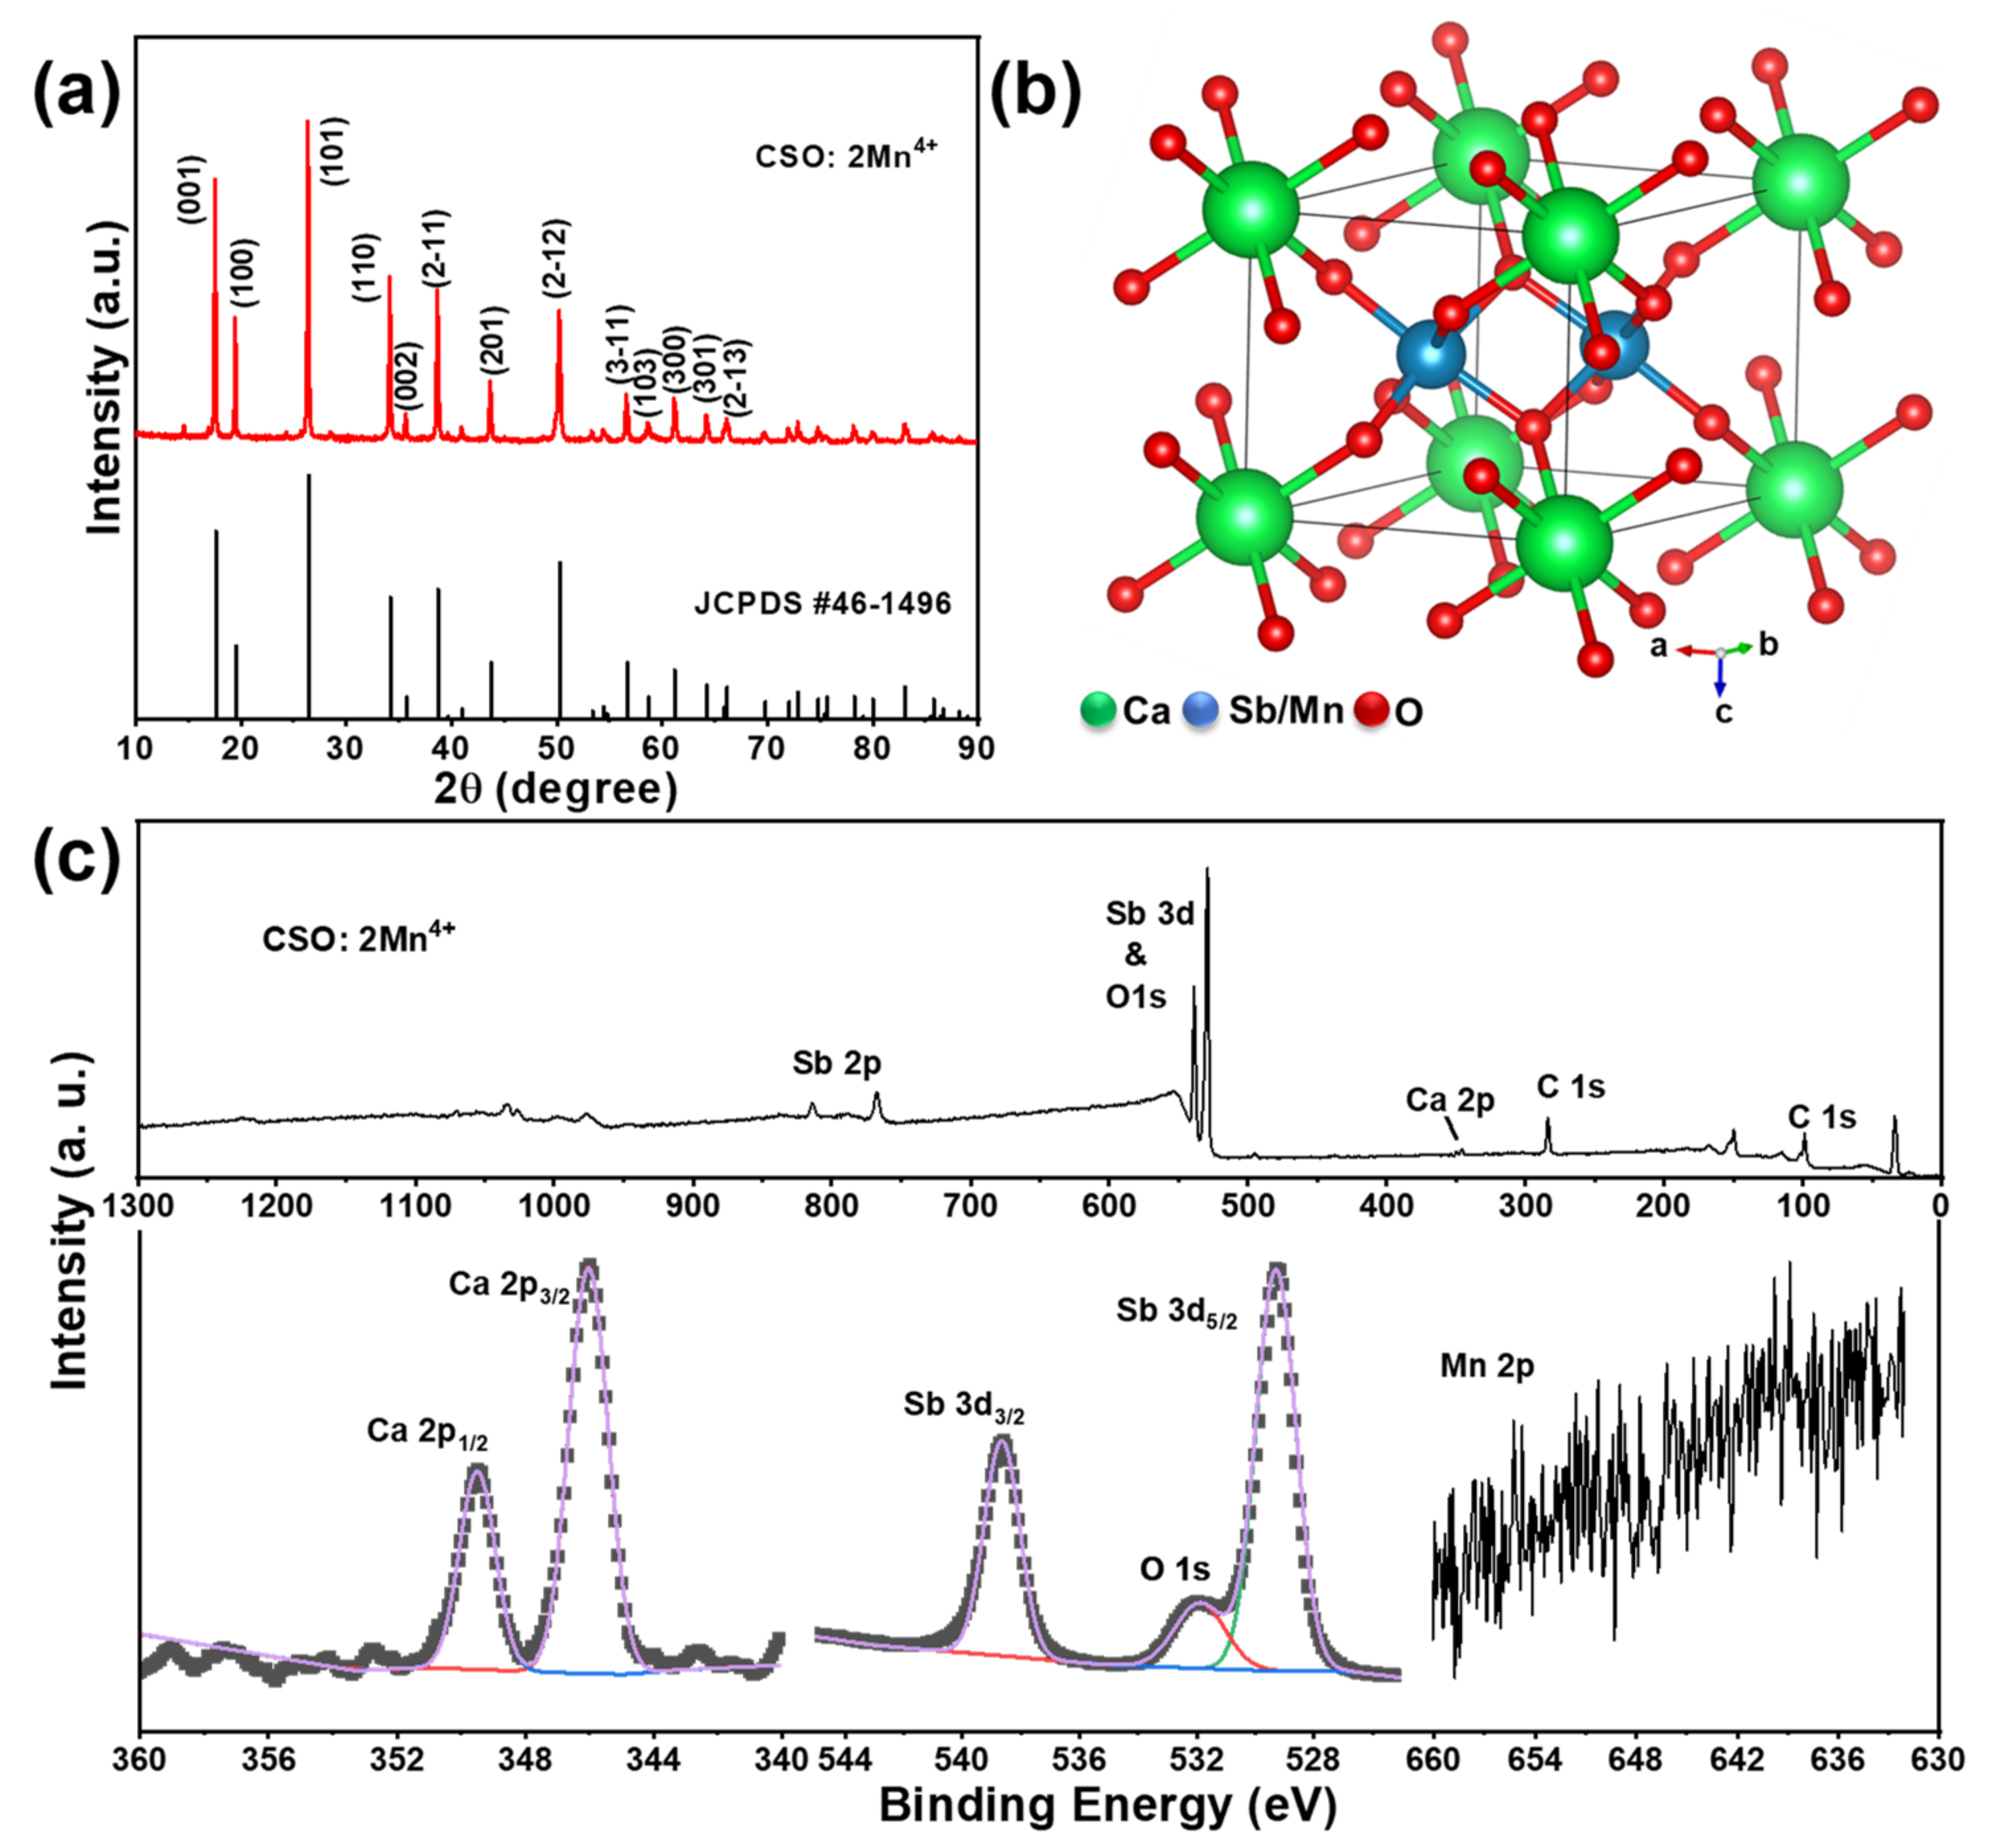
The XRD pattern of the CSO: 2Mn4+ sample is shown in Figure 2a. The XRD pattern shows sharp diffraction peaks with major peaks at 2θ values of 17.62°, 19.53°, 26.44°, 34.17°, 38.71°, and 50.27° which corresponds to (001), (100), (101), (110), (2-11), and (2-12) planes, respectively, with other minor peaks at higher 2θ values. All the diffraction peaks of the sample match well with the standard JCPDS card #46-1496. The results show the sample crystallized in a hexagonal system with a space group of P -3 1 m (162). The lattice parameters of the sample are a = b (Å): 5.24, c (Å): 5.02, and V (Å3): 119.42 [24].
The crystal structure of the sample was drawn using diamond software and is shown in Figure 2b. The crystal structure shown in the figure contains alternating layers of CaO6 octahedra and SbO6 octahedra. Each of the SbO6 octahedra share corners with six CaO6 octahedra, on the other hand, each CaO6 octahedra shares corners with twelve SbO6 octahedra. The length of all Ca–O bonds is 2.43 Å and the lengths of all Sb–O bonds are 2.02 Å. Generally, Mn4+ occupies and stabilizes in an octahedral site with 6-fold coordination [25] but, in this structure, both Ca and Sb form octahedra coordination, but the ionic radio of Ca is 1.00 Å and Sb is 0.6 Å, while it is 0.53 Å for Mn. Usually, the difference of ionic radii between the dopant and the host atom should not be more than 30% which suggests that Mn will be doped in the Sb site rather than the Ca site. The oxidation states of the elements present in CSO: 2Mn4+ sample were studied using the results obtained from XPS. The survey scan spectrum and high resolution Ca 2p, Sb 3d, O 1s, and Mn 2p were shown in Figure 2c. The survey scan spectrum taken in the binding energy range of 0–1300 eV shows peaks of all elements at respective binding energy values. The extrinsic hydrocarbon environment during the XPS measurement results in the visibility of C 1s peak around 280 eV in the survey scan spectrum. High resolution spectrum of Ca 2p shows two peaks at 349.5 and 346.03 which correspond to Ca 2p1/2 and Ca 2p3/2, respectively. Similarly, the high resolution spectrum of Sb 3d shows three peaks at binding energy values of 538.65, 531.89, and 529.3 eV. The peaks at 538.65 and 529.3 correspond to Sb 3d3/2 and Sb 3d5/2, respectively, and the peak at 531.89 eV belongs to O 1s. The high resolution spectrum of Mn 2p in the binding energy range of 660–630 eV shows high noise to signal ratio as the doping concentration of Mn in the host lattice is nominal.
The room temperature photoluminescence excitation (PLE) spectrum of the CSO: 2Mn4+ is shown in Figure 3a.
The PLE spectrum shows broadband ranging from 200 to 400 nm with peak maxima located at 340 nm. The broadband is attributed to the spin-allowed transitions which have large electron-phonon coupling, i.e., 4A2g4T1g and Mn4+-O2- charge transfer. As can be seen from the Gaussian fitting results (Figure 3c), the broad band can be de-convoluted into two peaks, of which the charge transfer band is dominant, which is centered at 305 nm. Weak bands arising from the 4A2g2T2g and 4A2g4T2g electronic transitions are observed in the longer wavelength region (magnified in Figure 3a) and the results are in accordance with previous reports [21,26]. These results confirm that the Mn is in +4 oxidation state in the host material. On the other hand, the photoluminescence (PL) spectrum of the sample is shown in Figure 3b. The Mn4+-doped sample when excited at 340 nm shows a bright far-red emission band ranging from 575 to 800 nm with a peak maximum at 642 nm. The band observed is due to the spin-forbidden 2Eg4A2g electronic transitions in Mn4+ ions. However, the broadband splits into two peaks when fitted with a Gaussian function (Figure 3d) with peak maxima at 636 and 688 nm corresponding to the 4T1g4A2g and 2Eg4A2g electronic transitions, respectively. The results are consistent with the previous reports of Mn-doped oxide materials [26,27,28,29]. To determine the optimal doping concentration of Mn4+ ions, the host sample was doped with different concentrations and the PL spectra was measured. As the concentration of Mn4+ increases, the PL intensity increases and reaches the maximum at a concentration of 2 mol% and then decreases with further increase in concentration (inset of Figure 3b). This observed decrease in concentration is due to the quenching effect caused by the energy migration between neighboring Mn4+ activator ions. There are several reasons for the concentration quenching effect; as the PLE and PL spectra do not overlap, the re-absorption of radiation will not be one among them. So, to further evaluate, the critical distance (Rc) between the two Mn4+ ions was calculated. If the Rc value is less than 5 Å, the exchange interaction is dominant and the multipole-multipole interaction will be dominant if the value is greater than 5 Å. The ionic radii of Sb and Mn are almost similar, and very dilute concentrations were doped into the host lattice. Therefore, this does not affect the volume of the unit cell much, and the critical concentration is Xc = 0.02. The critical distance calculated was found to be 15.6 Å which depicts that the multipole-multipole interaction is dominant in the concentration quenching effect [30,31]. On the other hand, the three-dimensional (3D) spectra of the CSO: 2Mn4+ sample were obtained to confirm the broad excitation and narrow emission of the sample. The contour line and 3D surface plots were shown in Figure 3e. The 3D surface plot was measured in the wavelength range of 400–800 nm for each nanometer excitation wavelength from 200 to 500 nm. From the contour line and 3D surface plots we can say that emission is only observed with lower excitation wavelengths, and at higher excitation wavelengths, i.e., above 380 nm, there is no emission observed. Strong red emission is observed in the excitation wavelengths range of 320–350 nm.
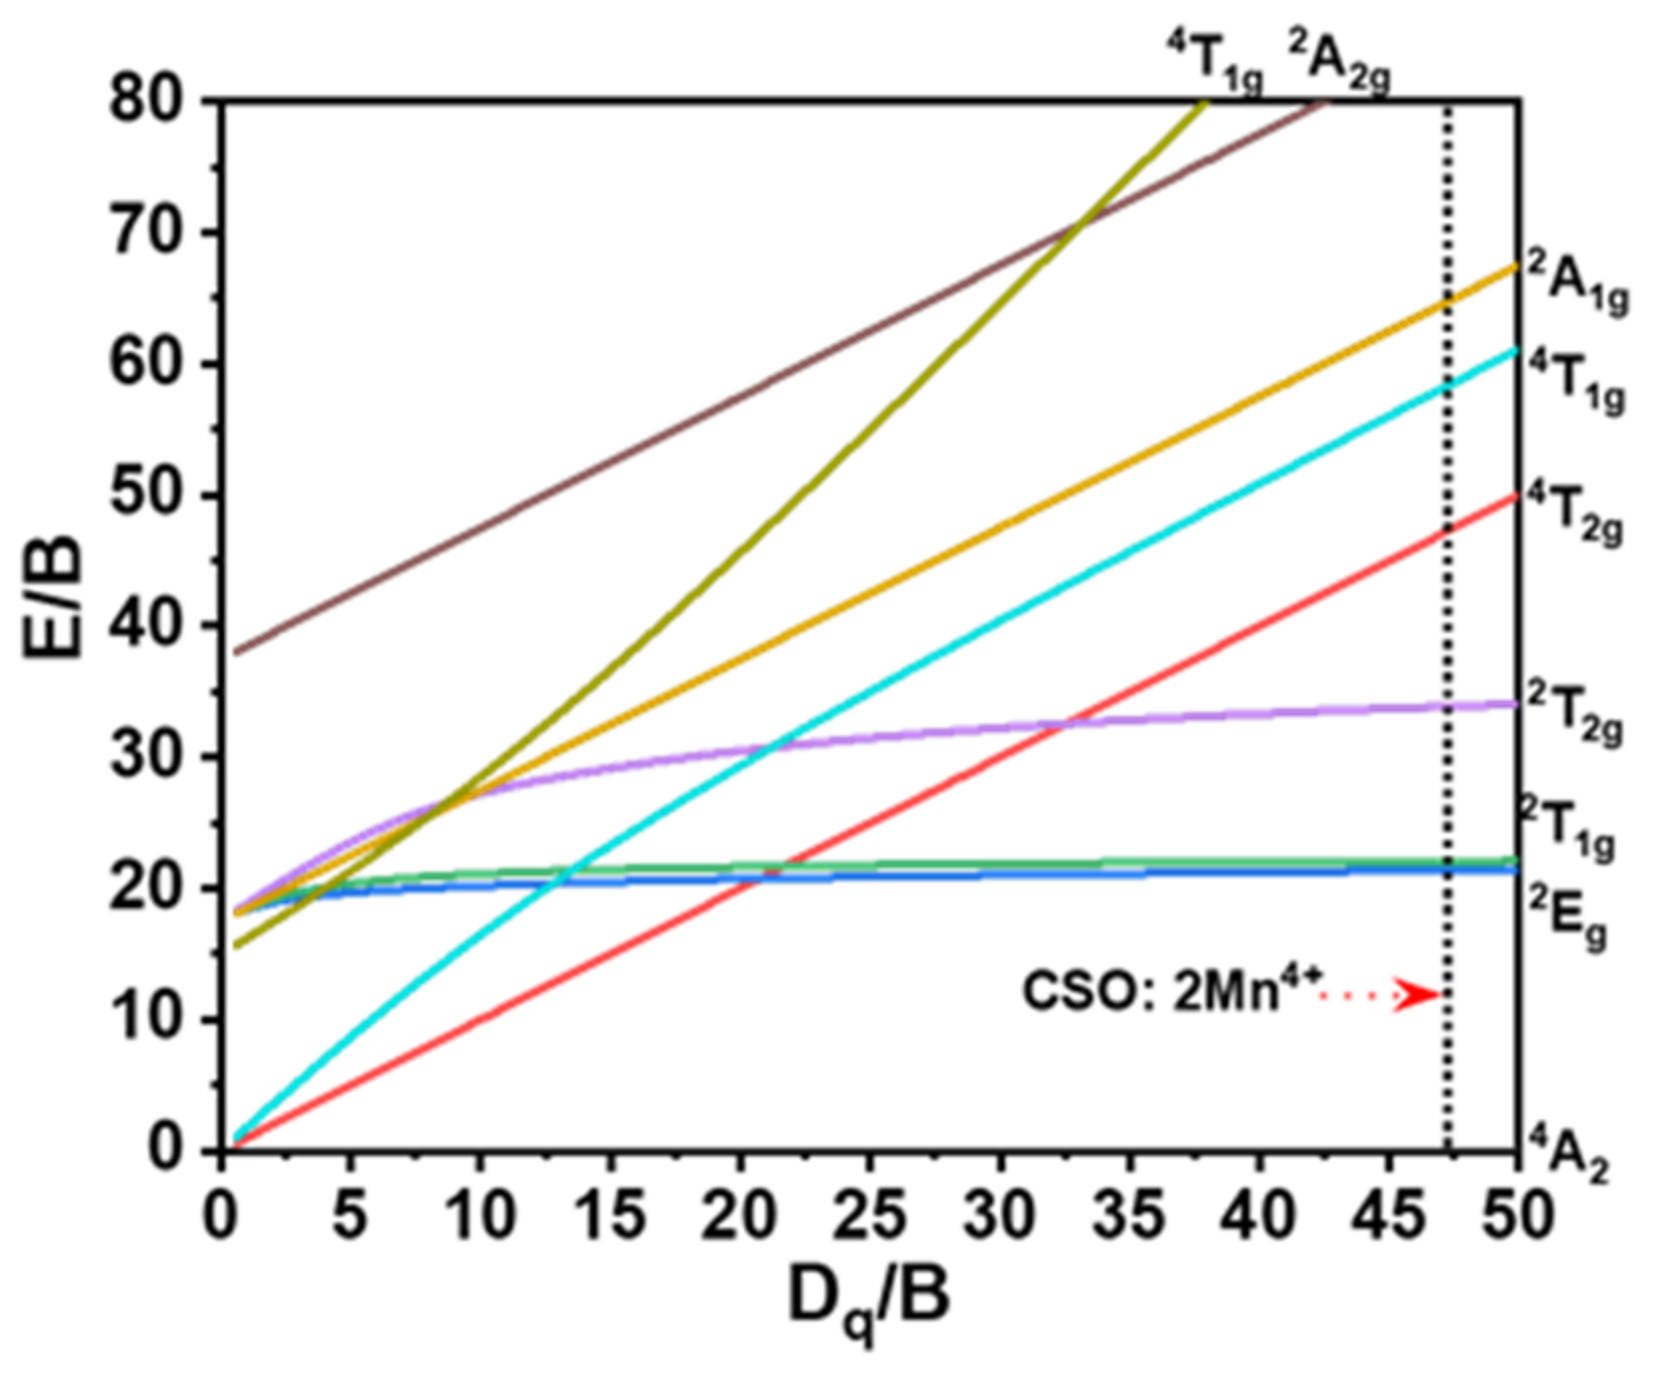
Figure 4 shows the Tanabe-Sugano energy level diagram of Mn4+ which is generally used to examine the luminescence mechanism. In general, the 3d3 electronic configuration of Mn4+ ions make them sensitive to the surrounding crystal field. To explain the effect of the crystal field strength on the PL properties of the CSO: Mn4+ phosphors, the Racah parameters and crystal field strength (Dq) are estimated. The Dq value can be estimated with the support of the 4A2g4T2g peak energy (23,753 cm−1) according to the following calculation:
D q = E A 2 g 4 4 T 2 g 10
Then, the Racah parameter can be evaluated by using the peak energy difference between the 4A2g4T1g and 4A2g4T2g transitions by the following equations:
D q B = 15 x 8 x 2 10 x
x = E A 2 g 4 4 T 1 g E A 2 g 4 4 T 2 g D q
The Racah parameter C can be estimated by the peak energy of the 2Eg4A2g emission transition using
E Eg 2 4 A 2 g B = 3.05 C B 1.8 B D q + 7.9
According to Equations (1)–(4), the values of Dq, B, and C were estimated to be 2375.3, 502.96, and 3525.67 cm−1, respectively. The Dq/B value estimation will decide the presence of Mn4+ in strong or weak crystal filed [32]. The calculated Dq/B was found to be 4.72. The obtained result shows that the Mn4+ ions are placed in a strong crystal field in CSO host lattice. Furthermore, the nephelauxetic ratio (β1) shows a substantial effect on the position of 2Eg energy level in a different host which can be obtained using the equation as shown below:
β 1 = B B o 2 / C C o 2
Bo and Co are the Racah parameters of Mn4+ free-ions, which are 1160 and 4303 cm−1, respectively. The β1 value calculated for CSO: 2Mn4+ was found to be 0.927.
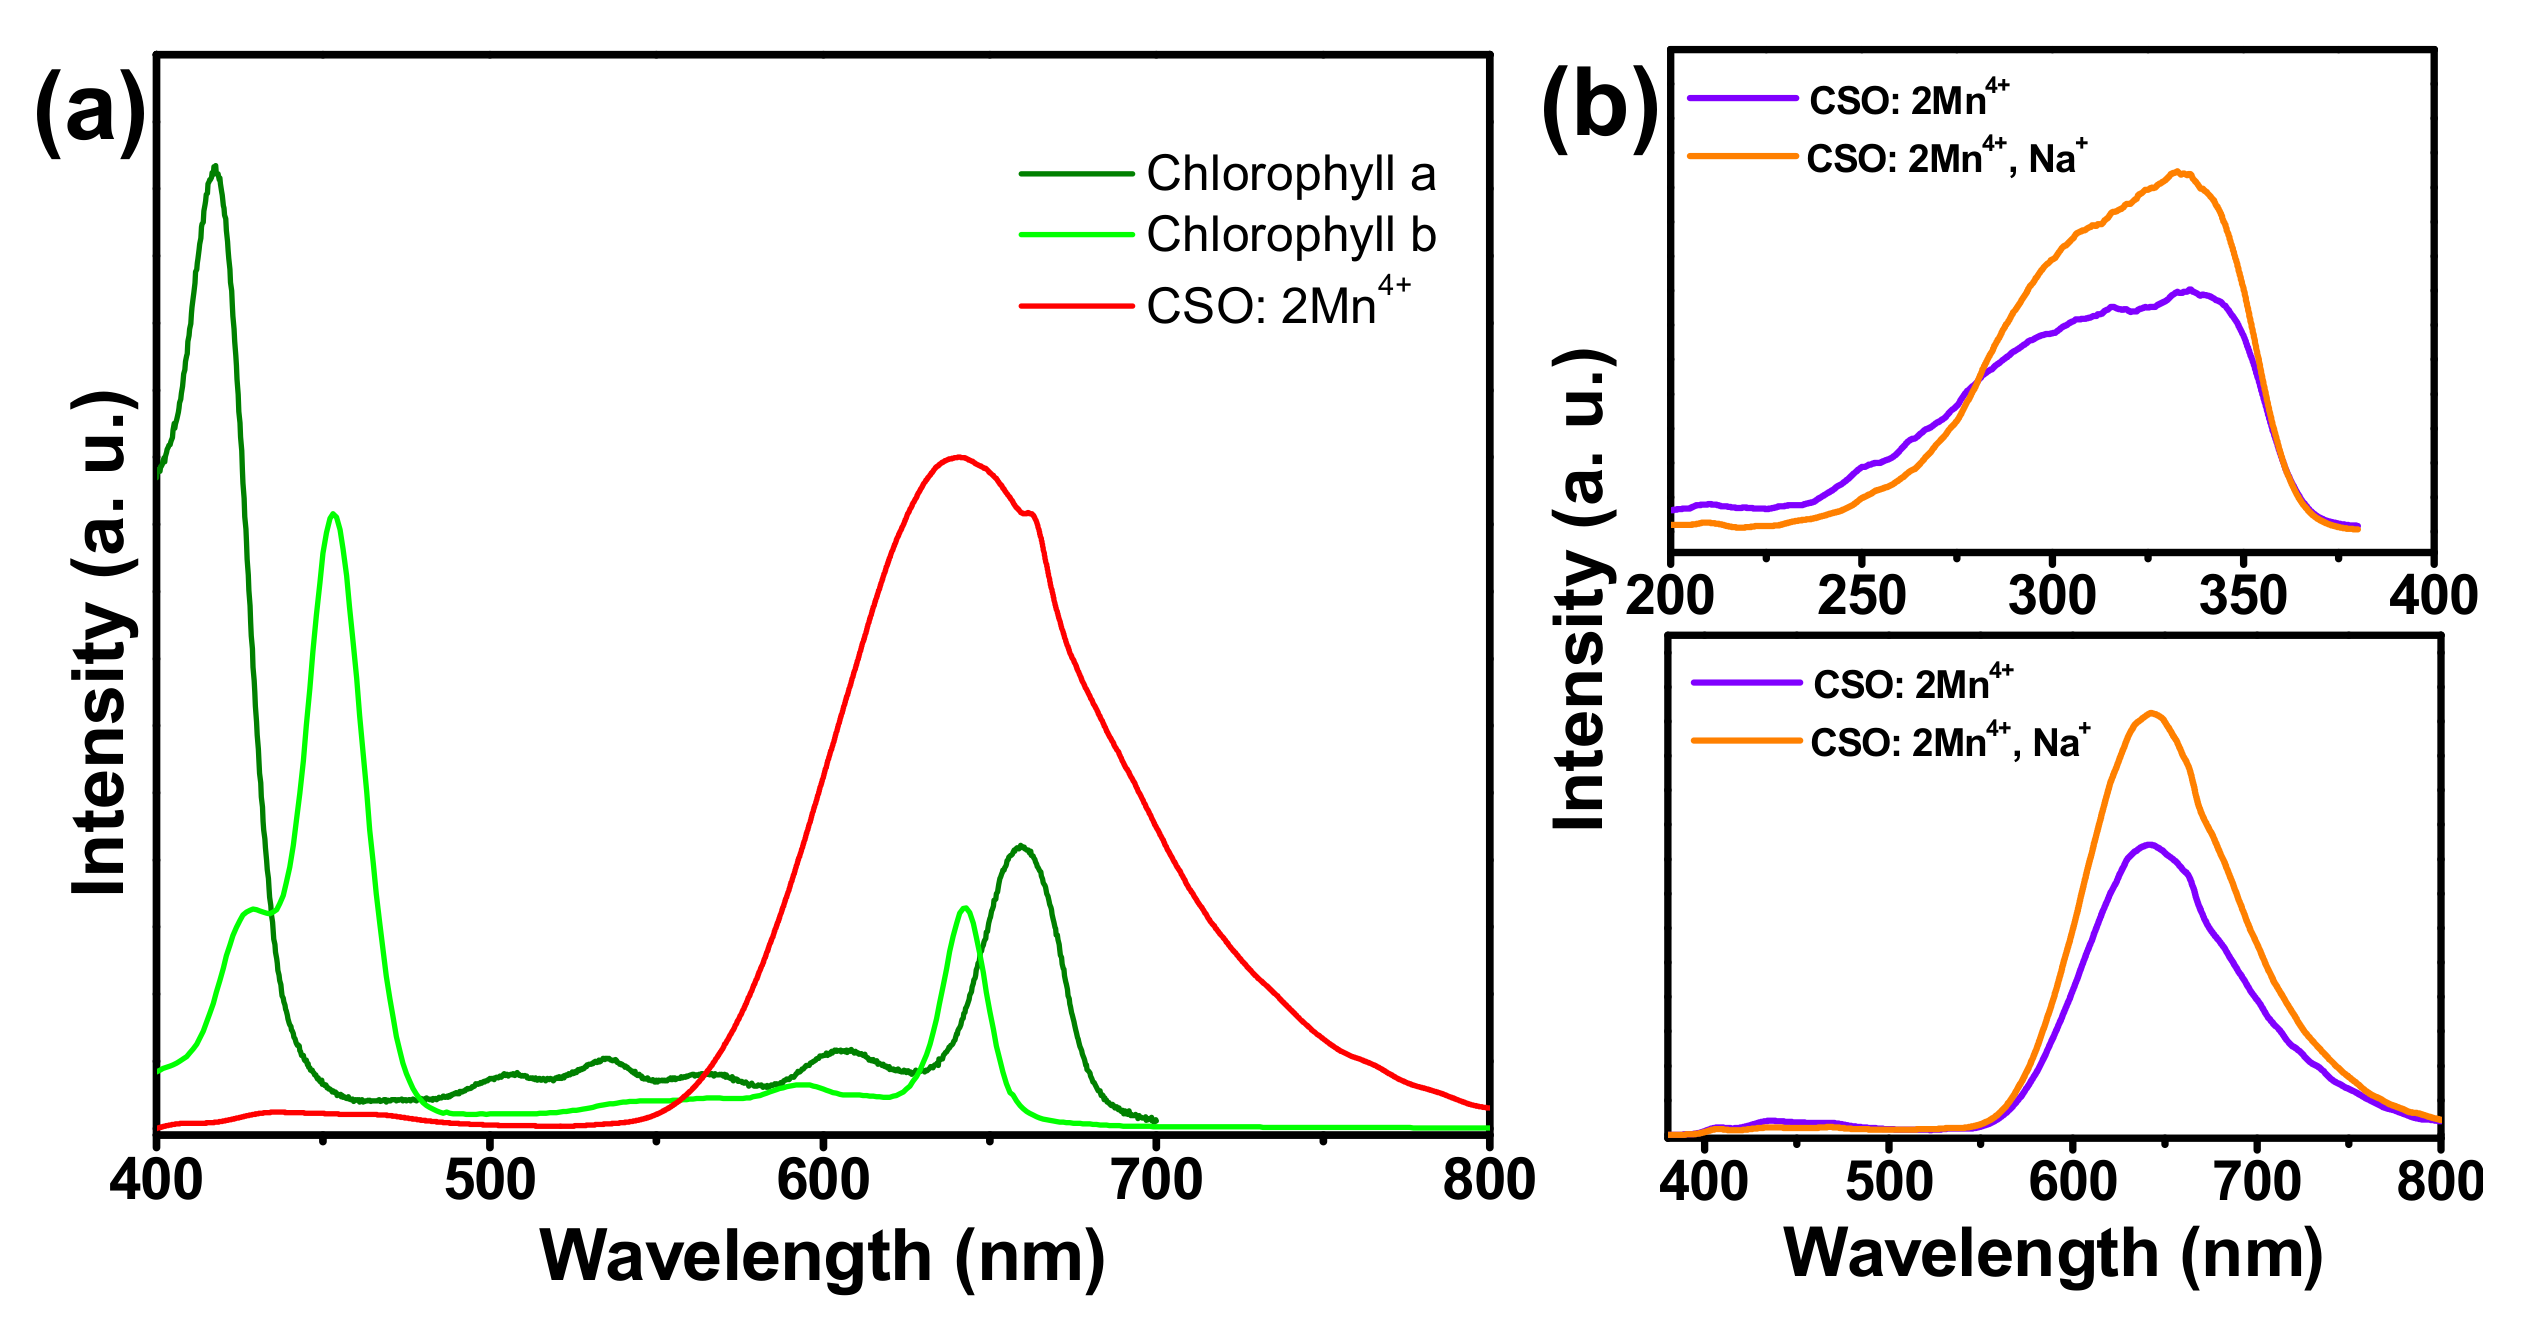
Figure 5 shows the comparison of the emission spectrum of CSO: 2Mn4+ and the absorption spectra of chlorophyll a and chlorophyll b.
When analyzing the figure, we can say that there is a significant overlap between the emission spectrum of CSO: 2Mn4+ and the absorption spectra of chlorophyll a and chlorophyll b in the red region. Generally, chlorophyll is the green pigment of plants that absorbs the incident light and converts it into usable energy through a process called photosynthesis. On the other hand, the emission spectrum also overlaps with the absorption spectra of phytochrome Pr and phytochrome Pfr. Pr is the inactive form and converts to the active Pfr form on the absorption of red light and Pfr converts back to the inactive Pr form on absorption of far-red light or in the absence of light [33]. The results indicate that the CSO: 2Mn4+ sample, which has the potential to produce red light, can tune and accelerate the plant growth cycle and the carbohydrate yield. Furthermore, the effect of a charge compensator on the luminescence property of the CSO: Mn4+ sample was studied by doping Na+ ions in the host lattice. Usually, the ionic radii of the charge compensator should be more than the dopant ion, otherwise the charge compensator easily occupies the Sb site more than the actual dopant ion and decreases the concentration of Mn4+ at the Sb site [34,35]. The ionic radio of Na+ and Mn4+ are 1.02 and 0.53 Å, respectively. So, when Na+ was doped along with Mn4+ ions at the Sb site, an increase in the intensity i.e., both in PL and PLE spectra, was observed.
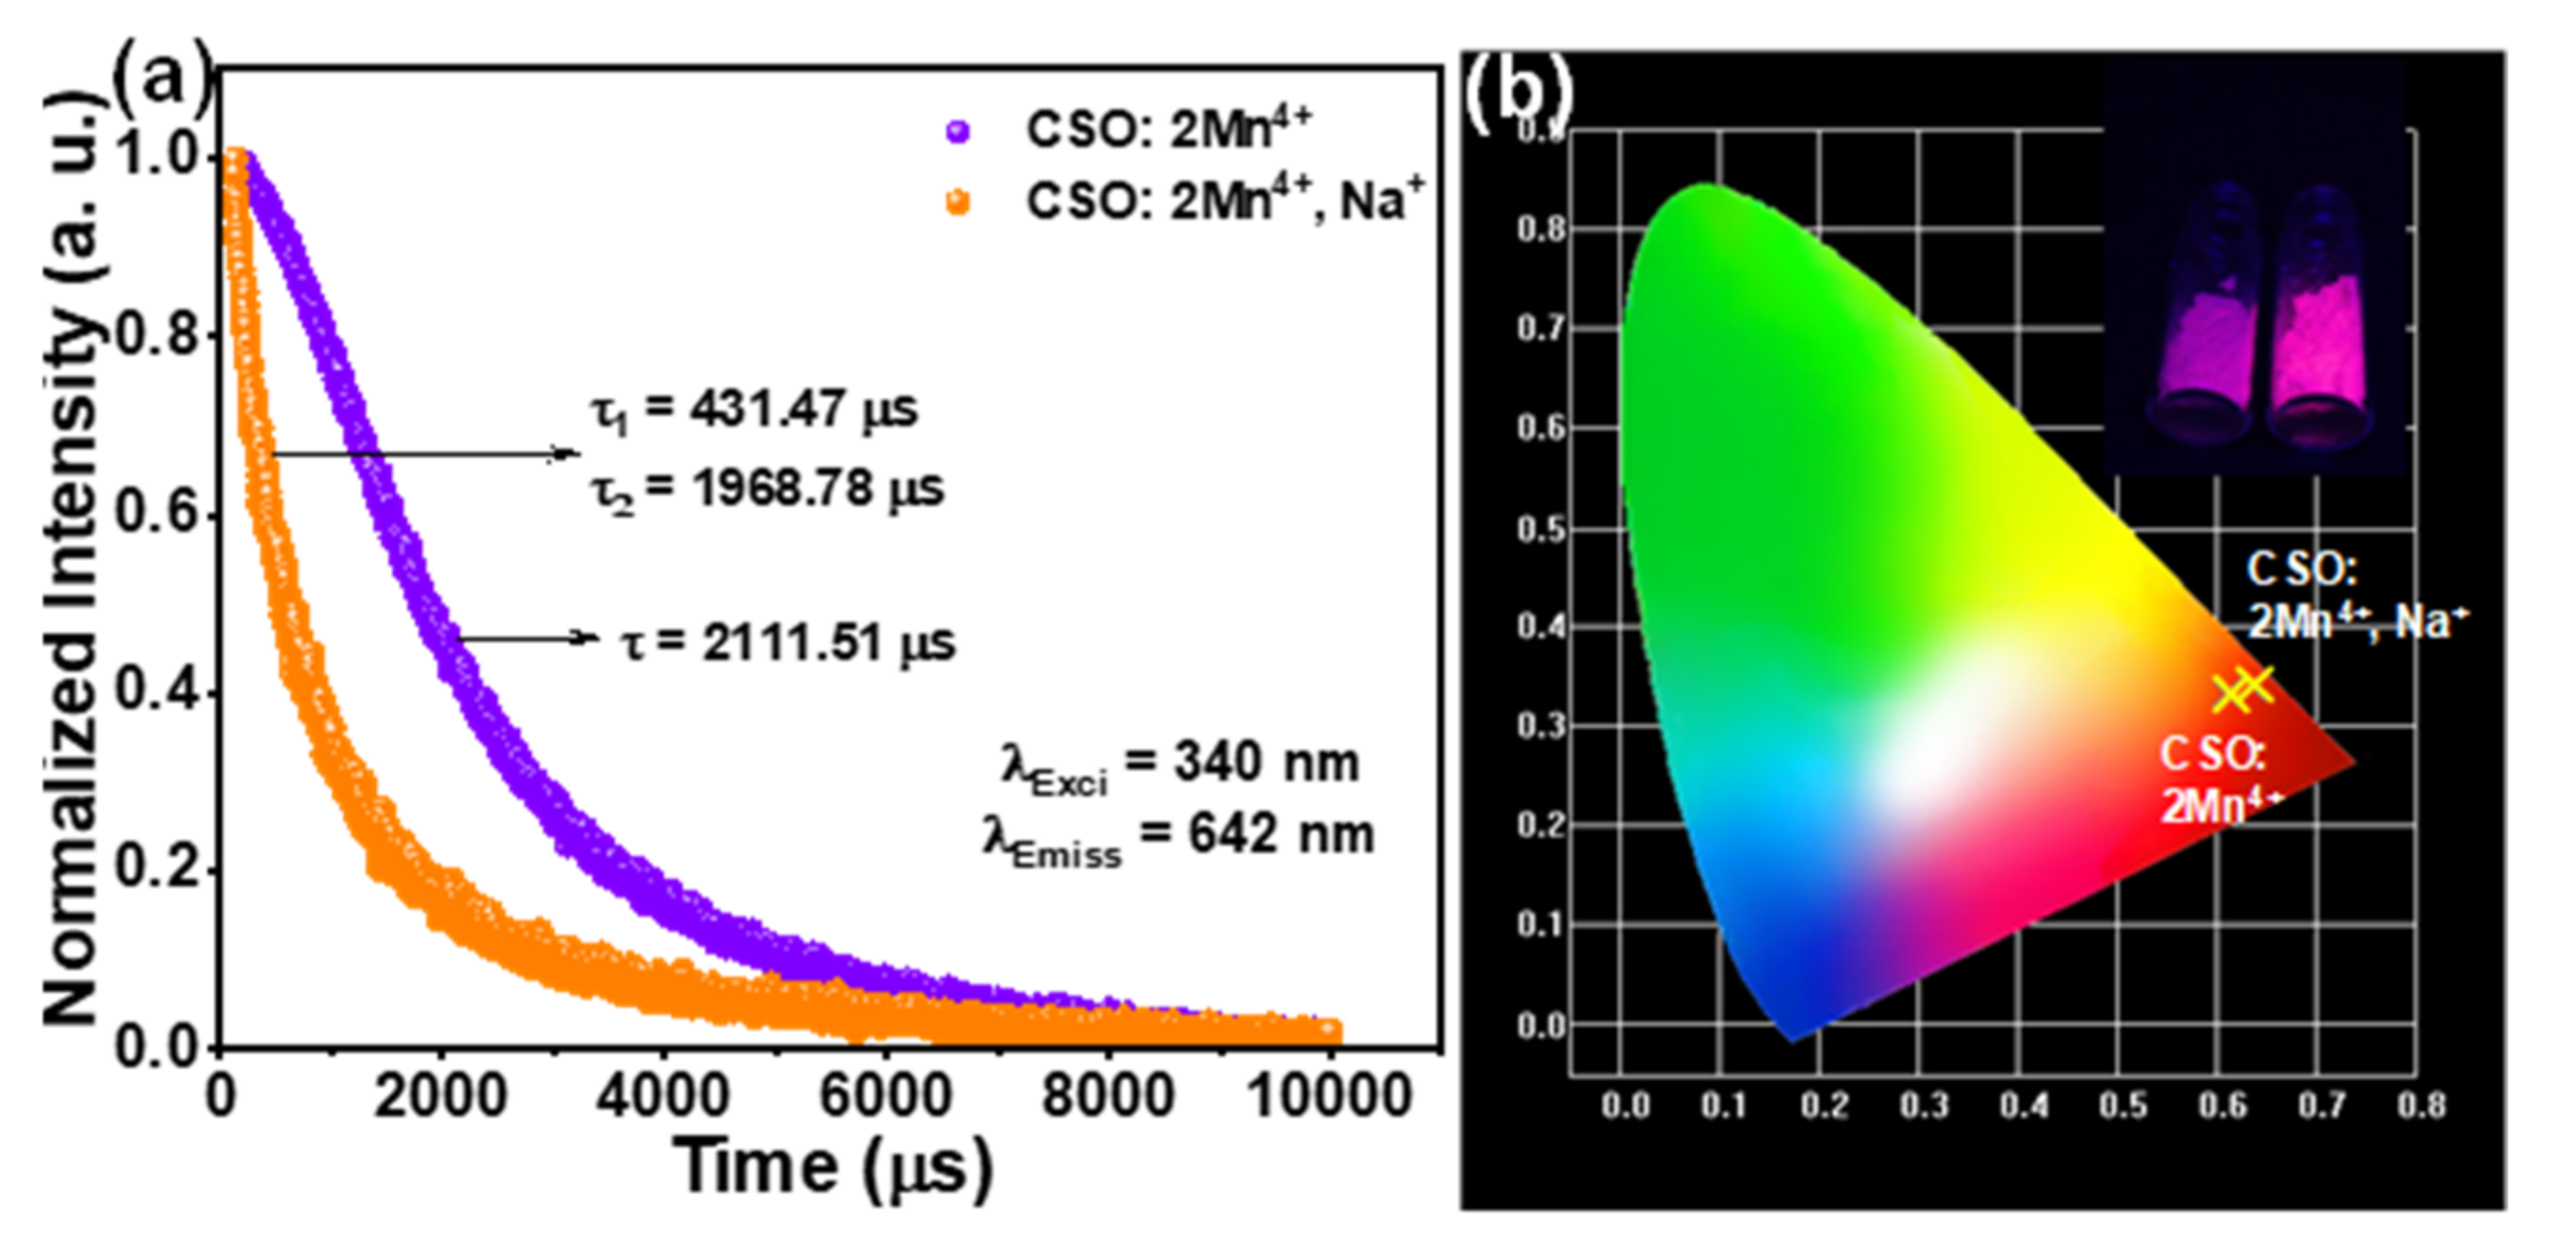
Figure 6a shows the decay profiles of the CSO: 2Mn4+ and CSO: 2Mn4+, Na+ samples for excitation and emission wavelengths of 340 and 642 nm, respectively. The Mn4+ single doped sample best fit with the single exponential function as shown below:
I t = I o + A e t τ
where Io and I(t) are initial luminescence intensity and luminescence intensity at time t, A is fitting constant and τ is decay time. The CSO: 2Mn4+ sample shows a decay time of 2111.51 μs. Similarly, CSO: 2Mn4+, Na+ sample was fitted for a double exponential function as shown below:
I t = I o + A 1 e t τ 1 + A 2 e t τ 2
where A1 and A2 are fitting constants and τ1 and τ2 are short and long decay times. The obtained τ1 and τ2 values are 431.47 and 1968.78 μs, respectively. The short and long life times indicate the presence of Mn4+ ions near and far from the charge compensation defects, respectively [36]. Figure 6b shows the CIE chromaticity diagram where the CIE values were plotted. The CIE values were calculated from the emission data (400–800 nm) of CSO: 2Mn4+ and CSO: 2Mn4+, Na+ samples obtained at the excitation and emission wavelengths of 340 and 642 nm, respectively. The calculated color coordinates for Mn4+ (0.6107, 0.3313) and Mn4+- and Na+- (0.6338, 0.341) doped samples, respectively. The inset of Figure 6b shows photographic images of powder samples under 365 nm ultraviolet light.

4. Conclusions

In summary, the CSO: Mn4+-doped phosphors were prepared using a conventional solid-state reaction method. The powders were characterized using different techniques, and the results were analyzed. The samples crystallized in a hexagonal system with a space group of P -3 1 m (162). The diffraction peaks matched well with the standard values, and no other impurities or peaks related to other phases were observed. SEM and EDX analysis showed that the particles are in the sub-micrometer range and the elements were uniformly distributed throughout the sample. The PLE spectrum displays that the sample can be effectively excited at 340 nm wavelength. The strong red emission centered at 642 nm is mainly due to the spin-forbidden 2Eg4A2g electronic transitions in Mn4+ ions. The optimum doping concentration is found to be 2 mol%, and thereafter concentration quenching was observed, which is due to the multipole-multipole interaction. In addition, a charge compensator (Na+) doping increased the emission intensity by 35%. The emission results match well with the absorption range of chlorophyll a, chlorophyll b, Pr, and Pfr, indicating that the materials are suitable candidates for plant growth LED applications.

Author Contributions

L.K.B., H.P. and J.S.Y. conceived, designed and directed the project. L.K.B. and H.P. synthesized and characterized the phosphor powders. S.V.G. directed the fabrication process and calculations. L.K.B., A.S. and J.S.Y. co-wrote the manuscript. All authors have read and agreed to the published version of the manuscript.

Funding

This work was supported by a grant of the Ministry of Science and Higher Education of the Russian Federation for large scientific projects in priority areas of scientific and technological development (grant number 075-15-2020-774).

Institutional Review Board Statement

Not applicable.

Data Availability Statement

Not applicable.

Conflicts of Interest

The authors declare no conflict of interest.

References

  1. Dubey, V.; Som, S.; Kumar, V. Luminescent Materials in Display and Biomedical Applications; CRC Press: Boca Raton, FL, USA, 2020. [Google Scholar]
  2. Moraitis, P.; Schropp, R.E.I.; van Sark, W.G.J.H.M. Nanoparticles for Luminescent Solar Concentrators—A review. Opt. Mater. 2018, 84, 636–645. [Google Scholar] [CrossRef]
  3. Yu, M.; Yao, X.; Wang, X.; Li, Y.; Li, G. White-Light-Emitting Decoding Sensing for Eight Frequently-Used Antibiotics Based on a Lanthanide Metal-Organic Framework. Polymers 2019, 11, 99. [Google Scholar] [CrossRef] [PubMed] [Green Version]
  4. Zhuo, Y.; Brgoch, J. Opportunities for Next-Generation Luminescent Materials through Artificial Intelligence. J. Phys. Chem. Lett. 2021, 12, 764–772. [Google Scholar] [CrossRef]
  5. Timmermans, G.H.; Hemming, S.; Baeza, E.; van Thoor, E.A.J.; Schenning, A.P.H.J.; Debije, M.G. Advanced Optical Materials for Sunlight Control in Greenhouses. Adv. Opt. Mater. 2020, 8, 2000738. [Google Scholar] [CrossRef]
  6. Runkle, E.S.; Padhye, S.R.; Oh, W.; Getter, K. Replacing incandescent lamps with compact fluorescent lamps may delay flowering. Sci. Hortic. 2012, 143, 56–61. [Google Scholar] [CrossRef]
  7. Olle, M.; Viršile, A. The effects of light-emitting diode lighting on greenhouse plant growth and quality. Agric. Food Sci. 2013, 22, 223–234. [Google Scholar] [CrossRef] [Green Version]
  8. Liu, L.; Keoleian, G.A.; Saitou, K. Replacement policy of residential lighting optimized for cost, energy, and greenhouse gas emissions. Environ. Res. Lett. 2017, 12, 114034. [Google Scholar] [CrossRef]
  9. Singh, D.; Basu, C.; Meinhardt-Wollweber, M.; Roth, B. LEDs for energy efficient greenhouse lighting. Renew. Sustain. Energy Rev. 2015, 49, 139–147. [Google Scholar] [CrossRef] [Green Version]
  10. Bayat, L.; Arab, M.; Aliniaeifard, S.; Seif, M.; Lastochkina, O.; Li, T. Effects of growth under different light spectra on the subsequent high light tolerance in rose plants. AOB Plants 2018, 10, ply052. [Google Scholar] [CrossRef]
  11. Monostori, I.; Heilmann, M.; Kocsy, G.; Rakszegi, M.; Ahres, M.; Altenbach, S.B.; Szalai, G.; Pál, M.; Toldi, D.; Simon-Sarkadi, L.; et al. LED Lighting–Modification of Growth, Metabolism, Yield and Flour Composition in Wheat by Spectral Quality and Intensity. Front. Plant Sci. 2018, 9, 605. [Google Scholar] [CrossRef]
  12. Rajapakse, N.C.; Shahak, Y. Light-Quality Manipulation by Horticulture Industry. In Annual Plant Reviews Volume 30: Light and Plant Development; Blackwell Publishing: Oxford, UK, 2007; pp. 290–312. [Google Scholar]
  13. Kalaitzoglou, P.; van Ieperen, W.; Harbinson, J.; van der Meer, M.; Martinakos, S.; Weerheim, K.; Nicole, C.C.S.; Marcelis, L.F.M. Effects of Continuous or End-of-Day Far-Red Light on Tomato Plant Growth, Morphology, Light Absorption, and Fruit Production. Front. Plant Sci. 2019, 10, 322. [Google Scholar] [CrossRef] [Green Version]
  14. Zheng, L.; Van Labeke, M.-C. Long-Term Effects of Red- and Blue-Light Emitting Diodes on Leaf Anatomy and Photosynthetic Efficiency of Three Ornamental Pot Plants. Front. Plant Sci. 2017, 8, 917. [Google Scholar] [CrossRef] [Green Version]
  15. Pavitra, E.; Raju, G.S.R.; Varaprasad, G.L.; Chodankar, N.R.; Rao, M.V.B.; Rao, N.M.; Park, J.Y.; Han, Y.-K.; Huh, Y.S. Desired warm white light emission from a highly photostable and single-component Gd2TiO5:Dy3+/Eu3+ nanophosphors for indoor illuminations. J. Alloys Compd. 2021, 875, 160019. [Google Scholar] [CrossRef]
  16. Rama Raju, G.S.; Pavitra, E.; Hwang, S.K.; Song, Y.H.; Park, J.Y.; Chodankar, N.R.; Ranjith, K.S.; Huh, Y.S.; Han, Y.-K. Development of dumbbell-shaped La2Si2O7:Eu3+ nanocrystalline phosphors for solid-state lighting applications. Ceram. Int. 2021, 47, 5812–5821. [Google Scholar] [CrossRef]
  17. Piao, X.; Horikawa, T.; Hanzawa, H.; Machida, K.-i. Photoluminescence Properties of Ca2Si5N8:Eu2+ Nitride Phosphor Prepared by Carbothermal Reduction and Nitridation Method. Chem. Lett. 2006, 35, 334–335. [Google Scholar] [CrossRef]
  18. Choi, K.S.; Jee, S.D.; Lee, J.P.; Kim, C.H. A Novel Synthetic Method of Sr2Si5N8:Eu2+ from SrSi2O2N2:Eu2+ by Carbo-Thermal Reduction and Nitridation. J. Nanosci. Nanotechnol. 2013, 13, 1867–1870. [Google Scholar] [CrossRef]
  19. Adachi, S. Review—Photoluminescence Properties of Cr3+-Activated Oxide Phosphors. ECS J. Solid State Sci. Technol. 2021, 10, 026001. [Google Scholar] [CrossRef]
  20. Van Quang, N.; Thi Huyen, N.; Tu, N.; Quang Trung, D.; Duc Anh, D.; Tran, M.T.; Hung, N.D.; Viet, D.X.; Huy, P.T. A high quantum efficiency plant growth LED by using a deep-red-emitting α-Al2O3:Cr3+ phosphor. Dalton Trans. 2021, 50, 12570–12582. [Google Scholar] [CrossRef] [PubMed]
  21. Huyen, N.T.; Tu, N.; Quang, N.V.; Quang Trung, D.; Tran, M.T.; Du, N.V.; Hung, N.D.; Viet, D.X.; Trung Kien, N.D.; Huy, P.T. Excellent Quantum Efficiency and Superior Color Purity Red-Emitting CaAl12O19–CaAl4O7–MgAl2O4:Mn4+ Phosphors for Plant Growth and High Color Rendering Index White Light-Emitting Diode Applications. ACS Appl. Electron. Mater. 2022, 4, 4322–4331. [Google Scholar] [CrossRef]
  22. Senden, T.; van Dijk-Moes, R.J.A.; Meijerink, A. Quenching of the red Mn4+ luminescence in Mn4+-doped fluoride LED phosphors. Light Sci. Appl. 2018, 7, 8. [Google Scholar] [CrossRef]
  23. Pavitra, E.; Raju, G.S.R.; Park, J.Y.; Hussain, S.K.; Chodankar, N.R.; Rao, G.M.; Han, Y.-K.; Huh, Y.S. An efficient far-red emitting Ba2LaNbO6:Mn4+ nanophosphor for forensic latent fingerprint detection and horticulture lighting applications. Ceram. Int. 2020, 46, 9802–9809. [Google Scholar] [CrossRef]
  24. Cao, R.; Fu, T.; Cao, Y.; Jiang, S.; Gou, Q.; Chen, Z.; Liu, P. Tunable emission, energy transfer, and charge compensation in the CaSb2O6:Eu3+, Bi3+ phosphor. J. Mater. Sci. Mater. Electron. 2016, 27, 3514–3519. [Google Scholar] [CrossRef]
  25. Li, P.; Peng, M.; Yin, X.; Ma, Z.; Dong, G.; Zhang, Q.; Qiu, J. Temperature dependent red luminescence from a distorted Mn4+ site in CaAl4O7:Mn4+. Opt. Express 2013, 21, 18943–18948. [Google Scholar] [CrossRef] [PubMed]
  26. Amarasinghe, D.K.; Rabuffetti, F.A. Bandshift Luminescence Thermometry Using Mn4+:Na4Mg(WO4)3 Phosphors. Chem. Mater. 2019, 31, 10197–10204. [Google Scholar] [CrossRef]
  27. Brik, M.G.; Pan, Y.X.; Liu, G.K. Spectroscopic and crystal field analysis of absorption and photoluminescence properties of red phosphor CaAl12O19:Mn4+ modified by MgO. J. Alloys Compd. 2011, 509, 1452–1456. [Google Scholar] [CrossRef]
  28. Medić, M.M.; Brik, M.G.; Dražić, G.; Antić, Ž.M.; Lojpur, V.M.; Dramićanin, M.D. Deep-Red Emitting Mn4+ Doped Mg2TiO4 Nanoparticles. J. Phys. Chem. C 2015, 119, 724–730. [Google Scholar] [CrossRef]
  29. Hu, J.; Huang, T.; Zhang, Y.; Lu, B.; Ye, H.; Chen, B.; Xia, H.; Ji, C. Enhanced deep-red emission from Mn4+/Mg2+ co-doped CaGdAlO4 phosphors for plant cultivation. Dalton Trans. 2019, 48, 2455–2466. [Google Scholar] [CrossRef]
  30. Sun, Z.; Lu, B.; Ren, G.; Chen, H. Synthesis of Green-Emitting Gd2O2S:Pr3+ Phosphor Nanoparticles and Fabrication of Translucent Gd2O2S:Pr3+ Scintillation Ceramics. Nanomaterials 2020, 10, 1639. [Google Scholar] [CrossRef]
  31. Zhao, J.; Gao, H.; Xu, H.; Zhao, Z.; Bu, H.; Cao, X.; He, L.; Yang, Z.; Sun, J. Structure and photoluminescence of Eu3+ doped Sr2InTaO6 red phosphor with high color purity. RSC Adv. 2021, 11, 8282–8289. [Google Scholar] [CrossRef]
  32. Zhou, Q.; Dolgov, L.; Srivastava, A.M.; Zhou, L.; Wang, Z.; Shi, J.; Dramićanin, M.D.; Brik, M.G.; Wu, M. Mn2+ and Mn4+ red phosphors: Synthesis, luminescence and applications in WLEDs. A review. J. Mater. Chem. C 2018, 6, 2652–2671. [Google Scholar] [CrossRef]
  33. Haiyang, W.; Xing Wang, D. Phytochrome Signaling Mechanism. Arab. Book 2002, 2004. [Google Scholar] [CrossRef] [Green Version]
  34. Shi, Y.; Wang, Y.; Wen, Y.; Zhao, Z.; Liu, B.; Yang, Z. Tunable luminescence Y3Al5O12:0.06Ce3+, xMn2+ phosphors with different charge compensators for warm white light emitting diodes. Opt. Express 2012, 20, 21656–21664. [Google Scholar] [CrossRef] [PubMed]
  35. Zhang, H.; Fan, G.; Ruan, F. Charge compensating effect of alkali metal ions R+ (R = Li, Na, K) on the luminescence enhancement of CaAl11.9P0.1O19.1:Mn4+ red-emitting phosphor. Inorg. Chem. Commun. 2021, 132, 108860. [Google Scholar] [CrossRef]
  36. Gupta, S.K.; Sudarshan, K.; Yadav, A.K.; Gupta, R.; Bhattacharyya, D.; Jha, S.N.; Kadam, R.M. Deciphering the Role of Charge Compensator in Optical Properties of SrWO4:Eu3+:A (A = Li+, Na+, K+): Spectroscopic Insight Using Photoluminescence, Positron Annihilation, and X-ray Absorption. Inorg. Chem. 2018, 57, 821–832. [Google Scholar] [CrossRef]
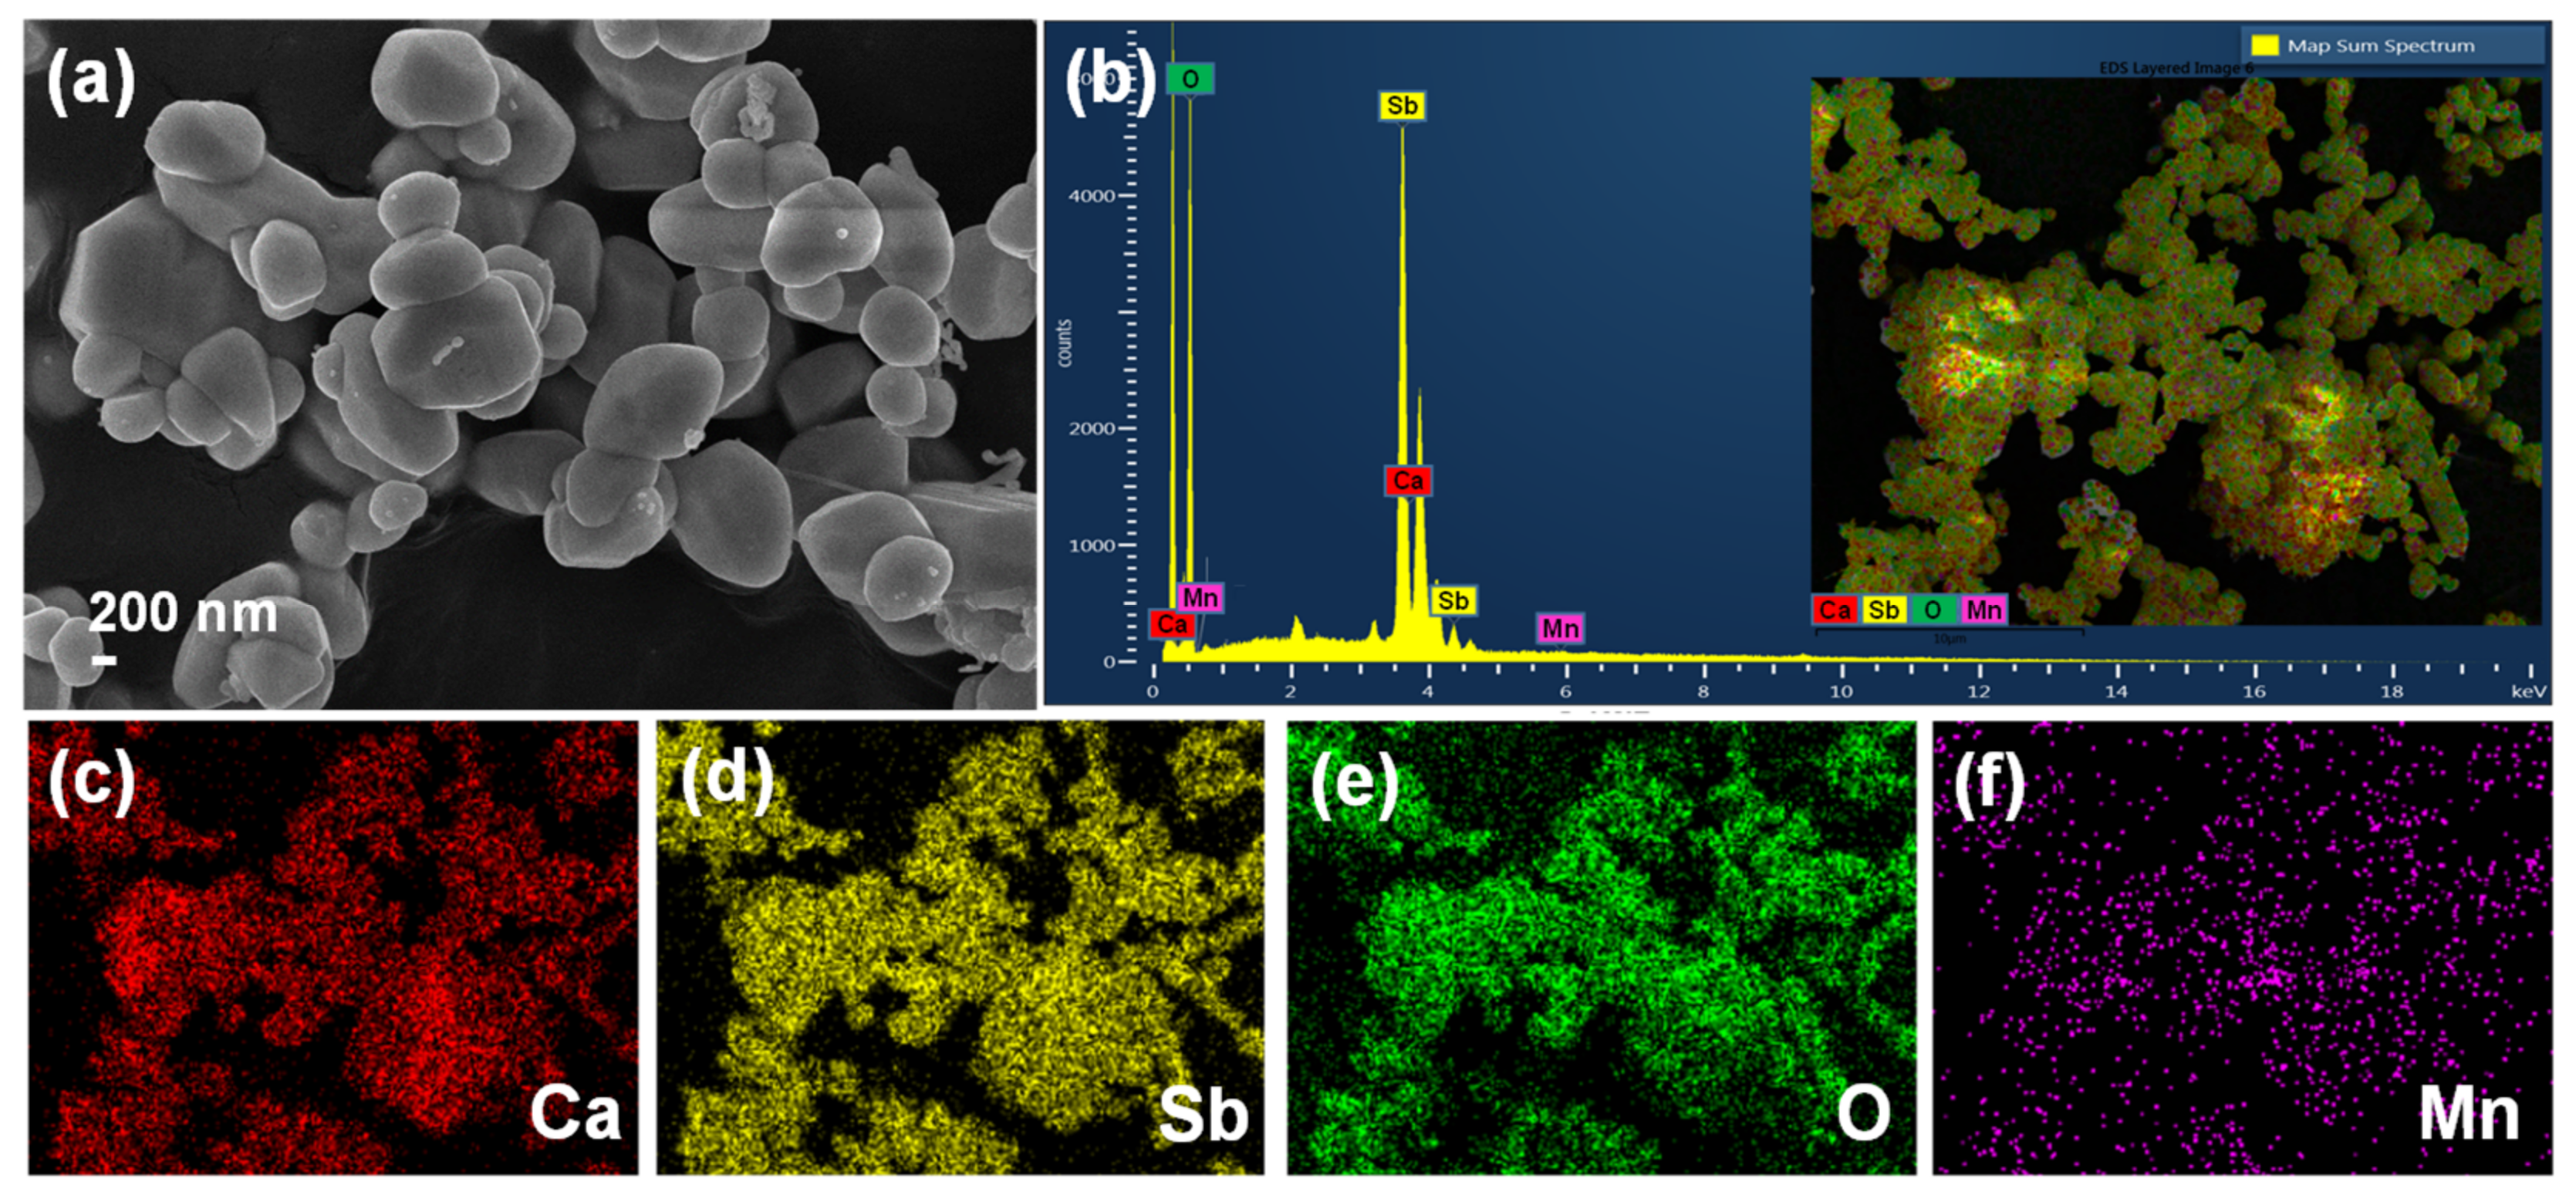
Figure 1. (a) FE-SEM image, (b) EDX spectrum, and elemental mapping of elements (c) Ca, (d) Sb, (e) O, (f) Mn. Inset of (b) shows a layered image of all the elements present in the sample.
Agriculture 12 02066 g001
Figure 2. (a) XRD spectrum, (b) crystal structure, and (c) XPS results of CSO: 2Mn4+.
Agriculture 12 02066 g002
Figure 3. (a) PLE, (b) PL, (c,d) Gaussian fitting results and (e) 3D luminescence of CSO: 2Mn4+. Inset of (b) shows a graph of intensity variation with different concentrations of Mn4+.
Agriculture 12 02066 g003
Figure 4. Tanabe-Sugano energy level diagram of Mn4+.
Agriculture 12 02066 g004
Figure 5. (a) Comparison of PL spectrum of CSO: 2Mn4+ and absorption spectra of chlorophyll a and chlorophyll b. (b) PLE and PL spectra of Na+-doped CSO: 2Mn4+.
Agriculture 12 02066 g005
Figure 6. (a) Decay curves of CSO: 2Mn4+ and Na+-doped CSO: 2Mn4+, (b) CIE chromaticity diagram for the prepared phosphors. The inset of (b) shows the powder images under 365 nm ultraviolet lamp.
Agriculture 12 02066 g006
Publisher’s Note: MDPI stays neutral with regard to jurisdictional claims in published maps and institutional affiliations.