Article

Channel–Spatial Segmentation Network for Classifying Leaf Diseases

1
College of Electrical Engineering and Computer Science, National Taipei University of Technology, Taipei City 106, Taiwan
2
Graduate Institute of Applied Science and Engineering, Fu Jen Catholic University, New Taipei City 242, Taiwan
3
Department of Computer Science and Information Engineering, Fu Jen Catholic University, New Taipei City 242, Taiwan
4
Department of Plant Medicine, National Pingtung University of Science and Technology, Pingtung 912, Taiwan
5
National-Regional Key Technology Engineering Laboratory for Medical Ultrasound, Guangdong Key Laboratory for Biomedical Measurements and Ultrasound Imaging, School of Biomedical Engineering, Health Science Center, Shenzhen University, Shenzhen 518060, China
6
Department of Computer Science and Information Engineering, National Taipei University of Technology, Taipei City 106, Taiwan
*
Authors to whom correspondence should be addressed.
Agriculture 2022, 12(11), 1886; https://doi.org/10.3390/agriculture12111886
Submission received: 28 September 2022 / Revised: 30 October 2022 / Accepted: 4 November 2022 / Published: 9 November 2022

Abstract

:
Agriculture is an important resource for the global economy, while plant disease causes devastating yield loss. To control plant disease, every country around the world spends trillions of dollars on disease management. Some of the recent solutions are based on the utilization of computer vision techniques in plant science which helps to monitor crop industries such as tomato, maize, grape, citrus, potato and cassava, and other crops. The attention-based CNN network has become effective in plant disease prediction. However, existing approaches are less precise in detecting minute-scale disease in the leaves. Our proposed Channel–Spatial segmentation network will help to determine the disease in the leaf, and it consists of two main stages: (a) channel attention discriminates diseased and healthy parts as well as channel-focused features, and (b) spatial attention consumes channel-focused features and highlights the diseased part for the final prediction process. This investigation forms a channel and spatial attention in a sequential way to identify diseased and healthy leaves. Finally, identified leaf diseases are divided into Mild, Medium, Severe, and Healthy. Our model successfully predicts the diseased leaves with the highest accuracy of 99.76%. Our research study shows evaluation metrics, comparison studies, and expert analysis to comprehend the network performance. This concludes that the Channel–Spatial segmentation network can be used effectively to diagnose different disease degrees based on a combination of image processing and statistical calculation.

1. Introduction

In the development of mankind, every country around the world needs sufficient agricultural products for sustainability. Insect attacks and plant diseases reduce food supplementation all over the world by 40% annually [1]. Generally, the disease is spotted on the stems or leaves of the plants [2]. Observing and finding the disease, pests, and traits by using visual patterns is a tedious process [3]. Bacteria causes a plant disease that leads to considerable economic loss. Fungi, bacteria, and phytoplasmas are part of plant pathogens that cause leaf disease [4]. Traditionally way of analyzing a plant disease severity is by manifesting the proportion of plant tissue symptoms to identify the disease [5]. For instance, Xanthomonas creates bacterial diseases which cause noticeable damage to plants. Phytopathogenic fungi are a source of making nearly 30% of all crop diseases. Approximately 80 percent of agricultural production is generated by small-scale industries. Diseases in agriculture cause a lot of yield loss which is more than 50 percent [6]. As per the analysis conducted in 2018, pathogens are responsible for diseased crop production resulting in a heavy economic loss in the global market [7]. The major concern of identifying the leaf disease with naked human eyes will cost a lot of time in terms of large-scale agricultural fields. Pests and pathogens cause a global loss of around $220 billion. To be more precise from the analysis of 2021, without crop production in the field of rice, wheat, maize, potato, and soybean, the total estimated loss is 44.5 metric tons which cost 122.3 billion dollars, and with crop production total estimated loss of 34.2 metric tons which cost of 93.3 billion dollars which proves crop production will reduce the yield lose [8]. Crop production per unit area (yield) is increasing due to the incorporation advance technologies in farming and crop production [9]. Various researchers are working on finding new systems that utilize deep learning techniques to provide better insights for farmers in diagnosing crop disease. The deep learning technology’s outputs are used to provide a metric for an approximative estimation of crop production [10].

2. Related Work

A series of recent studies have indicated that the research topic of plant disease prediction discusses the major issues of plant pathology and provides solutions for the issues. Pantazi et al. have achieved an accuracy of 92% with the help of the Local Binary Patterns algorithm and image segmentation on identifying powdery mildew disease on the vine leaves, which initially gave an ideology for this research [11]. The above study focuses on detecting the differences in health conditions analysis on the variety of crops. Simonyan et al. used a deep convolutional neural network (DCNN) approach that achieves the disease detection of plant leaves and recommends pesticide doses to cure disease in the plants [12]. Interestingly, Ahmad et al. have explored several pre-trained models, such as VGG16, VGG19, ResNet, and InceptionV3, which are fine-tuned networks to identify different tomato leaf diseases [13]. Goncharov et al. implemented the Deep Siamese network, which combines two similar convolution layers weight to handle the issue of minimal databases of plant leaves utilizing peculiar leaves of the grape in various groups. However, their research focuses on solving a convolutional neural network imbalance issue by using two combined CNN [14]. Elaraby et al. proposed two different stages of deep CNN models to predict citrus-diseased leaves. The first stage focuses on the potential target of the diseased area, which is followed by classifying a similar area to the corresponding citrus diseased leaves, which resembles our channel and spatial attention model works. However, the model achieved up to 94.3% accuracy [15].
By measuring variables, one can describe and define plant disease severity. These variables signify the percentage of infected plants per unit area to the total number of plants, the percentage of diseased leaves to the total number of leaves on the same plant, and the percentage of diseased spot area to the total leaf area on the same leaf [16]. Guan Wang et al. and a group of botanists annotated mild, medium, severe, and healthy as ground truth and divided classes and then trained using a deep convolutional neural network to identify the disease severity [17]. The following studies were conducted on detecting tomato leaf disease with an overall accuracy of 98.49%. Naresh et al. proposed an effective and high-performing deep learning network by using a Convolutional Neural Network to extract colors, texture, and edge to target the infected area in the image to segment from the original image. This tomato dataset consists of 3000 images affected by nine different diseases [18]. Pethybridge et al. used color pictures to compute the proportion of disease severity and identify lesion regions from healthy tissues [19]. Miaomiao Ji et al. suggest an efficient automatic detection and severity analysis technique based on deep learning to handles grape black measles and fuzzy logic [20]. Mehmet et al. proposed a Faster R-CNN architecture for detecting the sugar beet plant disease severity by imaging-based expect systems. The overall accuracy for the method is 95.84% [21]. Umesh Kumar et al. present an enhanced CNN model (ECNN) for detecting cassava leaf disease with an accuracy of 99.3%. The dataset consists of five different cassava leaf diseases with 6256 images. ECNN model is a gamma correction feature method that involves three Convolutional layers and four fully integrated layers with Global Average Election Pooling Layer to minimize overfitting [22].
Interestingly, Chenghai Yin et al. proposed a novel deep learning network, DISE-Net, which uses dilated inception module for feature extraction [23]. Ren et al. perform a pre-trained ImageNet to identify the region-based detector by extracting the features in the inputs, helping us to design our attention model to focus on extracting the correct feature in the given inputs [24]. Vinayakumar Ravi et al. focus on classified cassava leaf disease using a transfer learning-based CNN model. The author states that the CNN-based pre-trained model failed to identify the tiny infected part in their overall cassava leaf [25].
In recent years, researchers have been focusing on creating the attention model to solve imbalance network issues. The attention-based model has become more effective in recent years for various deep learning tasks, including natural language processing, image processing, and speech recognition. Woo et al. have introduced two separate mechanisms, such as channel and spatial attention mechanisms, in their study. Our neoteric method handles the plant disease prediction problem with two-phased architectures, such as channel-based attention mechanism and spatial attention mechanism. This work was inspired by the CBAM mechanism. CBAM involves channel and spatial attention mechanisms along with the CNN networks to find “what” and “where” in the region of a given leaf image for predicting the diseased leaves [26]. The integration of attention strategies and deep learning makes the task of identifying and segmenting plant disease areas more attractive and detailed. CBAM (Convolutional Block Attention Module), SE-Net (Squeeze-and-Excitation Networks) VSG-Net (Visual-Spatial-Graph Network) are a few major common attention modules [26,27,28].
On the other hand, Zhe Tang et al. used the lightweight CNN applied with a Channel-wise attention mechanism which holds the Shuffle Net as the Backbone. The squeeze-and-excitation is used to assist with the Channel-wise attention mechanism to improve the ShuffleNet architecture [27]. Another study proposed a dual attention mechanism used to perform feature evaluation to find grape leaf disease.Their study has been limited to less than 4500 images which are very fewer data, and this is the limitation barrier of the study [29]. Karthik et al. have applied two different significant architectures to detect the defected tomato leaves: 1. Initial architecture was designed by residual learning to classify the feature, 2. The attention mechanism is applied based on the classification to predict the leaf disease of early blight, late blight, and leaf mold. The accuracy of their study is 98%. The results show that some of the pre-trained neural networks with attention mechanisms are suitable for leaves diseases detection [30]. Zhiwen et al. used an embedded network with CBAM in the densely connected convolutional network (DenseNet) to find the disease in the Wheat leaf image by utilizing C-DenseNet and CBAM as a Backbone network [
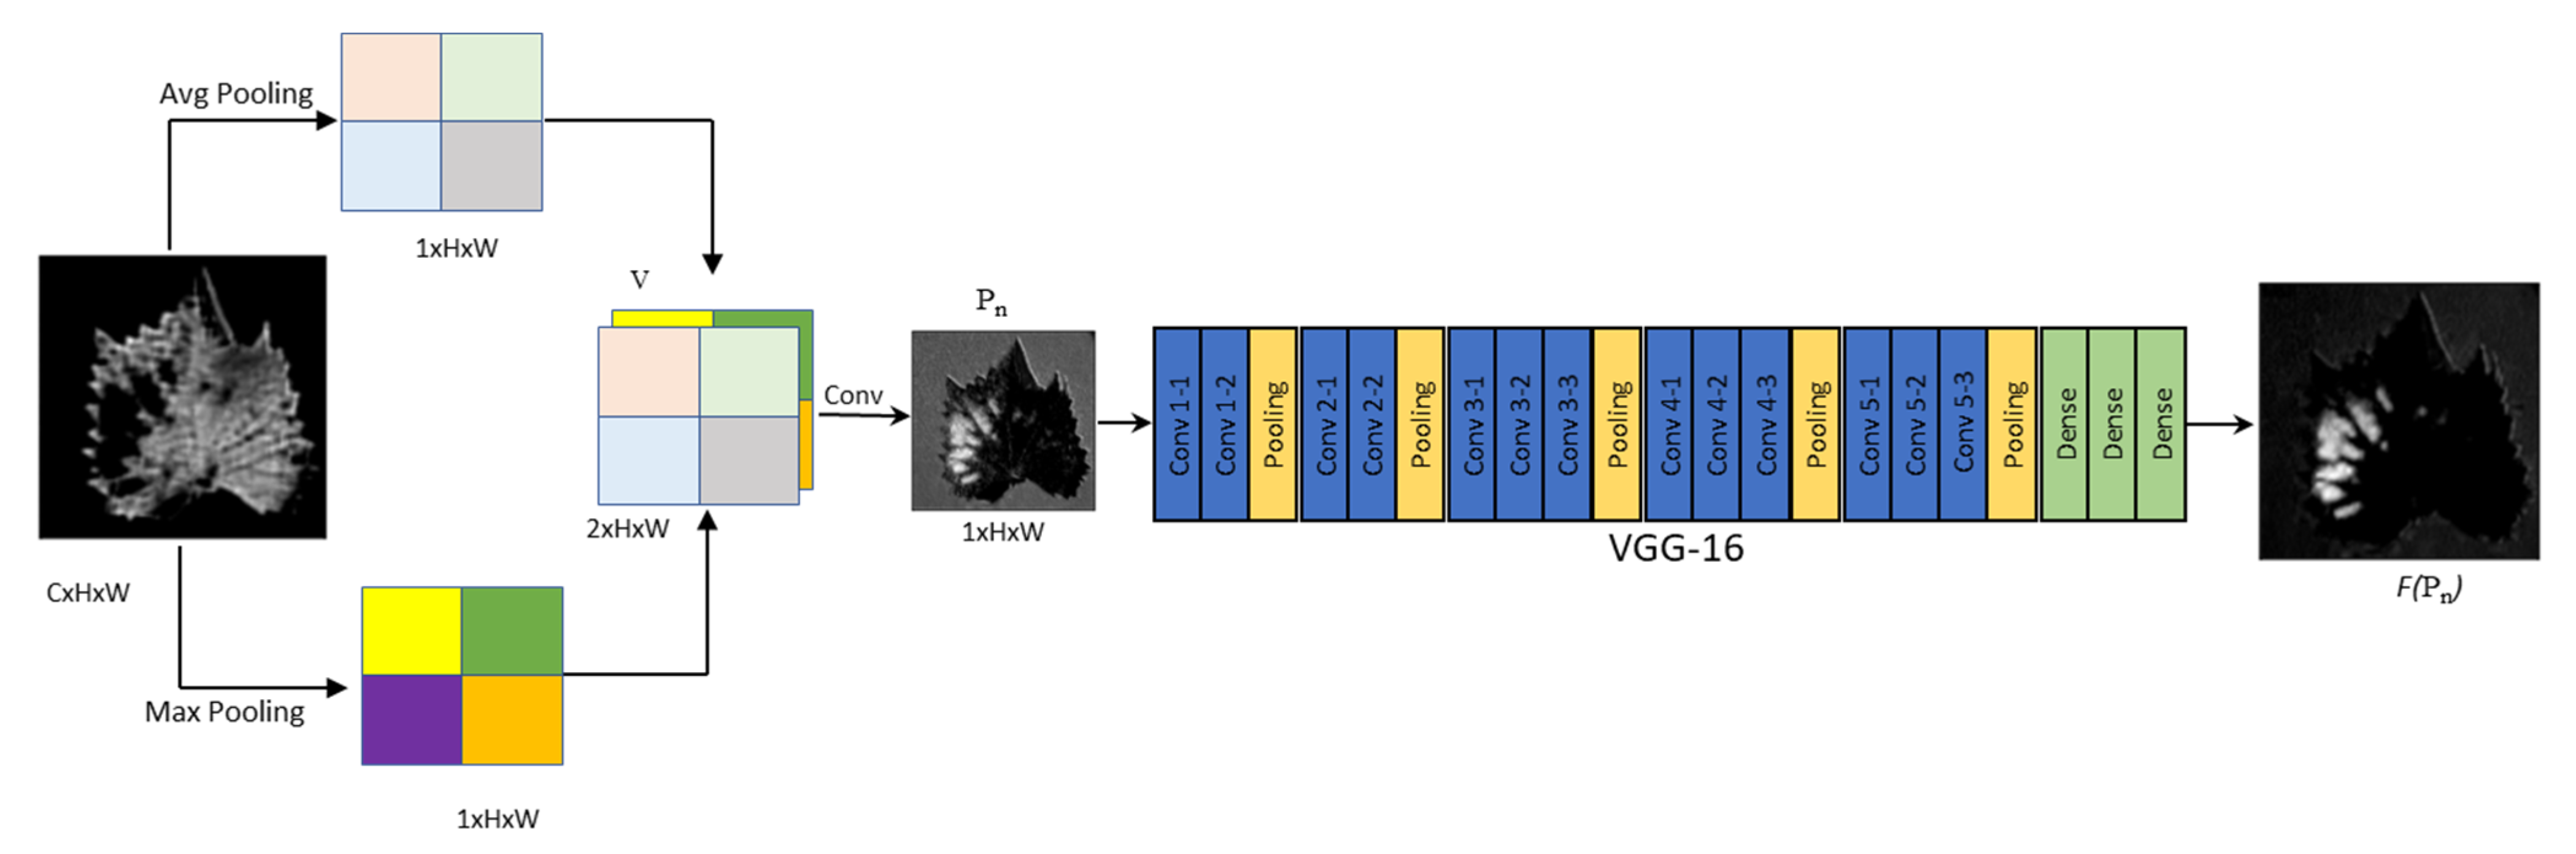
31]. The recent study employs pre-trained networks with their architectures to improve accuracy. Similarly, we have adopted pre-trained VGG16 with our spatial attention module. Yun Zhao et al. focus on predicting three different plant diseases, such as corn, potato, and tomato, with the help of inception and residual structure which is based on CNN embedded with CBAM [32]. On the other hand, there are other technologies to identify plants and plant diseases using the mobile application. The flora incognita app helps to perceive biodiversity by determining plant species with the aid of a mobile application environment [33]. There is a noticeable study that made an interactive mobile application called leaf doctor to measure the intensity of the disease [19]. Another research study developed a new iPad application for assisting plant disease intensity and helping in treatment decisions [34]. Abbas et al. established a conditional Generative Adversarial Network to generate an animated image of a tomato plant from the real image, and the DenseNet121 model uses both images to train the model. Moreover, their study uses transfer learning to classify tomato diseases. However, the accuracy achieved up to 98.65% [35]. This work was intendedly created to support the real-time application.
The main significance of this work is described below:
(i)
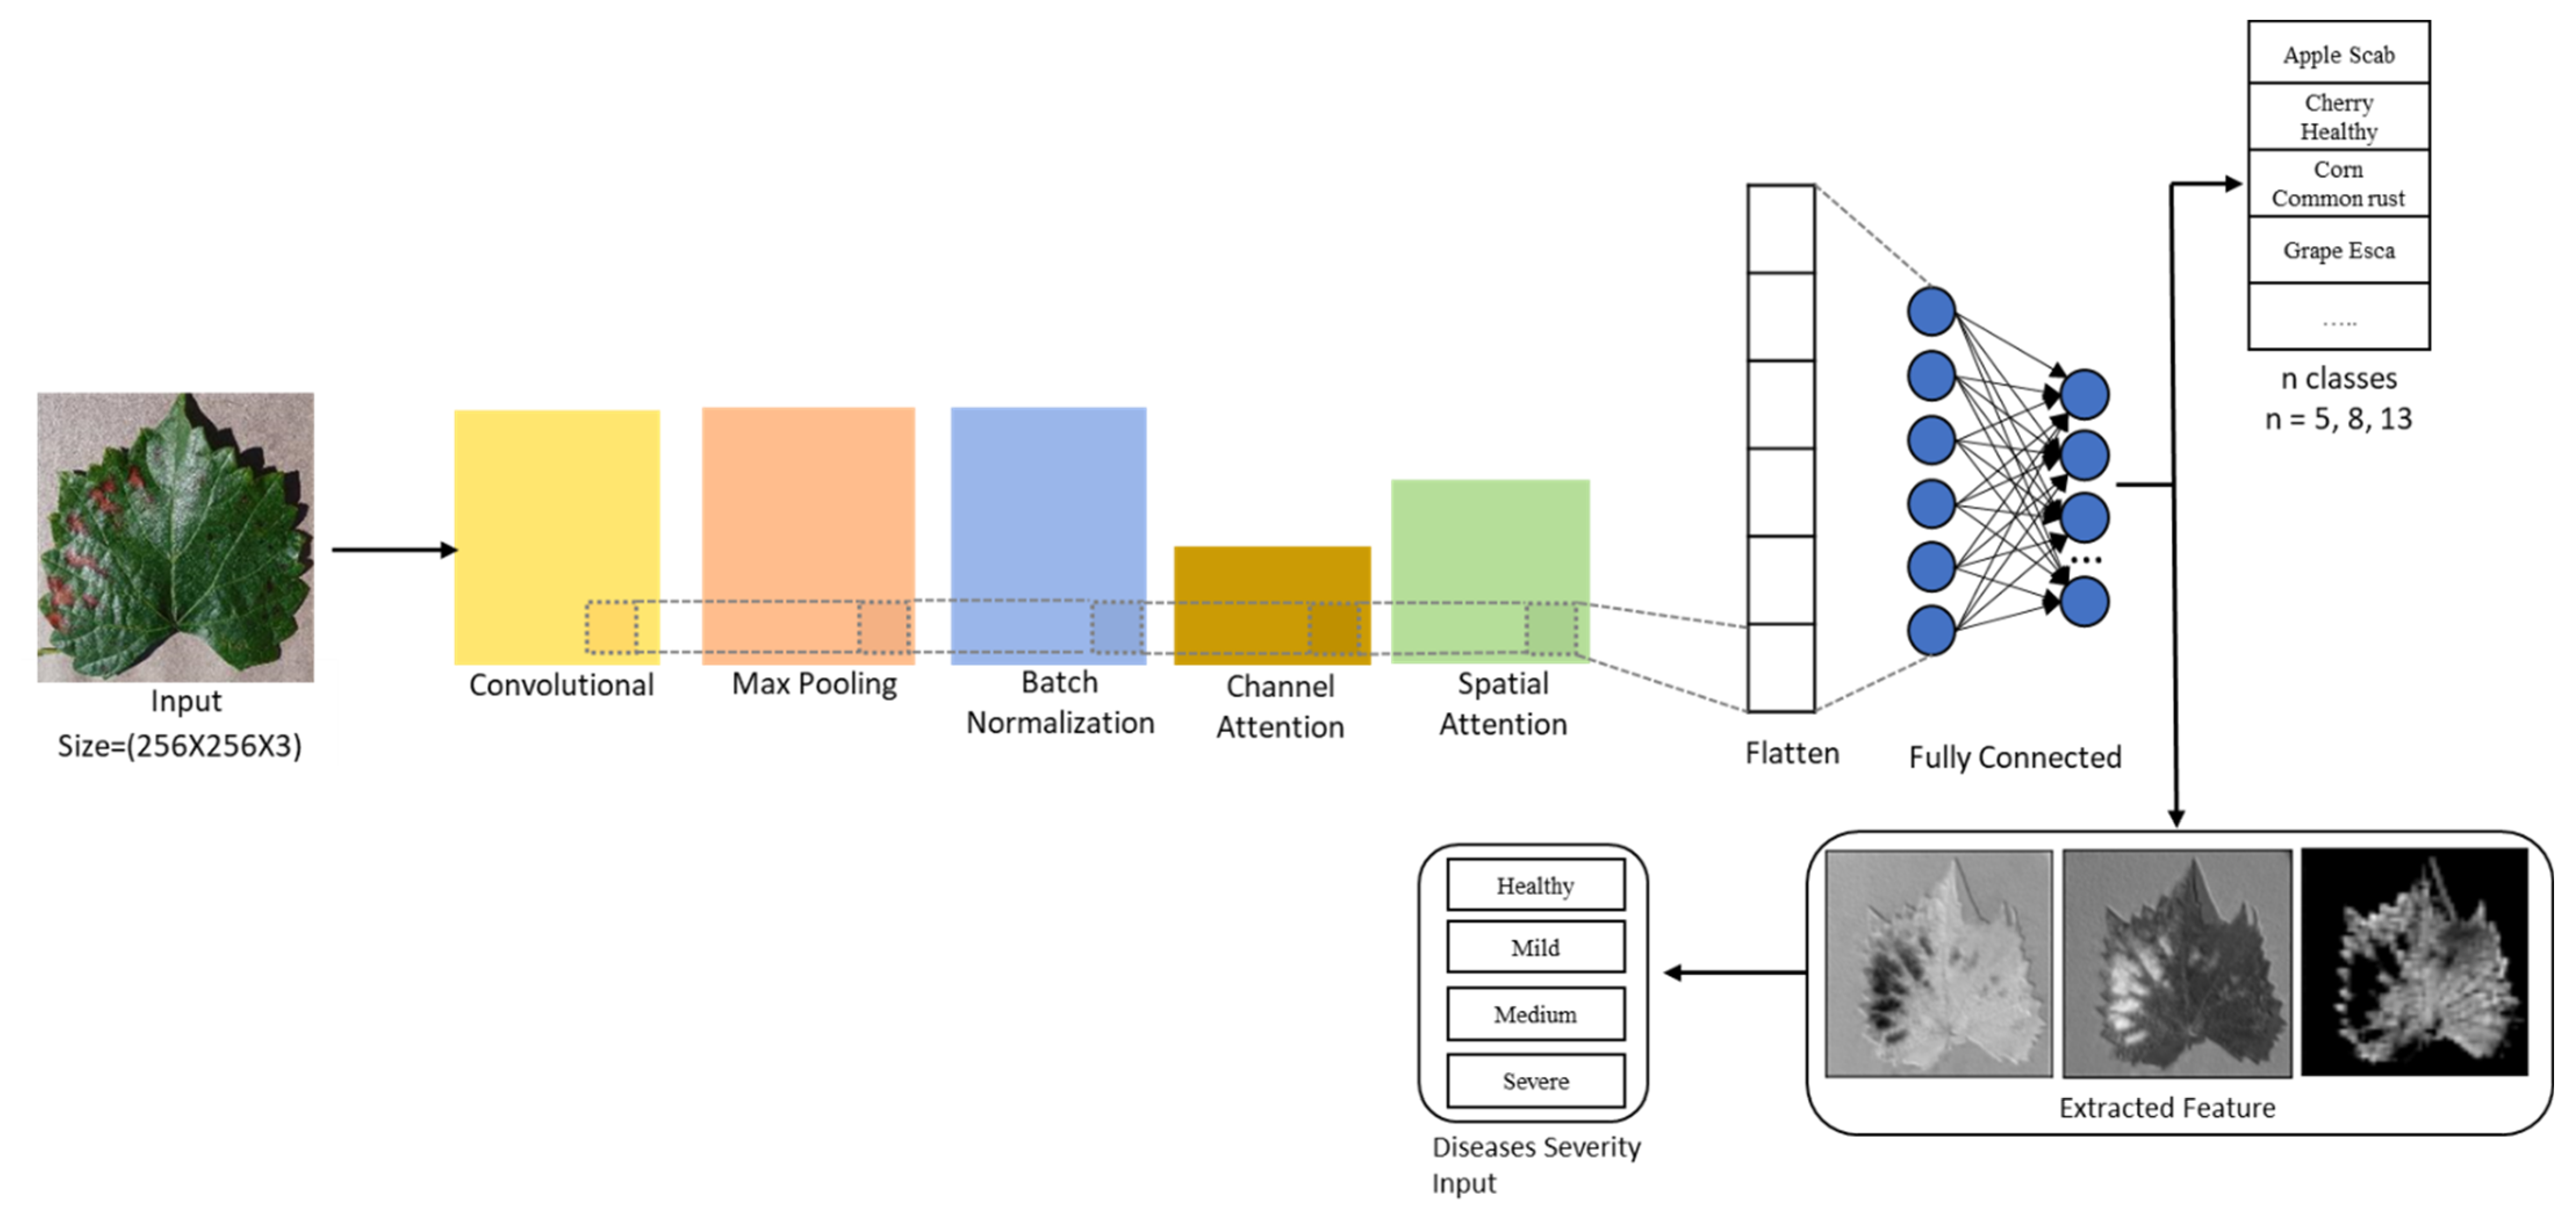
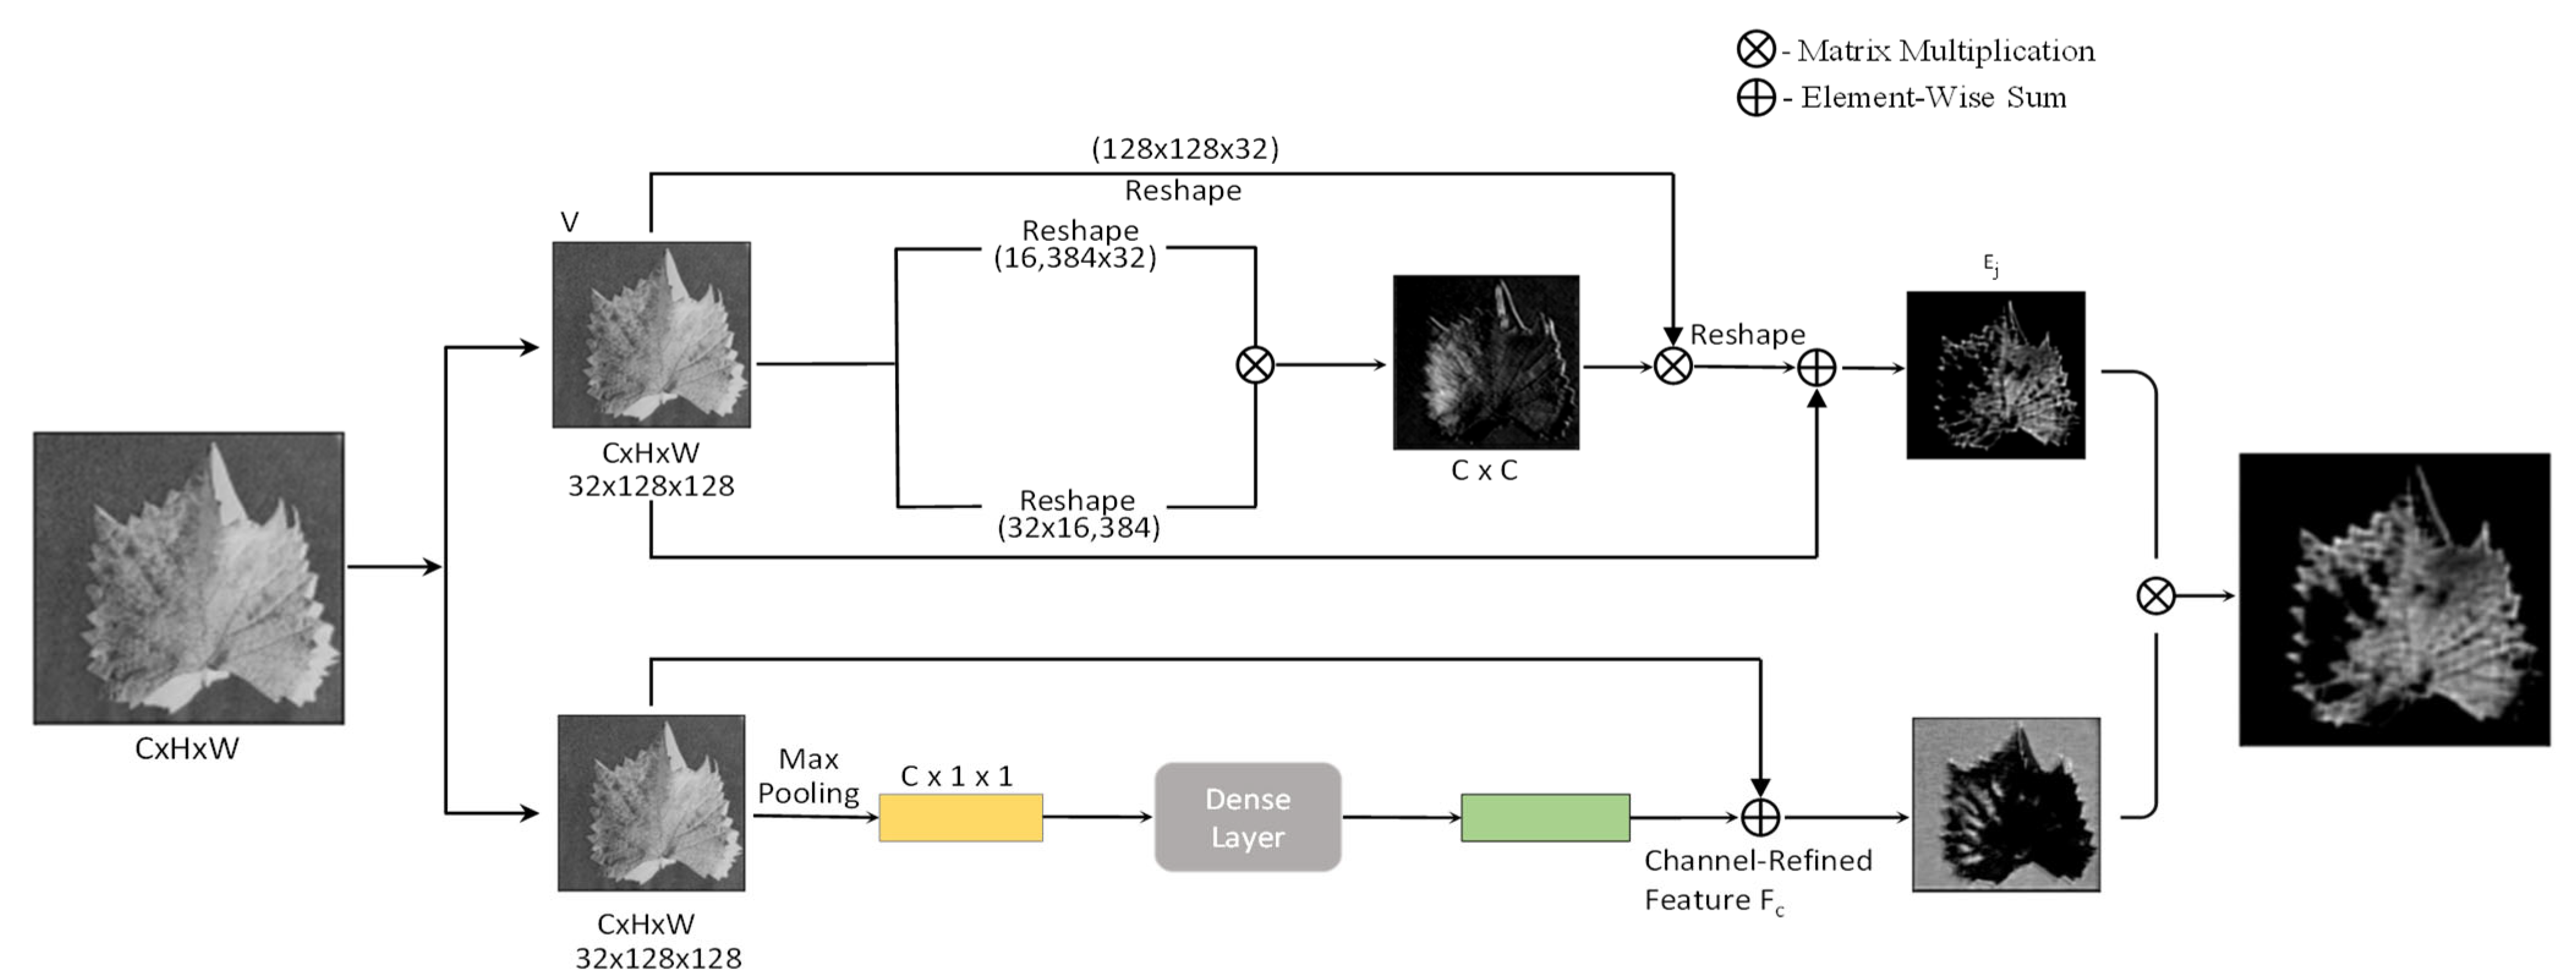
In this study, we have developed a Channel–Spatial segmentation network integrated with CBAM [24] attention architecture to identify various healthy and unhealthy leaves. To understand the interconnection between the channels, we have implemented a channel attention module that enables the segmentation ability of the network.
(ii)
This segmentation strategy of channel attention helps to separate the diseased portion of the leaf and also adds additional feature extraction strategies to spatial attention.
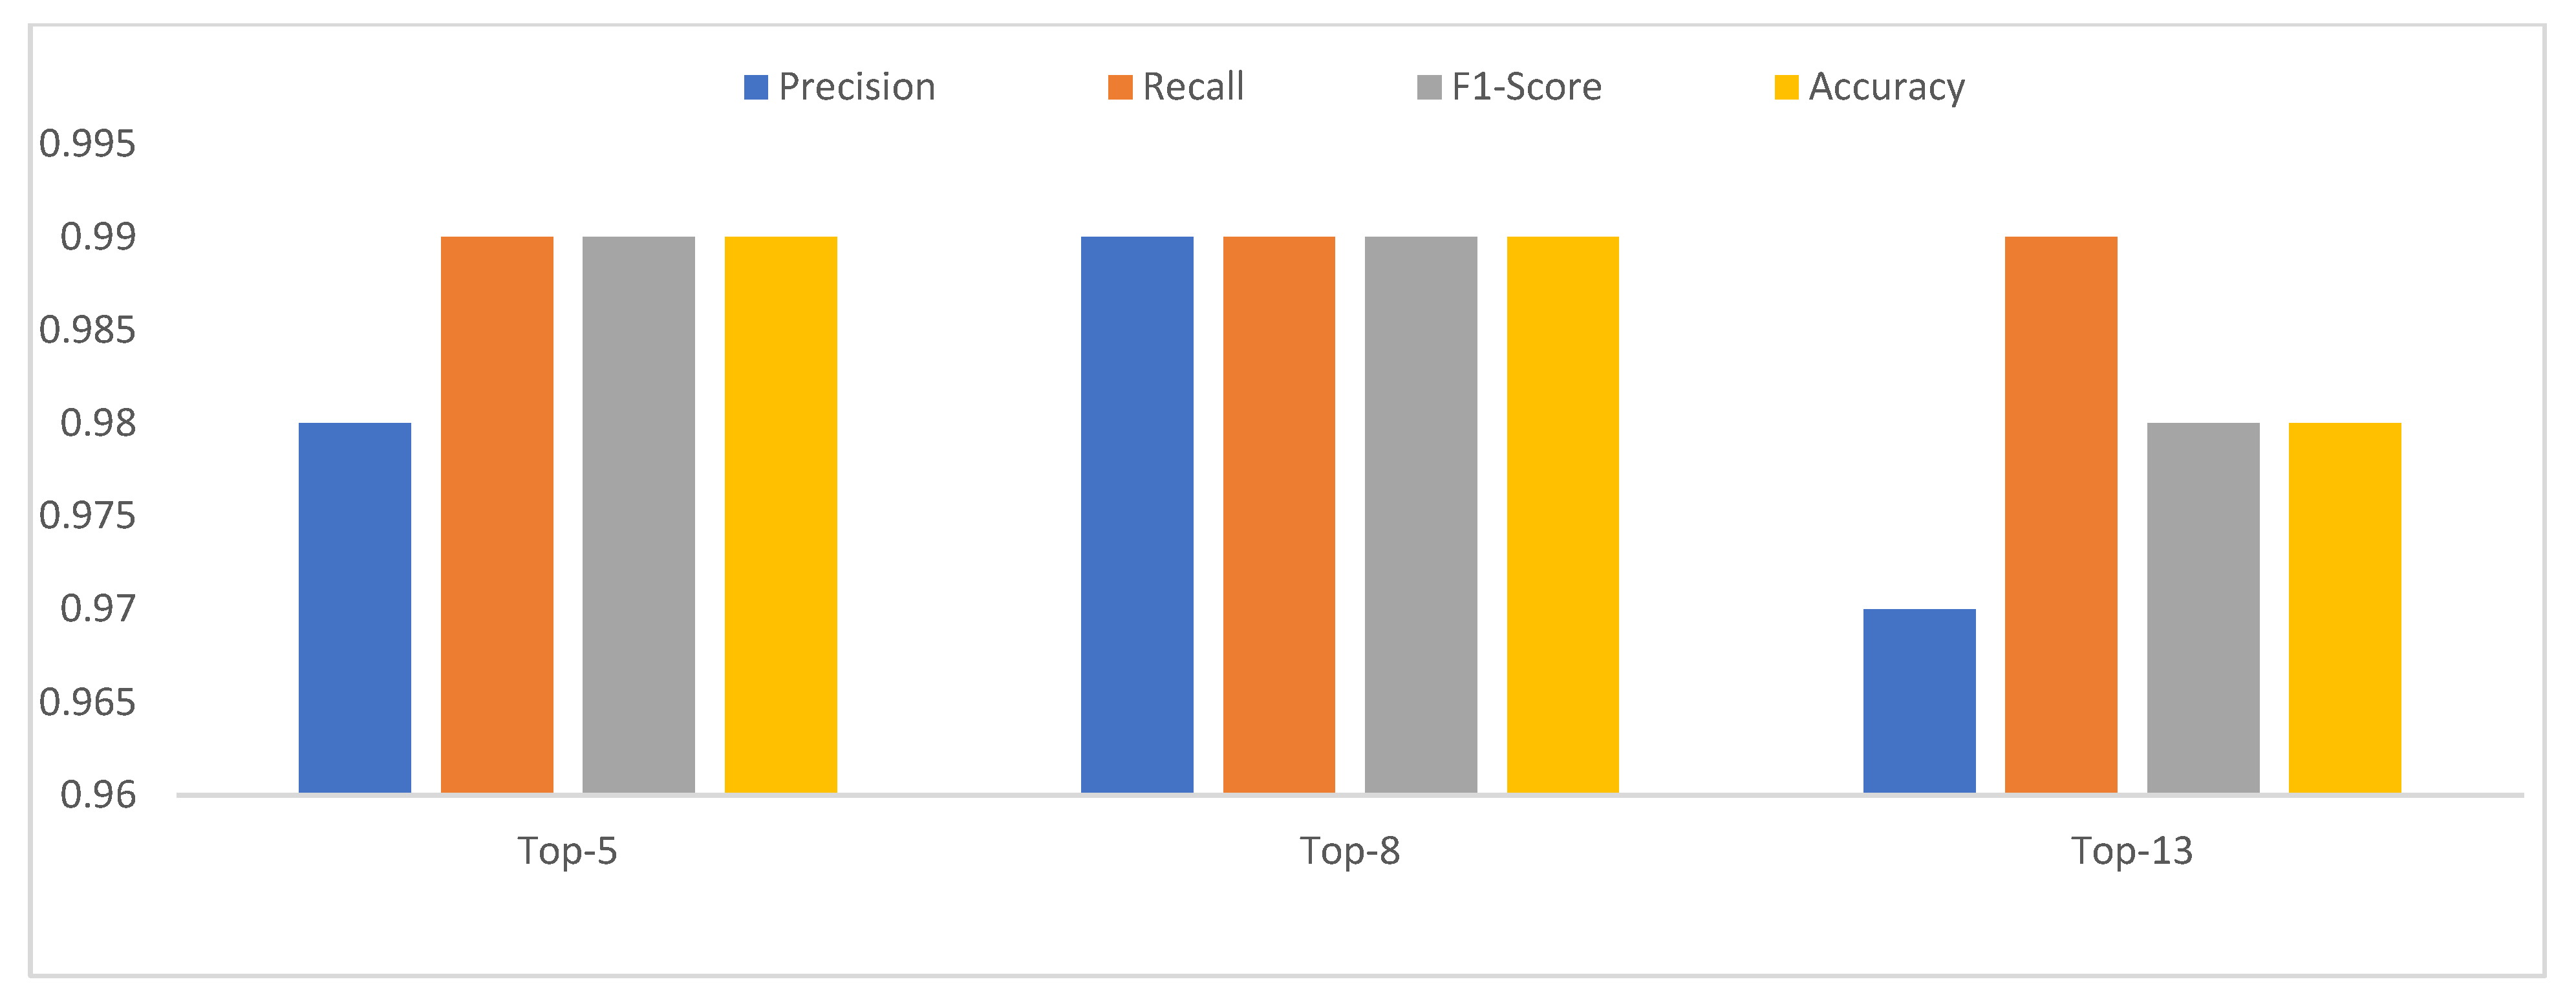
(iii)
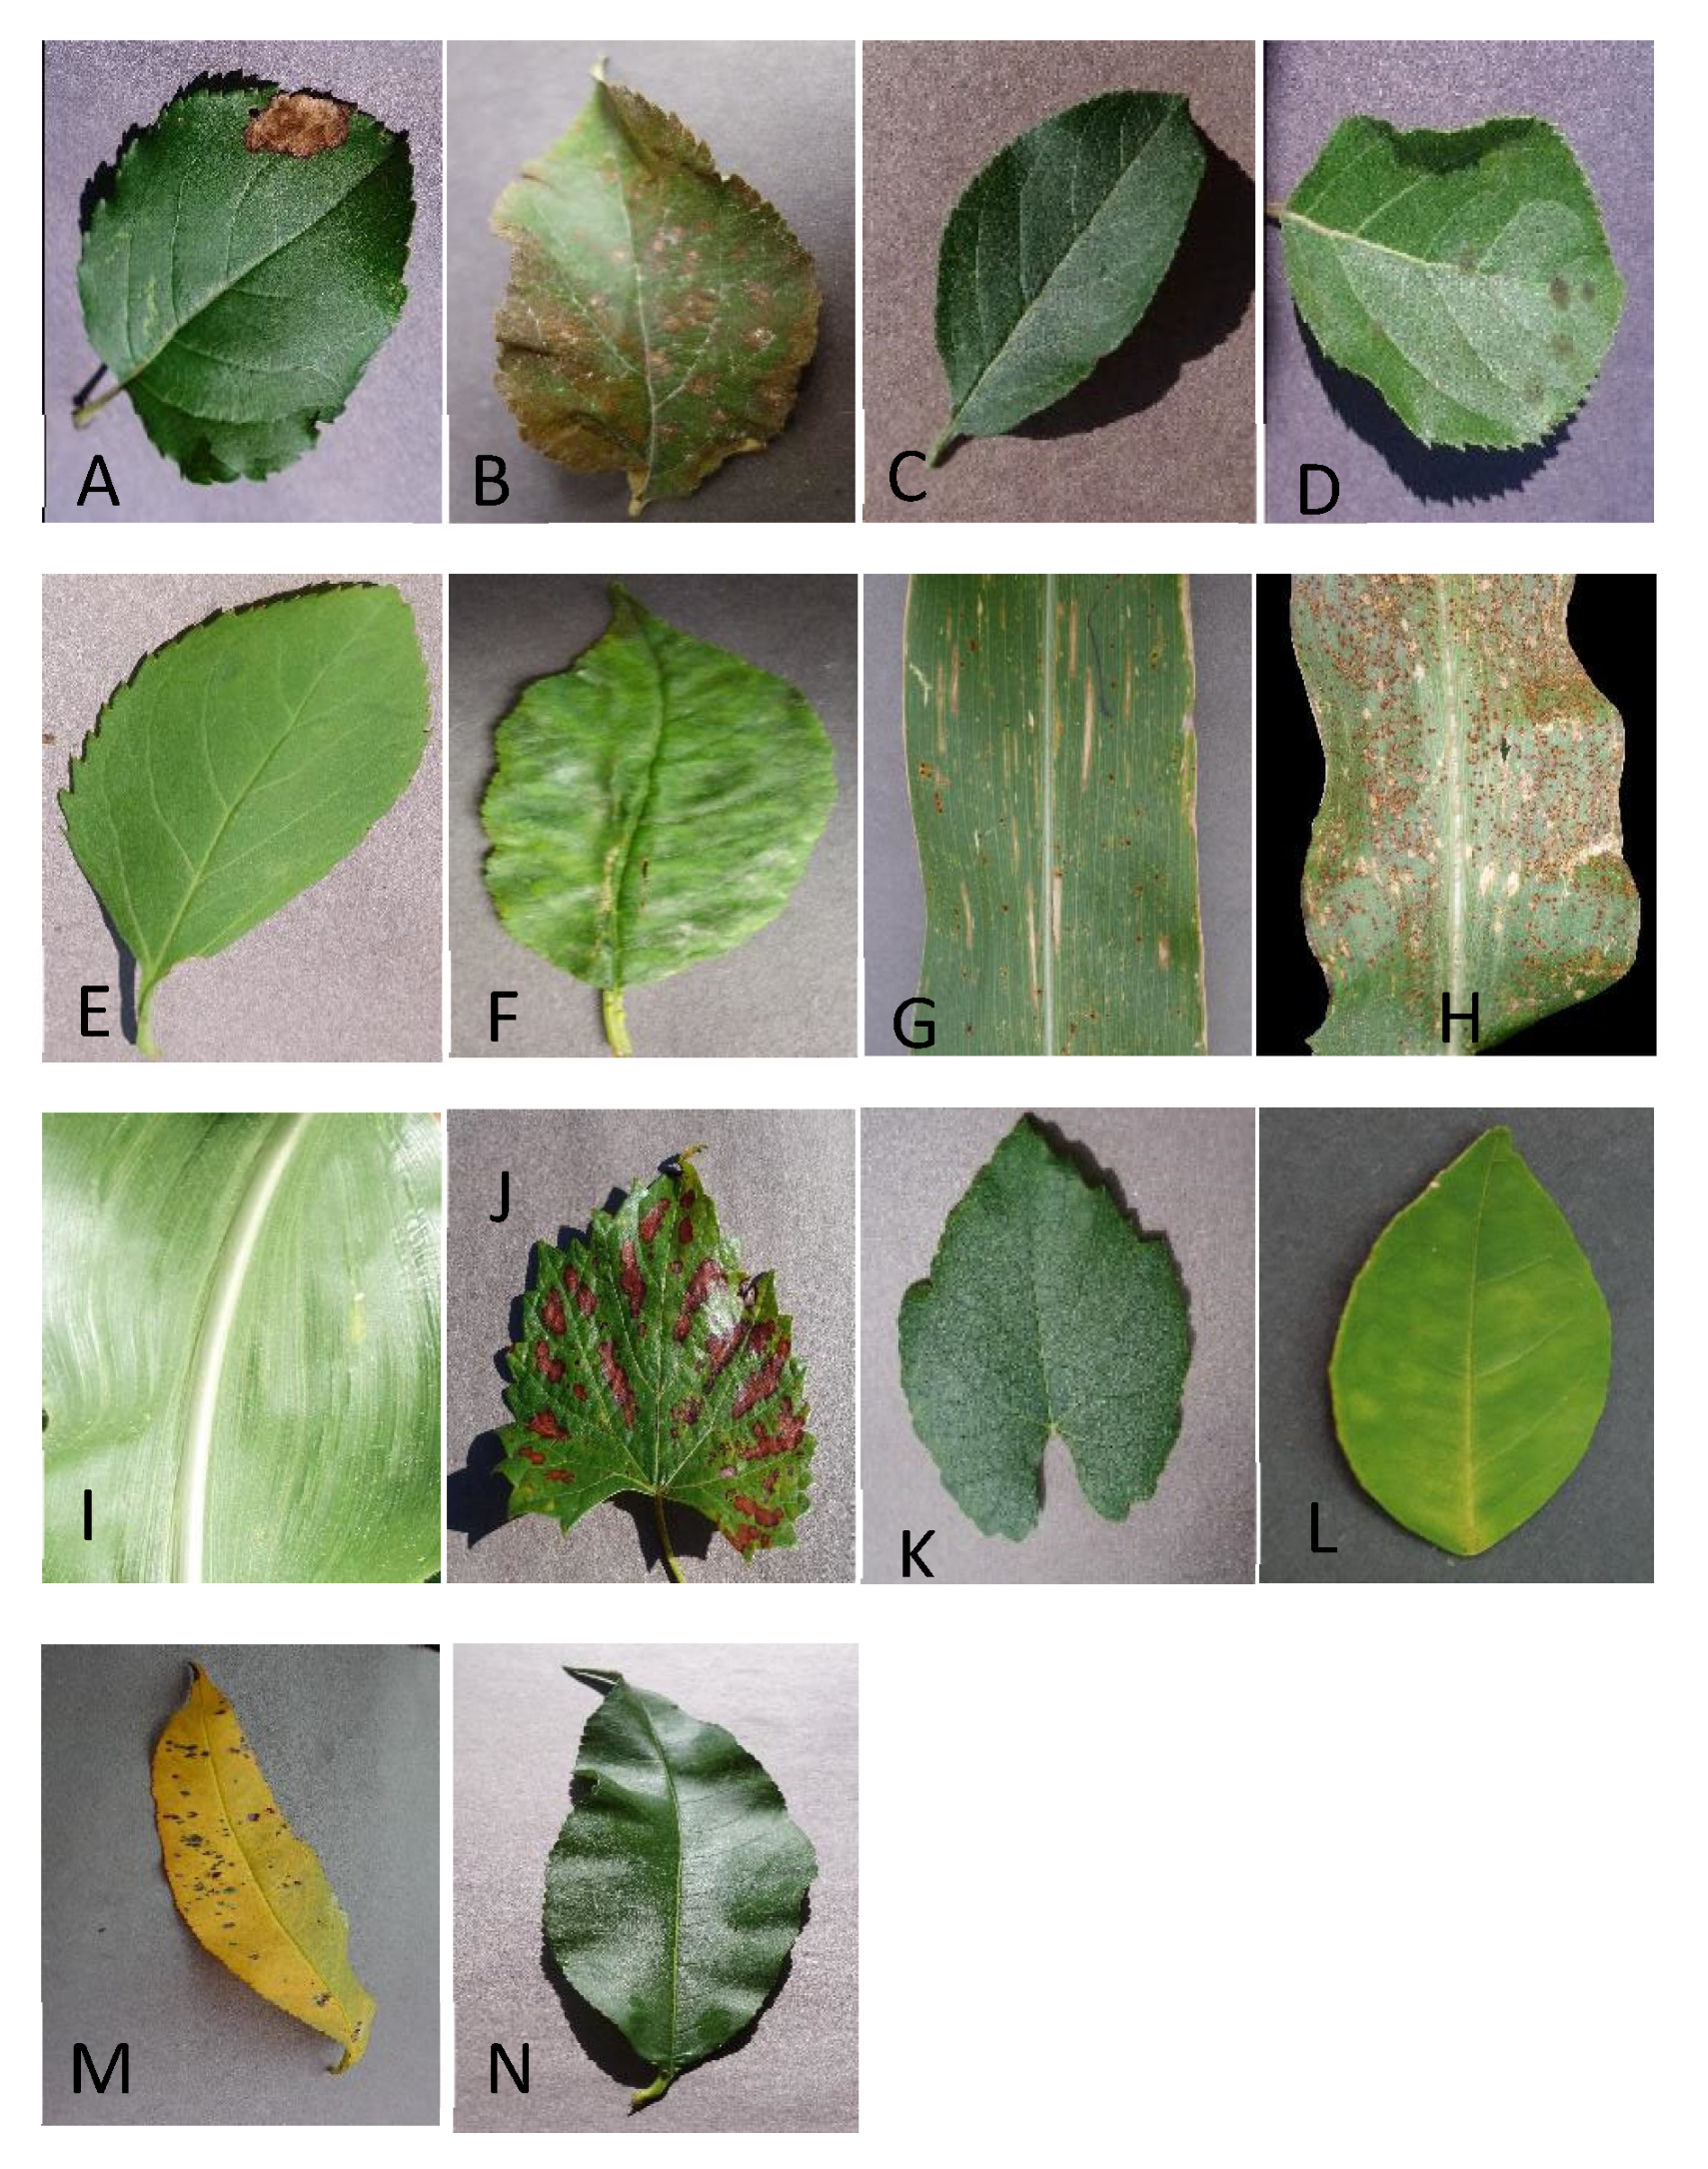
In this investigation, we also used a technique to validate the model by the total of 14 leave classes into the Top-13 leaf group, Top-8 leaf group, and Top-5 leaf group, which was discussed in the dataset with an overall accuracy of 99.76% [35].
(iv)
Our model identifies leaf disease with the added advantage of finding out negligible defects. Along with leaf disease prediction, we measure the severity by mild, medium, severe and healthy.

3. Materials and Methods

In this section, we first describe the general elements of our architecture and then we present two-attention model which focuses on generating the attention map. Later, we describe the use of interaction between the channel attention and spatial attention procedure to highlight diseased regions and predict the disease.

3.1. Dataset

The complete Plant Village dataset holds 54303 healthy and unhealthy leaf images, including 38 classes. We utilize a few classes of diseased leaves and healthy leaves in our plant disease dataset. In this article, this plant disease dataset is collected from the Kaggle dataset [36]. We utilize 36,440 images consisting of 14 kinds of different healthy and diseased leaves, which also includes multiple leaves of apple, corn, orange, and grape. In detail, apple black rot, apple cedar rust, apple scab, apple healthy, cherry healthy, cherry powdery mildew, corn grey leaf spot, corn common rust, corn healthy, grapevine measles, grapevine healthy, orange huanglongbing, peach bacterial spot, and peach healthy are the total leaves of the dataset. We split the dataset into 40% of validation, 50% of training, and 10% of testing dataset. Figure 1 illustrates the sample’s diseased and healthy leaves. We split the total 14 leaf disease into three stages of training Top 5, 8, and 13. In the total of 14 leaf classes, we randomly split the 14 classes into different groups. For instance, initially, we picked 3 classes, 6 classes, 8 classes, and 10 classes randomly to train as individual groups to evaluate the model. In that group, we picked the top 3 performance groups to present the result, which are 13 leaf classes, top 8 leaf classes, and 5 leaf classes [35].

3.2. Convolutional Block Attention Module (CBAM)

Basically, CBAM comes along with the two independent attention mechanisms to exploit the important features on the dimensions of channel axis and spatial axis. This gains the feature extraction ability of the model [37]. The CBAM-integrated network increases the ability which effectively make use of target object regions and accumulates features from that information [26]. In addition, Implementing CBAM with the network leads to detecting small targets and improving the feature extraction process [38]. Based on this ideology, we included the CBAM with our approach to detect the diseased part especially since this improves the ability to detect the tiny disease targets.

3.3. Proposed Model

The overview architecture of the proposed model is illustrated in Figure 2. Our model included CNNs elements to extract features from the leaf image. However, CNNs are unable to adaptively focus on disease regions. We have included an attention mechanism to obtain more precise features regarding plant disease. Our proposed model adopted the CBAM attention architecture for the initial attention mechanism. The method followed the same arrangement of CBAM attention architecture. We have appended another segmentation mechanism to channel attention and a balancing mechanism to spatial attention for this research.

3.4. Convolutional Layers

Convolutional layers are typically used for several computer vision tasks, such as pattern recognition and image classification. Moreover, CNN model has a special unique quality for producing set of filters that accomplish the convolutional operation on the given input images. Convolutional operation is the main block of CNN architecture [28]. The main purpose of this CNN model is to extract the intermediate features from the input. The extracted intermediate features are utilized by the channel attention and spatial attention to figure out the diseased regions and predict the disease. The convolutional layer operation is illustrated in Equation (1); K represents kernel, and L denotes leaf image. The row index and column index of convoluted features are mentioned with m and n, respectively. Subsequently, maxpooling is applied to the convoluted features to produce intermediate features (F) which is shown in Equation (2).
S m , n = i N j N K i , j L m i , n j
F = M a x P o o l S  

3.5. Channel Attention

After the action of convolution and pooling layer, the extracted features are forwarded to channel attention. Channel is a grayscale image of the color image made up of one of these primary colors (RGB) in this investigation. Channel attention utilizes the connection between channel-maps to highlight the feature representation semantically. Every channel map has interconnected unique details and class-specific details, which are located on the features [32]. Channel attention map is a grid of matrix to understand “what” is the important information of the channels to detect the target. Channel attention map is produced by making use of the inter-channel connection of intermediate features F R C × H × W , C represents channel, H represents Height, and W represents Width. In detail, reshaped features F C×T and transposed of the same features FT×C are involved in matrix multiplication, T represents the number of pixels. Then, Softmax is applied on Channel map attention to achieve X R C×C, refer to Equations (3) and (4). σ represents activation function, represent as matrix multiplication.
X = σ F F T
X i j = e x p   F i .   F j i = 1 c e x p   F i   . F j  
We perform matrix multiplication between X and FC×T to obtain the new result. Element-wise sum is processed on reshaped result, and initial intermediate features FC×H×W to reach the final result EC×H×W. The final result is shown in Equation (5). The whole above-mentioned process increases the segmentation ability of unhealthy parts from the whole leaf. The process collects interdependencies in channel dimensions to improve segmentation.
    E j = i = 1 C ( x i j + F i ) + F j
Parallelly, max pooling is applied on initial intermediate features to produce prominent features. Prominent features are taken by fully connected layer (l) to deliver refined features. Channel attention features and refined features are multiplied element-wise to produce channel-focused features (F ). The process is indicated in Equation (6). Figure 3 illustrates the end-to-end process of the Channel attention mechanism.
F = E l M a x p o o l F

3.6. Spatial Attention

In this investigation, we followed the sequential arrangement to form channel attention and spatial attention. After the channel attention process, channel-focused features ( F ) are forwarded to the spatial attention procedure. The complete process of Spatial attention is visualized in Figure 4. Spatial attention map is generated based on the inter-spatial connection of features. Spatial attention focuses on the diseased location of the features, which helps to fulfill the attention mechanism. Spatial attention module is placed after the channel attention module. We have applied average pooling, and max-pooling on Channel focused features ( F ) to aggregate channel information. Concatenation process happens on both the average pooled features and max pooled features, which produce spatial map (V), which is shown in Equation (7). In parallel, pretrained VGG-16 model and fully convolutional block is used on the initial features to extract important features (G). The VGG16 model is a deep convolutional model along with 13 convolutional layers and 5 pooling layers used in the spatial attention mechanism. The VGG16 model contains 6 block structures with the pooling layer as the margin and the same number of channels in each block [12]. The extracted features and concatenated features are involved in the element-wise multiplication to achieve the spatial attention (F ), which is indicated in Equation (8).
V = A a v g ,   A m a x
  F = V G  

4. Results and Discussion

4.1. Implementation Details

For implementation, we used the TensorFlow framework to implement on Channel–Spatial segmentation network. Subsequently, we have employed categorical cross entropy as a loss function and Root Mean Squared Propagation (RMSprop) as an optimizer. The momentum is set to 0.9, and the weight decay coefficient is set to 0.0001. The batch size is set to 128 for the leaf disease dataset. The number of classes in the dataset is 14. In the training process, we used Python 3.8, TensorFlow-GPU framework 2.7 with the Ubuntu-20.04 platform to implement Channel–spatial segmentation network. We have trained the model with the help of an RTX 3070-ti GPU. We fixed our learning rate as 0.0001, and the dropout value is 0.25. We have set the training time to 140 epochs for training the network. The model scores an accuracy of 99.76%, and our training loss is 0.0073248, as shown in Figure 5. The hyperparameters are fine-tuned during the process of training the model. Table 1 represents the hyper parameter used in this proposed model.
The Figure 5a,b graph explains the training period of our model. The model completed 140 epochs to check the model loss and accuracy. Figure 5a represents the loss function, and Figure 5b explains the accuracy. In both Figure 5a,b, the blue line represents the behavior of the training data, and the orange line shows the behavior of validation accuracy. The graph indicates that the model converges with slight variation after 60 epochs.

4.2. The Proposed Method Analysis

In the initial stage, our model utilized the integration of CBAM architecture with the convolution neural network to solve leaf disease prediction. This approach primarily solved the task of apple leaf disease prediction with an accuracy of 92%. The preliminary setup includes the base channel attention and spatial attention mechanism without additional operation. To overcome the basic method, we included the Selective Kernel (SK) network in the CBAM-integrated convolutional neural network. The receptive fields of artificial neurons in the layer of typical Convolutional Neural Networks (CNNs) are fixed to be the same size. The selective Kernel (SK) network provides a dynamic selection methodology for the receptive field sizes according to the different scaled input data [39]. The modified network outperforms the previous base network with an accuracy of 95%.
Consequently, we have made modifications to the spatial attention mechanism for balancing the channel attention part. Recent research proved that using a pre-trained model inside our architecture will also help us to detect plant disease [24,30,35]. Moreover, we have utilized VGG16 to boost the features before entering into the spatial attention process. SK included network along with the changes of a spatial network was not able to produce satisfactory results. We found that the (SK) network delays the procedure and slows down the performance of our network. Due to this delay, we excluded the Selective kernel (SK) network from our model. In addition, the spatial attention mechanism includes multiple convolutional layers for downsampling the feature. Meanwhile, the channel attention mechanism is modified slightly to emphasize the channel features. To understand our channel interdependencies of features, we have implemented an extra segmentation mechanism for the network. The network’s segmentation ability to differentiate diseased regions evolves exceptionally as a result of this adjustment. The segmentation mechanism contributes more to discriminating the diseased portion from the healthy part of a leaf. Our work organizes channel and spatial attention in a sequential way to identify diseased leaves. We confirmed that sequential arrangement in the attention mechanism outperforms a parallel arrangement. In this sequential process, we prefer the Channel-first approach similar to the CBAM.

4.3. Performance of Channel–Spatial Attention

Our proposed model outperforms the specialized prediction model for corn leaf disease prediction based on the Precision, Recall, and F1 metrics [40]. We have utilized several performance metrics, including Accuracy, Precision, Recall, F1-score, Confusion Matrix, and Dice Coefficient method, to evaluate the suggested approach’s performance.
T P T r u e   P o s i t i v e ,   T N T r u e   N e g a t i v e
F P F a l s e   P o s i t i v e ,   F N F a l s e   N e g a t i v e
A c c u r a c y = T P + T N T P + F N + F P + T N
P r e c i s i o n = T P T P + F P
R e c a l l = T P T P + F N
F 1 s c o r e = 2 × T P 2 × T P + F N + F P
We add apple scab disease in both Top-5 and Top-8 experiments. To prove that, Evaluation metric scores for Top-5 leaves are listed in Table 2. The Table illustrates that the orange huanglongbing and peach bacterial spot scored well when compared to the other three leaves.
Similarly, Top-8 leaves are included in Table 2 with the evaluation metrics scores. In Top-8, corn common rust, grapevine measles, and orange huanglongbing were added in consideration of higher scores of Precisions, Recall, and F1-score. To check the efficiency of proposed model, we have also included different diseased and healthy leaves in each experiment stage. In this experiment setup, we repeatedly retained some of the leaf’s classes because of data sizes. Table 2 and Table 3 show that the orange huanglongbing constantly performs the same on both groups of leaves.
Table 4 proves that common corn rust and orange huanglongbing are being retained in all 3-stage leaf groups for steady performance.
The different groups with performance measurement results are displayed in Figure 6. The groups included top-5, top-8, and top-13 scores are the obtained results. The top-5 provide 0.98 precision, 0.99 recall, 0.99 F1-Score, and 0.99 accuracy results.
From top-8, it provides 0.99 precision, 0.99 recall, 0.99 F1-Score, and 0.99 accuracy results. Finally, top-13 provides 0.97 precision, 0.99 recall, 0.98 F1-Score, and 0.98 accuracy results.
Table 5, Table 6 and Table 7 illustrate the confusion matrix of Top-13 classes, Top-8 classes, and Top-5 classes. We described the result of the Top-13 classes confusion matrix in Table 7, which show that our model performs more effectively in solving different leaf disease. In addition, Table 5 and Table 6 demonstrate the model is effective for predicting small-sized leaf diseases, such as corn common rust. Sometimes, there is scanty misprediction in apple leaf diseases according to those confusion matrices with tolerable ranges. Although a few cherry leaves and apple leaves are similar, a negligible amount of miscalculation occurs within the apple leaves. Corn is the most significant food crop in India and plays a critical role in food production [41]. The latest study has investigated the leaf disease of corn using traditional machine learning classifiers with an accuracy of 79.23% [42].
We also add a misclassification for each class. Table 8 demonstrates the percentage of misclassification in the testing image number. We implemented the misclassification on produced each individual confusion matrix by collecting the False Positive and False Negative. From the result of False Positive and False Negative, we produced the F in Equation (13) and needed to add all the obtained values in the confusion matrix, such as True positive, True negative, False positive, and False negative, together to produce P in Equation (14). After finding both the F and P, we need to divide both to calculate the Percentage of Misclassification in Equation (15).
F = F P + F N
P = T P + T N + F P + F N
M i s c l a s s i f i c a t i o n = F P
This study also conducts the DICE coefficient method to understand the effects of image segmentation in the model. The DICE coefficient is a similarity metric that is one of the popular similarity measurements [43].
DSC = S T S T × 2
where S is the leaf disease with the image segmentation based on our network, and T is the ground truth resulting from manual segmentation in Equation (16). The average DICE coefficient reached 0.87 on the produced segmentation result.

4.4. Disease Degrees

To evaluate the 4 different stages of disease degrees, we utilize a traditional disease degree evaluation method to identify the disease proportion in the infected leaf image. The healthy-stage are disease free; Mild-stage has the small ring circle for at-least less than 5 mm diameter; Medium stage will have more than three spots of irregular frog-eye spot enlarging and Severe will have a heavily infected spots [17]. To identify the category, we feed the typical disease from top-13 leaf into the feature visualization of our model to see the infected area more precisely for separating of the disease degree classes. Each image from feature visualization is examined with the guidance of plant pathologist for dataset separation. In detail Apple black rot, Apple cedar rust, Apple healthy, Grape healthy, Grape esca, Corn Common rust, Corn healthy were used for training and testing with our model. The purpose of finding disease degree helps to restorative the plant from severe causes and spreading to the other area [5]. Table 9 show the accuracy. Most of the confused misclassification happened in the adjacent stages between mild and medium stage. It is concluded that using Channel–Spatial segmentation network can be used effectively to diagnosis different disease degree.

4.5. Comparison Study

We provide a comparative study with existing research techniques in Table 10. This Table exposes attention-based methods which surpassed other methods with good accuracy. The comparison study demonstrates that our model outperforms other studies in terms of accuracy. For this comparison, we have chosen similar work with the same size dataset. Strawberry Verticillium Wilt Detection Network experiments with their own dataset, which holds 3531 images in total [44]. Strawberry Verticillium Wilt Detection Network handles four categories from the dataset for detection. The majority of the leaf class in our dataset contains more than 2000 images. Finding and highlighting affected regions is important to gaining good classification accuracy. Attention-based models target to fetch important features, which helps to identify the diseased portion of the leaf [25]. Mostly, existing plant disease models predict the different categories of single leaves such as tomato leaf [13], cassava leaf [25], and citrus plant [3]. This study predicts leaf disease with different kinds of leaves, such as apple, cherry, corn, grapevine, and peach, with better accuracy. In particular, the citrus prediction system uses an end-to-end anchor-based deep learning model to predict huanglongbing with a precision of 91%, which is less than 9% of our proposed method. This shows that our proposed investigation outperforms some of the recent citrus-specialized studies. A recent specialized apple leaf study constructs a hybrid machine learning model for predicting apple leaf disease with an accuracy of 82.5% [45]. The limitation of the Hybrid machine learning model is less data (400 images). This investigation utilized 23% of the dataset, which is related to the apple leaves, and surpassed the apple-specialized study with more than 15% of accuracy. Comparatively, this study utilizes more data to train our model for handling leaf disease to produce a stable model. Moreover, to mention, we compared our work with Shengyi Zhao et al. [46] model because both models utilize attention mechanisms in common. Moreover, the accuracy of both models is nearly close to each other. So, we utilized the same plant disease to evaluate our model. Shengyi Zhao et al. utilize both corn and tomato leaf disease, but the author prioritizes tomato leaf disease in the model with an accuracy of 96.81%. So, we train the tomato leaf disease with our model. The received accuracy for the Tomato leaf diseases with our model is 97.83% with 50 epochs. So, the results prove that our model also performs well on major leaf diseases.

4.6. Expert’s Analysis

For the feature visualization of the Channel–Spatial attention model, we make use of grape black measles based on high performance in both Top-5 and Top-13, which is mentioned in Table 2 and Table 3. The feature visualization is shown in Figure 7.
Visual interpretation of Channel–Spatial attention model will be helpful in understanding how disease features were learned by each layer of the network architecture which is more useful to modify the network parameter to gain high accuracy by observing the error of the model. Feature visualization plays a vital role in separating the disease severity by the proposition of the occurred disease by the guidance of a plant pathologist. The input image of grape black measles disease in To ensure that, we took an opinion from Dr. Yi-Hsien Lin, who is working in the field of plant pathology. In the field of plant pathology, the traditional way is to use the naked eye to judge the percentage of disease and rate the indexes. According to Dr. Yi-Hsien Lin, Figure 8 shows that our proposed model provides a better understanding of the disease type in the affected area. Figure 8a is the real image of the corn rust disease. When disease occurs in the field, sometimes there are multiple diseases occurring at the same time, such as corn common rust and corn gray leaf spot, which will occur in corn leaf [52].
Therefore, it is very difficult to examine by using an imaging system to judge the degree of occurrence of a single disease. Taking this case as an example, the symptoms of this corn rust are very typical. Using this system, it can indeed be judged that the minute blue dots in Figure 8b are the uredinium which is usually reddish of hyphae and spore of a rust fungus. The fungal structure contains lots of uredospores formed by the rust fungus on the leaves. Therefore, the judgment of the image analysis is correct.

5. Conclusions

In this research approach, we have developed a deep learning model to identify the healthiness of diseased leaf types. We also accomplished a disease severity detection in the diseased leaf among the other existing self-attention mechanism. This research explores the importance of attention-based methods for handling disease detection and disease degrees on various leaves. The proposed study states that the attention-based approach is well suited for the leaf identification task when compared to the other approaches. We have provided the performance of our approach along with existing approaches for clear insights. Based on the results, the process of discriminating between the diseased and healthy parts needs key features and location details to improve the accuracy of leaf disease detection. This experiment confirms that the sequential arrangement of the attention mechanism suits the leaf disease detection task and disease degrees. This research includes the opinion of field experts to confirm the authenticity and application usage of our study. Our results and comparative study convey that this approach outperforms recent deep-learning techniques for leaf disease identification. In this study, we were able to find the affected leaf disease using the RGB image. Hyperspectral imaging will be used in a future investigation to identify the leaf disease just before it becomes severe.

Author Contributions

B.N. and C.-M.L., methodology; B.N., software; B.N., validation; C.-M.L. and B.L., data curation; J.-L.H. and A.S., formal analysis; B.N., visualization; B.N., writing—original draft preparation; C.-M.L., Y.-H.L. and J.-L.H., review; A.S., editing; C.-M.L. and B.L., funding acquisition; C.-M.L., supervision; B.N., A.S. and C.-M.L., investigation. All authors have read and agreed to the published version of the manuscript.

Funding

This work was supported by the National Taipei University of Technology-Shenzhen University Joint Research Program with grant number NTUT-SZU-110-02.

Institutional Review Board Statement

Not applicable.

Data Availability Statement

The data generated during and analyzed during the current study are available from the corresponding author upon reasonable request.

Conflicts of Interest

The authors declare no conflict of interest.

References

  1. Kumar, D.; Kalita, P. Reducing Postharvest Losses during Storage of Grain Crops to Strengthen Food Security in Developing Countries. Foods 2017, 6, 8. [Google Scholar] [CrossRef] [PubMed] [Green Version]
  2. Chakraborty, K.K.; Mukherjee, R.; Chakroborty, C.; Bora, K. Automated recognition of optical image based potato leaf blight diseases using deep learning. Physiol. Mol. Plant Pathol. 2022, 117, 101781. [Google Scholar] [CrossRef]
  3. Syed-Ab-Rahman, S.F.; Hesamian, M.H.; Prasad, M. Citrus disease detection and classification using end-to-end anchor-based deep learning model. Appl. Intell. 2022, 52, 927–938. [Google Scholar] [CrossRef]
  4. Raveau, R.; Fontaine, J.; Sahraoui, A.L.-H. Essential Oils as Potential Alternative Biocontrol Products against Plant Pathogens and Weeds: A Review. Foods 2020, 9, 365. [Google Scholar] [CrossRef] [PubMed] [Green Version]
  5. Gonçalves, J.P.; Pinto, F.A.; Queiroz, D.M.; Villar, F.M.; Barbedo, J.G.; Del Ponte, E.M. Deep learning architectures for semantic segmentation and automatic estimation of severity of foliar symptoms caused by diseases or pests. Biosyst. Eng. 2021, 210, 129–142. [Google Scholar] [CrossRef]
  6. FAO Yearbook; FAO: Rome, Italy, 2018; 32. [CrossRef]
  7. Harvey, C.A.; Rakotobe, Z.L.; Rao, N.S.; Dave, R.; Razafimahatratra, H.; Rabarijohn, R.H.; Rajaofara, H.; MacKinnon, J.L. Extreme vulnerability of smallholder farmers to agricultural risks and climate change in Madagascar. Philos. Trans. R. Soc. B Biol. Sci. 2014, 369, 20130089. [Google Scholar] [CrossRef] [Green Version]
  8. Richard, B.; Qi, A.; Fitt, B.D.L. Control of crop diseases through Integrated Crop Management to deliver climate-smart farming systems for low- and high-input crop production. Plant Pathol. 2022, 71, 187–206. [Google Scholar] [CrossRef]
  9. Kuwata, K.; Shibasaki, R. Estimating crop yields with deep learning and remotely sensed data. In Proceedings of the 2015 IEEE International Geoscience and Remote Sensing Symposium (IGARSS), Milan, Italy, 26–31 July 2015; pp. 858–861. [Google Scholar]
  10. Yalcin, H. An approximation for a relative crop yield estimate from field images using deep learning. In Proceedings of the 2019 8th International Conference on Agro-Geoinformatics (Agro-Geoinformatics), Istanbul, Turkey, 16–19 July 2019; pp. 1–6. [Google Scholar] [CrossRef]
  11. Pantazi, X.; Moshou, D.; Tamouridou, A. Automated leaf disease detection in different crop species through image features analysis and One Class Classifiers. Comput. Electron. Agric. 2019, 156, 96–104. [Google Scholar] [CrossRef]
  12. Simonyan, K.; Zisserman, A. Very deep convolutional networks for large-scale image recognition. arXiv 2014, arXiv:1409.1556. [Google Scholar] [CrossRef]
  13. Ahmad, I.; Hamid, M.; Yousaf, S.; Shah, S.T.; Ahmad, M.O. Optimizing Pretrained Convolutional Neural Networks for Tomato Leaf Disease Detection. Complexity 2020, 2020, 1–6. [Google Scholar] [CrossRef]
  14. Goncharov, P.; Ososkov, G.; Nechaevskiy, A.; Uzhinskiy, A.; Nestsiarenia, I. Disease detection on the plant leaves by deep learning. In International Conference on Neuroinformatics; Springer: Cham, Switzerland, 2018; pp. 151–159. [Google Scholar] [CrossRef]
  15. Elaraby, A.; Hamdy, W.; Alanazi, S. Classification of Citrus Diseases Using Optimization Deep Learning Approach. Comput. Intell. Neurosci. 2022, 2022, 1–10. [Google Scholar] [CrossRef]
  16. Wang, C.; Du, P.; Wu, H.; Li, J.; Zhao, C.; Zhu, H. A cucumber leaf disease severity classification method based on the fusion of DeepLabV3+ and U-Net. Comput. Electron. Agric. 2021, 189, 106373. [Google Scholar] [CrossRef]
  17. Wang, G.; Sun, Y.; Wang, J. Automatic Image-Based Plant Disease Severity Estimation Using Deep Learning. Comput. Intell. Neurosci. 2017, 2017, 1–8. [Google Scholar] [CrossRef] [Green Version]
  18. Trivedi, N.K.; Gautam, V.; Anand, A.; Aljahdali, H.M.; Villar, S.G.; Anand, D.; Goyal, N.; Kadry, S. Early Detection and Classification of Tomato Leaf Disease Using High-Performance Deep Neural Network. Sensors 2021, 21, 7987. [Google Scholar] [CrossRef]
  19. Pethybridge, S.J.; Nelson, S.C. Leaf Doctor: A New Portable Application for Quantifying Plant Disease Severity. Plant Dis. 2015, 99, 1310–1316. [Google Scholar] [CrossRef] [Green Version]
  20. Ji, M.; Wu, Z. Automatic detection and severity analysis of grape black measles disease based on deep learning and fuzzy logic. Comput. Electron. Agric. 2022, 193, 106718. [Google Scholar] [CrossRef]
  21. Ozguven, M.M.; Adem, K. Automatic detection and classification of leaf spot disease in sugar beet using deep learning algorithms. Phys. A Stat. Mech. Appl. 2019, 535, 122537. [Google Scholar] [CrossRef]
  22. Lilhore, U.K.; Imoize, A.L.; Lee, C.-C.; Simaiya, S.; Pani, S.K.; Goyal, N.; Kumar, A.; Li, C.-T. Enhanced Convolutional Neural Network Model for Cassava Leaf Disease Identification and Classification. Mathematics 2022, 10, 580. [Google Scholar] [CrossRef]
  23. Yin, C.; Zeng, T.; Zhang, H.; Fu, W.; Wang, L.; Yao, S. Maize Small Leaf Spot Classification Based on Improved Deep Convolutional Neural Networks with a Multi-Scale Attention Mechanism. Agronomy 2022, 12, 906. [Google Scholar] [CrossRef]
  24. Ren, S.; He, K.; Girshick, R.; Sun, J. Faster R-CNN: Towards Real-Time Object Detection with Region Proposal Networks. IEEE Trans. Pattern Anal. Mach. Intell. 2016, 39, 1137–1149. Available online: https://proceedings.neurips.cc/paper/2015/hash/14bfa6bb14875e45bba028a21ed38046-Abstract.html (accessed on 6 June 2016). [CrossRef] [Green Version]
  25. Ravi, V.; Acharya, V.; Pham, T.D. Attention deep learning-based large-scale learning classifier for Cassava leaf disease classification. Expert Syst. 2022, 39, e12862. [Google Scholar] [CrossRef]
  26. Woo, S.; Park, J.; Lee, J.Y.; Kweon, I.S. Cbam: Convolutional block attention module. In Proceedings of the European Conference on Computer Vision (ECCV), Munich, Germany, 8–14 September 2018; pp. 3–19. [Google Scholar]
  27. Hu, J.; Shen, L.; Sun, G. Squeeze-and-excitation networks. In Proceedings of the IEEE Conference on Computer Vision and Pattern Recognition, Salt Lake City, UT, USA, 18–22 June 2018; pp. 7132–7141. [Google Scholar]
  28. Ulutan, O.; Iftekhar AS, M.; Manjunath, B.S. Vsgnet: Spatial attention network for detecting human object interactions using graph convolutions. In Proceedings of the IEEE/CVF Conference on Computer Vision and Pattern Recognition, Seattle, WA, USA, 13–19 June 2020; pp. 13617–13626. [Google Scholar]
  29. Tang, Z.; Yang, J.; Li, Z.; Qi, F. Grape disease image classification based on lightweight convolution neural networks and channelwise attention. Comput. Electron. Agric. 2020, 178, 105735. [Google Scholar] [CrossRef]
  30. Karthik, R.; Hariharan, M.; Anand, S.; Mathikshara, P.; Johnson, A.; Menaka, R. Attention embedded residual CNN for disease detection in tomato leaves. Appl. Soft Comput. 2020, 86, 105933. [Google Scholar] [CrossRef]
  31. Mi, Z.; Zhang, X.; Su, J.; Han, D.; Su, B. Wheat Stripe Rust Grading by Deep Learning With Attention Mechanism and Images From Mobile Devices. Front. Plant Sci. 2020, 11, 558126. [Google Scholar] [CrossRef] [PubMed]
  32. Zhao, Y.; Sun, C.; Xu, X.; Chen, J. RIC-Net: A plant disease classification model based on the fusion of Inception and residual structure and embedded attention mechanism. Comput. Electron. Agric. 2022, 193, 106644. [Google Scholar] [CrossRef]
  33. Mäder, P.; Boho, D.; Rzanny, M.; Seeland, M.; Wittich, H.C.; Deggelmann, A.; Wäldchen, J.; Goslee, S. The Flora Incognita app—Interactive plant species identification. Methods Ecol. Evol. 2021, 12, 1335–1342. [Google Scholar] [CrossRef]
  34. Pethybridge, S.J.; Nelson, S.C. Estimate, a New iPad Application for Assessment of Plant Disease Severity Using Photographic Standard Area Diagrams. Plant Dis. 2018, 102, 276–281. [Google Scholar] [CrossRef]
  35. Abbas, A.; Jain, S.; Gour, M.; Vankudothu, S. Tomato plant disease detection using transfer learning with C-GAN synthetic images. Comput. Electron. Agric. 2021, 187, 106279. [Google Scholar] [CrossRef]
  36. Hughes, D.; Salathé, M. An open access repository of images on plant health to enable the development of mobile disease diagnostics. arXiv 2015, arXiv:1511.08060. [Google Scholar]
  37. Wang, B.; Huang, G.; Li, H.; Chen, X.; Zhang, L.; Gao, X. Cbam-Efficientnetv2-Enabled Fire Image Recognition Method in Detecting Tiny Targets; SSRN: Rochester, NY, USA, 2022. [Google Scholar] [CrossRef]
  38. Liang, Y.; Lin, Y.; Lu, Q. Forecasting gold price using a novel hybrid model with ICEEMDAN and LSTM-CNN-CBAM. Expert Syst. Appl. 2022, 206, 117847. [Google Scholar] [CrossRef]
  39. Li, X.; Wang, W.; Hu, X.; Yang, J. Selective kernel networks. In Proceedings of the IEEE/CVF Conference on Computer Vision and Pattern Recognition, Long Beach, CA, USA, 15–20 June 2019; pp. 510–519. [Google Scholar]
  40. Panigrahi, K.P.; Sahoo, A.K.; Das, H. A CNN approach for corn leaves disease detection to support digital agricultural system. In Proceedings of the 2020 4th International Conference on Trends in Electronics and Informatics (ICOEI), Tirunelveli, India, 15–17 June 2020; pp. 678–683. [Google Scholar] [CrossRef]
  41. Akanksha, E.; Sharma, N.; Gulati, K. OPNN: Optimized probabilistic neural network based automatic detection of maize plant disease detection. In Proceedings of the 2021 6th International Conference on Inventive Computation Technologies (ICICT), Coimbatore, India, 20–22 January 2021; pp. 1322–1328. [Google Scholar] [CrossRef]
  42. Panigrahi, K.P.; Das, H.; Sahoo, A.K.; Moharana, S.C. Maize leaf disease detection and classification using machine learning algorithms. In Progress in Computing, Analytics and Networking; Springer: Singapore, 2020; pp. 659–669. [Google Scholar] [CrossRef]
  43. Skourt, B.A.; El Hassani, A.; Majda, A. Lung CT Image Segmentation Using Deep Neural Networks. Procedia Comput. Sci. 2018, 127, 109–113. [Google Scholar] [CrossRef]
  44. Nie, X.; Wang, L.; Ding, H.; Xu, M. Strawberry Verticillium Wilt Detection Network Based on Multi-Task Learning and Attention. IEEE Access 2019, 7, 170003–170011. [Google Scholar] [CrossRef]
  45. Bracino, A.A.; Concepcion, R.S.; Bedruz RA, R.; Dadios, E.P.; Vicerra, R.R.P. Development of a Hybrid Machine Learning Model for Apple (Malus domestica) Health Detection and Disease Classification. In Proceedings of the 2020 IEEE 12th International Conference on Humanoid, Nanotechnology, Information Technology, Communication and Control, Environment, and Management (HNICEM), Manila, Philippines, 3–7 December 2020; pp. 1–6. [Google Scholar] [CrossRef]
  46. Zhao, S.; Peng, Y.; Liu, J.; Wu, S. Tomato Leaf Disease Diagnosis Based on Improved Convolution Neural Network by Attention Module. Agriculture 2021, 11, 651. [Google Scholar] [CrossRef]
  47. Storey, G.; Meng, Q.; Li, B. Leaf Disease Segmentation and Detection in Apple Orchards for Precise Smart Spraying in Sustainable Agriculture. Sustainability 2022, 14, 1458. [Google Scholar] [CrossRef]
  48. Albattah, W.; Nawaz, M.; Javed, A.; Masood, M.; Albahli, S. A novel deep learning method for detection and classification of plant diseases. Complex Intell. Syst. 2022, 8, 507–524. [Google Scholar] [CrossRef]
  49. Paymode, A.S.; Malode, V.B. Transfer Learning for Multi-Crop Leaf Disease Image Classification using Convolutional Neural Network VGG. Artif. Intell. Agric. 2022, 6, 23–33. [Google Scholar] [CrossRef]
  50. Ashwinkumar, S.; Rajagopal, S.; Manimaran, V.; Jegajothi, B. Automated plant leaf disease detection and classification using optimal MobileNet based convolutional neural networks. Mater. Today: Proc. 2022, 51, 480–487. [Google Scholar] [CrossRef]
  51. Wang, P.; Niu, T.; He, D. Tomato Young Fruits Detection Method under Near Color Background Based on Improved Faster R-CNN with Attention Mechanism. Agriculture 2021, 11, 1059. [Google Scholar] [CrossRef]
  52. Markell, S.G.; Tylka, G.L.; Anderson, E.J.; Esse, H.P. Developing public–private partnerships in Plant Pathology extension: Case studies and opportunities in the United States. Annu. Rev. Phytopathol. 2020, 58, 161–180. [Google Scholar] [CrossRef]
Figure 1. Sample images of the dataset. (A) apple black rot, (B) apple cedar rust, (C) apple healthy, (D) apple scrab, (E) cherry healthy, (F) cherry powdery mildew, (G) corn grey leaf spot, (H) corn common rust, (I) corn healthy, (J) grapevine measles, (K) grapevine healthy, (L) orange huanglongbing, (M) peach bacterial spot, (N) peach healthy.
Agriculture 12 01886 g001
Figure 2. Visual architecture of proposed model.
Agriculture 12 01886 g002
Figure 3. Channel Attention Mechanism.
Agriculture 12 01886 g003
Figure 4. Spatial attention mechanism.
Agriculture 12 01886 g004
Figure 5. Graphs of the performance of the loss function (a) and the accuracy (b) of the Top-13 classes.
Agriculture 12 01886 g005
Figure 6. Difference in each group’s evaluation metrics.
Agriculture 12 01886 g006
Figure 7. Visualizing the Convolutional Kernel of Grape disease. (a,b) shows the features of the first layer of the network. Subsequently, extracted features edges are started to focus on the grape black measles disease. Moreover, (c,d) is the second and third layer of the network, which displays the affected area. In (e,f) is the last two-layer which represents the most relevant feature details of the disease.
Agriculture 12 01886 g007
Figure 8. Minute-scale detection in Diseased leaf. (a) is corn rust disease and (b) is uredinium which is usually reddish of hyphae and spore of a rust fungus.
Agriculture 12 01886 g008
Table 1. Hyper Parameter used in proposed method.
LayersOutput Shapes Layer 1Output Shapes Layer 2Output Shapes Layer 3Output Shapes Layer 4
conv2d_4 (Conv2D) (256, 256, 32) (128, 128, 32) (64, 64, 64) (32, 32, 128)
activation_5 (Activation) (256, 256, 32) (128, 128, 32) (64, 64, 64) (32, 32, 128)
max_pooling2d_4 (128, 128, 32) (64, 64, 64) (32, 32, 64) (16, 16, 128)
batch_normalization_5 (128, 128, 32) (64, 64, 64) (32, 32, 64) (16, 16, 128)
dropout_5 (128, 128, 32) (64, 64, 64) (32, 32, 64) (16, 16, 128)
channel_attention_4 (128, 128, 32) (64, 64, 64) (32, 32, 64) (16, 16, 128)
Table 2. Evaluation metrics of Top-5 leaves.
Types of LeavesPrecisionRecallF1-Score
Orange Huanglongbing1.001.001.00
Peach Bacterial Spot1.001.001.00
Apple Black Rot1.000.980.99
Apple Healthy0.951.000.98
Apple Scrab1.000.970.98
Accuracy 0.99
Macro Avg0.990.990.99
Weighted Avg0.990.990.99
Table 3. Evaluation metrics scores of Top-8 leaves.
Types of LeavesPrecisionRecallF1-Score
Corn Common Rust1.001.001.00
Grapevine Measles1.001.001.00
Orange Huanglongbing1.001.001.00
Peach Bacterial Spot1.000.990.99
Apple Black Rot1.000.991.00
Apple Cedar Rust1.000.991.00
Apple Healthy0.971.000.99
Apple Scrab0.990.980.99
Accuracy 0.99
Macro Avg1.000.991.00
Weighted Avg0.990.990.99
Table 4. Evaluation metric scores of Top-13 leaves.
Types of LeavesPrecisionRecallF1-Score
Cherry Powdery Mildew 1.000.970.98
Cherry Healthy0.991.000.99
Corn Grey Leaf Spot1.001.001.00
Corn Common Rust1.001.001.00
Corn Healthy1.001.001.00
Grapevine Measles1.001.001.00
Grapevine Healthy0.801.000.89
Orange Huanglongbing1.001.001.00
Peach Bacterial Spot0.961.000.98
Peach Healthy1.001.001.00
Apple Black Rot1.000.990.99
Apple Cedar Rust1.000.920.96
Apple Healthy0.960.990.98
Accuracy 0.98
Macro Avg0.980.980.98
Weighted Avg0.980.980.98
Table 5. Confusion matrix of top-5 classes.
Orange Huanglongbing840000
Peach Bacterial Spot096000
Apple Black Rot0029250
Apple Healthy0003020
Apple Scrab00010294
Orange HuanglongbingPeach Bacterial SpotApple Black RotApple HealthyApple Scrab
Table 6. Confusion matrix of top 8 classes.
Corn Common Rust760000000
Grapevine Measles063000000
Orange Huanglongbing008400000
Peach Bacterial Spot000950010
Apple Black Rot0000295002
Apple Cedar Rust0000023820
Apple Healthy0000003020
Apple Scrab0000005299
Corn Common RustGrapevine MeaslesOrange HuanglongbingPeach Bacterial SpotApple Black RotApple Cedar RustApple HealthyApple Scrab
Table 7. Confusion matrix of 13 classes.
Cherry Powdery Mildew112000001000003
Cherry Healthy07400000000000
Corn Gray Leaf Spot00690000000000
Corn Common Rust00076000000000
Corn Healthy00005800000000
Grapevine Measles00000630000000
Grapevine Healthy00000039000000
Orange Huanglongbing00000008400000
Peach Bacterial Spot 00000000960000
Peach Healthy00000000072000
Apple Black Rot 010000200029400
Apple Cedar Rust000000504012219
Apple Healthy000000200000300
Cherry Powdery MildewCherry HealthyCorn Gray Leaf SpotCorn Common RustCorn HealthyGrapevine MeaslesGrapevine HealthyOrange HuanglongbingPeach Bacterial SpotPeach HealthyApple Black RotApple Cedar RustApple Healthy
Table 8. Misclassification.
ClassesFPFN T P + T N + F P + F N   Percentage
of Misclassification
Top-13 class131515861.76%
Top-8 class5514620.68%
Top-5 class51010831.3%
Table 9. Accuracy of Disease Degree.
Disease TypeDisease DegreeAchieved Accuracy
Apple Cedar RustMild0.87
Medium0.89
Severe0.95
Apple Black RotMild0.85
Medium0.85
Severe0.90
Apple HealthyHealthy0.98
Grape EscaMild0.87
Medium0.89
Severe1.00
Grape HealthyHealthy0.90
Corn Common RustMild0.86
Medium0.88
Severe1.00
Corn HealthyHealthy0.99
Table 10. Comparison study with the existing methods.
SourceMethodsDatasetPlants/ClassesAttentionAccuracy
Gary Storey et al., 2022 [47] R-CNNPlant Pathology challenge 20202 classes of disease in apple and pearNo80.5%
Sharifah Farhana Syed-Ab-Rahman et al., 2022 [3]Deep CNN modelCitrus disease3 classes of disease in citrus plantNo94.37%
Waleed Albattah et al., 2022 [48]SVM classifierPlantVillage Dataset from Kaggle14 classes of the plant diseaseNo98.01%
Ananda S. Paymode et al., 2022 [49]CNN-based VGGPlantVillage Dataset19 classes of disease in tomato and grapes plantNo98.40%
Ashwin Kumar et al., 2022 [50]OMNCNNTomato leaf diseases4 classes of disease in tomato plantNo98.92%
Vinayakumar Ravi et al., 2021 [25]Attention approach with CNN pre-trained modeliCassava 2019 dataset4 classes of disease in cassava leaf diseasesYes95%
Chenghai Yin et al., 2022 [23]CNN with Multi-Scale Attention MechanismMaize dataset5 classes of disease in maize plantYes97.12%
Karthik R et al., 2020 [30]Attention-embedded residual CNNPlantVillage Dataset3 classes of disease in tomato plantYes98%
Peng Wang et al., 2021 [51]Faster R-CNN with Attention Mechanismagricultural digital greenhouse of Northwest 3 different time periods in young tomato fruitsYes98.46%
Zhen Tang et al., 2020 [29]Channelwise Attention ModelPlantVillage Dataset4 classes of plant disease and healthy leavesYes99.14%
Shengyi Zhao et al., 2021 [46]Improvised CNN with Attention ModelPlantVillage Dataset10 classes of disease in tomato plantYes99.24%
Yun Zhao et al., 2021 [32] Embedded modified CBAMPlantVillage Dataset3 classes of corn, potato, and tomatoYes99.55%
Proposed ModelAttention ModelPlantVillage Dataset14 classes different plants disease and healthy leavesYes99.76%
Xuan Nie et al., 2019 [44]SVWDN Attention mechanismStrawberry disease dataset4 classes of disease in strawberry leavesYes99.95%
Publisher’s Note: MDPI stays neutral with regard to jurisdictional claims in published maps and institutional affiliations.

