Article

Nutrient Composition and Growth of Yellow Mealworm (Tenebrio molitor) at Different Ages and Stages of the Life Cycle

by
Odunayo A. Toviho
1,2,* and
Péter Bársony
1
1
Institute of Animal Science, Biotechnology and Nature Conservation, Faculty of Agricultural and Food Sciences and Environmental Management, University of Debrecen, 4032 Debrecen, Hungary
2
Doctoral School of Animal Science, University of Debrecen, 4032 Debrecen, Hungary
*
Author to whom correspondence should be addressed.
Agriculture 2022, 12(11), 1924; https://doi.org/10.3390/agriculture12111924
Submission received: 28 October 2022 / Revised: 10 November 2022 / Accepted: 12 November 2022 / Published: 15 November 2022
(This article belongs to the Special Issue New and Alternative Feeds, Additives, and Supplements)

Abstract

:
The nutrient composition of yellow mealworm (YM) Tenebrio molitor varies based on the stages of the life cycle, the rearing conditions, and the feeding substrate. This study monitored the growth of yellow mealworm larvae at 8, 10, and 12 weeks of age, separating samples into large-sized and small-sized insects. During the experiment, we measured the nutrient composition: dry matter (DM), crude protein (CP), crude fat (CF), crude fibre, chitin, crude ash, and nitrogen free extract (NFE) of YM at different age groups and sizes. We measured the nutrient composition of the pre-moult, moult, cuticle, and pupae as well. The results show that there is no significant difference between the compositions of the different age groups, but larger-sized individuals had a higher DM and crude fibre and lower chitin and NFE than the smaller sizes. The pre-moult and moult stages showed no significant difference in nutrient composition. Although the cuticle had a high DM (97.5%), that did not cause any significant difference between the DM of the moult and pre-moult, because it is only a negligible part of the total wet weight. With the increased DM, the crude protein content and the chitin content, fibre, ash content, and NFE increased, while the fat content decreased. The DM, CF, and chitin contents of pupae are significantly lower than those of the pre-moult and moult stages. Our results show that it is the size and not the age that has a positive effect on the nutrient composition of YM.

1. Introduction

Insects show the highest diversity with more than 1 million species described, representing more than 90% of animal life forms on the Earth [1]. A definitive figure of edible insects worldwide is difficult to ascertain, but there are about 2100 edible insect species [2,3].
As far back as 1975, the use of insects as human food and animal feed was suggested by Meyer-Rochow (1975) [4], although entomophagy has been here with us since time immemorial [5]. Since the publication in 1975, interest in insects as food and feed has risen [6]. It is generally accepted that insects are the protein source of the future, because they can be produced with less environmental impact compared to conventional protein sources (fishmeal, soymeal, rapeseed meal, and cottonseed meal) [7].
Regulations of the production and utilisation of insects and insect meal vary globally [8], but one of the strictest regulations can be found in the EU. In 2017, the EU approved the use of seven insect species in pet food and aquafeed (Commission Regulation (EU) 2017/893 of 24 May 2017) and in 2021 these insects were approved also for the poultry and pig sectors (Commission Regulation (EU) 2021/882 of 1 June 2021) [9,10].
Compared to traditional feed protein sources, the sustainability of insects is relatively high due to their rapid reproduction, high growth rates, feed conversion efficiency, minimal environmental impact, and their ability to utilise various substrates as feed. Insects are also nutritious, with a high protein content, carbohydrates, fatty acids, some vitamins, and minerals such as calcium, iron, or zinc [11,12,13,14,15].
Yellow mealworm (Tenebrio molitor L. 1758, Coleoptera: Tenebrionidae) is the most widely bred and traded insect species in Europe [16,17,18]. The Eastern Mediterranean region seems to be the origin of the T. molitor species, although it is currently present in various regions worldwide due to colonisation and trade. Farmed yellow mealworms are usually fed on wheat flour or bran, although they are omnivorous [19]. This omnivorous species has a rapid growth, minimal breeding requirements, and it is easy to handle [20]. It is also important to note that Tenebrio molitor is the only one of the seven species that has been allowed for marketing as a novel food (Commission Regulation (EU) 2021/1372 of 17 August 2021) [21].
Given the high nutritional and commercial value of YM, the agricultural industry has considerable interest in its mass production. Research has shown that the nutrient profile of mealworm meal is similar to that of soybean meal, making it a suitable replacement of soybean meal and other conventional protein sources in animal feed [18,22,23]. YM meal does not only serve as a protein source but has also been indicated to be a functional feed source that improves the immune response, hence the resistance to invading pathogens [5,20,23,24]. This is due to the presence of polysaccharides in the chitin content that have immune-modulatory functions in animals [25].
There are wide variations in the nutritional content among insects, which can be attributed to several factors, such as the processing method, insect life stage, and insect feed [26]. For example, in 2020, Gascol et al. examined mealworms from three different production process and found a wide variation in the protein, fat, ash, and crude fibre content [27]. The type of method applied for insect meal processing (full fat or fat extracted meal) and the temperature of processing are some of the factors that can cause differences in the nutrient composition of insect meals [27]. The life stage of the insects can also cause differences in the nutrient composition because of several complex mechanisms, such as the need to build up muscle, or the sedentary or active nature of the life cycle stage [26]. The feeding substrate of insects affects their nutrient composition and can be used to modify the nutrient composition, such as the fat content and fatty acid composition [28]. YM larvae reared on wheat bran showed a higher protein yield, lower fat, higher linoleic acid, and higher mineral content compared to those grown on oat and barley sprout [29].
One of the biggest questions about the utilisation of insect meal in the feed industry is its chitin content. Although, because of its functional benefits, chitin is a valuable nutrient component of insects, it has been stigmatised as an anti-nutritional factor and non-digestible fibre [30]. However, studies have demonstrated that it can be utilised by organisms that produce chitinolytic enzymes, such as humans, fish, poultry, and swine [30,31,32]. The functional benefit of chitin was proven by the use of deacetylated chitin from cricket as a media supplement. The chitosan-supplemented media were inoculated with salmonella thypi and probiotic bacteria (Lactobacillus fermentum, Lactobacillus acidophilus, and Bifidobacterium adolescentis); there was a significant decreased in the population of pathogenic bacteria and significant increase in population of probiotic bacteria [33].
Research shows that the nutrient composition of insects varies based on several factors. One of them is the stage of the insect’s life cycle [26]. This research aims at determining whether age and size had any impact on the nutrient composition within the same stage of the life cycle of the yellow mealworm (YM). We investigated the changes in the nutrient composition of pre-moult mealworm, moulted mealworm, cuticle, and pupae as well. We assumed that the chitin content of the larger YM would be less than that of the smaller YM at the same age. We also assumed that the chitin content of newly moulted YM would be lower than that of the pre-moult. These will be significant for the production of YM as this information will provide a guide for an optimal harvesting.

2. Materials and Methods

2.1. Sample

The mealworms used for this experiment were obtained from the rearing system setup at the Aquaculture Laboratory of the University of Debrecen. The mealworms and darkling beetles were kept in a transparent container (30.5 × 25 × 15 cm). The temperature was maintained at 20–23 °C. The eggs were collected from the darkling beetle box every 2 weeks. Three different batches were maintained for this experiment. The YM stocks used in this experiment were uniform. The weeks of age were counted from the 21st day after the egg’s collection, when there was visible activity in the rearing box.
During the whole experiment, all the stocks received the same feed. The feed consisted of a mixture of semolina, flour, and oat flakes in equal part and the same quantity in each rearing box. Potatoes, carrots, and apples were used as the water sources. The feed was replaced every 2 weeks and the vegetables were replaced every 2 days to prevent moulding. The duration of the YM development is given below (Table 1).
Samples were collected at weeks 8, 10, and 12. The YM were separated by the size into large-sized and small-sized groups by passing them through a sieve (mesh 10; diameter: 2 mm) at week 8. The ones that passed through were considered small, while the ones that remained in the sieve were the large ones. The large- and small-sized groups were maintained in separate containers. All the samples were collected in 3 replicates; throughout the sample collection, 200 pcs of each group were counted and weighed to determine the average body weight. The samples of pre-moult mealworms, newly moulted mealworms, cuticles, and pupae were collected at week 12. We determined the body mass/surface area ratio by measuring the length and circumference of 50 mealworms from each group for the calculation of the surface area. The samples were stored at −20 °C until the analysis. Table 2 shows the sample collection schedule.

2.2. Measurement Procedure

The dry material was determined in a gravimetric measurement after drying [34]. The weight was determined as an average of the two measurements. The crude protein content was determined according to the Kjeldahl method [34]. The total crude fat was determined gravimetrically after the acid hydrolysis and solvent extraction [34]. The crude fibre was determined by the Fibertec method (FOSS, Hilleroed, Denmark) according to ISO 6865:2000 [35]
The chitin was determined according to Hahn et al. [36] as a subtraction of the acid detergent lignin content (ADL) from the acid detergent fibre (ADF) that were both measured by the gravimetric method according to the ISO 13906:2008 standard method [37]. The samples were defatted by a hexane solvent extraction and ground into a particle size < 0.5 mm as the sample’s preparation.
A total of 1 g of the defatted sample was suspended in 100 mL of 0.5 mol/L H2SO4 and 20 g/L of cetyl trimethylammonium bromide (CTAB) and boiled under reflux for 1 h. The suspension was transferred to a fritted disc crucible and filtered under a vacuum. The retentate was then suspended in 50 mL of 80 °C demineralised water for 5 min. The suspension was filtered under a vacuum and the washing step was repeated two times. An additional washing step with 50 mL of acetone was also done twice. The sample was dried and weighted. The ADF content was expressed as the percentage of the mass fraction of the dry defatted biomass relative to the applied dry mass before the process of the lipid extraction.
After the determination of the ADF, the residuum was treated further with 12 mol/L of H2SO4 for 3 h, then it was filtered under a vacuum and washed with water. After drying and weighting the residuum, it was cremated at 525 ± 15 °C in an incineration furnace and weighted again for the ADL calculation [36]. The chitin content was obtained by a subtraction of the ADL content from the calculated ADF value and expressed as the chitin of the dry weight of the insect larvae.
The crude ash was determined gravimetrically [34]. The NFE was calculated by subtracting the sum of the DM, CP, CF, fibre, and ash content from 100.

2.3. Statistical Analysis

The results were analysed with IBM SPSS 22.0 (Armonk, NY, USA). The homogeneity of the data was checked by Levene test. A one-way analysis of variance (ANOVA) Tukey test (p < 0.05) was used to evaluate the results of the growth. The mean values of the nutrient composition were compared using a univariate analysis of variance Tukey test (p < 0.05).

3. Results

3.1. Growth of Yellow Mealworm

3.1.1. Overall Growth of Yellow Mealworm

Table 3 shows the changes in the weights and percentage increase in the weight of the YM during the experiment. Although there is a steady weight increase in the weight of 8- 10- and 12-week-old insects, the only significant difference was found between week 10 and week 12.

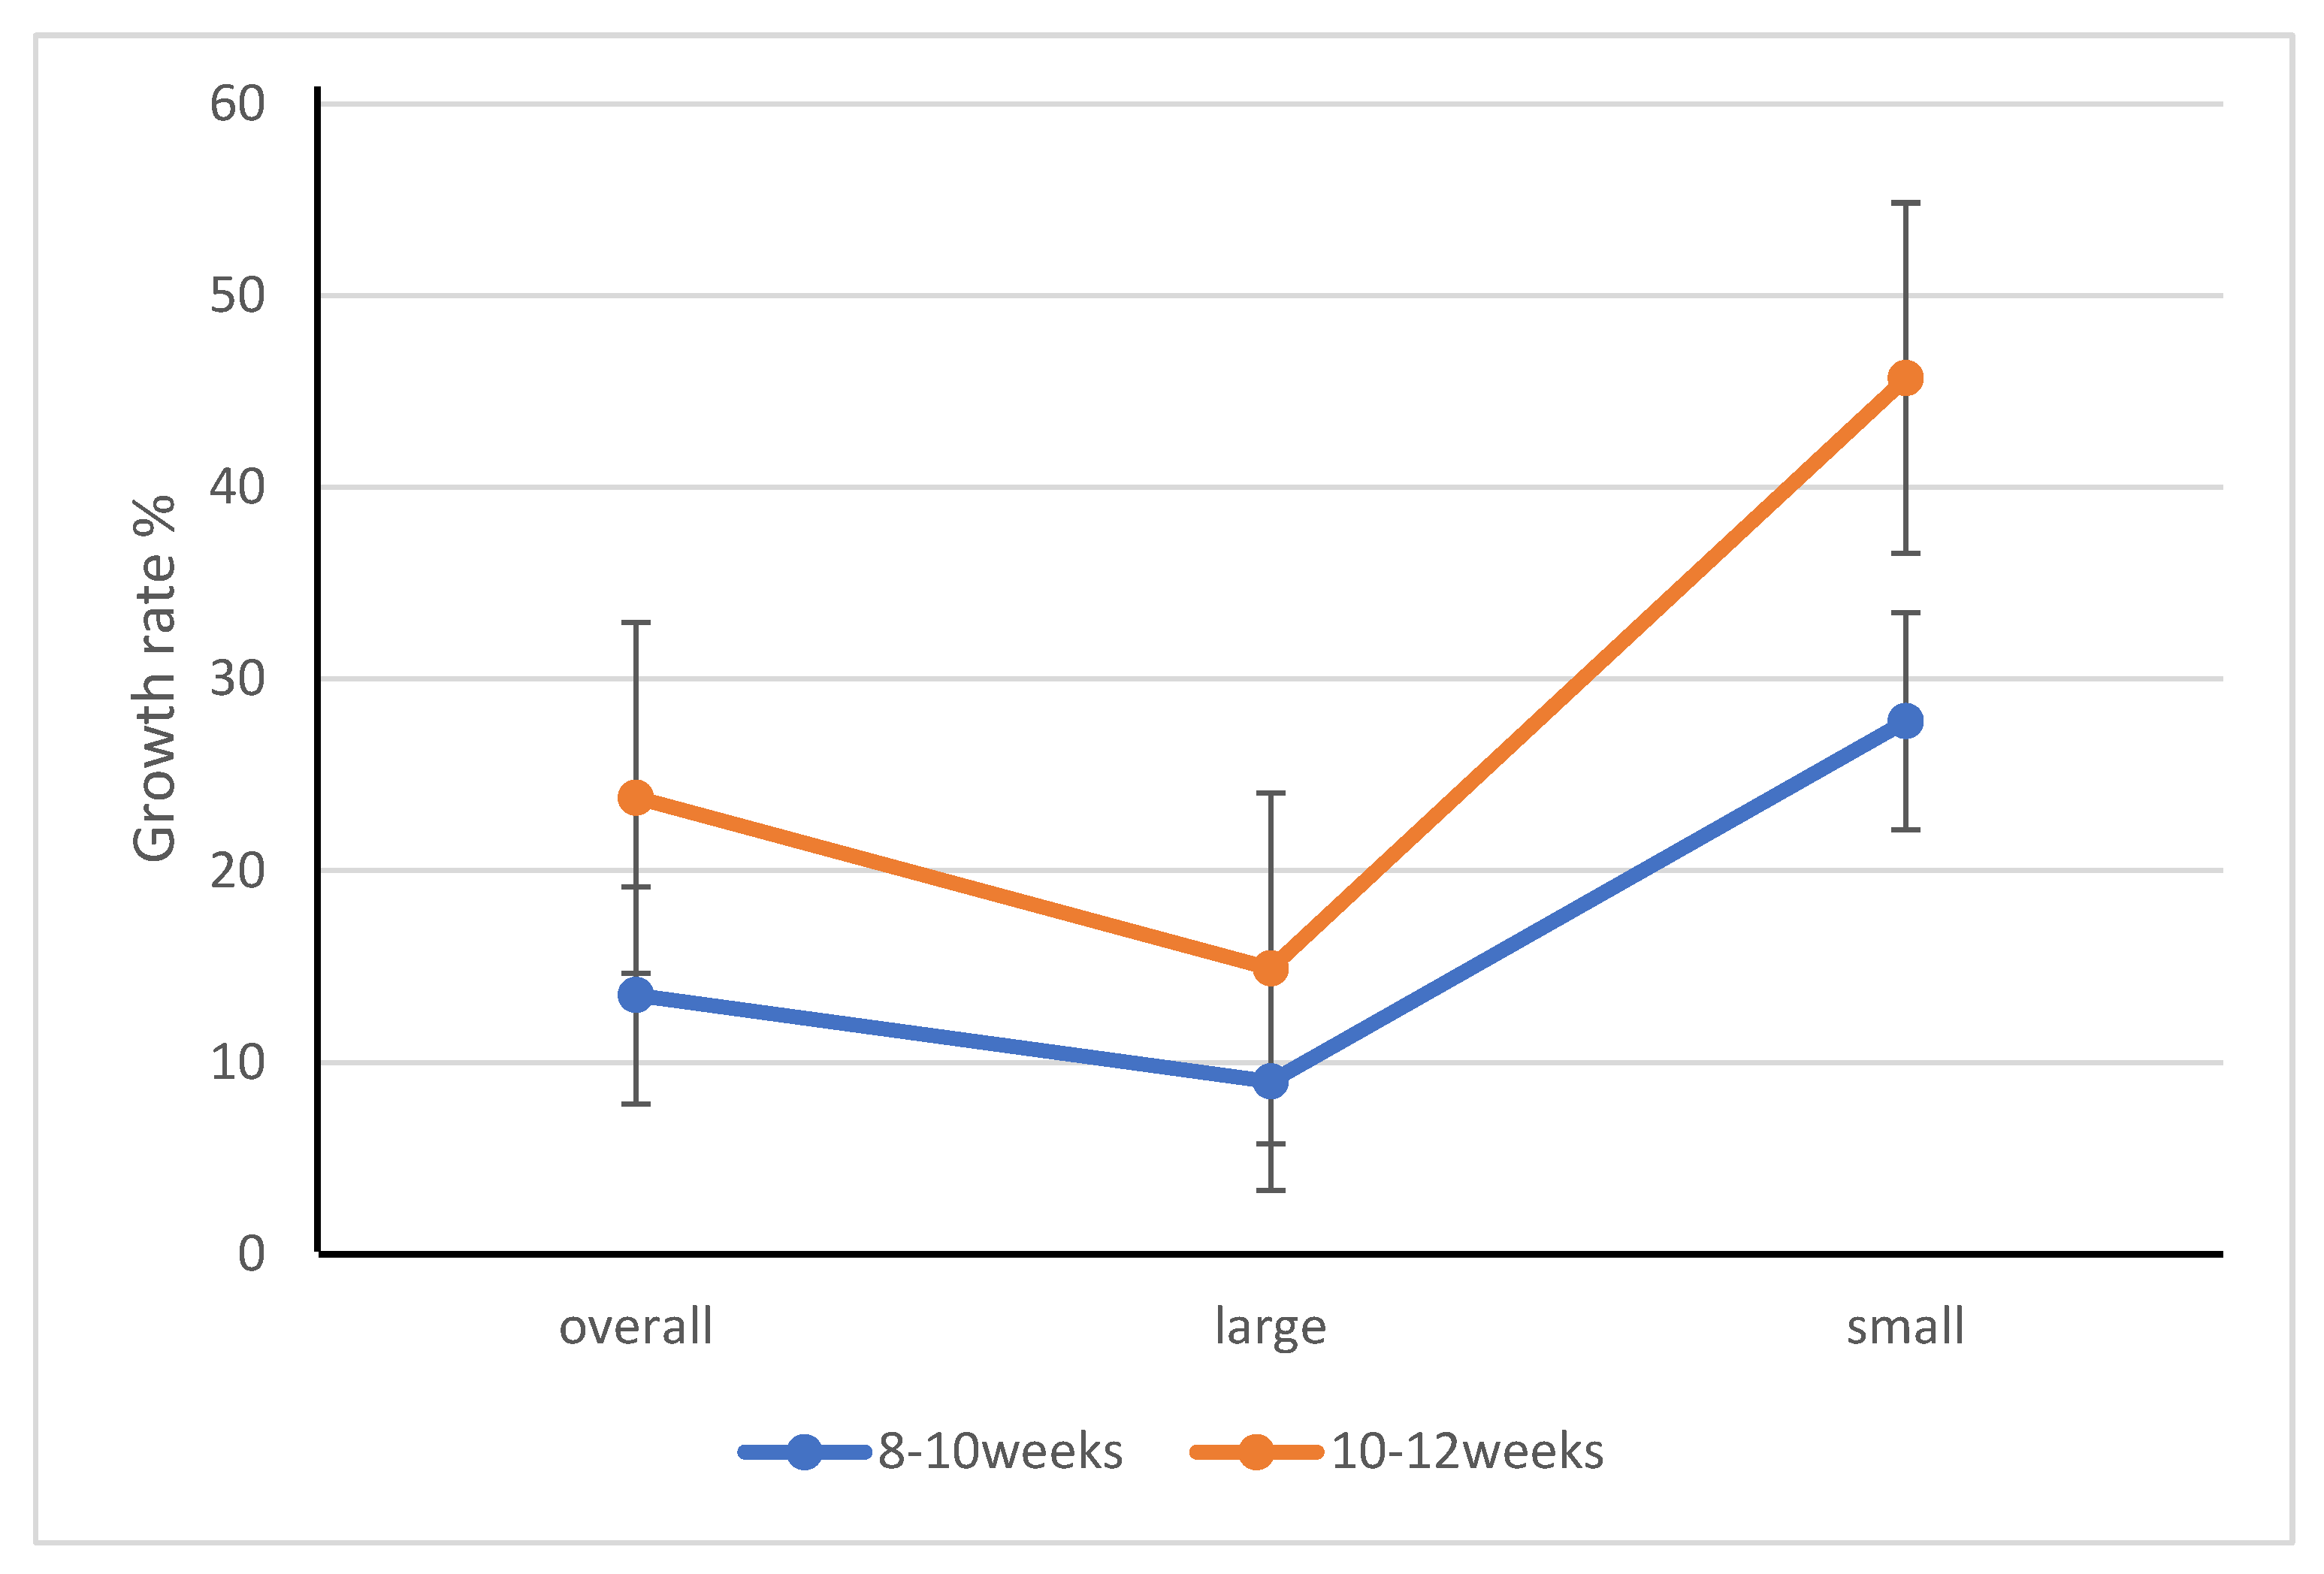
3.1.2. Growth of Different Age and Size Groups of Yellow Mealworm

Table 4 shows the growth of two sizes of mealworms (large and small) and the weight increase percentage. While at the start of the measurements (week 8) there was an almost three-fold difference in the average body weight between the two groups (large: 0.111 g; small: 0.036 g), at the end of the experiment it was reduced to slightly more than a two-fold difference (large: 0.139 g; small: 0.067 g).
Large YM shows the lowest growth rate (9%), while small YM showed the highest growth rate. Between weeks 8 and 10, the weight of the mealworms increased by only 13.5%, while there was a 23.8% increase between week 10 and week 12 (Figure 1).

3.2. Surface Area/Body Mass Ratio, Length and Width of Yellow Mealworm at Week 12

Table 5 shows the surface area/body mass ratio (SA:BM), length, and width of yellow mealworms at week 12. The SA:BM ratio is higher at the small-sized mealworms, but there was no statistical difference between the ratios of large- and small-sized worms. The average length of the large-sized mealworm stock was significantly higher than that of the small-sized stock, but no significant difference was found between the width values.

3.3. Nutrient Composition

3.3.1. Nutrient Composition at Different Ages

The nutrient compositions of YM at different ages are shown in Table 6. The dry matter content, fat content, chitin, and NFE decreased, while the crude protein fibre and ash increased with the ages.
The dry matter content, fat content, and chitin content decreased, while the protein content increased with the age both at the large- and the small-sized mealworms (Table 7). Significant differences can be observed between the sizes and not the ages. The dry matter contents of the large yellow mealworms were always significantly higher than those of the small-sized groups, independently of the age, but the chitin contents and NFE of the small-sized groups showed a significantly higher value. The ash content of the large-sized mealworm is consistently higher than the small-size in all ages. There is no noticeable trend in the NFE in all samples.

3.3.2. Nutrient Composition of Yellow Mealworm at Different Development Stages and Nutrient Composition of the Cuticle

Nutrient compositions of yellow mealworms at the different development stages are shown in Table 8. The pupa stage showed a lower dry matter, crude fat, and chitin content compared to the moult and pre-moult stages. These differences in the dry matter, crude fat, and chitin contents of the pupae were significant. All the nutrient components measured were higher for the pre-moult compared to the moult, but no statistical differences were found. The nutrient composition of the cuticle was totally different from that of the three development stages. The dry matter content was much higher (97.5%) and contained more crude protein, fibre, chitin, ash, and NFE but much less crude fat than the mealworms at any stage.

4. Discussion

4.1. Growth

Considering the overall growth, although there was an increase in the growth among each age group, the growth was statistically different only between week 10 and week 12. This shows that, in order to harvest a significantly higher amount of biomass, it is better to wait until week 12 of the development. Additionally, in terms of the size growth across the age groups, waiting until week 12 for the harvesting of the biomass will bring advantages, because only the 12-week-old larvae show a statistically higher weight compared with the 8-week-old ones. The small-sized larvae almost doubled in weight from week 8 to week 12 (86.1%), while the weight of the large-sized ones increased only by 25.2% from week 8 to week 12. This shows that over time, the differences in weight between the small and large sized individuals are reduced. Consequently, week 12 is also the optimal harvesting time for the small sized larvae. In our experiment, the average body weight of large-sized YM was in the upper range of the average body weight of 0.040–0.111 g, as was reported in another study. Although their experiment ended at week 9, the study reported achieving a 0.134 g weight, which our study achieved only by week 12; this could be explained by the difference in the feed. Their study reared YM on industrial residue (chicken feed, rapeseed meal, wheat bran and willow leaf sunflower residues). The weight observed at week 8 of that study was similar (0.075 g) to the weight that we achieved at week 8 [38].

4.2. Nutrient Composition

4.2.1. Nutrient Composition Based on Age and Size

When examining the DM, CP, CF, fibre, chitin ash content, and NFE contents, the nutrient composition of the mealworms showed no significant difference among the age groups. The DM content observed was slightly higher than the 32.2% reported by Jones et al. in 1972, but the 36.5% reported by Yi et al. in 2013 falls within the range of the DM content we observed [39,40]. The ash content observed is higher than what was reported by the studies of Finke in 2002, while the NFE we observed is lower than what was reported by the same study [41]. Contrary to this, the ash content measured in our study was lower, while the NFE was higher than those reported by Ghosh et al. [6]
The CP value observed in this study was lower than the 46% and 49% reported by Ravzanaadii et al. in 2012, and Finke in 2002, respectively. The CP content of 52% reported by Jones et al. in 1972, Yi et al. in 2013, and Zhao et al. in 2016 is higher than what we could obtain in our results. Each of the above cited studies reported higher protein contents, but we can see that at the same time, they measured lower chitin contents (15% and 8.5% by Finke in 2002, and Jones et al. in 1972, respectively). This can be attributed to an overlapping amino acid content between the chitin part and the crude protein. This could be a potential overestimation of the bioavailable amino acids [38,39,40,41,42,43,44]. The protein content and ash content measured in our studies generally showed an increase with age, while the fat reduced with age, which is consistent with the results of Meyer-Rochow et al., 2021 [26].
The chitin content measurement revealed a higher chitin content than the 15% shown in the study conducted by Hahn et al. in 2017. The difference between the chitin contents reported in our current study and in that of Hahn et al. in 2017 could have resulted from the different environmental conditions and feeding, as the methods of the chitin’s measurement were the same. Although the chitin content was higher than the 5.6% reported by Finke in 2007, this difference could be due to the difference in the chitin measurement methods. The study adjusted the ADF for the amino acid content to determine the estimated chitin content instead [44]. It showed that amino acids represented 10% to 55% of the ADF [36,39,40,41,42,43,44].
The CF measured in our experiment was within the range described by Finke in 2002. However, the fat content was higher than the values of 35.4% and 32.9% reported by Jones et al. in 1972 and Zhao et al. in 2016, respectively, which could be due to the different feeding and environmental conditions. The YM used in the study of Jones and Zhao were sourced from a commercial insect farm, while the study of Zhoa fed wheat, wheat bran, and carrot; there is no available data on the feed used in the study of Jones [36,39,40,41,42,43,44].
The CP and CF values of the different size groups did not show significant differences, unlike the DM, fibre, chitin and NFE, which differed significantly. The DM and fibre were higher in the large-sized group than the small-sized ones, while the chitin content and NFE of the smaller sizes was higher than that of the larger ones. This can be attributed to the smaller size having a higher surface area/body mass ratio, while the larger size individuals have a lower surface area/body mass ratio. This means that the proportion of the exoskeleton is higher in the smaller size than the larger size. This presents the opportunity to increase the DM and reduce the chitin content by increasing the average body weight at harvesting.
The ash content was lower than the 4.9% and 4.0% reported by Zhao et al. and Ghosh et al., respectively, but higher than the 2.4% reported by Finke [6,43,44]

4.2.2. Nutrient Composition Based on the Developmental Stages and of the Cuticle

When considering the nutrient compositions of the moult and pre-moult, the DM, CP, and the chitin values were not significantly different. The fat content, however, was an exemption as it was higher for the pre-moult. The lack of difference between the moult and the pre-moult further buttresses the point made by Finke in 2002, claiming that the sclerotization of protein is more important than chitin in determining the physical characteristics of the insects’ cuticle [44]. The lack of significant differences between the dark brown pre-moult and the white newly moulted YM suggest that there is no advantage in using ecdysterone to synchronise the moulting [45].
The pupae, however, show significant differences in the DM, CF, and chitin values, which are lower than those observed in the moult and pre-moult stages, while the CP values remain relatively consistent across the three stages, showing no significant differences. This could be explained by the fact that the pupal stage is a stage where the YM does not feed. Little quantitative data exist concerning the chitin contents of whole insects. However, Cauchie (2002) [46] reported that the aquatic insect larvae contained 2.9 to 10.1% chitin on a dry weight basis [41,47]. The lower fat content in pupae as compared to the larvae is consistent with the result of Dreasi et al. in 2017 who compared the fat content of YM raised on six different diets. The pupae showed a consistently lower fat content than the larvae, except in two instances [28].
The DM content in the cuticle was high, which was self-evident, as most of the moisture content is locked in the body of the larvae and protected by the fat present in the cuticle. This, however, did not affect the DM of the pre-moult and moult, because the cuticle represents only a negligible part (0.4%) of the total weight of the larvae. With the increased DM the crude protein content and the chitin content, the fibre, ash content, and NFE increased, while the fat content decreased. Our result was consistent with the findings of the literature, pointing out that the major component of the insect cuticle consists mainly of chitin and protein [48,49].

5. Conclusions

This study shows that there is no significant difference in the composition of YM larvae of different age groups. Our results show that the size has an effect on the DM, fibre chitin contents, and NFE, therefore, by exploring feed substrates that can cause a rapid increase in the average body weight, insect farmers can achieve a shorter production time, a higher dry matter content, a lower chitin content, and a lower NFE, and ultimately a better digestibility. The higher DM and lower chitin content of large-sized larvae, compared with the lower DM and higher chitin content of small-sized ones, indicates an inverse relationship between the DM and chitin. The difference in the chitin content is in line with our hypothesis that the higher the surface area/body mass ratio, the higher the chitin content.

Author Contributions

Conceptualization, P.B.; methodology, software, O.A.T. validation, P.B.; formal analysis, O.A.T.; investigation, P.B. and O.A.T.; resources P.B. and O.A.T.; data curation, O.A.T.; writing—original draft preparation, O.A.T.; writing—review and editing, P.B. and O.A.T.; visualization, P.B.; supervision, P.B.; project administration, P.B.; funding acquisition, P.B. and O.A.T. All authors have read and agreed to the published version of the manuscript.

Funding

This research received no external funding.

Institutional Review Board Statement

Not applicable.

Informed Consent Statement

Not applicable.

Data Availability Statement

Data from this study are contained within the article.

Acknowledgments

The authors are grateful to the Doctoral school of Animal science, University of Debrecen. We are also grateful to all the reviewers for their detailed comments and suggestion to make the manuscript better.

Conflicts of Interest

The authors declare no conflict of interest.

Abbreviations

YMYellow mealworm
DMDry matter content
CPCrude protein
CFCrude fat
ADFAcid detergent fibre
ADLAcid detergent lignin
SASurface area
BMBody mass
NFENitrogen free extract

References

  1. Stork, N.E. How many species of insects and other terrestrial arthropods are there on Earth? Annu. Rev. Entomol. 2018, 63, 31–45. [Google Scholar] [CrossRef] [PubMed] [Green Version]
  2. Mitsuhashi, J. Edible Insects of the World; CRC Press: Boca Raton, FL, USA, 2017. [Google Scholar]
  3. Jongema, Y. List of Edible Insect Species of the World. Wageningen, Laboratory of Entomology, Wageningen University. 2017. Available online: https://www.wur.nl/en/Research-Results/Chair-groups/Plant-Sciences/Laboratory-of-Entomology/Edible-insects/Worldwide-species-list.htm (accessed on 14 September 2021).
  4. Meyer-Rochow, V.B. Can insects help to ease the problem of world food shortage? Search 1975, 6, 261–262. [Google Scholar]
  5. Bodenheimer, F.S. Insects as Human Food. In Insects as Human Food: A Chapter of the Ecology of Man; Bodenheimer, F.S., Ed.; W. Junk: Hague, The Netherlands, 1951; pp. 7–38. [Google Scholar]
  6. Ghosh, S.; Lee, S.M.; Jung, C.; Meyer-Rochow, V.B. Nutritional composition of five commercial edible insects in South Korea. J. Asia-Pac. Entomol. 2017, 20, 686–694. [Google Scholar] [CrossRef]
  7. Lange, K.W.; Nakamura, Y. Edible insects as future food: Chances and challenges. J. Future Foods 2021, 1, 38–46. [Google Scholar] [CrossRef]
  8. Lahteenmaki-Uutela, A.; Grmelová, N.; Hénault-Ethier, L.; Deschamps, M.H.; Vandenberg, G.W.; Zhao, A.; Zhang, Y.; Yang, B.; Nemane, V. Insects as food and feed: Laws of the European Union, United States, Canada, Mexico, Australia, and China. Eur. Food Feed L. Rev. 2017, 12, 22. [Google Scholar]
  9. Commission Implementing Regulation (EU) 2017/2469 of 20 December 2017 Laying Down Administrative and Scientific REQUIREMENTS for Applications Referred to in Article 10 of Regulation (EU) 2015/2283 of the European Parliament and of the Council on Novel Foods. Available online: https://eur-lex.europa.eu/legal-content/EN/TXT/?uri=CELEX%3A32017R2469 (accessed on 31 August 2021).
  10. Commission Implementing Regulation (EU) 2021/882 of 1 June 2021 Authorising the Placing on the Market of Dried Tenebrio molitor Larva as a Novel Food under Regulation (EU) 2015/2283 of the European Parliament and of the Council, and Amending Commission Implementing Regulation (EU) 2017/2470 (Text with EEA Relevance) (OJ L 194 01.06.2021), p. 16. Available online: http://data.europa.eu/eli/reg_impl/2021/882/oj (accessed on 31 August 2021).
  11. Araújo, R.R.S.; dos Santos Benfica, T.A.R.; Ferraz, V.P.; Santos, E.M. Nutritional composition of insects Gryllus assimilis and Zophobas morio: Potential foods harvested in Brazil. J. Food Compos. Anal. 2019, 76, 22–26. [Google Scholar] [CrossRef]
  12. Tubin, J.S.B.; Paiano, D.; de Oliveira Hashimoto, G.S.; Furtado, W.E.; Martins, M.L.; Durigon, E.; Emerenciano, M.G.C. Tenebrio molitor meal in diets for Nile tilapia juveniles reared in biofloc system. Aquaculture 2020, 519, 734763. [Google Scholar] [CrossRef]
  13. Van Huis, A. Potential of insects as food and feed in assuring food security. Annu. Rev. Entomol. 2013, 58, 563–583. [Google Scholar] [CrossRef]
  14. Józefiak, D.; Józefiak, A.; Kierończyk, B.; Rawski, M.; Świątkiewicz, S.; Długosz, J.; Engberg, R.M. Insects—A natural nutrient source for poultry—A review. Ann. Anim. Sci. 2016, 16, 297–313. [Google Scholar] [CrossRef] [Green Version]
  15. Motte, C.; Rios, A.; Lefebvre, T.; Do, H.; Henry, M.; Jintasataporn, O. Replacing fish meal with defatted insect meal (Yellow Mealworm Tenebrio molitor) improves the growth and immunity of pacific white shrimp (Litopenaeus vannamei). Animals 2019, 9, 258. [Google Scholar] [CrossRef] [Green Version]
  16. Caparros Megido, R.; Alabi, T.; Larreché, S.; Alexandra, L.; Haubruge, E.; Francis, F. Risks and valorization of insects in a food and feed context. Int. J. Entomol. 2015, 51, 215–258. [Google Scholar]
  17. Bordiean, A.; Krzyżaniak, M.; Stolarski, M.J.; Czachorowski, S.; Peni, D. Will yellow mealworm become a source of safe proteins for Europe? Agriculture 2020, 10, 233. [Google Scholar] [CrossRef]
  18. EFSA Panel on Nutrition, Novel Foods and Food Allergens (NDA); Turck, D.; Castenmiller, J.; De Henauw, S.; Hirsch-Ernst, K.I.; Kearney, J.; Maciuk, A.; Mangelsdorf, I.; McArdle, H.J.; Naska, A.; et al. Safety of dried yellow mealworm (Tenebrio molitor larva) as a novel food pursuant to Regulation (EU) 2015/2283. EFSA J. 2021, 19, e06343. [Google Scholar] [PubMed]
  19. Grau, T.; Vilcinskas, A.; Joop, G. Sustainable farming of the mealworm Tenebrio molitor for the production of food and feed. Z. Nat. C 2017, 72, 337–349. [Google Scholar] [CrossRef] [PubMed]
  20. Sankian, Z.; Khosravi, S.; Kim, Y.; Lee, S. Effects of dietary inclusion of yellow mealworm (Tenebrio molitor) meal on growth performance, feed utilization, body composition, plasma biochemical indices, selected immune parameters, and antioxidant enzyme activities of mandarin fish (Siniperca scherzeri) juveniles. Aquaculture 2018, 496, 79–87. [Google Scholar]
  21. Commission Regulation (EU) 2021/1372 of 17 August 2021 Amending Annex IV to Regulation (EC) No 999/2001 of the European Parliament and of the Council as Regards the Prohibition to Feed Non-Ruminant Farmed Animals, Other than fur Animals, with Protein Derived from Animals. Available online: https://eur-lex.europa.eu/legal-content/EN/TXT/HTML/?uri=OJ:L:2021:295:TOC (accessed on 16 March 2022).
  22. Jeong, S.; Khosravi, S.; Yoon, K.; Kim, K.; Lee, B.; Hur, S.; Lee, S. Mealworm, Tenebrio molitor, as a feed ingredient for juvenile olive flounder, Paralichthys olivaceus. Aquac. Rep. 2021, 20, 100747. [Google Scholar] [CrossRef]
  23. Su, J.; Gong, Y.; Cao, S.; Lu, F.; Han, D.; Liu, H.; Jin, J.; Yang, Y.; Zhu, X.; Xie, S. Effects of dietary Tenebrio molitor meal on the growth performance, immune response, and disease resistance of yellow catfish (Pelteobagrus fulvidraco). Fish Shellfish. Immunol. 2017, 69, 59–66. [Google Scholar] [CrossRef]
  24. Ido, A.; Hashizume, A.; Ohta, T.; Takahashi, T.; Miura, C.; Miura, T. Replacement of fish meal by defatted yellow mealworm (Tenebrio molitor) larvae in diet improves growth performance and disease resistance in red seabream (Pargus major). Animals 2019, 9, 100. [Google Scholar] [CrossRef] [Green Version]
  25. Govorushko, S. Global status of insects as food and feed source: A review. Trends Food Sci. Technol. 2019, 91, 436–445. [Google Scholar] [CrossRef]
  26. Meyer-Rochow, V.B.; Gahukar, R.T.; Ghosh, S.; Jung, C. Chemical composition, nutrient quality, and acceptability of edible insects are affected by species, developmental stage, gender, diet, and processing method. Foods 2021, 10, 1036. [Google Scholar] [CrossRef]
  27. Gasco, L.; Józefiak, A.; Henry, M. Beyond the protein concept: Health aspects of using edible insects on animals. J. Insects Food Feed. 2020, 7, 715–741. [Google Scholar] [CrossRef]
  28. Dreassi, E.; Cito, A.; Zanfini, A.; Materozzi, L.; Botta, M.; Francardi, V. Dietary fatty acids influence the growth and fatty acid composition of the yellow mealworm Tenebrio molitor (Coleoptera: Tenebrionidae). Lipids 2017, 52, 285–294. [Google Scholar] [CrossRef] [PubMed]
  29. Jajić, I.; Krstović, S.; Petrović, M.; Urošević, M.; Glamočić, D.; Samardžić, M.; Popović, A.; Guljaš, D. Changes in the chemical composition of the yellow mealworm (Tenebrio molitor L.) reared on different feedstuffs. J. Anim. Feed. Sci. 2022, 31, 191–200. [Google Scholar] [CrossRef]
  30. Tabata, E.; Kashimura, A.; Wakita, S.; Ohno, M.; Sakaguchi, M.; Sugahara, Y.; Yoshihiro, K.; Vaclav, M.; Bauer, P.O.; Oyama, F. Gastric and intestinal proteases resistance of chicken acidic chitinase nominates chitin-containing organisms for alternative whole edible diets for poultry. Sci. Rep. 2017, 7, 6662. [Google Scholar] [CrossRef] [PubMed]
  31. Kawasaki, K.; Osafune, T.; Tamehira, S.; Yano, K. Piglets can secrete acidic mammalian chitinase from the pre weaning stage. Sci. Rep. 2021, 11, 1297. [Google Scholar] [CrossRef] [PubMed]
  32. Paoletti, M.G.; Norberto, L.; Damini, R.; Musumeci, S. Human gastric juice contains chitinase that can degrade chitin. Ann. Nutr. Metab. 2007, 51, 244–251. [Google Scholar] [CrossRef] [PubMed]
  33. Kipkoech, C.; Kinyuru, J.N.; Imathiu, S.; Meyer-Rochow, V.B.; Roos, N. In vitro study of cricket chitosan’s potential as a prebiotic and a promoter of probiotic microorganisms to control pathogenic bacteria in the human gut. Foods 2021, 10, 2310. [Google Scholar] [CrossRef]
  34. AOAC. Official Methods of Analysis, 17th ed.; Methods 955.04, 922.06, 973.18, 930.15; The Association of Official Analytical Chemists: Gaithersburg, MD, USA, 2000. [Google Scholar]
  35. ISO 6865:2000; Animal Feeding Stuffs—Determination of Crude Fibre Content—Method with Intermediate Filtration. International Organization for Standardization: Geneva, Switzerland, 2000.
  36. Hahn, T.; Roth, A.; Febel, E.; Fijalkowska, M.; Schmitt, E.; Arsiwalla, T.; Zibek, S. New methods for high-accuracy insect chitin measurement. J. Sci. Food Agric. 2018, 98, 5069–5073. [Google Scholar] [CrossRef]
  37. ISO 13906:2008; Animal Feeding Stuffs—Determination of Acid Detergent Fibre (ADF) and Acid Detergent Lignin (ADL) Contents. International Organization for Standardization: Geneva, Switzerland, 2008.
  38. Bordiean, A.; Krzyżaniak, M.; Stolarski, M.J.; Peni, D. Growth Potential of Yellow Mealworm Reared on Industrial Residues. Agriculture 2020, 10, 599. [Google Scholar] [CrossRef]
  39. Jones, L.; Cooper, R.; Harding, R. Composition of mealworm Tenebrio molitor larvae. J. Zoo Anim. Med. 1972, 3, 34–41. [Google Scholar] [CrossRef]
  40. Yi, L.; Lakemond, C.M.; Sagis, L.M.; Eisner-Schadler, V.; van Huis, A.; van Boekel, M.A. Extraction and characterisation of protein fractions from five insect species. Food Chem. 2013, 141, 3341–3348. [Google Scholar] [CrossRef] [PubMed]
  41. Finke, M.D. Complete nutrient composition of selected invertebrates commonly fed to insectivores. Zoo Biol. 2002, 21, 269–285. [Google Scholar] [CrossRef]
  42. Ravzanaadii, N.; Kim, S.H.; Choi, W.H.; Hong, S.J.; Kim, N.J. Nutritional value of mealworm, Tenebrio molitor as food source. Int. J. Ind. Entomol. 2012, 25, 93–98. [Google Scholar] [CrossRef] [Green Version]
  43. Zhao, X.; Vázquez-Gutiérrez, J.L.; Johansson, D.P.; Landberg, R.; Langton, M. Yellow mealworm protein for food purposes-extraction and functional properties. PLoS ONE 2016, 11, 0147791. [Google Scholar] [CrossRef] [PubMed]
  44. Finke, M.D. Estimate of chitin in raw whole insects. Zoo Biol. Publ. Affil. Am. Zoo Aquar. Assoc. 2007, 26, 105–115. [Google Scholar] [CrossRef]
  45. Subramanian, S.; Shankarganesh, K. Chapter 20—Insect Hormones (as Pesticides). In Ecofriendly Pest Management for Food Security; Academic Press: Cambridge, MA, USA, 2016; pp. 613–650. ISBN 9780128032657. [Google Scholar] [CrossRef]
  46. Cauchie, H.M. Chitin production by arthropods in the hydrosphere. Hydrobiologia 2002, 470, 63–95. [Google Scholar] [CrossRef]
  47. Klasing, K.C. Comparative Avian Nutrition; Cab International: Wallingford, UK, 1998. [Google Scholar]
  48. Tajiri, R. Cuticle itself as a central and dynamic player in shaping cuticle. Curr. Opin. Insect Sci. 2017, 19, 30–35. [Google Scholar] [CrossRef]
  49. Mondotte, J.A.; Saleh, M.C. Antiviral immune response and the route of infection in Drosophila melanogaster. Adv. Virus Res. 2018, 100, 247–278. [Google Scholar]
Figure 1. Shows the growth rate of YM.
Agriculture 12 01924 g001
Table 1. The duration of mealworm development during the experiment.
EggLarvaePupaeBug
Days 1–2122–105106–114115–198
Survival Rate %-98.998.7-
Table 2. Sample collection schedule of the different sizes and life stages of mealworm.
Larvae (Small)Larvae
(Large)
Moulted Pre-MoultPupaeCuticle
Week 8xxxx
Week 10xxxx
Week 12
All samples were collected in triplicates. ✓ Collected. x Not collected.
Table 3. Yellow mealworm overall average weight (g).
Week 8Week 10Week 12
Weight0.074 ± 0.006 a0.084 ± 0.005 a0.104 ± 0.007 b
Means in the same row with different superscripts differ significantly (p < 0.05).
Table 4. Average weight by size and age (g) of the yellow mealworm.
Week 8Week 10Week 12
Large 0.111 ± 0.007 a0.121 ± 0.009 ab0.139 ± 0.009 b
Small 0.036 ± 0.008 c0.046 ± 0.005 c0.067 ± 0.015 d
Means with no common letters in their superscript differ significantly (p < 0.05).
Table 5. Average surface area (SA)/body mass (BM) ratio, length, and width of yellow mealworm at week 12.
Large Small
SA:SB1:55 ± 9 a1:62 ± 24 a
Length (cm)2.7 ± 0.20 a1.9 ± 0.10 b
Width (cm)0.4 ± 0.05 a0.3 ± 0.05 a
Means in the same row with different superscript differ significantly (p < 0.05). SA: surface area. BM: body mass.
Table 6. Average nutrient composition of yellow mealworm at different ages (%).
Week 8Week 10Week 12
DM37.42 ± 1.33 a37.27 ± 1.88 a36.57 ± 1.47 a
Crude protein43.35 ± 0.67 a44.72 ± 2.16 a44.93 ± 1.75 a
Crude Fat39.47 ± 0.61 a38.02 ± 1.68 a37.85 ± 1.78 a
Crude fibre11.30 ± 0.0411.38 ± 0.0511.52 ± 0.06
Chitin22.73 ± 1.00 a22.25 ± 1.07 a21.68 ± 1.03 a
Crude ash3.64 ± 0.05 a3.66 ± 0.06 a3.68 ± 0.05 a
NFE2.29 ± 0.03 a2.26 ± 0.13 a2.10 ± 0.10 a
Means in the same row with different superscripts differ significantly (p < 0.05).
Table 7. Average nutrient composition of yellow mealworm at different ages and sizes (%).
Week 8Week 10Week 12
LargeSmallLargeSmallLargeSmall
DM38.60 ± 0.30 a36.23 ± 0.40 b38.53 ± 1.60 a36.00 ± 1.22 b37.50 ± 1.13 a35.63 ± 1.25 b
Crude
Protein
43.70 ± 0.50 a43.00 ± 0.70 a45.23 ± 2.57 a44.20 ± 2.06 a45.13 ± 2.38 a44.73 ± 1.34 a
Crude fat39.60 ± 0.53 a39.33 ± 0.77 a38.10 ± 2.00 a37.93 ± 1.74 a37.80 ± 2.23 a37.90 ± 1.71 a
Fibre11.53 ± 0.61 a11.00 ± 0.10 b11.83 ± 0.15 a10.93 ± 0.25 b12.13 ± 0.25 a10.90 ± 0.26 b
Chitin21.93 ± 0.56 b23.53 ± 0.50 a21.40 ± 0.61 b23.10 ± 0.55 a 20.87 ± 0.58 b22.50 ± 0.56 a
Crude ash3.65 ± 0.08 a3.62 ± 0.05 a3.64 ± 0.05 a3.62 ± 0.05 a3.64 ± 0.01 a3.60 ± 0.06 a
NFE1.52 ± 0.03 b3.05 ± 0.10 a1.2 ± 0.01 b3.32 ± 0.09 a1.3 ± 0.13 b2.87 ± 0.02 a
Means in the same row with different superscripts differ significantly (p < 0.05).
Table 8. Average nutrient compositions of YM at different development stages and average nutrient composition of the cuticle (%).
Pre-MoultMoultPupaeCuticle
DM40.15 ± 0.14 b39.13 ± 0.98 b37.12 ± 0.11 c97.5 ± 1.32 a
Crude protein44.18 ± 0.03 b43.97 ± 0.02 b44.00 ± 0.08 b53.40 ± 0.17 a
Crude fat39.38 ± 0.03 a39.29 ± 0.01 a38.25 ± 0.04 b12.20 ± 0.13 c
Crude fibre10.53 ± 0.03 b10.82 ± 0.02 b11.9 ± 0.06 b19.8 ± 0.21 a
Chitin23.82 ± 0.01 b23.65 ± 0.03 b23.42 ± 0.04 c35.60 ± 0.26 a
Ash3.66 ± 0.04 b3.65 ± 0.02 b3.62 ± 0.05 b9.8 ± 0.19 a
NFE2.25 ± 0.03 b2.27 ± 0.02 b2.23 ± 0.03 b4.4 ± 0.20 a
Means in the same row with different superscripts differ significantly (p < 0.05).
Publisher’s Note: MDPI stays neutral with regard to jurisdictional claims in published maps and institutional affiliations.

