Article

Potential Global Distribution of Invasive Alien Species, Anthonomus grandis Boheman, under Current and Future Climate Using Optimal MaxEnt Model

1
Collage of Plant Science & Technology of Huazhong Agricultural University, Wuhan 430070, China
2
State Key Laboratory for Biology of Plant Diseases and Insect Pests, Institute of Plant Protection, Chinese Academy of Agricultural Science, Beijing 100193, China
3
Fujian Key Laboratory for Technology Research of Inspection and Quarantine, Technology Centre of Fuzhou Customs, Fuzhou 350001, China
4
Western Agricultural Research Center, Chinese Academy of Agricultural Sciences, Changji 831100, China
*
Authors to whom correspondence should be addressed.
Agriculture 2022, 12(11), 1759; https://doi.org/10.3390/agriculture12111759
Submission received: 18 September 2022 / Revised: 4 October 2022 / Accepted: 17 October 2022 / Published: 25 October 2022
(This article belongs to the Section Crop Protection, Diseases, Pests and Weeds)

Abstract

:
The boll weevil, Anthonomus grandis Boheman (Coleoptera: Curculionidae), is an invasive alien species that can damage cotton plants and cause huge economic losses in the cotton industry. Currently, A. grandis is mainly distributed in the American continent. However, few studies have indicated the distribution and modification of its suitable global habitats after undergoing climate change. Based on the 339 distribution records of A. grandis and eight bioclimatic variables, we used the optimal MaxEnt model to predict the potential global distribution of A. grandis under the current (1970–2000) and future climatic scenarios (SSP5-8.5). The annual mean temperature (bio1) and isothermality (bio3) were the two most important bioclimatic variables, which indicates that the survival of A. grandis is extremely sensitive to temperature fluctuations. Under the current scenario, the highly suitable habitats were mainly distributed in America (the USA, Mexico, Brazil, Argentina, Paraguay, and Uruguay), Africa (South Africa, Ethiopia, and Mozambique), Asia (Pakistan, India, Thailand, Burma, and China), and Oceania (Australia). In future scenarios (SSP5-8.5), the potential suitable global habitats reached the highest level in America, Africa, Asia, and Oceania in the 2090s. Our study provides a meaningful reference for researchers, quarantine officers, and governments to devise suitable management control strategies for A. grandis.

1. Introduction

Biological invasion is a serious threat to biodiversity worldwide and is among the most significant drivers of global food security and change within ecosystems and societies [1,2,3,4]. Invasive alien species (IAS), including insects, plants, and other organisms that are invasive to the new ecosystem, cause economic and environmental harm and worsen public health worldwide. Over the past 200 years, rapid climate warming and globalization have exacerbated the invasion and spread the risks of IAS worldwide [5]. From 1970 to 2017, total economic losses worldwide caused by IAS amounted to at least USD 1.288 trillion [6,7]. Weevils can have a significant impact on crop production. For instance, Rhynchophorus ferrugineus has caused great losses in the palm plantation industry in Middle Eastern countries; Lissorhoptrus oryzophilus is considered a great threat to all rice production regions in the temperate zone [8,9]. Currently, L. oryzophilus and R. ferrugineus are considered quarantine pests, as listed in “A1 List of pests recommended for regulation” and “A2 List of pests recommended for regulation” by the European and Mediterranean Plant Protection Organization (EPPO), respectively.
The boll weevil, Anthonomus grandis Boheman (Coleoptera: Curculionidae), is native to southern Mexico and has spread to the south of the USA (1892), Venezuela (1949), Colombia (1951), Brazil (1983), Paraguay (1991), Argentina (1993), and Bolivia (1997) [10,11]. Cotton is the main host for boll weevils, such as Gossypium barbadense, Gossypium hirsutum, and wild Gossypium species. [12]. In spring, the reproductive structures of cotton can be damaged by boll weevils [13]. They usually feed upon and lay eggs inside flower buds, where hatched larvae feed and pupate, causing abscission or reduction in fiber quality [14,15]. In the USA, boll weevils affect the economic and social welfare of Americans more than any other insect [16]. These pests have become one of the most costly cotton pests, with losses of over 8% of the total annual cotton production, and annual pest control averaging at USD 75 million [17]. In Brazil, significant economic losses, amounting to USD 51–74 million annually, have been caused by the invasion of boll weevils [18]. Therefore, considering the substantial economic losses caused by this invasive pest, A. grandis has been recommended as an A1 quarantine pest by the EPPO. In some continents and countries without A. grandis invasion, such as in Europe and China, this pest has been listed as a quarantine species [12]. However, most studies have focused on the biological characteristics or control measures of this pest [14,19,20], and few have discussed the potential suitable habitats of A. grandis. The extensive spread of A. grandis in the American Continent is a significant threat to agricultural production in regions of high economic importance for cotton production. Therefore, predicting the potential global geographical distribution of A. grandis can help to establish early dispersal warning networks worldwide.
Many studies have indicated that species distribution models (SDM) can be used to project the potential distribution of species by fitting abiotic (climatic and geographic data) and biotic factors (natural occurrence site coordinates of a species) [21,22,23]. The model is an effective tool for monitoring IAS because it can identify ranges that might be suitable or unsuitable ranges for the IAS [24,25]. These models include ANU-CLIM/BIOCLIM, CLIMATE, CLIMEX, DOMAIN, GARP, HABITATS, and MaxEnt [26,27,28]. Among these models, MaxEnt has been identified as one of the best predic-tive methods when only presence data are available [29]. Using this method, it is pos-sible to estimate the similarity of climatic conditions at any site to sites with known species distribution coordinates [30]. MaxEnt can also make predictions or inferences from incomplete information, such as presence-only data. The underlying aim of MaxEnt is to determine correlations between species occurrence and background points from spatial environmental variables to make projections about the suitability of habitat regions for a species to occur [28]. MaxEnt allows for the exploration of the effects of climate change on the future distribution of target species and offers useful insights into possible colonization behavior [31,32,33]. Overall, compared to other SDMs, the MaxEnt model is more reliable at predicting potentially suitable habitats of IAS [32,33]. However, when applying the MaxEnt model with default parameters, it is easy to cause model overfitting. Therefore, we used the ‘ENMeval’ package in R software to optimize the parameters of the MaxEnt model [34].
We used the optimal MaxEnt model based on global distribution records and related bioclimatic variables to analyze four specific objectives: (1) analyze model precision and determine important bioclimatic variables, (2) predict the potential suitable habitat distribution of A. grandis under current and future climatic conditions, (3) describe changes in potentially suitable habitats of A. grandis in each continent between the current and future climates, and (4) identify the trend of centroid shifts of potential suitable global habitats of A. grandis from current to future climates.
Our results would provide a reference for the global control and monitoring of A. grandis.

2. Materials and Methods

2.1. Global Distribution Records of A. grandis

Global distribution records of A. grandis were obtained from a public database (GBIF, https://www.gbif.org/ accessed on 4 May 2022) and publications (Web of Science, https://www.webofscience.com/ accessed on 5 May 2022). The scientific Latin name Anthonomus grandis Boheman was used as a search term in GBIF and Web of Science. Finally, 244 distribution records were obtained from GBIF, and 137 from publications (Figure 1). To eliminate spatial autocorrelation, ENMTools (https://github.com/danlwarren/ENMTools) was used to screen the distribution records of A. grandis. Each raster (10 km2) retained only one record to minimize sampling bias [35]. Duplicate distribution records and distribution records without detailed distribution information were deleted. Finally, 339 A. grandis distribution records were used to construct the MaxEnt model.

2.2. Data for Prediction of Environmental Variables

Current and future environmental climate variables were obtained from the WorldClim database (https://worldclim.org/ accessed on 25 May 2022). The current environmental climate variables included 19 bioclimatic variables with a spatial resolution of 5 arc minutes, which were related to the growth and development of species. The future environmental climate data was based on Beijing Climate Center Climate System Model (BCC-CSM2-MR), including Share Socio-economic Pathway (SSP) 1-2.6, SSP2-4.5, and SSP5-8.5 [36]. Our study aimed to identify the impact of high-forcing emissions on the potential suitable global habitats of A. grandis during the 21st century. Therefore, our study used SSP5-8.5 as future climate scenarios and selected four time periods: 2030s (2021–2040), 2050s (2041–2060), 2070s (2061–2080), and 2090s (2081–2100).
To avoid multicollinearity among the 19 bioclimatic variables, ENMTools was used to analyze the correlation coefficient of the bioclimatic variables. Finally, based on the contribution value of each bioclimatic variable and the correlation coefficient of the two bioclimatic variables, the bioclimatic variables that were more meaningful and had low correlation coefficients (|r| ≥ 0.75, Pearson) were retained, reducing to eight environmental variables [33] (Table 1 and Figure S1).

2.3. Model Parameters

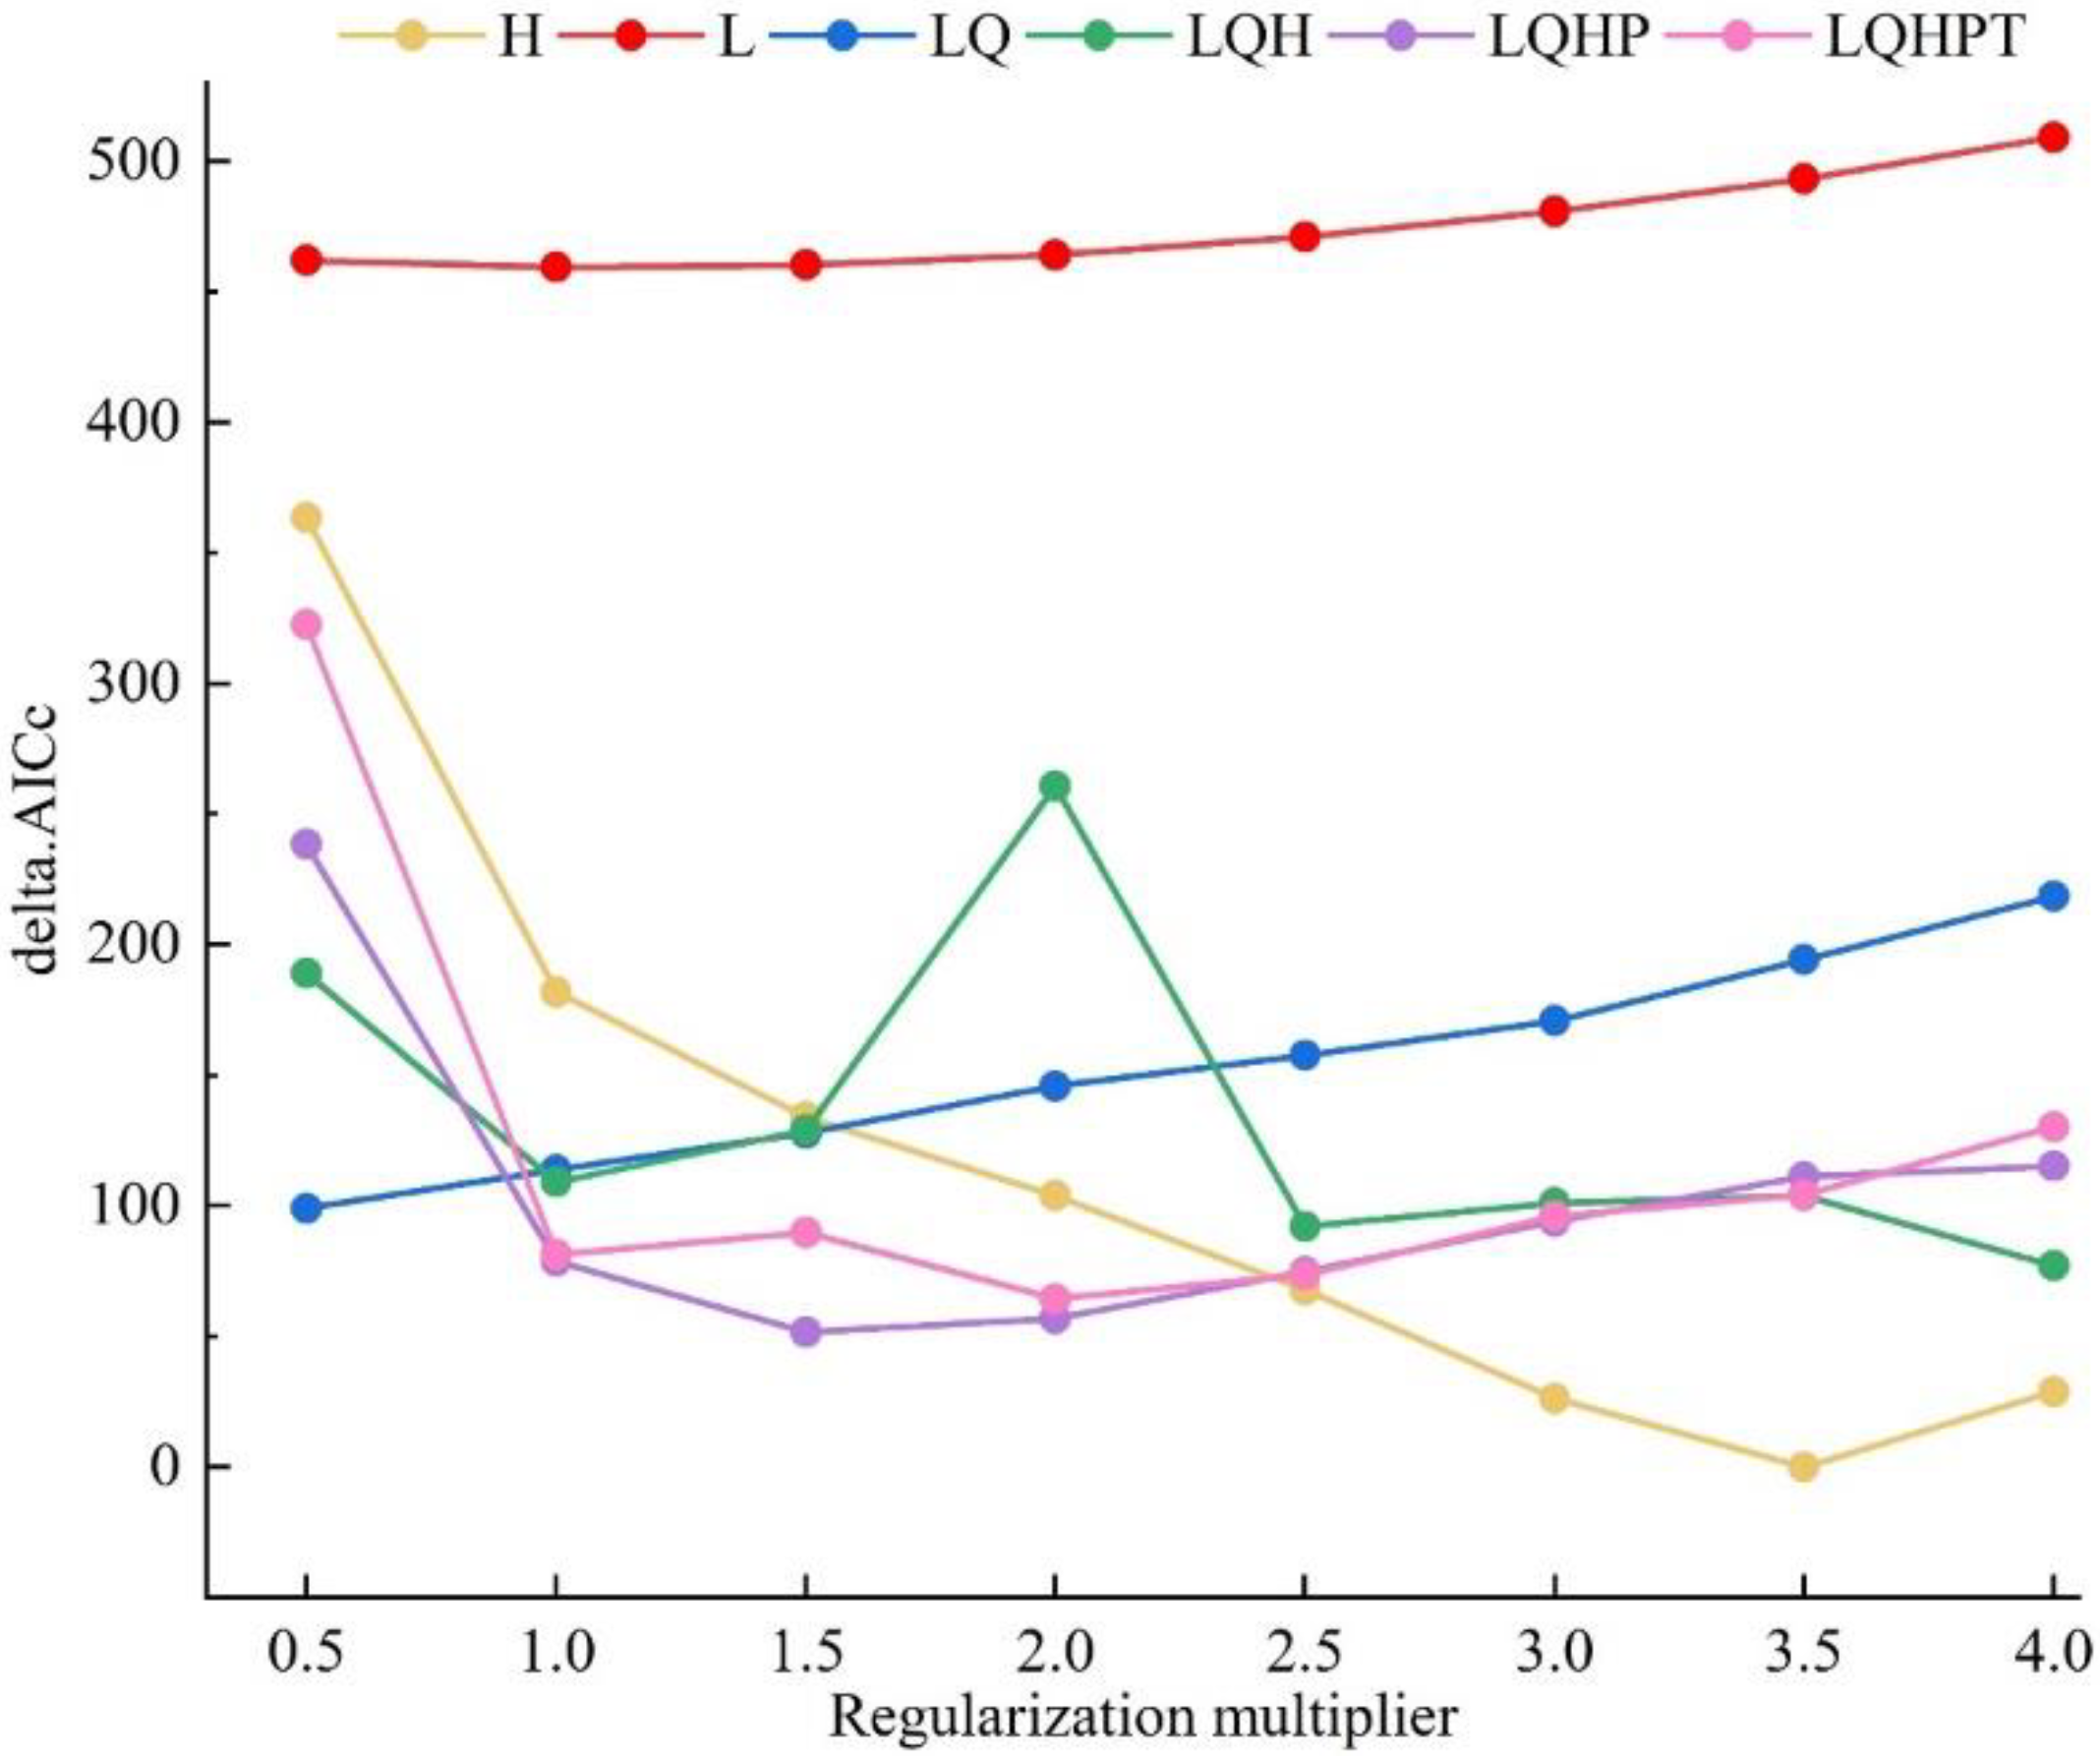
The complexity and performance of MaxEnt models are affected by two parameters (feature classes (FCs) and the regularization multiplier (RM)) [37,38,39]. Five features existed in the MaxEnt model: linear (L), quadratic (Q), fragmented (H), product (P), and threshold (T). RM = 1 and FC = LQHPT were set as default parameters in the MaxEnt model. To avoid overfitting and enhance transferability, FCs and RM were optimized with the ‘ENMeval’ package in R software [34]. The eight RMs were set to 0.5, 1.0, 1.5, 2.0, 2.5, 3.0, 3.5 and 4.0. Moreover, six FCs combinations (L, H, LQ, LQH, LQHP, and LQHPT) have been validated [33]. Finally, 48 parameter combinations were tested using the ENMeval software package. The value of the Akaike information criterion with correction for small sample size (AICc) was calculated. Parameter combinations with the lowest corresponding delta AICc (ΔAICc = 0) were selected as the best parameters in the MaxEnt model [40]. Other parameter settings were output format = Cloglog [37] and type of validation = bootstrap [41]. The distribution records of the target species were divided into two independent datasets [42] (75% of the distribution records were selected as the training dataset; 25% as the testing dataset). The maximum iterations were set to 5000 to optimize convergence [43,44] and the maximum number of background points was set to 10,000, with 10 repetitions [21].

2.4. Model Result Evaluation and GIS Analysis

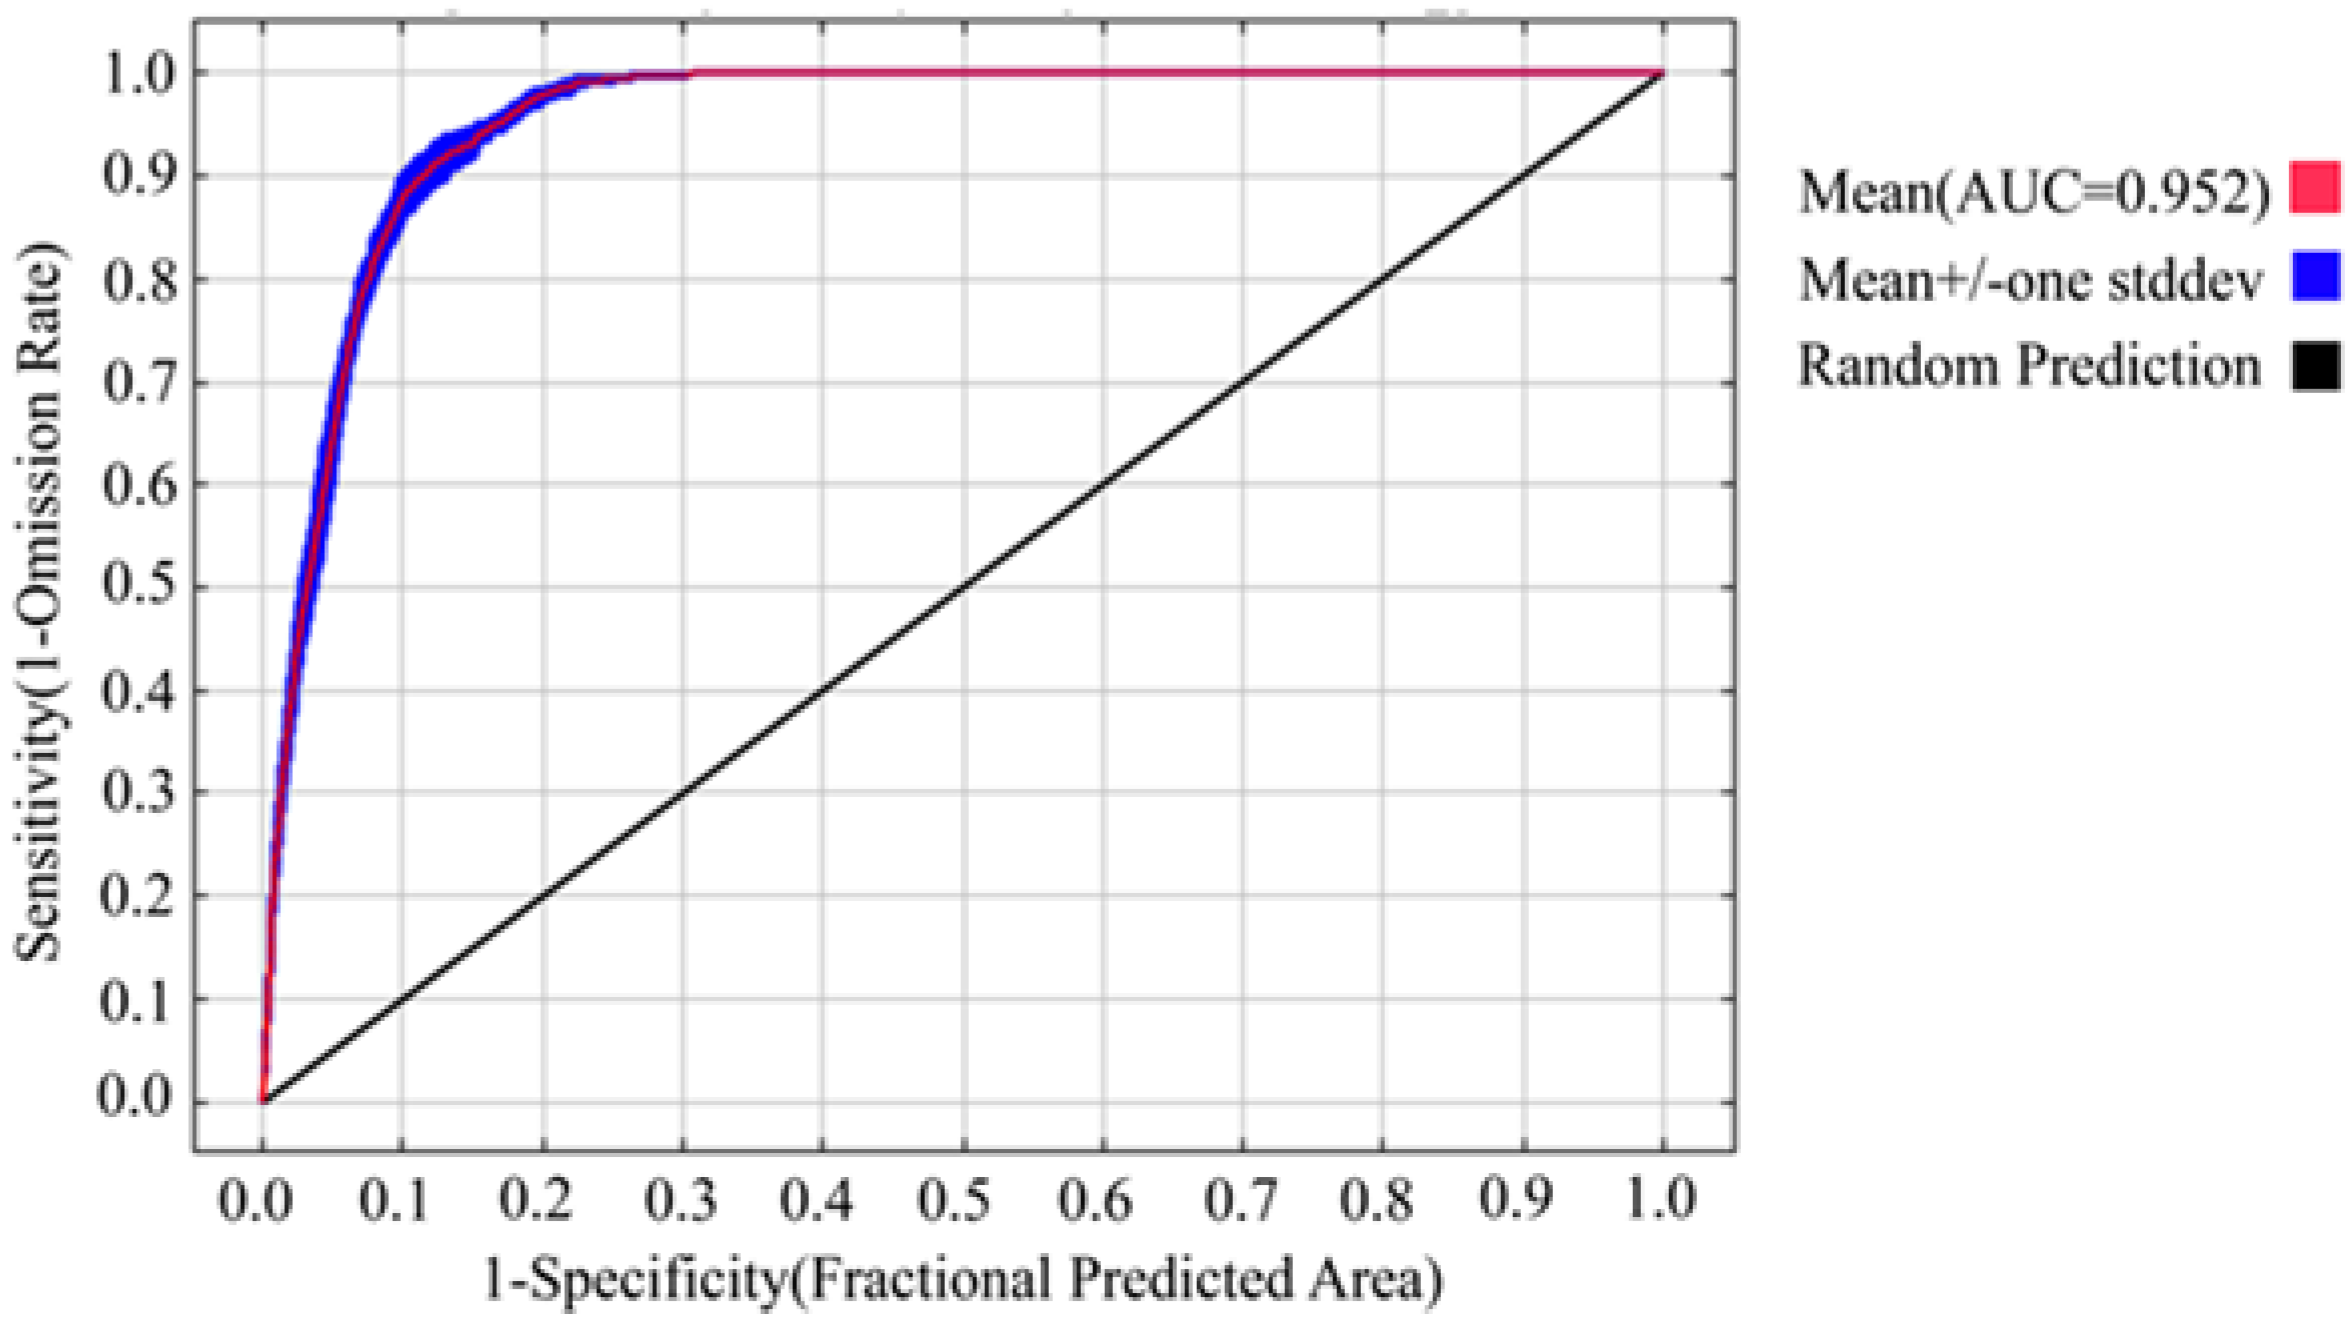
The receiver operating characteristic (ROC) curve and the area under the ROC curve (AUC) was used to evaluate the reliability of the model prediction [45]. The AUC value ranges from 0–1.0, with 0.9 or higher indicating superb performance [46]. The importance of the environmental variables was measured by percentage contribution rates and the jackknife test in the MaxEnt model.
ArcGIS was used to analyze the MaxEnt results. The cloglog threshold of the minimum training presence (MTP: current = 0.0731; 2030s = 0.0762; 2050s = 0.0848; 2070s = 0.0794; 2090s = 0.0671) assumes that the least suitable habitat at which the species is known to occur is the minimum suitability value for the species [47]. Based on this, the global fitness of A. grandis was reclassified into four classes: unsuitable habitats (0–MTP), low suitable habitats (MTP–0.3), favorable habitats (0.3–0.55), and high suitable habitats (0.55–1), and the area of each suitable habitat was calculated.

2.5. Centroid Transfer of Suitable Habitat

Centroids play a key role in describing the spatial distribution of terrestrial classes. The accumulation, dispersion, and migration of terrestrial types can be reflected by centroid shifting in different periods [48]. The suitable habitats of A. grandis would be considered as a whole in different time periods. The raster maps of suitable habitats of A. grandis were converted to vector maps, and each centroid position and transfer distance of suitable habitats in different periods were calculated using the ArcGIS classification statistical tool, Zonal [49].

3. Results

3.1. Model Precision and Importance of Bioclimatic Variable

In our study, RM = 3.5 and FC = H were considered as the final parameter settings (Figure 2). The values of the mean training and testing AUC were 0.952 and 0.948, respectively, under the current climatic conditions with 10 repetitions in the optimal MaxEnt model (Figure 3; Table S1), indicating that the performance of the model was excellent. Overall, the effect of temperature on the distribution of suitable habitats of A. grandis was much greater than that of precipitation. Based on the contribution rates and the jackknife test values, isothermality (bio3, 51.4%) and annual mean temperature (bio1) can be considered the two most important environmental variables (Table 1, Figure S2). The contribution rates showed other bioclimatic variables: precipitation of the warmest quarter (bio18, 17.5%), precipitation of the coldest (bio19, 11.5%), and mean diurnal range (bio2, 10.5%), which also influenced the global potential distribution of A. grandis (Table 1).
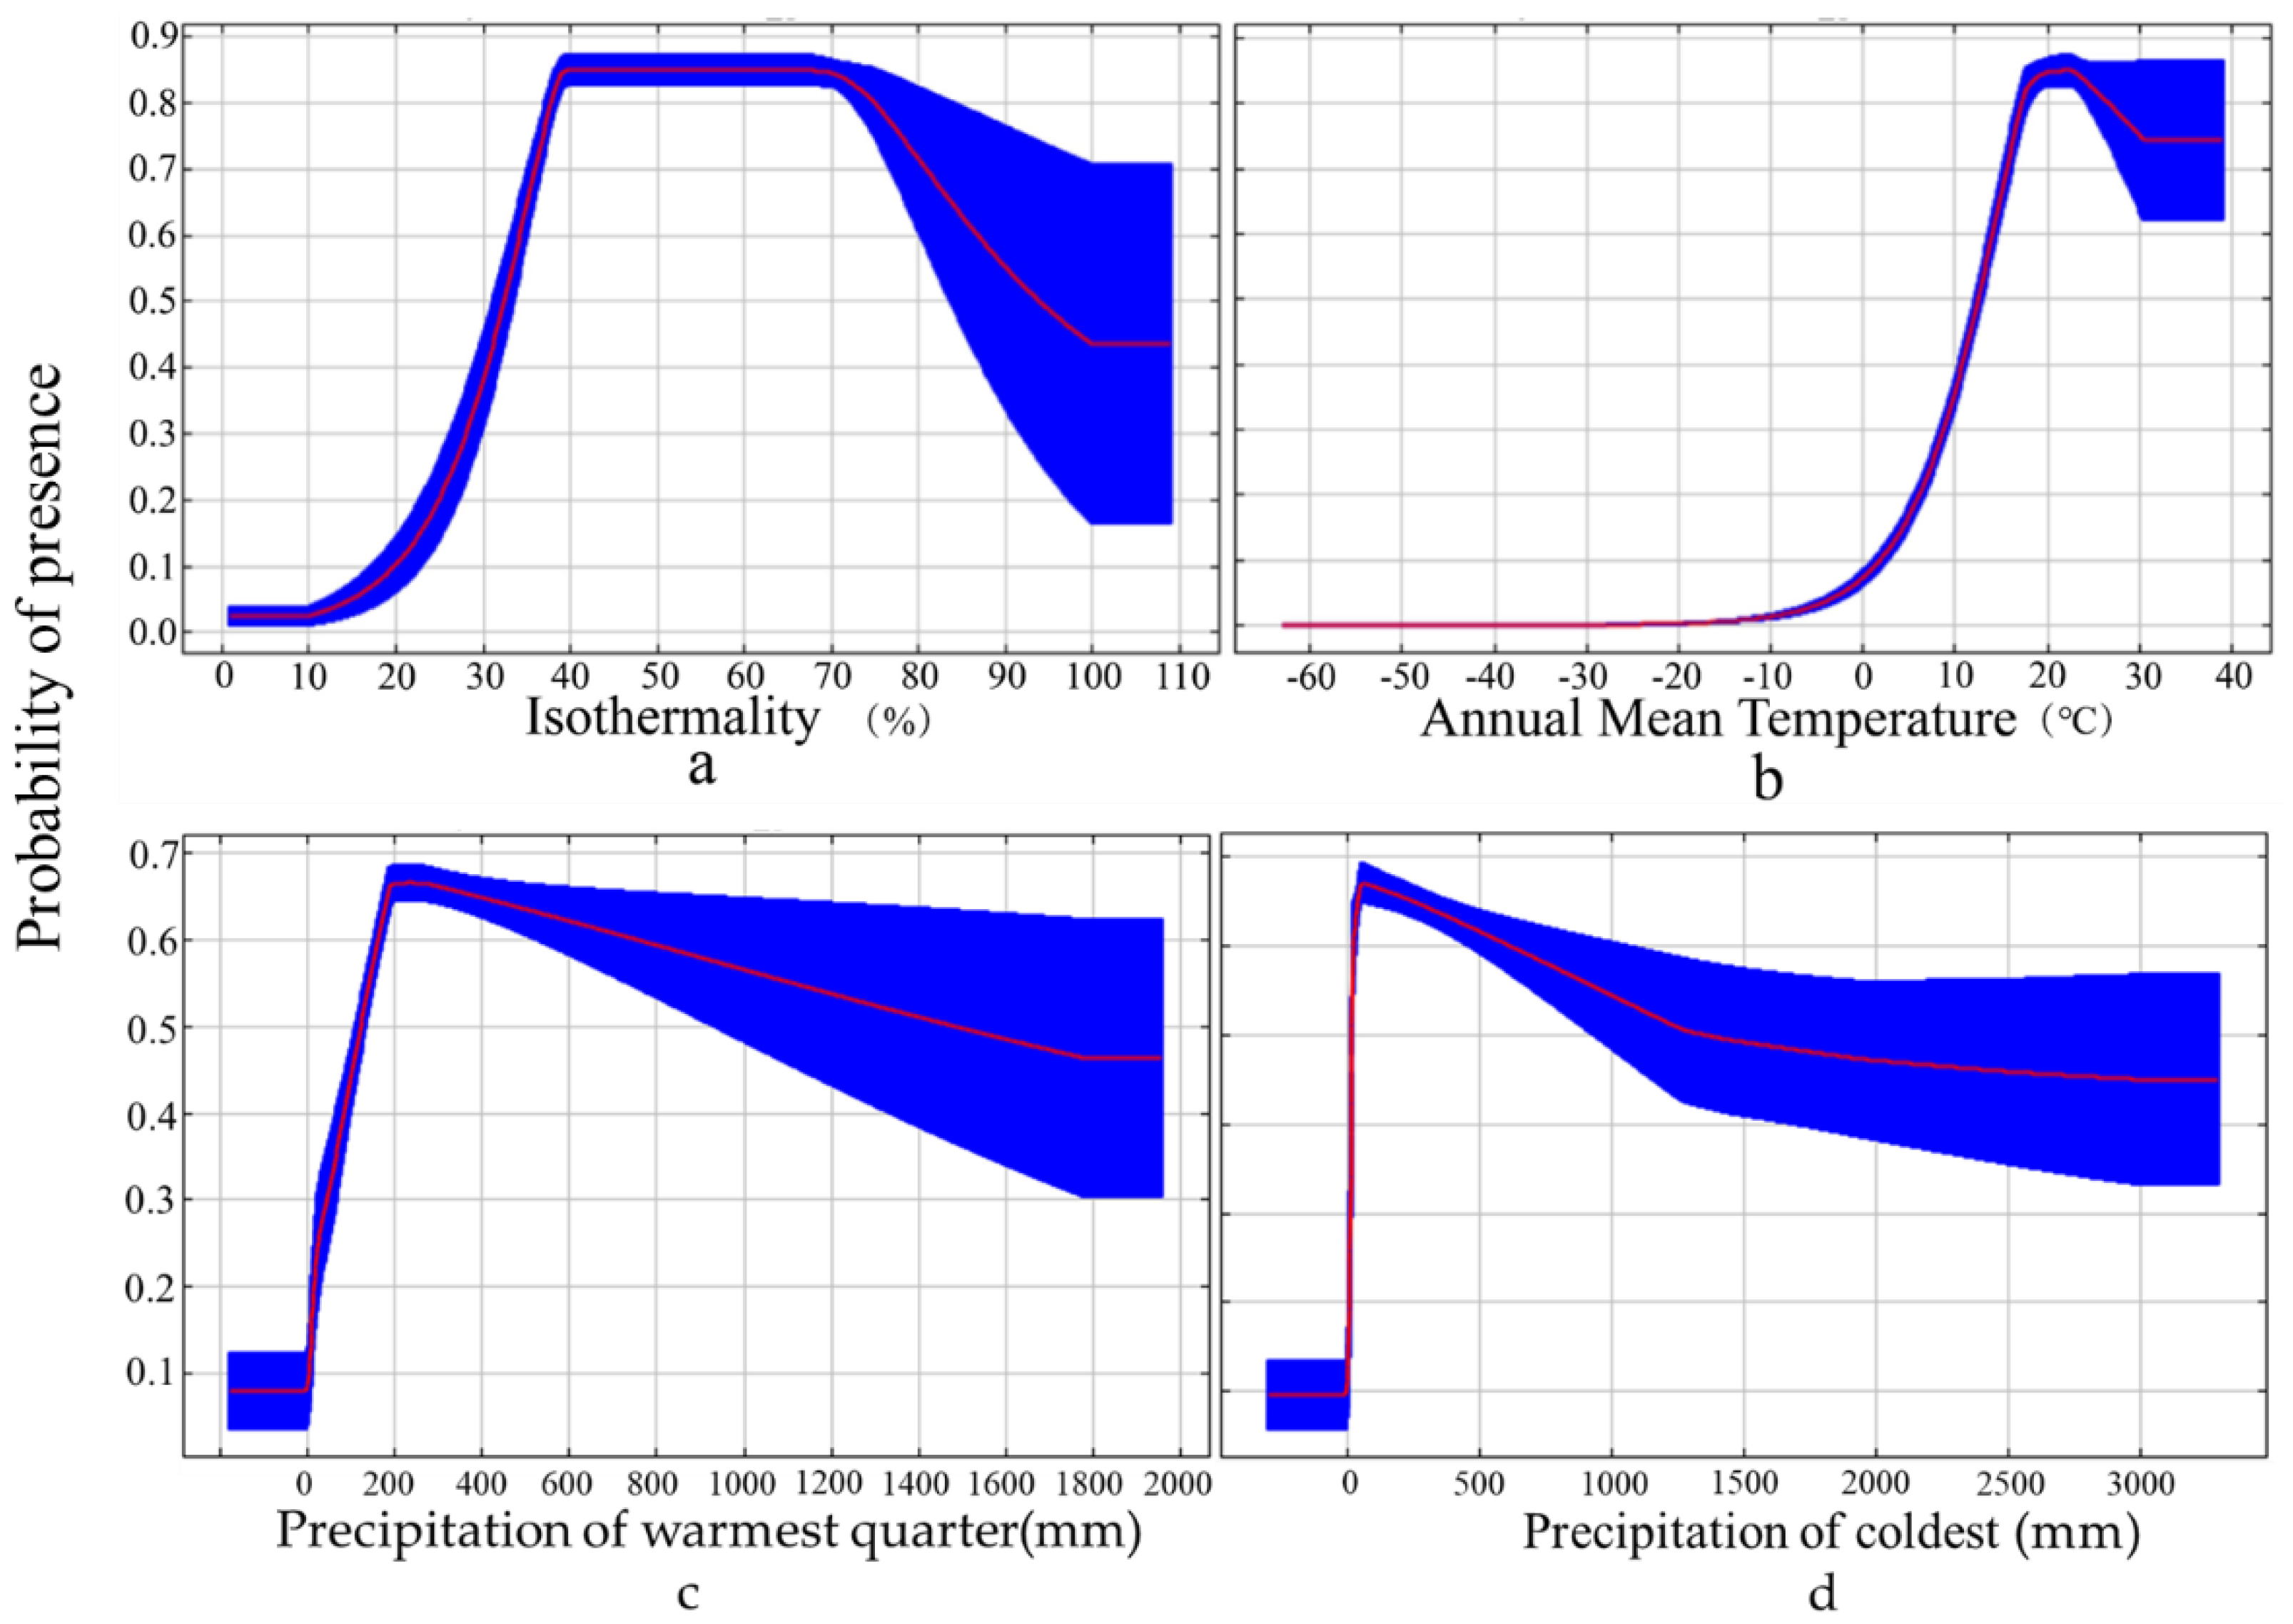
The probability of the presence of A. grandis based on individual response curves for important abiotic factors is shown in Figure 4. For bio3, the probability increased from 0.03 to 0.85 at around 39%. It remained steady until bio3 = 70%. The curve declined sharply thereafter until bio3 = 100%, to stabilize the response curve (Figure 4a). The bio1 response curves showed that at −18 °C to 23 °C, the probability of presence increased from 0 to 0.85. It decreased rapidly to approximately 30 °C, then became constant (Figure 4b). For precipitation variables bio18 and bio19, the probability of presence reached the highest level when the variables were 200 mm and 80 mm, respectively (Figure 4c,d).

3.2. Potential Distribution of A. grandis under the Current Climate

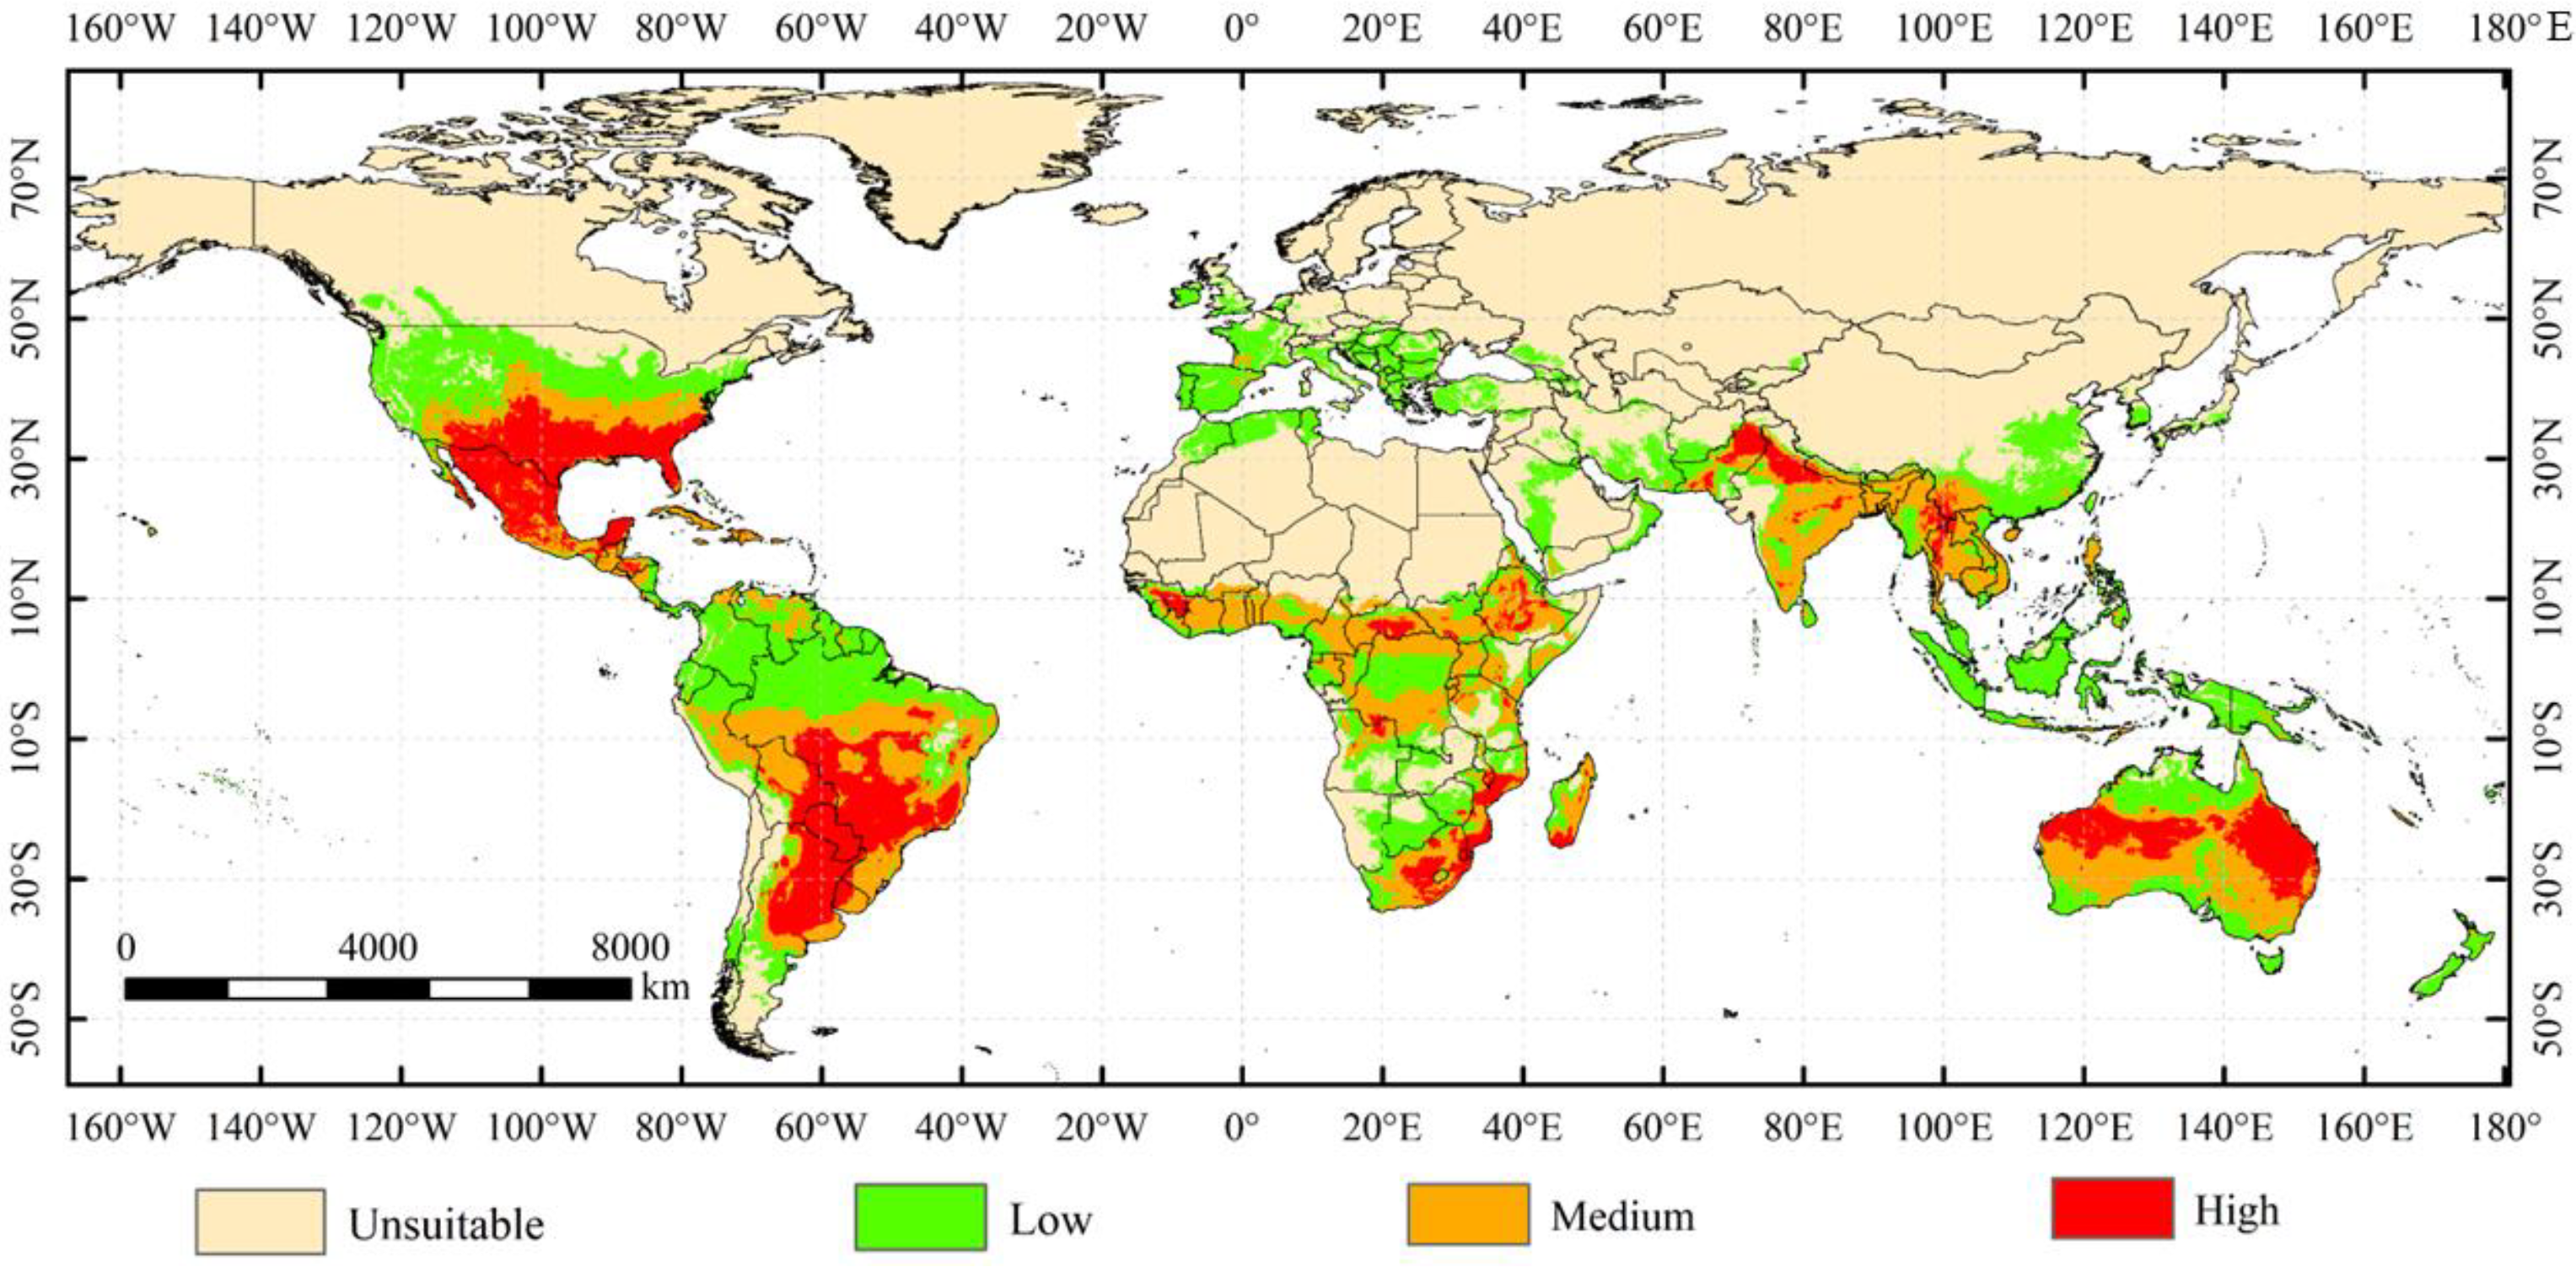
The current potential suitable global habitats of A. grandis were based on global distribution data and eight bioclimatic variables (Figure 5). The area of the potential suitable habitat of A. grandis was 5651.81 × 104 km2, accounting for 25.7% of the global land area (Table S2). The potential suitable global habitats of A. grandis covered North Americas (947.22 × 10⁴ km2), South Americas (1325.81 × 104 km2), Europe (230.03 × 10⁴ km2), Africa (1181.5 × 104 km2), Asia (1113.01 × 104 km2) and Oceania (743.55 × 10⁴ km2), accounting for 17.1%, 24.2%, 4.2%, 21.1%, 20.3%, and 13.1% of the total area. Potentially suitable habitats were mainly distributed in southern North America (the USA and Mexico), central South America (Brazil, Argentina, Paraguay, and Uruguay), south Asia (Pakistan, India, Thailand, Burma, and China), central and southeastern Africa (South Africa, Ethiopia, and Mozambique), and Oceania (Australia) (Figure 5).

3.3. Changes in Potential Suitable Habitats of A. grandis under the Future Climate

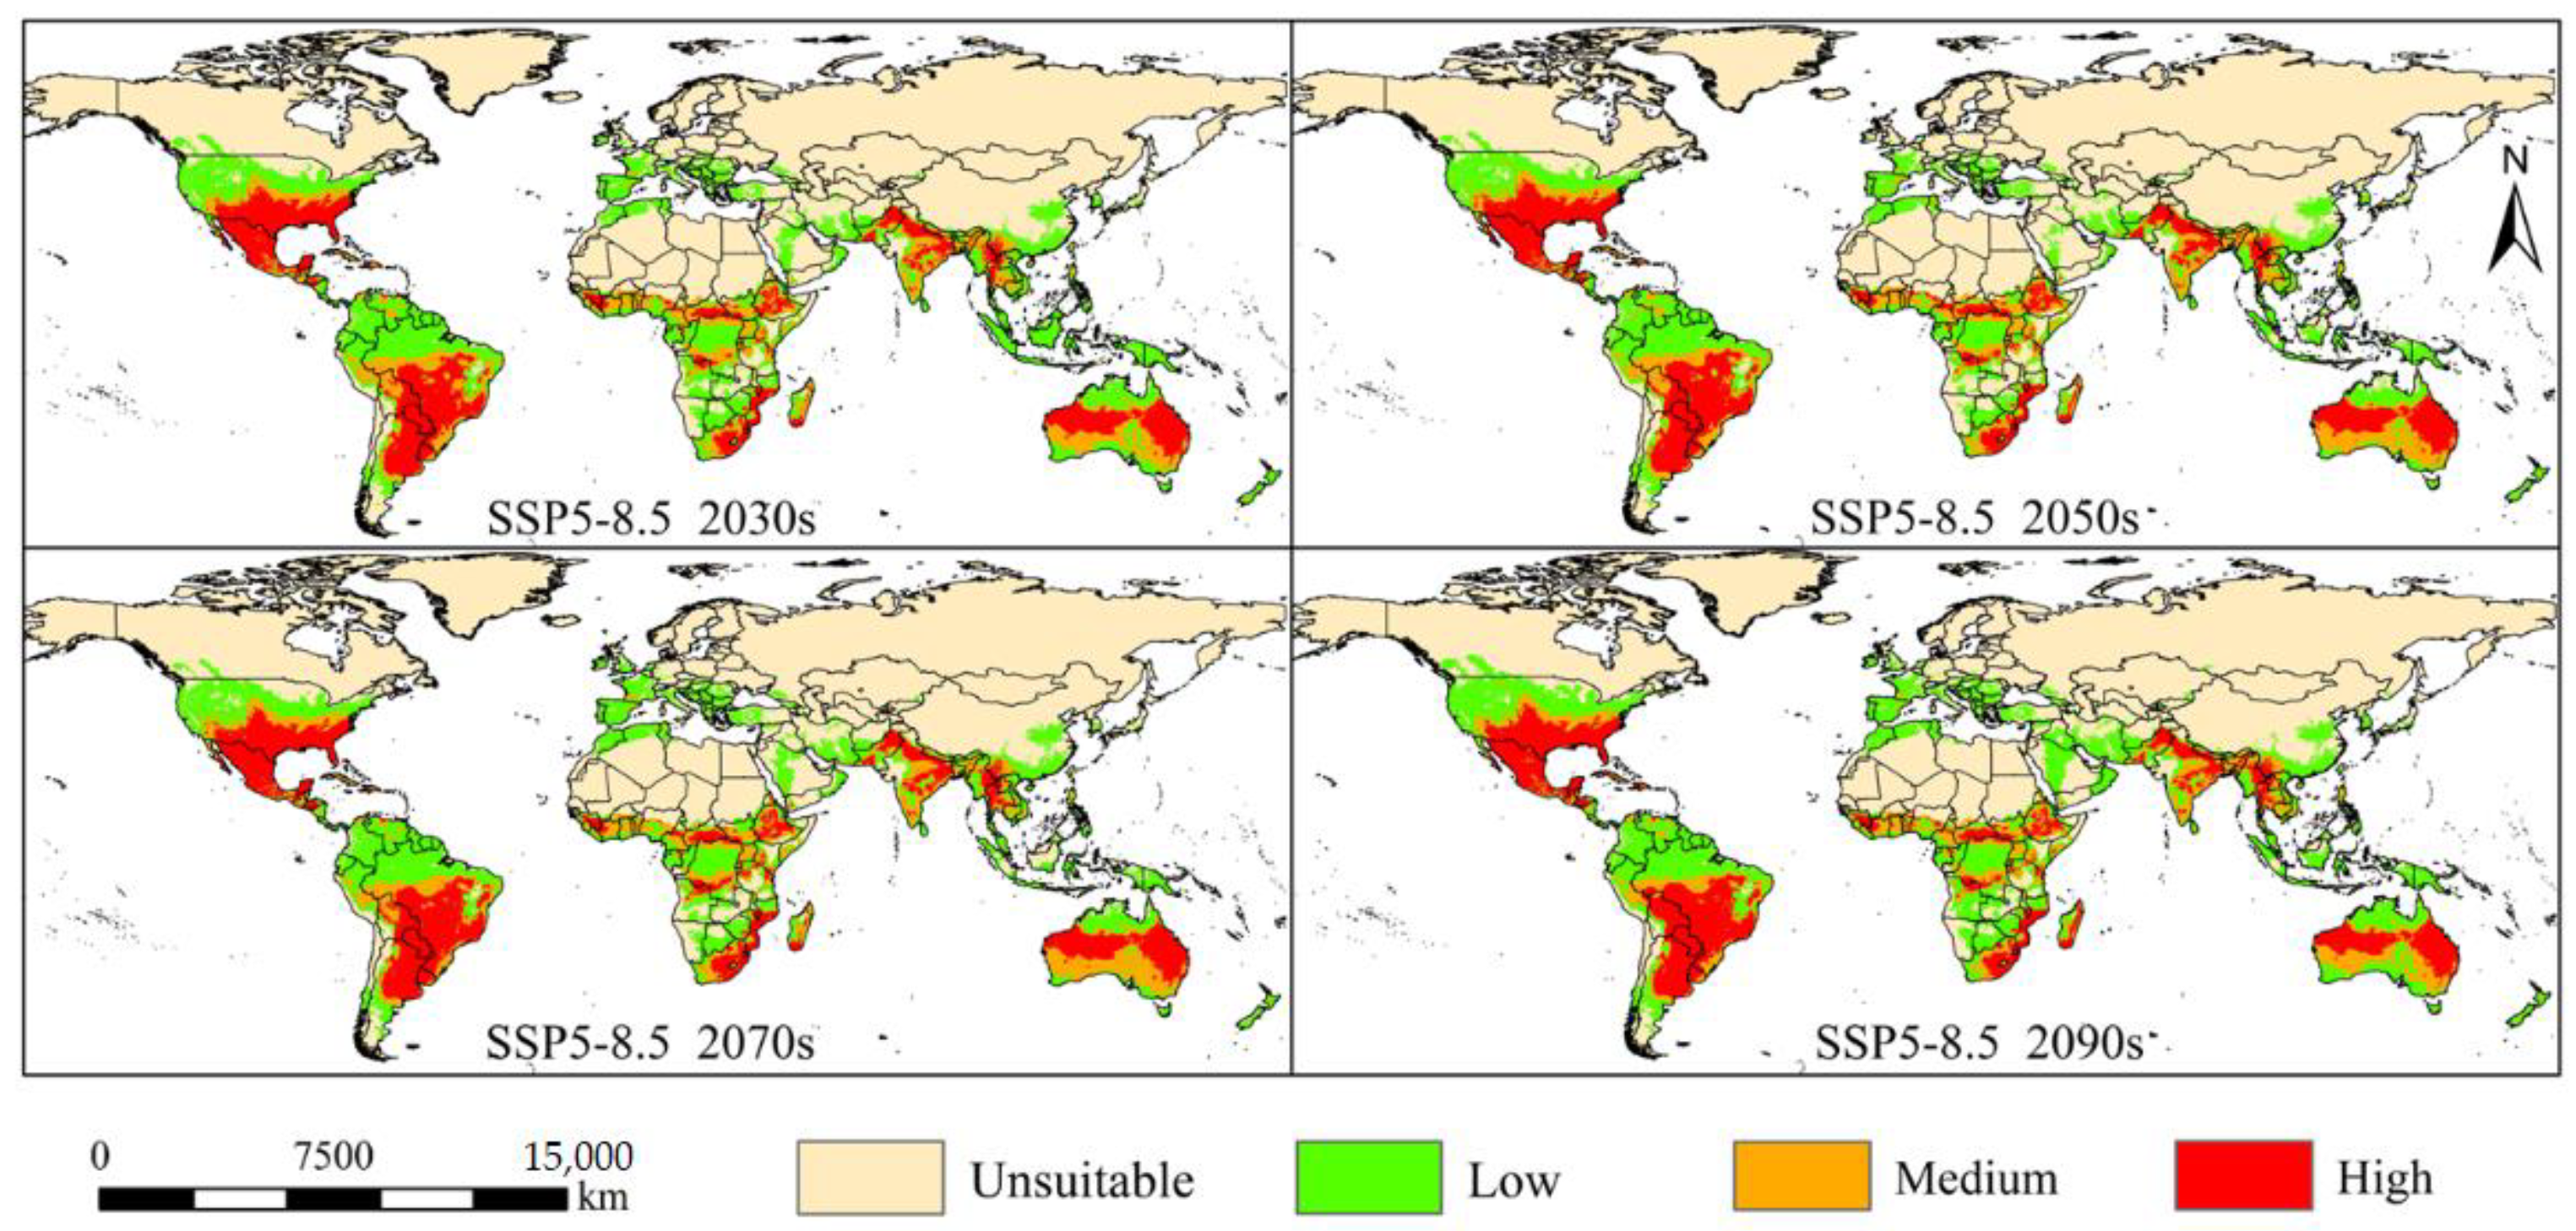
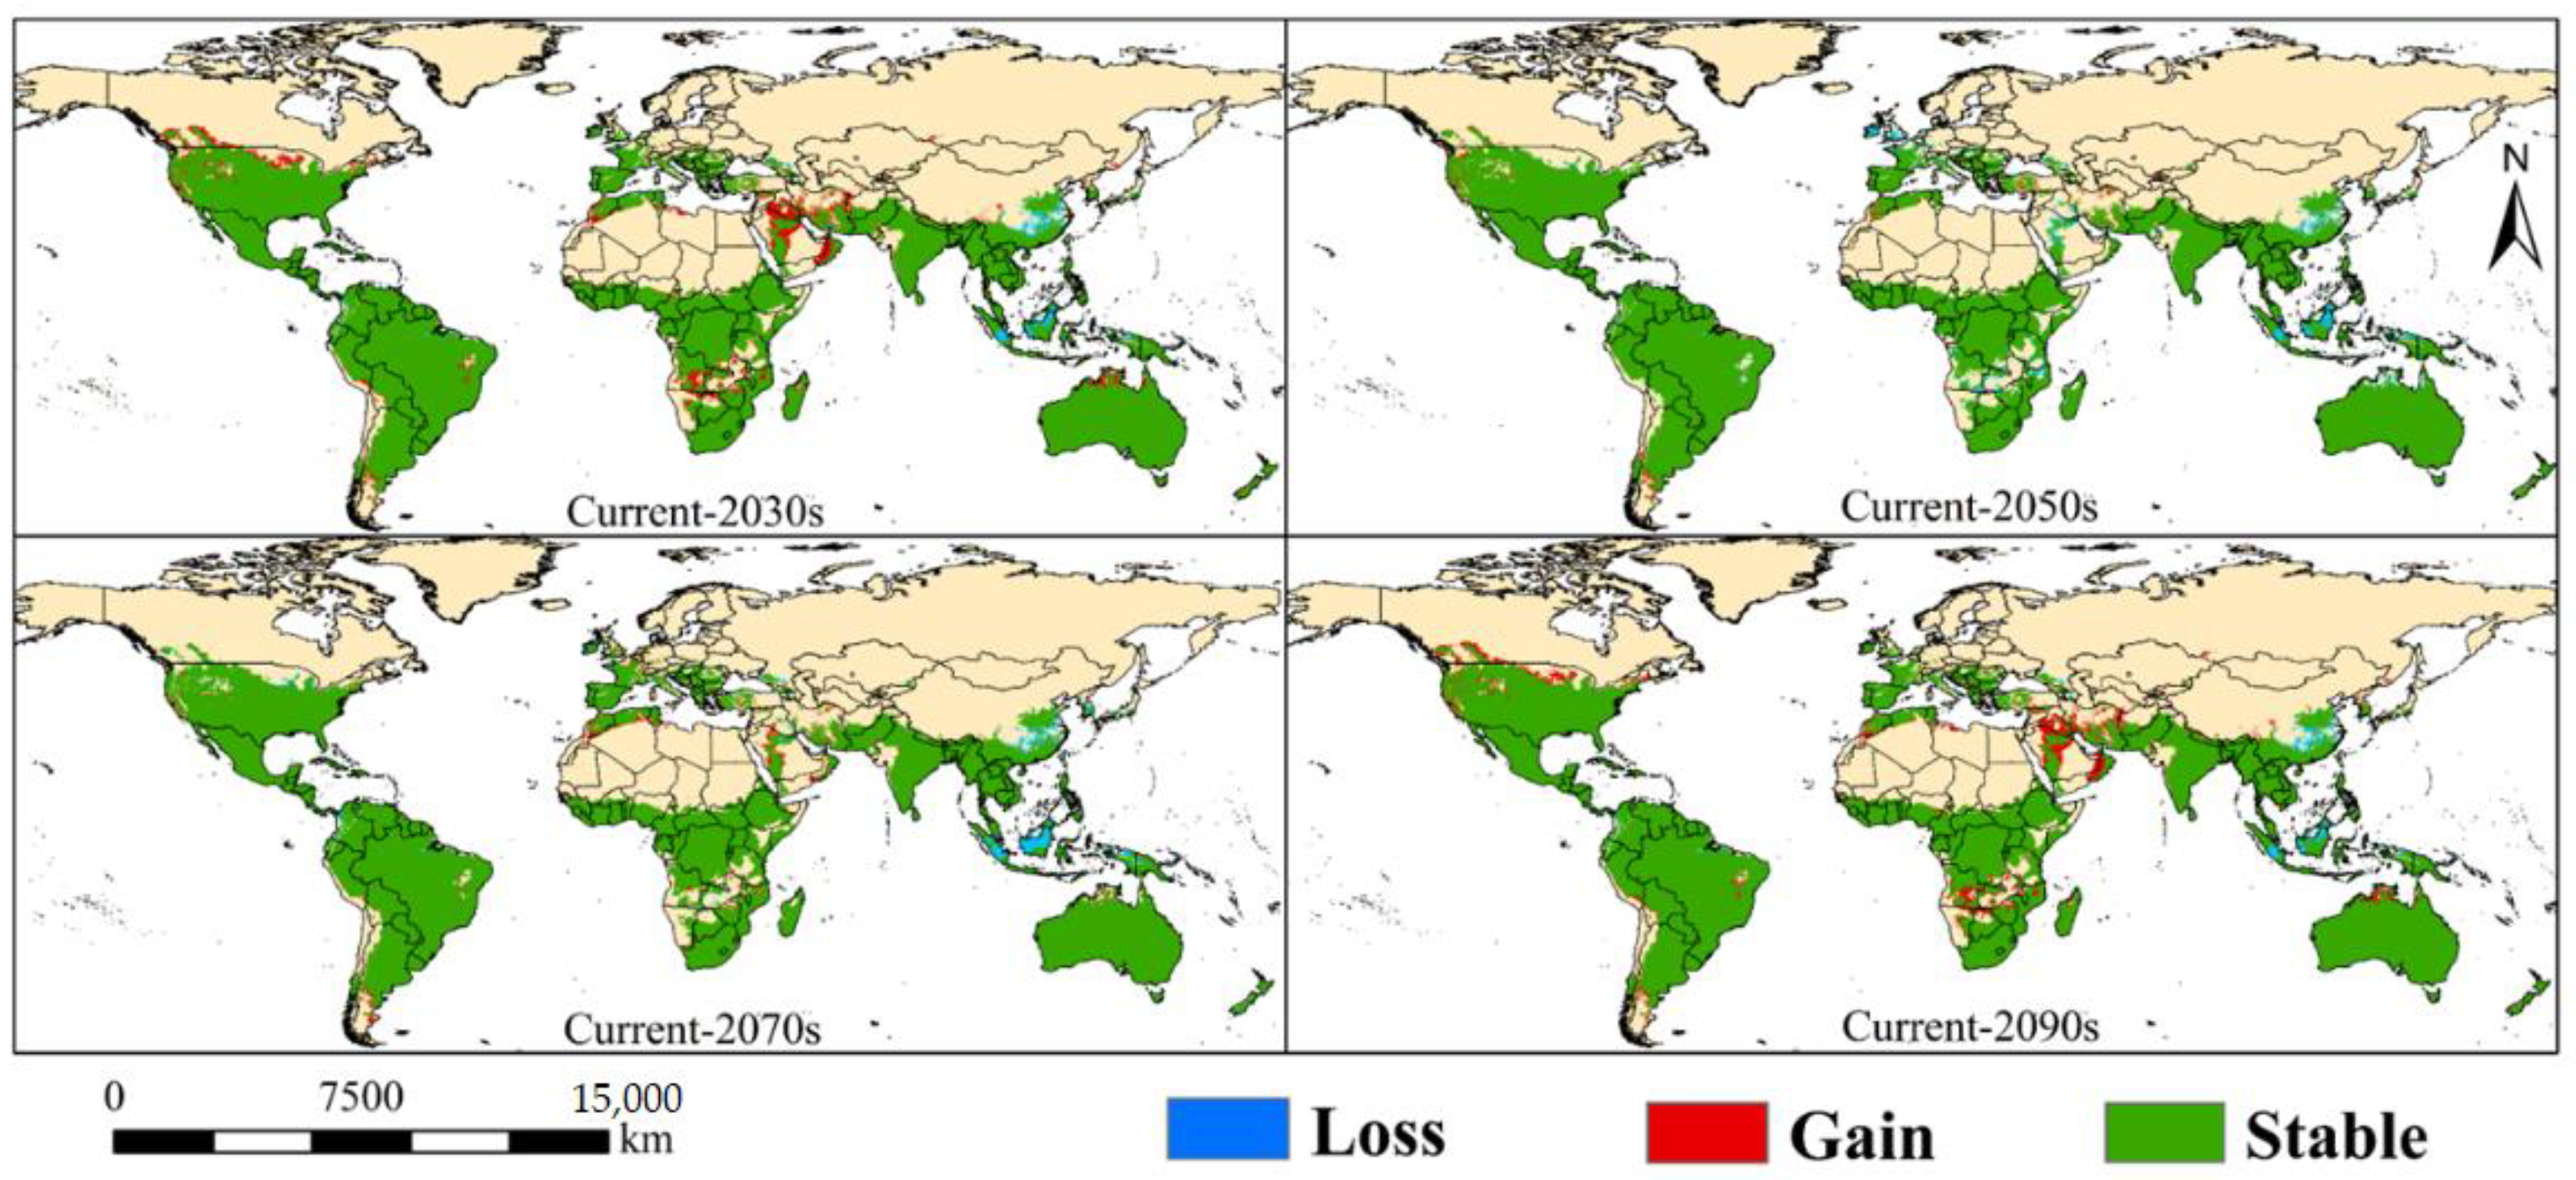
The potential suitable global habitats under future climates are shown in Figure 6. The total area of suitable habitats under SSP5-8.5 in the 2030s, 2050s, 2070s, and 2090s were 5605.63 × 104 km2, 5474.25 × 104 km2, 5569.16 × 104 km2, and 5873.60 × 104 km2, respectively (Table S2), accounting for 25.5%, 24.9%, 25.3%, and 26.7% of the global land area (Table S2). For the 2030s, 2050s, and 2070s, the areas of the potential suitable global habitats decreased compared to that of the current climate (Figure S3). This phenomenon occurs mainly in China and Indonesia (Figure 7). The largest increase in the area of potentially suitable global habitats was observed in the 2090s, mainly in the north of the USA, south of Canada, Morocco, Angola, Syria, Saudi Arabia, Oman, and Australia (Figure 7 and Figure S3).

3.3.1. North America

The total area of suitable habitats for the 2030s, 2050s, 2070s, and 2090s in North America were 1189.91 × 104 km2, 1150.34 × 104 km2, 1208.03 × 104 km2, and 1262.2 × 104 km2, respectively (Table S3). As shown, the total area was the largest in the 2090s. Highly suitable habitats were mainly distributed in the south of the USA and Mexico (Figure 6). The changes in high and medium suitable habitats remained stable under future climate conditions (Figure 6). In particular, it will cover nearly the entire land of Mexico in the 2090s (Figure 6). The area of medium suitable habitats decreased in comparison to the current climate of this century (Figure 7). The scale of low suitable habitats reached its maximum in the 2090s, mainly in southern Canada (Figure 6 and Figure 7).

3.3.2. South America

The total area of suitable habitats for the 2030s, 2050s, 2070s, and 2090s in South America were 1323.47 × 104 km2, 1330.15 × 104 km2, 1329.97 × 104 km2, and 1341.65 × 104 km2, respectively (Table S3). Highly suitable habitats were mainly distributed in Brazil, Argentina, Paraguay, and Uruguay (Figure 6). Compared to the current climate model, the total area of suitable habitats expanded in the 2050s, 2070s, and 2090s, and remain at the highest level worldwide (Table S3). Some of the medium suitable habitats in Brazil and Bolivia were gradually replaced by highly suitable habitats (Figure 6). The low suitable habitats showed a floating change in this century (Figure 8).

3.3.3. Europe

The total area of suitable habitats for the 2030s, 2050s, 2070s, and 2090s in Europe were 202.46 × 10⁴ km2, 189.61 × 10⁴ km2, 225.44 × 10⁴ km2, and 225.54 × 10⁴ km2, respectively (Table S3). Europe was the only region wherein the high suitable habitats were not distributed over time (Figure 6). The total suitable habitats were distributed in southern Europe (France, Spain, Italy, and Portugal), and changed modestly in this century (Figure 8). The medium suitable habitats presented a sporadic distribution in France and Spain in this century (Figure 6).

3.3.4. Africa

The total area of suitable habitats for the 2030s, 2050s, 2070s, and 2090s in Africa were 1189.91 × 104 km2, 1150.34 × 104 km2, 1208.03 × 104 km2, and 1262.2 × 104 km2, respectively (Table S3). The change in the overall trend of total suitable habitats increased (Figure 8). The highly suitable habitats were mainly distributed on both sides of the equator and in southeast Africa and expanded to around 100% in the 2050s compared to the current climate model (Figure 6 and Figure 8; Table S3). The change in medium suitable habitats remained stable and decreased compared to the current climate scenario in this century. The area of low suitable habitats expanded and reached the highest level by the end of this century (Figure 7).

3.3.5. Asia

The total area of suitable habitats for the 2030s, 2050s, 2070s, and 2090s in Asia were 1086.28 × 104 km2, 1030.6 × 104 km2, 1030.69 × 104 km2, and 1169.91 × 104 km2, respectively (Table S3). The maximum area of total suitable habitats was mainly observed in the 2090s (Figure 8). The high suitable habitats were mainly distributed in southern Asia (east of India, northeast Pakistan, southwest of China, Burma, and Thailand) under future climate scenarios (Figure 6). Compared to the current situation, the scope of the high suitable habitats doubled in the 2050s, while the scope of the medium suitable habitats decreased and remained half of the current climate situation (Figure 8). The scope of the low suitable habitats became more extensive in the 2030s and 2090s than in the current situation (Figure 8).

3.3.6. Oceania

The total area of suitable habitats areas for the 2030s, 2050s, 2070s, and 2090s in Oceania were 750.52 × 10⁴ km2, 727.38 × 10⁴ km2, 737.89 × 10⁴ km2, and 756.47 × 10⁴ km2, respectively. The results showed that the minimum and maximum total areas occurred in the 2050s and 2090s, respectively (Figure 8). The high suitable habitats only existed in Australia, while in other countries, the invasion risk remained at lower levels. Moreover, the suitable habitats covered all of Australia by the end of this century. However, some regions of the medium suitable habitats changed into low suitable habitats over time (Figure 6).

3.4. Centroid Shift of Potential Suitable Global Habitats

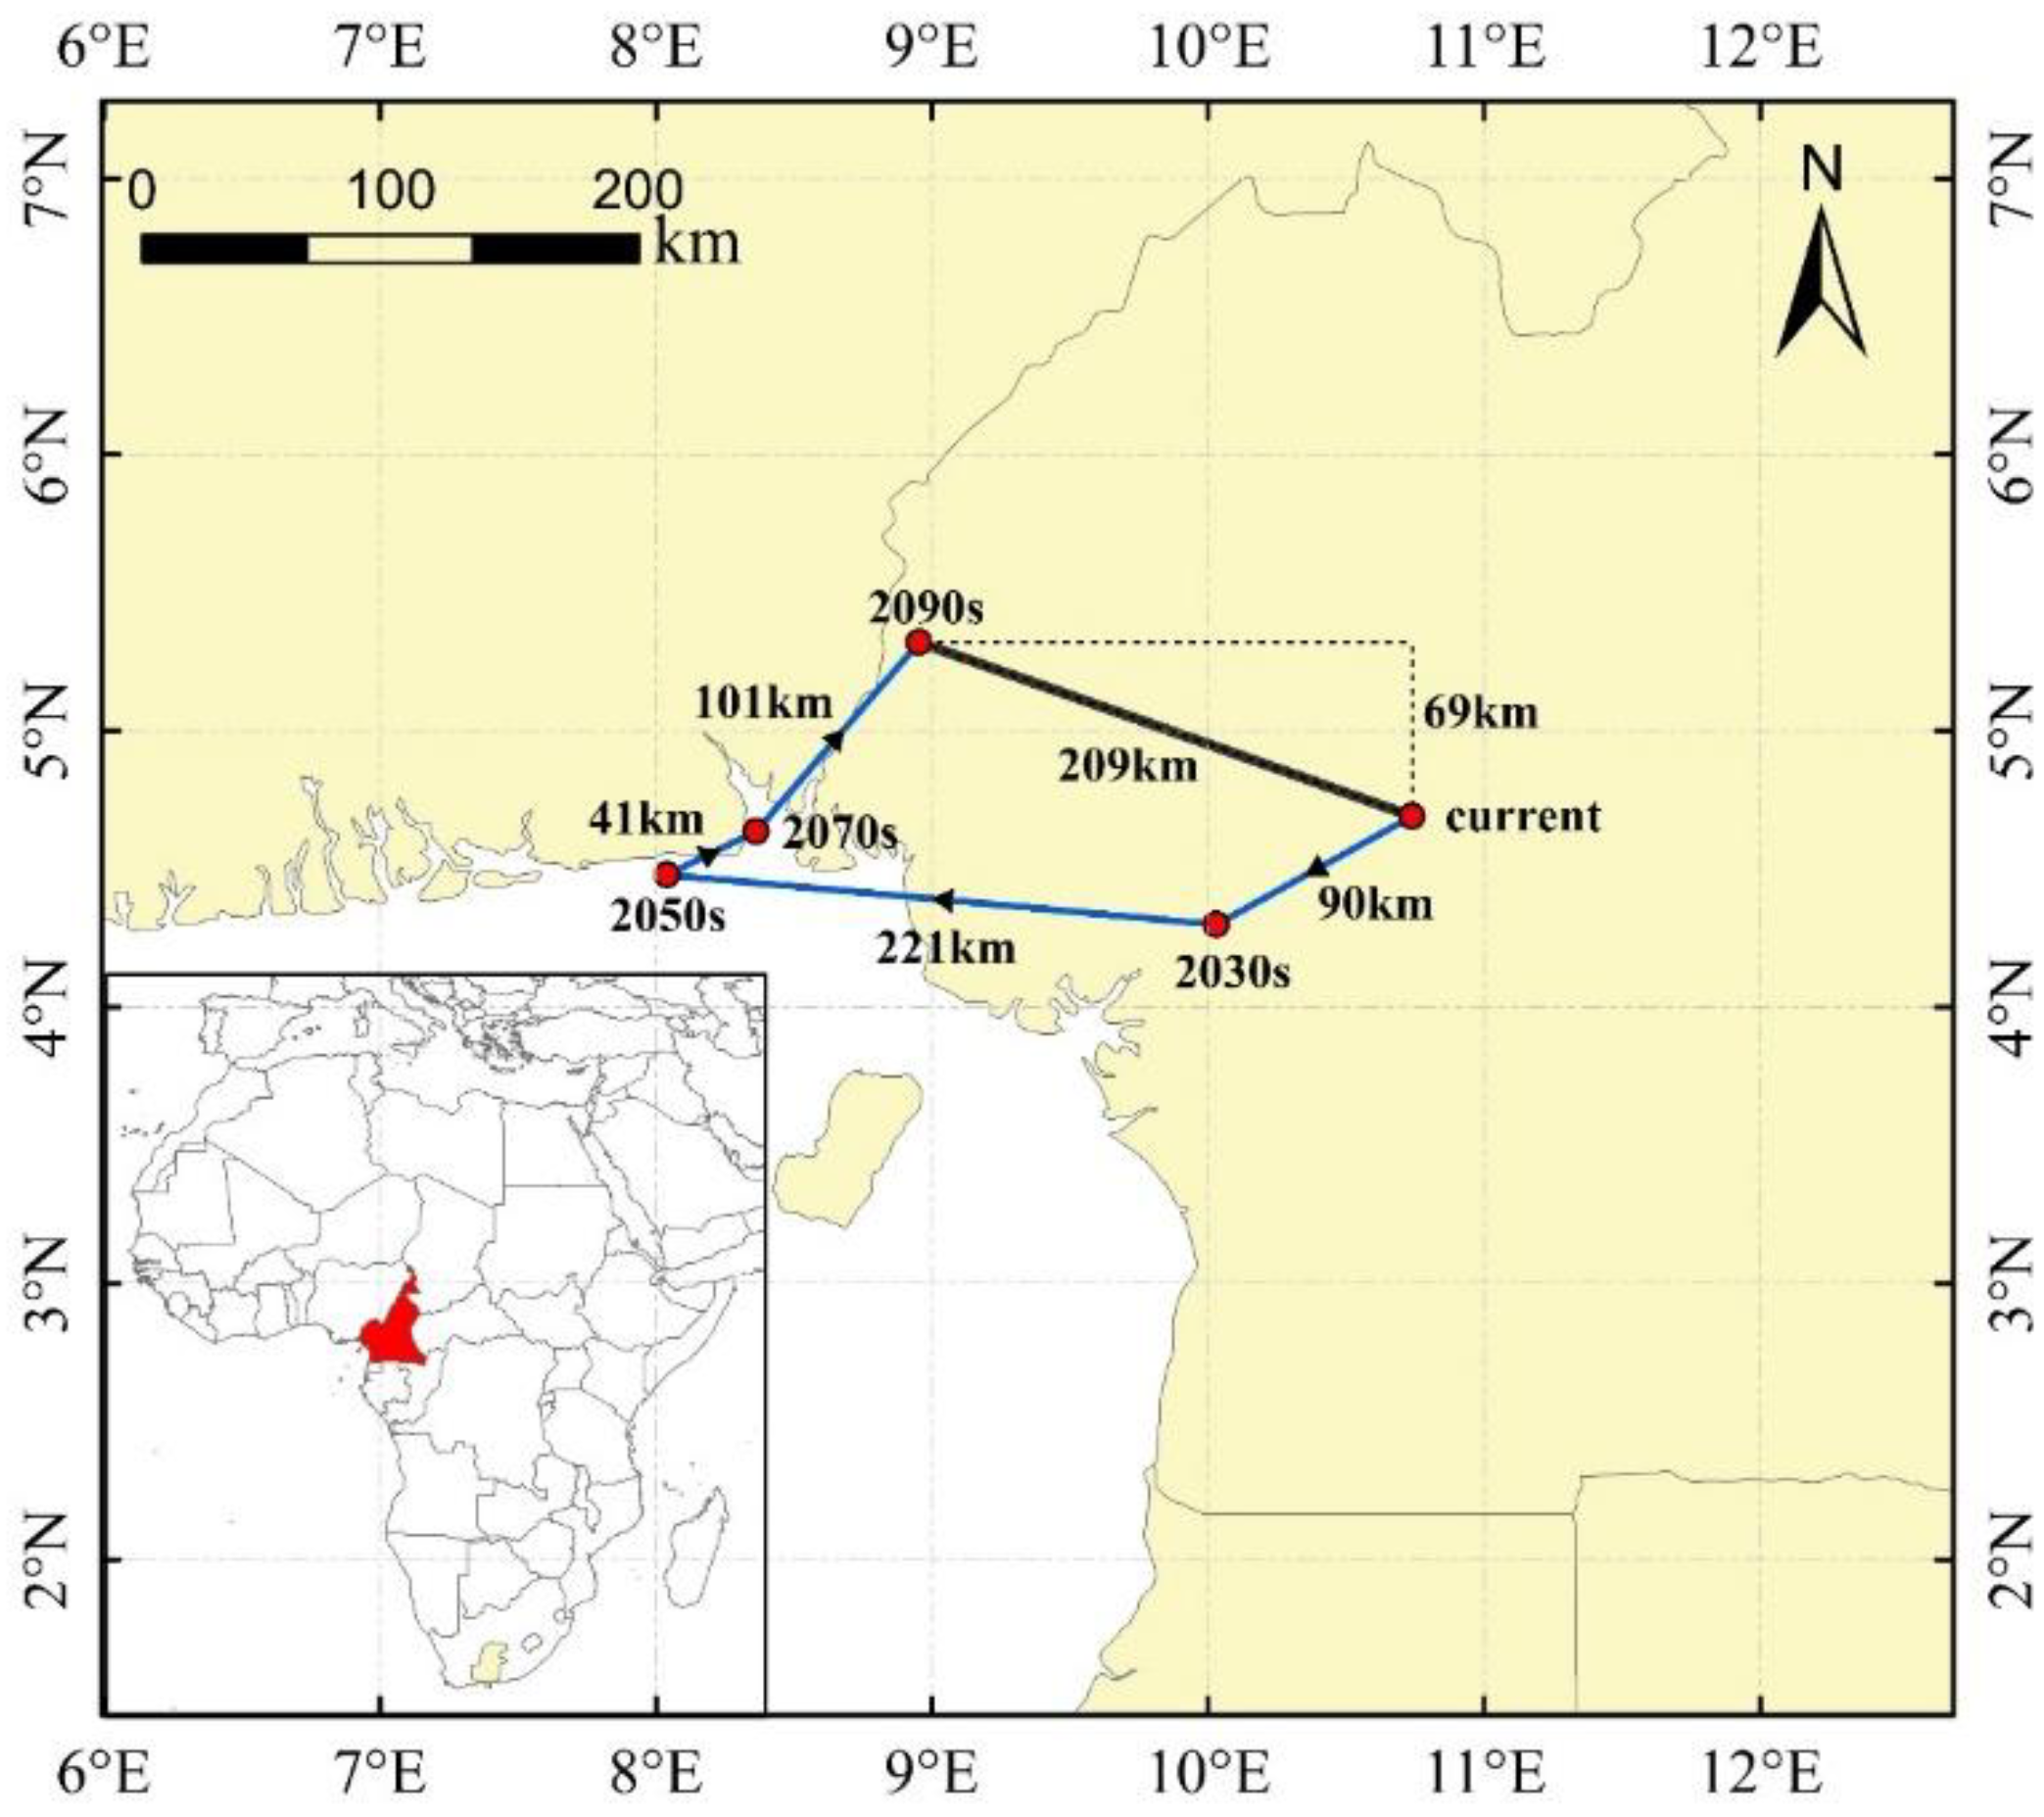
Centroid shifting analysis of the suitable habitat areas in the current, 2030s, 2050s, 2070s, and 2090s showed that under the SSP585 scenario, it shifted 0.32° E and 1.05° N from the current to the 2030s, and 0.11° E and 0.22° N from the 2030s to the 2050s (Figure 9). The range of centroid shifting occurred in Cameroon. The centroid shifted 90 km southwestward from the current (10.73° E, 4.69° N) to the 2030s (10.03° E, 4.28° N), 221 km northwestward in the 2050s (08.04° E, 4.48° N), 41 km northeastward in the 2070s (08.36° E, 4.63° N) and 101 km northeastward in the 2090s (08.95° E, 5.32° N). In general, centroids shifted −1.78° E and 0.63° N from the current to the 2090s and shifted 209 km northwestward and 69 km northward in the 2090s, respectively, under high-forcing emissions (Figure 9).

4. Discussion

Cotton has become more extensively cultivated worldwide, and some invasive pests have already colonized many cotton-growing areas in the Americas [12,50,51]. Our research species—A. grandis—has caused a serious impact on cotton production in the American Continent [10,11]. Previous studies have shown the biological characteristics and control methods of A. grandis [52]. However, few studies have predicted potential suitable global habitats for this species. In this study, we used the MaxEnt model to provide the first global potential distribution for A. grandis. Using this method, the similarity of climatic conditions can be estimated at any known location coordinates of A. grandis [30]. MaxEnt also allows exploration of the impact of climate change on the future distribution of target species and provides useful insights into possible colonization behavior [31,32,33]. The AUC value was used to evaluate the accuracy of the model [53]. The value of the evaluation methods indicated the overall high performance of our model, which was adequate for predicting the suitable global habitats of A. grandis.
In general, our model showed the distribution of potentially suitable habitats for the invasion and establishment of A. grandis distributed across all continents (Americas, Europe, Africa, Asia, and Oceania). The presence of this pest has already been recorded in America [12]. In our study, the high suitable habitats of A. grandis were mainly throughout Mexico, Australia, southern USA, South America, the northwest regions of India, Pakistan, Central Africa, and South Africa, which are the main cotton-producing regions in the world (https://www.atlasbig.com/). In contrast, very few medium and low suitable habitats in southern Europe existed. Perhaps due to the high reproductive rates of this pest in tropical climates, A. grandis is extremely uncommon in the continental EU [12].
The survival of boll weevils is dependent on environmental factors, such as temperature [54,55]. In our study, annual mean temperature (bio1) and isothermality (bio3) were considered significant bioclimatic variables for the potential global distribution of A. grandis. The adaptation of the pest remained at the highest level when the annual mean temperature was 23 °C, and the response curve declined until 30 °C to reach stability. Previous studies have found that the survival rate significantly decreases when the ambient temperature exceeds 29 °C. Moreover, the mortality of increased from 50.1% to 100% when the temperature increased from 30 °C to 45 °C [19,51]. In general, the results of our study were consistent with the previous studies.
The influence of global warming on poikilotherms is greater than that of homoiotherms [22]. In particular, global warming affects agricultural ecosystems and the distribution and occurrence of pests [56]. Thus, in response to future global warming, insects are changing their distribution areas by expanding to high-altitude and high-latitude regions [57]. For instance, Ge [23] used CLIMEX to predict the potential suitable habitat areas of Hyphantria cunea, and observed that the potentially suitable habitat areas increased in some regions of high latitudes in the 2090s, such as Russia, Canada, and southern Australia and New Zealand. In our study, the change in suitable habitat areas of A. grandis was represented by the centroid shift [48,58]. We found that the centroid shifted 69 km northward and partial suitable habitat areas expanded to the northern USA and southern Argentina and Africa. Therefore, the invasion risk of pests may increase because of the acceleration of global warming.
Invasive pathways play a critical role in the intrusion of invasive alien species (IAS) [59]. These include the intentional transfer or transportation of IAS by humans from their native distribution areas [60,61,62]. EPPO declared that A. grandis might travel through international trade on cotton such as in seeds and stored products [12]. This species initially invaded the USA through the natural spread, and its expansion between states was mainly through the flight or local flow of cotton products, including cotton seeds and cotton [16]. Considering that the invasion of A. grandis has caused considerable economic damage in the USA, control of these pests is inevitable in these regions. Thus, a program to eradicate boll weevils in the country was implemented by the local cotton industry in 1983, and some specific cultivation practices have been used to wipe out the pest population, such as constant monitoring and pest control with pheromone-baited traps and localized insecticide applications [52]. Eventually, the species were eradicated to 98% of the invasive range in the USA [63]. In previous years, the cotton industry has imitated the American model to conduct large-scale field testing of the Boll Weevil Suppression Program (BWSP) in Brazil [52]. Therefore, the BWSP of the American model can serve as a reference for countries that have recorded invasions of this pest. The growth of international trade creates new links between geographically dispersed markets, and the movement of products creates new avenues for the spread of the IAS, which threatens ecological communities [64,65]. Through international trade, boll weevils can invade other regions with no record of A. grandis invasion through cotton seeds or bolls (fruit), unginned (raw) cotton, and ornamental Malvaceae plants (e.g., Hibiscus spp.) [12]. Therefore, for the quarantine departments of these regions, enhancing the quarantine of imported cotton and cotton products would play an important role in preventing or limiting the spread of A. grandis.

5. Conclusions

Invasive alien species are a major threat to ecosystem function and local biodiversity. Climate change can affect the invasion process from initial introduction to establishment and dissemination; thus, this phenomenon has a profound impact on the ecosystem. Our study introduced the use of the MaxEnt model to analyze the potential global distribution of A. grandis under climate change. This study compared the potential distribution under current and future climates and found that this invasive pest remained stable in this century. The global high-risk area increased, especially in America. The increase in global trade is a convenient way of transmitting biological invasions, that would inevitably cause global economic losses to cotton plantations. Therefore, quarantine, prevention, and control measures should be strictly implemented in attacked and potentially invaded regions.

Supplementary Materials

The following supporting information can be downloaded at: https://www.mdpi.com/article/10.3390/agriculture12111759/s1, Figure S1: Correlation analysis of bioclimatic variables; eight environmental variables were retained (|r| < 0.75, Pearson); Figure S2: Jackknife results of relative importance of different predictor variables for Anthonomus grandis; Figure S3: Area of the future potential global distribution of Anthonomus grandis under future climate scenarios worldwide (×104 km2); Table S1: Evaluation statistics from training and test data set area under the curve (AUC) values of tenfold cross-validation; Table S2: Predicted global suitable areas for A. grandis based on current and future climatic conditions (km2); Table S3: Predicted global suitable areas for A. grandis based on current and future climate emission scenarios (km2) on all continents except Antarctica.

Author Contributions

Z.J., X.X. and H.Z.: conception and design of the research. Z.J. and X.X.: acquisition of data. Z.J., X.X. and H.Z.: analysis and interpretation of data. Z.J., H.Z. and K.J.: statistical analysis. Z.J., X.X. and H.Z.: drafting the manuscript. W.Y., N.Y., X.L. and W.L.: manuscript revision. All authors have read and agreed to the published version of the manuscript.

Funding

This project was funded by the National Key R&D Program of China (grant no. 2021 YFC2600400), and the Technology Innovation Program of Chinese Academy of Agricultural Sciences (grant no. caascx-2017-2022-IAS).

Institutional Review Board Statement

Not applicable.

Informed Consent Statement

Not applicable.

Data Availability Statement

Not applicable.

Acknowledgments

We sincerely thank Wanxue Liu, Xiaoqing Xian and Haoxiang Zhao in the Institute of Plant Protection of Chinese Academy of Sciences for providing us with financial and technical support in this study.

Conflicts of Interest

The authors declare no conflict of interest.

References

  1. Pyšek, P.; Richardson, D.M. Invasive species, environmental change and management, and health. Annu. Rev. Environ. Resour. 2010, 35, 25–55. [Google Scholar] [CrossRef] [Green Version]
  2. Simberloff, D.; Martin, J.L.; Genovesi, P.; Maris, V.; Wardle, D.A.; Aronson, J.; Courchamp, F.; Galil, B.; García-Berthou, E.; Pascal, M.; et al. Impacts of biological invasions: What’s what and the way forward. Trends Ecol. Evol. 2013, 28, 58–66. [Google Scholar] [CrossRef] [PubMed] [Green Version]
  3. Katsanevakis, S.; Coll, M.; Piroddi, C.; Steenbeek, J.; Ben Rais Lasram, F.; Zenetos, A.; Cardoso, A.C. Invading the Mediterranean Sea: Biodiversity patterns shaped by human activities. Front. Mar. Sci. 2014, 1, 32. [Google Scholar] [CrossRef] [Green Version]
  4. Vergés, A.; Doropoulos, C.; Malcolm, H.A.; Skye, M.; Garcia-Pizá, M.; Marzinelli, E.M.; Campbell, A.H.; Ballesteros, E.; Hoey, A.S.; Vila-Concejo, A.; et al. Long-term empirical evidence of ocean warming leading to tropicalization of fish communities, increased herbivory, and loss of kelp. Proc. Natl. Acad. Sci. USA 2016, 113, 13791–13796. [Google Scholar] [CrossRef] [Green Version]
  5. Pyšek, P.; Hulme, P.E.; Simberloff, D.; Bacher, S.; Blackburn, T.M.; Carlton, J.T.; Dawson, W.; Essl, F.; Foxcroft, L.C.; Genovesi, P.; et al. Scientists’ warning on invasive alien species. Biol. Rev. Camb. Philos. Soc. 2020, 95, 1511–1534. [Google Scholar] [CrossRef]
  6. Diagne, C.; Leroy, B.; Gozlan, R.E.; Vaissière, A.C.; Assailly, C.; Nuninger, L.; Roiz, D.; Jourdain, F.; Jarić, I.; Courchamp, F. InvaCost, a public database of the economic costs of biological invasions worldwide. Sci. Data. 2020, 7, 277. [Google Scholar] [CrossRef] [PubMed]
  7. Diagne, C.; Leroy, B.; Vaissière, A.C.; Gozlan, R.E.; Roiz, D.; Jarić, I.; Salles, J.M.; Bradshaw, C.J.A.; Courchamp, F. High and rising economic costs of biological invasions worldwide. Nature 2021, 592, 571–576. [Google Scholar] [CrossRef]
  8. Al-Ayedh, H.; Rizwan-ul-Haq, M.; Hussain, A.; Aljabr, A.M. Insecticidal potency of RNAi-based catalase knock down in Rhynchophorus ferrugineus (Oliver) (Coleoptera: Curculionidae). Pest Manag. Sci. 2016, 72, 2118–2127. [Google Scholar] [CrossRef]
  9. Aghaee, M.A.; Godfrey, L.D. Winter flooding of California rice fields reduces immature populations of Lissorhoptrus oryzophilus (Coleoptera: Curculionidae) in the spring. Pest Manag. Sci. 2017, 73, 1538–1546. [Google Scholar] [CrossRef]
  10. Lange, F.; Olmstead, A.L.; Rhode, P.W. The impact of the boll weevil, 1892–1932. J. Econ. Hist. 2009, 69, 685–718. [Google Scholar] [CrossRef]
  11. Scataglini, M.A.; Lanteri, A.A.; Confalonieri, V.A. Diversity of boll weevil populations in South America: A phylogeographic approach. Genetica 2006, 126, 353–368. [Google Scholar] [CrossRef] [PubMed]
  12. Jeger, M.; Bragard, C.; Caffier, D.; Candresse, T.; Chatzivassiliou, E.; Dehnen-Schmutz, K.; Gilioli, G.; Gregoire, J.-C.; Jaques Miret, J.A.; Navarro, M.N.; et al. Scientific opinion on the pest categorisation of Anthonomus grandis. EFSA J. 2017, 15, e05074. [Google Scholar] [CrossRef] [Green Version]
  13. Showler, A.T.; Abrigo, V. Common subtropical and tropical nonpollen food sources of the boll weevil (Coleoptera: Curculionidae). Environ. Entomol. 2007, 36, 99–104. [Google Scholar] [CrossRef] [PubMed]
  14. Grigolli, J.F.J.; Souza, L.A.; Fernandes, M.G.; Busoli, A.C. Spatial distribution of adult Anthonomus grandis Boheman (Coleoptera: Curculionidae) and damage to cotton flower buds due to feeding and oviposition. Neotrop. Entomol. 2017, 46, 442–451. [Google Scholar] [CrossRef]
  15. Paim, E.A.; Dias, A.M.; Showler, A.T.; Campos, K.L.; Oliveira, A.A.S.; Grillo, P.P.C.; Bastos, C.S. Cotton row spacing for boll weevil management in low-input production systems. Crop Prot. 2021, 145, 105614. [Google Scholar] [CrossRef]
  16. Loftin, U.C. Living with the boll weevil for fifty years. United States Dep. Agric. Publ. 1946, 3827, 273–291. [Google Scholar]
  17. Slosser, J.E.; Bordovsky, D.J.; Bevers, S.J. Damage and Costs Associated with Insect Management Options in Irrigated Cotton. J. Econ. Entomol. 1994, 87, 436–445. [Google Scholar] [CrossRef]
  18. Oliveira, C.M.; Auad, A.M.; Mendes, S.M.; Frizzas, M.R. Economic impact of exotic insect pests in Brazilian agriculture. J. Appl. Entomol. 2013, 137, 1–15. [Google Scholar] [CrossRef]
  19. Spurgeon, D.W.; Suh, C.P. Morphology, Diet, and Temperature-dependent Host-Free Survival of the Boll Weevil, Anthonomus grandis (Coleoptera: Curculionidae). J. Insect. Sci. 2018, 18, 8. [Google Scholar] [CrossRef]
  20. Paula, D.P.; Claudino, D.; Timbó, R.V.; Miranda, J.E.; Bemquerer, M.P.; Ribeiro, A.C.; Sujii, E.R.; Fontes, E.M.; Pires, C.S. Reproductive dormancy in boll-weevil from populations of the midwest of Brazil. J. Econ. Entomol. 2013, 106, 86–96. [Google Scholar] [CrossRef]
  21. Ramasamy, M.; Das, B.; Ramesh, R. Predicting climate change impacts on potential worldwide distribution of fall armyworm based on CMIP6 projections. J. Pest Sci. 2022, 95, 841–854. [Google Scholar] [CrossRef]
  22. Curtis, A.D.; Joshua, J.T.; Raymond, B.H.; Kimberly, S.S.; Cameron, K.G.; David, C.H.; Paul, R.M. Impacts of climate warming on terrestrial ectotherms across latitude. Proc. Natl. Acad. Sci. USA 2008, 105, 6668–6672. [Google Scholar] [CrossRef] [Green Version]
  23. Ge, X.Z.; He, S.Y.; Zhu, C.Y.; Wang, T.; Xu, Z.C.; Zong, S.X. Projecting the current and future potential global distribution of Hyphantria cunea (Lepidoptera: Arctiidae) using CLIMEX. Pest Manag. Sci. 2018, 75. [Google Scholar] [CrossRef] [PubMed] [Green Version]
  24. Sutherst, R.W. Pest species distribution modelling: Origins and lessons from history. Biol. Invas. 2014, 16, 239–256. [Google Scholar] [CrossRef]
  25. Raffini, F.; Bertorelle, G.; Biello, R.; D’Urso, G.; Russo, D.; Bosso, L. From nucleotides to satellite imagery: Approaches to identify and manage the invasive pathogen Xylella fastidiosa and its insect vectors in Europe. Sustainability 2020, 12, 4508. [Google Scholar] [CrossRef]
  26. Carpenter, G.; Gillison, A.N.; Winter, J. Domain: A flexible modeling procedure for mapping potential distributions of plants and animals. Biodivers. Conserv. 1993, 2, 667–680. [Google Scholar] [CrossRef]
  27. Chejara, V.K.; Kriticos, D.J.; Kristiansen, P.; Sindel, B.M.; Whalley, R.D.B.; Nadolny, C. The current and future potential geographical distribution of Hyparrhenia hirta. Weed Res. 2010, 50, 174–184. [Google Scholar] [CrossRef]
  28. Phillips, S.J.; Anderson, R.P.; Schapire, R.E. Maximum entropy modeling of species geographic distributions. Ecol. Modell. 2006, 190, 231–259. [Google Scholar] [CrossRef] [Green Version]
  29. Elith, J.H.; Graham, C.; Anderson, R.P.; Dudík, M.; Ferrier, S.; Guisan, A.; J. Hijmans, R.; Huettmann, F.; Leathwick, J.R.; Lehmann, A.; et al. Novel methods improve prediction of species’ distributions from occurrence data. Ecography 2006, 29, 129–151. [Google Scholar] [CrossRef] [Green Version]
  30. Hijmans, R.J.; Elith, J. Species Distribution Modeling with R. Encycl. Biodivers. 2013, 6. [Google Scholar] [CrossRef]
  31. Guzmán, N.V.; Lanteri, A.A.; Confalonieri, V.A. Colonization ability of two invasive weevils with different reproductive modes. Evol. Ecol. 2012, 26, 1371–1390. [Google Scholar] [CrossRef]
  32. Ramos, R.S.; Kumar, L.; Shabani, F.; Picanço, M.C. Mapping global risk levels of Bemisia tabaci in areas of suitability for open field tomato cultivation under current and future climates. PLoS ONE 2018, 13, e0198925. [Google Scholar] [CrossRef] [PubMed]
  33. Santana Jr, P.A.; Kumar, L.; Da Silva, R.S.; Pereira, J.L.; Picanco, M.C. Assessing the impact of climate change on the worldwide distribution of Dalbulus maidis (DeLong) using MaxEnt. Pest Manag. Sci. 2019, 75, 2706–2715. [Google Scholar] [CrossRef] [PubMed] [Green Version]
  34. Muscarella, R.; Galante, P.J.; Soley-Guardia, M.; Boria, R.A.; Kass, J.M.; Uriarte, M.; McPherson, J. An R package for conducting spatially independent evaluations and estimating optimal model complexity for MaxEnt ecological niche models. Methods Ecol. Evol. 2014, 5, 1198–1205. [Google Scholar] [CrossRef] [Green Version]
  35. Warren, D.L.; Glor, R.E.; Turelli, M. ENMTools: A toolbox for comparative studies of environmental niche models. Ecography 2010, 33, 607–611. [Google Scholar] [CrossRef]
  36. Riahi, K.; van Vuuren, D.P.; Kriegler, E.; Edmonds, J.; O’Neill, B.C.; Fujimori, S.; Bauer, N.; Calvin, K.; Dellink, R.; Fricko, O.; et al. The shared socioeconomic pathways and their energy, land use, and greenhouse gas emissions implications: An overview. Glob. Environ. Chang. 2017, 42, 153–168. [Google Scholar] [CrossRef] [Green Version]
  37. Phillips, S.J.; Anderson, R.P.; Dudík, M.; Schapire, R.E.; Blair, M.E. Opening the black box: An open-source release of MaxEnt. Ecography 2017, 40, 887–893. [Google Scholar] [CrossRef]
  38. Morales, N.S.; Fernández, I.C.; Baca-González, V. MaxEnt’s parameter configuration and small samples: Are we paying attention to recommendations? A systematic review. PeerJ 2017, 5, e3093. [Google Scholar] [CrossRef]
  39. Merow, C.; Smith, M.J.; Silander, J.A. A practical guide to MaxEnt for modeling species’ distributions: What it does, and why inputs and settings matter. Ecography 2013, 36, 1058–1069. [Google Scholar] [CrossRef]
  40. Warren, D.L.; Wright, A.N.; Seifert, S.N.; Shaffer, H.B. Incorporating model complexity and spatial sampling bias into ecological niche models of climate change risks faced by 90 California vertebrate species of concern. Divers. Distrib. 2014, 20, 334–343. [Google Scholar] [CrossRef]
  41. Altamiranda-Saavedra, M.; Amat, E.; Gómez-P, L.M. Influence of montane altitudinal ranges on species distribution models; evidence in Andean blow flies. PeerJ 2020, 8, e10370. [Google Scholar] [CrossRef] [PubMed]
  42. Wang, Y.; Watson, G.W.; Zhang, R. The potential distribution of an invasive mealybug Phenacoccus Solenopsis and its threat to cotton in Asia. Agric. For. Entomol. 2010, 12, 403–416. [Google Scholar] [CrossRef]
  43. Swets, J.A. Measuring the accuracy of diagnostic systems. Science 1988, 240, 1285–1293. [Google Scholar] [CrossRef] [PubMed] [Green Version]
  44. Xue, Y.; Lin, C.; Wang, Y.; Zhang, Y.; Ji, L. Ecological niche complexity of invasive and native cryptic species of the Bemisia tabaci species complex in China. J. Pest Sci. 2022, 95, 1245–1259. [Google Scholar] [CrossRef]
  45. Peterson, A.T.; Papeş, M.; Soberón, J. Rethinking receiver operating characteristic analysis application in ecological niche modeling. Ecol. Modell. 2008, 213, 63–72. [Google Scholar] [CrossRef]
  46. Pearce, J.; Ferrier, S. An evaluation of alternative algorithms for fitting species distribution models using logistic regression. Ecol. Modell. 2000, 128, 127–147. [Google Scholar] [CrossRef]
  47. Bean, W.T.; Stafford, R.; Brashares, J.S. The effects of small sample size and sample bias on threshold selection and accuracy assessment of species distribution models. Ecography 2012, 35, 250–258. [Google Scholar] [CrossRef]
  48. Warren, D.L.; Seifert, S.N. Ecological niche modeling in MaxEnt: The importance of model complexity and the performance of model selection criteria. Ecol. Appl. 2011, 21, 335–342. [Google Scholar] [CrossRef] [PubMed] [Green Version]
  49. Zhang, Y.B.; Liu, Y.L.; Qin, H.; Meng, Q.X. Prediction on spatial migration of suitable distribution of Elaeagnus mollis under climate change conditions in Shanxi Province, China. Ying Yong Sheng Tai Xue Bao 2019, 30, 496–502. [Google Scholar] [CrossRef] [PubMed]
  50. Sánchez-Reyes, U.J.; Jones, R.W.; Raszick, T.J.; Ruiz-Arce, R.; Sword, G.A. Potential distribution of wild Host Plants of the Boll Weevil (Anthonomus grandis) in the United States and Mexico. Insects 2022, 13, 337. [Google Scholar] [CrossRef]
  51. Greenberg, S.M.; Sétamou, M.; Sappington, T.W.; Liu, T.-X.; Coleman, R.J.; Armstrong, J.S. Temperature-dependent development and reproduction of the boll weevil (Coleoptera: Curculionidae). Insect Sci. 2005, 12, 449–459. [Google Scholar] [CrossRef]
  52. De Lima, I.S.; Degrande, P.E.; Miranda, J.E.; dos Santos, W.J. Evaluation of the boll weevil Anthonomus grandis Boheman (Coleoptera: Curculionidae) suppression program in the State of Goiás, Brazil. Neotrop. Entomol. 2013, 42, 82–88. [Google Scholar] [CrossRef]
  53. Ben-David, A. About the relationship between ROC curves and Cohen’s kappa. Eng. Appl. Artif. Intell. 2008, 21, 874–882. [Google Scholar] [CrossRef]
  54. Spurgeon, D.W.; Suh, C.P.-C. Temperature influences on diapause induction and survival in the boll weevil (Coleoptera: Curculionidae). J. Insect Sci. 2017, 17, 124. [Google Scholar] [CrossRef] [Green Version]
  55. Greenberg, S.M.; Sparks, A.N., Jr.; Norman, J.W., Jr.; Coleman, R.; Bradford, J.M.; Yang, C.; Sappington, T.W.; Showler, A. Chemical cotton stalk destruction for maintenance of host-free periods for the control of overwintering boll weevil in tropical and subtropical climates. Pest Manag. Sci. 2007, 63, 372–380. [Google Scholar] [CrossRef] [PubMed]
  56. Cornelissen, B.; Neumann, P.; Schweiger, O. Global warming promotes biological invasion of a honey bee pest. Glob. Chang. Biol. 2019, 25, 3571–3994. [Google Scholar] [CrossRef] [Green Version]
  57. Daniel, G.-T.; Alex, C.-A.; Wesley, D.; Andrés, L.-N.; Sánchez-Guillén Rosa, A.; Villalobos, F. Insect responses to heat: Physiological mechanisms, evolution and ecological implications in a warming world. Biol. Rev. Camb. Philos. Soc. 2020, 95, 802–821. [Google Scholar] [CrossRef]
  58. Gao, X.Y.; Zhao, Q.; Wei, J.F.; Zhang, H.F. Study on the Potential Distribution of Leptinotarsa decemlineata and Its Natural Enemy Picromerus bidens Under Climate Change. Front. Ecol. Evol. 2022, 9, 786436. [Google Scholar] [CrossRef]
  59. Turbelin, A.J.; Diagne, C.; Hudgins, E.J.; Moodley, D.; Kourantidou, M.; Novoa, A.; Haubrock, P.J.; Bernery, C.; Gozlan, R.E.; Francis, R.A.; et al. Introduction pathways of economically costly invasive alien species. Biol. Invasions. 2022, 24, 2061–2079. [Google Scholar] [CrossRef]
  60. Blackburn, T.M.; Pyšek, P.; Bacher, S.; Carlton, J.T.; Duncan, R.P.; Jarošík, V.; Wilson, J.R.; Richardson, D.M. A proposed unifed framework for biological invasions. Trends Ecol. Evol. 2011, 26, 333–339. [Google Scholar] [CrossRef] [Green Version]
  61. Lehan, N.E.; Murphy, J.R.; Thorburn, L.P.; Bradley, B.A. Accidental introductions are an important source of invasive plants in the continental United States. Am. J. Bot. 2013, 100, 1287–1293. [Google Scholar] [CrossRef] [PubMed]
  62. Essl, F.; Bacher, S.; Blackburn, T.M.; Booy, O.; Brundu, G.; Brunel, S.; Cardoso, A.C.; Eschen, R.; Gallardo, B.; Galil, B.; et al. Crossing frontiers in tackling pathways of biological invasions. Bioscience 2015, 65, 769–782. [Google Scholar] [CrossRef] [Green Version]
  63. Raszick, T.J. Boll Weevil Eradicationin: A Success Story of Science in the Service of Policy and Industry. Ann. Entomol. Soc. Am. 2021, 114, 702–708. [Google Scholar] [CrossRef]
  64. McCullough, D.G.; Work, T.T.; Cavey, J.F.; Liebhold, A.M.; Marshall, D. Interceptions of nonindigenous plant pests at US ports of entry and border crossings over a 17-year period. Biol. Invasions. 2006, 8, 611–630. [Google Scholar] [CrossRef]
  65. Caton, B.P.; Dobbs, T.T.; Brodel, C.F. Arrivals of hitchhiking insect pests on international cargo aircraft at Miami International Airport. Biol. Invasions. 2006, 8, 765–785. [Google Scholar] [CrossRef]
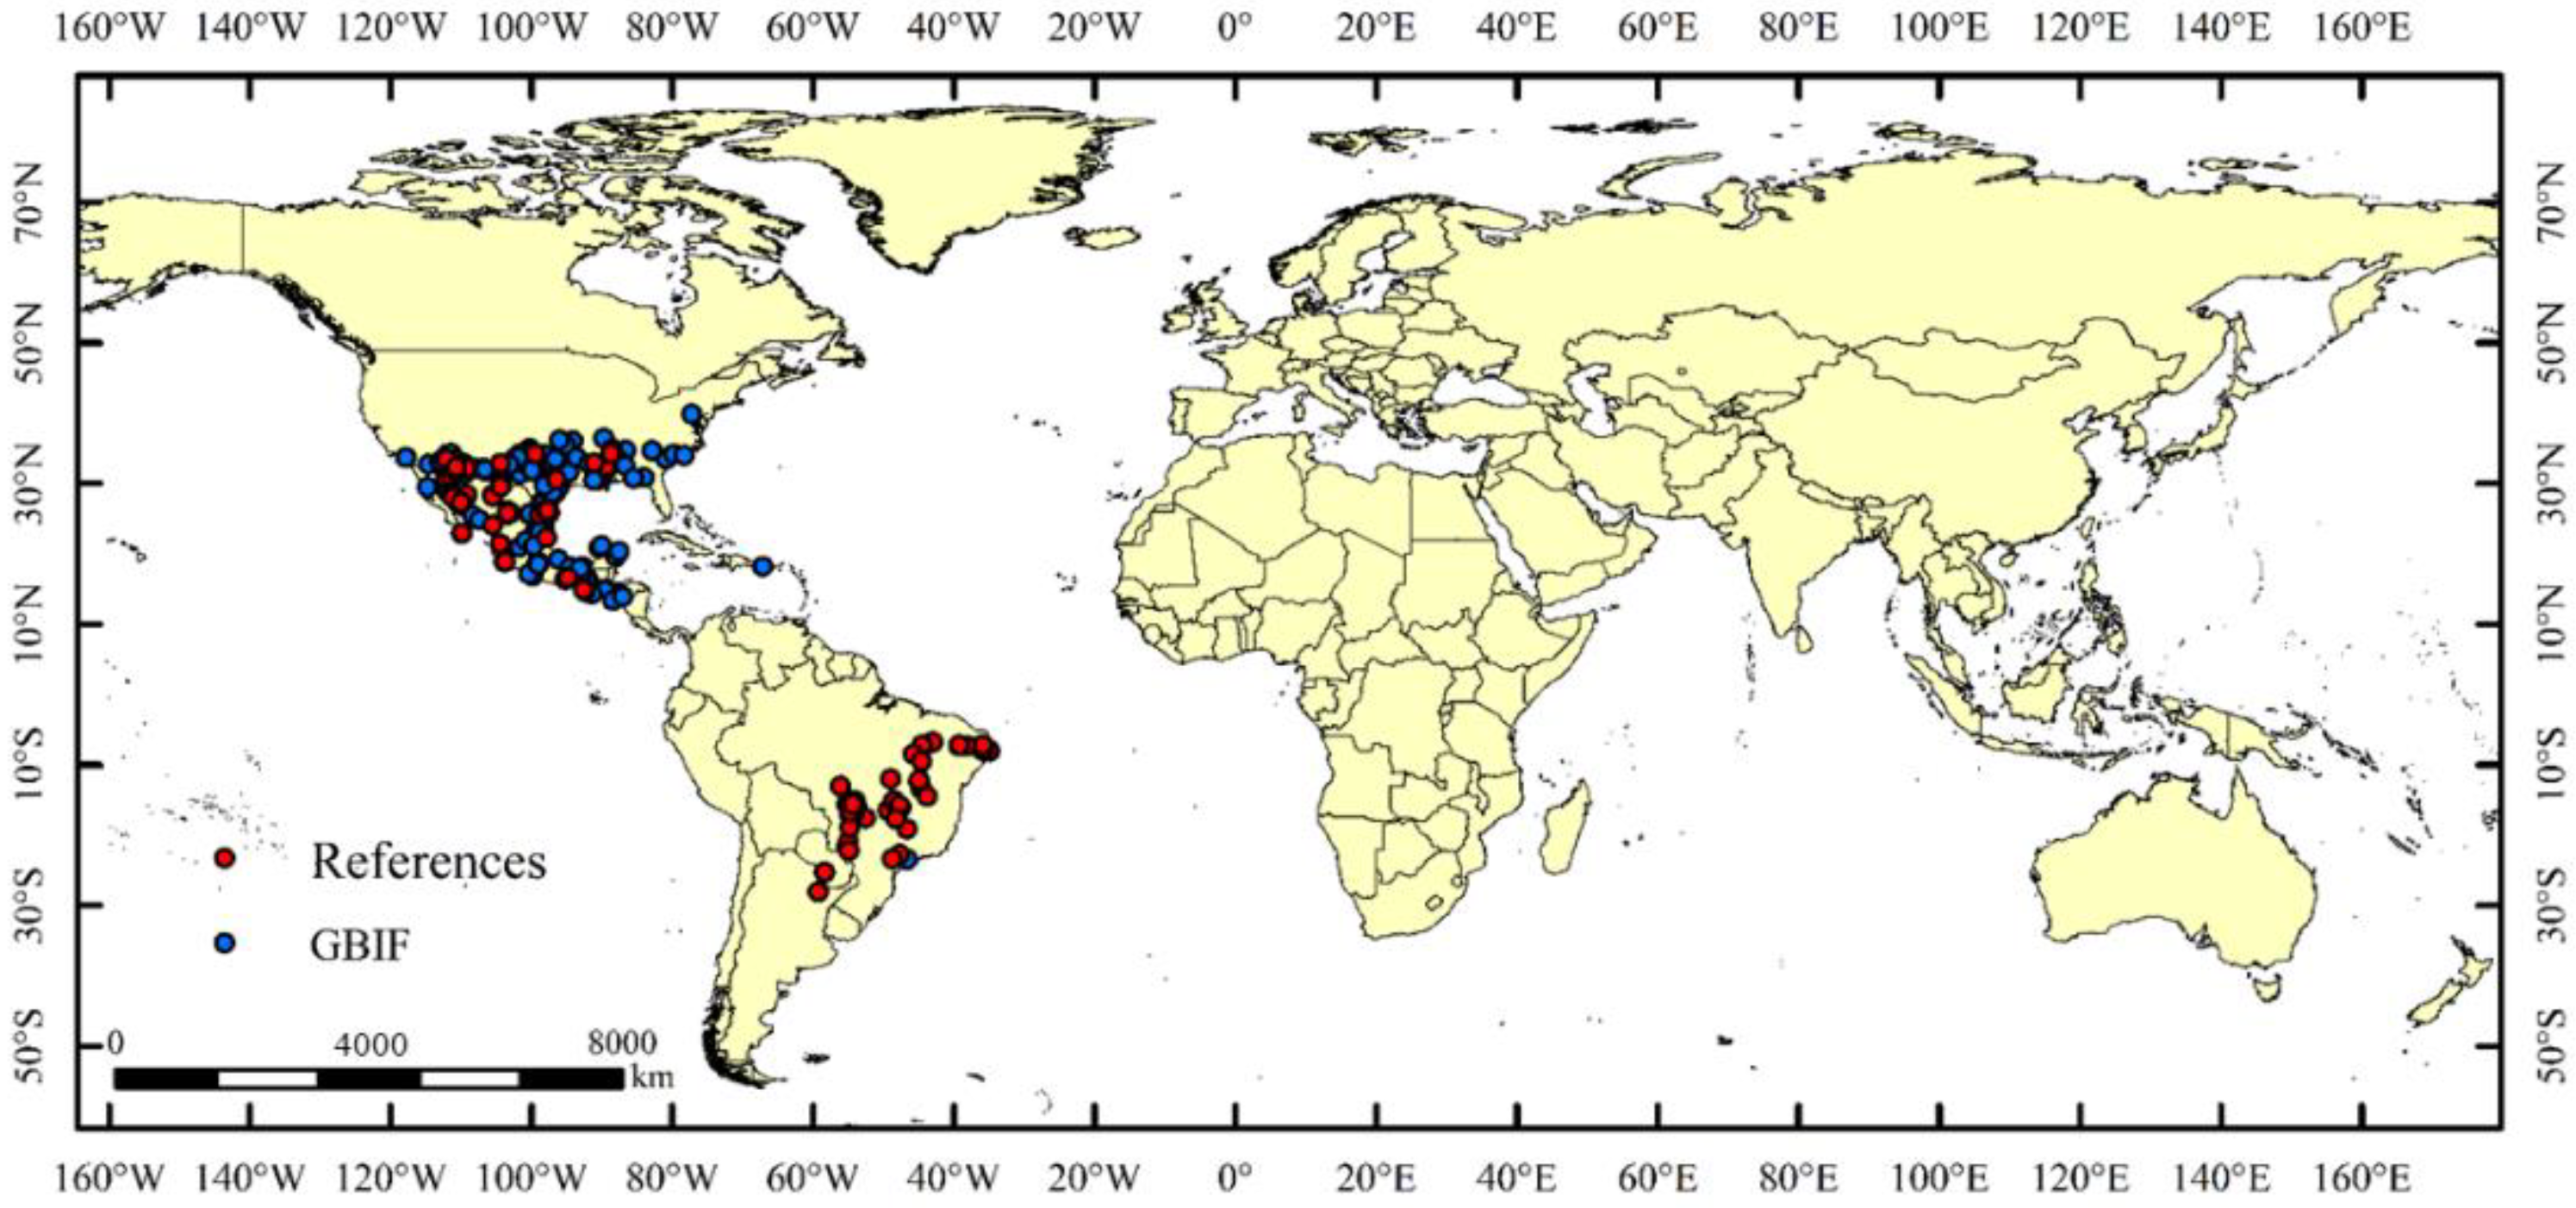
Figure 1. Global known sampling point distribution of Anthonomus grandis.
Agriculture 12 01759 g001
Figure 2. Parameter combination results for Anthonomus grandis by ENMeval package.
Agriculture 12 01759 g002
Figure 3. AIC value of the parameter combination (FC, RM) based on ENMeval.
Agriculture 12 01759 g003
Figure 4. Response curves of the bioclimatic variables most related to the distribution of Anthonomus grandis: (a) bio3 (Isothermality); (b) bio1 (Annual Mean Temperature); (c) bio18 (Precipitation of warmest quarter); (d) bio19 (Precipitation of warmest quarter).
Agriculture 12 01759 g004
Figure 5. Current global distribution of suitable habitats of Anthonomus grandis.
Agriculture 12 01759 g005
Figure 6. Future potential distributions of Anthonomus grandis based on the BCC-CSM2-MR model: SSP5-85, 2030s; SSP5-85, 2050s; SSP5-85, 2070s; SSP5-85, 2090s.
Agriculture 12 01759 g006
Figure 7. Future changes in potential suitable global habitats areas of Anthonomus grandis in different periods vs. the current climate scenario.
Agriculture 12 01759 g007
Figure 8. Area of the future potential global distribution of Anthonomus grandis under future climate scenarios in each continent.
Agriculture 12 01759 g008
Figure 9. Changes in geographical centers of the potential distribution areas of Anthonomus grandis in the different periods.
Agriculture 12 01759 g009
Table 1. Selected bioclimatic variables and their contribution rate to the model.
VariableDescriptionContribution (%)
Bio1Annual Mean Temperature (°C)7.2
Bio2Mean Diurnal Range (°C)10.5
Bio3Isothermality (%)51.4
Bio7Temperature Annual Range (°C)1.1
Bio15Precipitation Seasonality (mm)0.2
Bio17Precipitation of Driest Quarter (mm)1.1
Bio18Precipitation of Warmest Quarter (mm)17.5
Bio19Precipitation of Coldest Quarter (mm)11.5
Publisher’s Note: MDPI stays neutral with regard to jurisdictional claims in published maps and institutional affiliations.