Article

Analysis of Crop Sustainability Production Potential in Northwest China: Water Resources Perspective

1
School of Geography Sciences, Shanxi Normal University, Taiyuan 030031, China
2
Ecological Environment Research Center of Middle Yellow River, School of Geography Sciences, Shanxi Normal University, Taiyuan 030031, China
Agriculture 2022, 12(10), 1665; https://doi.org/10.3390/agriculture12101665
Submission received: 7 August 2022 / Revised: 6 September 2022 / Accepted: 3 October 2022 / Published: 11 October 2022

Abstract

:
From the perspective of water resources, revealing the potential of sustainable production of crops, clarifying the obstacles, and taking effective measures in advance can not only provide residents with long-term sufficient and nutritious food needs but also help to promote food security and economic benefits. Previous studies on this aspect have mainly focused on food crops and paid less attention to cash crops. This study takes Northwest China as the research area, which is a typical arid and semi-arid region with the most prominent contradiction between water supply and demand. We analyzed the changing characteristics of the available water resources, the production water footprint, and the total water footprint over time from the perspective of water resources, and systematically analyze the potential for sustainable development. The results showed that the regional water resource consumption in 2000–2020 showed a significant upward trend (p < 0.01). Similarly, the water resource load index also increased in this period, which increased by 164.3%. Water resources pressure increased from level III to level I, and there is no further development potential. At the same time, the proportion of available agricultural water resources was forcibly reduced by 9.0%. Fortunately, the crop production water footprint showed a significant decreasing trend (p < 0.01), with a decrease of 43.6%. Among them, grain and cash crops decreased by 45.4% and 49.5% respectively. Although the production water footprint is reduced, regional production is increasing to meet the increasing consumer demand. The crop water footprint showed a significant increase (p < 0.01), increasing by 13.4%. The available water resources of crops in the region are compressed, but the amount of water needed for crop production is increasing significantly, which poses challenges to the sustainable production of crops. According to the research results, the detailed recommended measures to promote sustainable regional crop production are put forward from the perspective of increasing the amount of regional water resources available, improving the utilization efficiency of blue and green water, and crop yield level, so as to better serve the global food security.

1. Introduction

The sustainability of agricultural development is crucial to ensure global food security. By 2050, global food production will need to increase by 70% to meet the food needs of a global population of about 9.6 billion [1,2,3], making this one of the biggest challenges facing the world today. According to the ‘World Food Security and Nutritional Status in 2017’ report [4], after a decade of steady decline, the incidence of world hunger seems to have reappeared in 2016. It is estimated that the global population of the undernourished has increased from 777 M (2015) to 815 M (2016), which represents 11% of the global population [5]. Among them, Asia’s food shortage population is the largest. One of the important reasons is the large population in Asia. According to FAO estimates, nearly 520 million people in Asia could not obtain enough food energy in 2016 [6]. Therefore, it is urgent to take measures to increase crop yield and promote the sustainable development of crop production.
Water resources are the basic guarantee of food security. Agricultural water resource management is the key to ensuring the efficient use of agricultural water resources, alleviating the water crisis in agriculture, and promoting sustainable crop production [7,8]. In total, 70% of the world’s freshwater resources are utilized for agricultural production [9]. However, the arid and semi-arid areas cover an area of 45.7 M km2, accounting for 34.9% of the total land area [10]. Thus, nearly half of the world is in arid and semi-arid areas. Furthermore, climate change increases the probability of the occurrence of natural disasters such as droughts and floods [11]. Therefore, how to effectively improve water use efficiency of crops in arid and semi-arid regions is the key to ensuring crop yield and global food security [12]. It is necessary to systematically analyze the utilization of water resources by crops in arid and semi-arid areas and then reveal the challenges faced by crop sustainable production from the perspective of water resources in order to better serve global food security.
Since irrigation plays an extremely important role in crop production, a large number of scholars have conducted extensive research on food security in view of water resources. Developing countries tend to have relatively backward field production technology, and the average yield of irrigated food crops tends to be 60% higher than that of rainfed farmland [13]. Therefore, food security measures mainly focus on improving water-saving irrigation technologies, especially in arid and semi-arid areas where water resources are relatively scarce. For example, the application of water-saving irrigation technologies such as drip irrigation [14], microirrigation [15], sprinkler irrigation [16], pipe irrigation, thin and wet irrigation [17], wetting-drying alternation irrigation [18], intermittent irrigation [17], and controlled deficit irrigation [19] can improve the efficiency of water utilization of crops. Moreover, under the condition of water-saving irrigation technology, combining [14,20] with biochar can further improve the water utilization efficiency and relieve regional water stress. Recently proposed intensive agriculture [21] and smart agriculture [22,23] aim to improve water use efficiency and reduce the amount of water used for agricultural production. Although numerous scholars have conducted much research on improving crop water use efficiency, with the improvement of household living standards and urbanization, and the high emphasis of the government on ecology, the demand for domestic water and ecological water use has increased substantially, and most of these additional water resources come from agricultural [24]. In addition, residents’ diets are also changing virtually. Residents’ consumption of food is gradually changing from raw food to animal products [24], and on the premise of providing the same number of calories, animal products need more water resources [25]. These factors also add to the pressure on regional food security. Therefore, the assessment of agricultural water efficiency is indispensable while the global food security situation remains grim. It is of great significance to systematically reveal the new challenges brought by regional water resources to the sustainable development of crop production and propose effective response measures to ensure global food security. Current research on water resources and food security has focused on food crops, with less focus on cash crops, which are important components of agriculture and together determine the healthy development of agriculture. At present, the water resources allocation in most areas is conducted in the agricultural sector, which leads to the competition mechanisms between food and cash crops for agricultural water use. However, it is difficult to separate food and cash crops to fully reveal the problems facing the sustainability of crop production from the perspective of regional water resources.
In view of the scientific questions raised above, this paper selected Northwest China, which is the most arid and important in ensuring national food security, using the water footprint theory and water load index to quantify regional water resources quantity, the production and crop water (blue water and green water) footprint of food (rice, wheat, maize, soybeans, and potatoes) and cash crops (cotton, oil, vegetables, and fruits). On the basis of the systematic analysis of regional agricultural water resources distribution characteristics, the utilization characteristics and attributes of food and cash crops for water resources, it reveals the challenges brought by regional agricultural water resources to the sustainable development of crop production and then puts forward targeted measures to effectively relieve the pressure of regional water resources and promote the healthy development of crops.

2. Materials and Methods

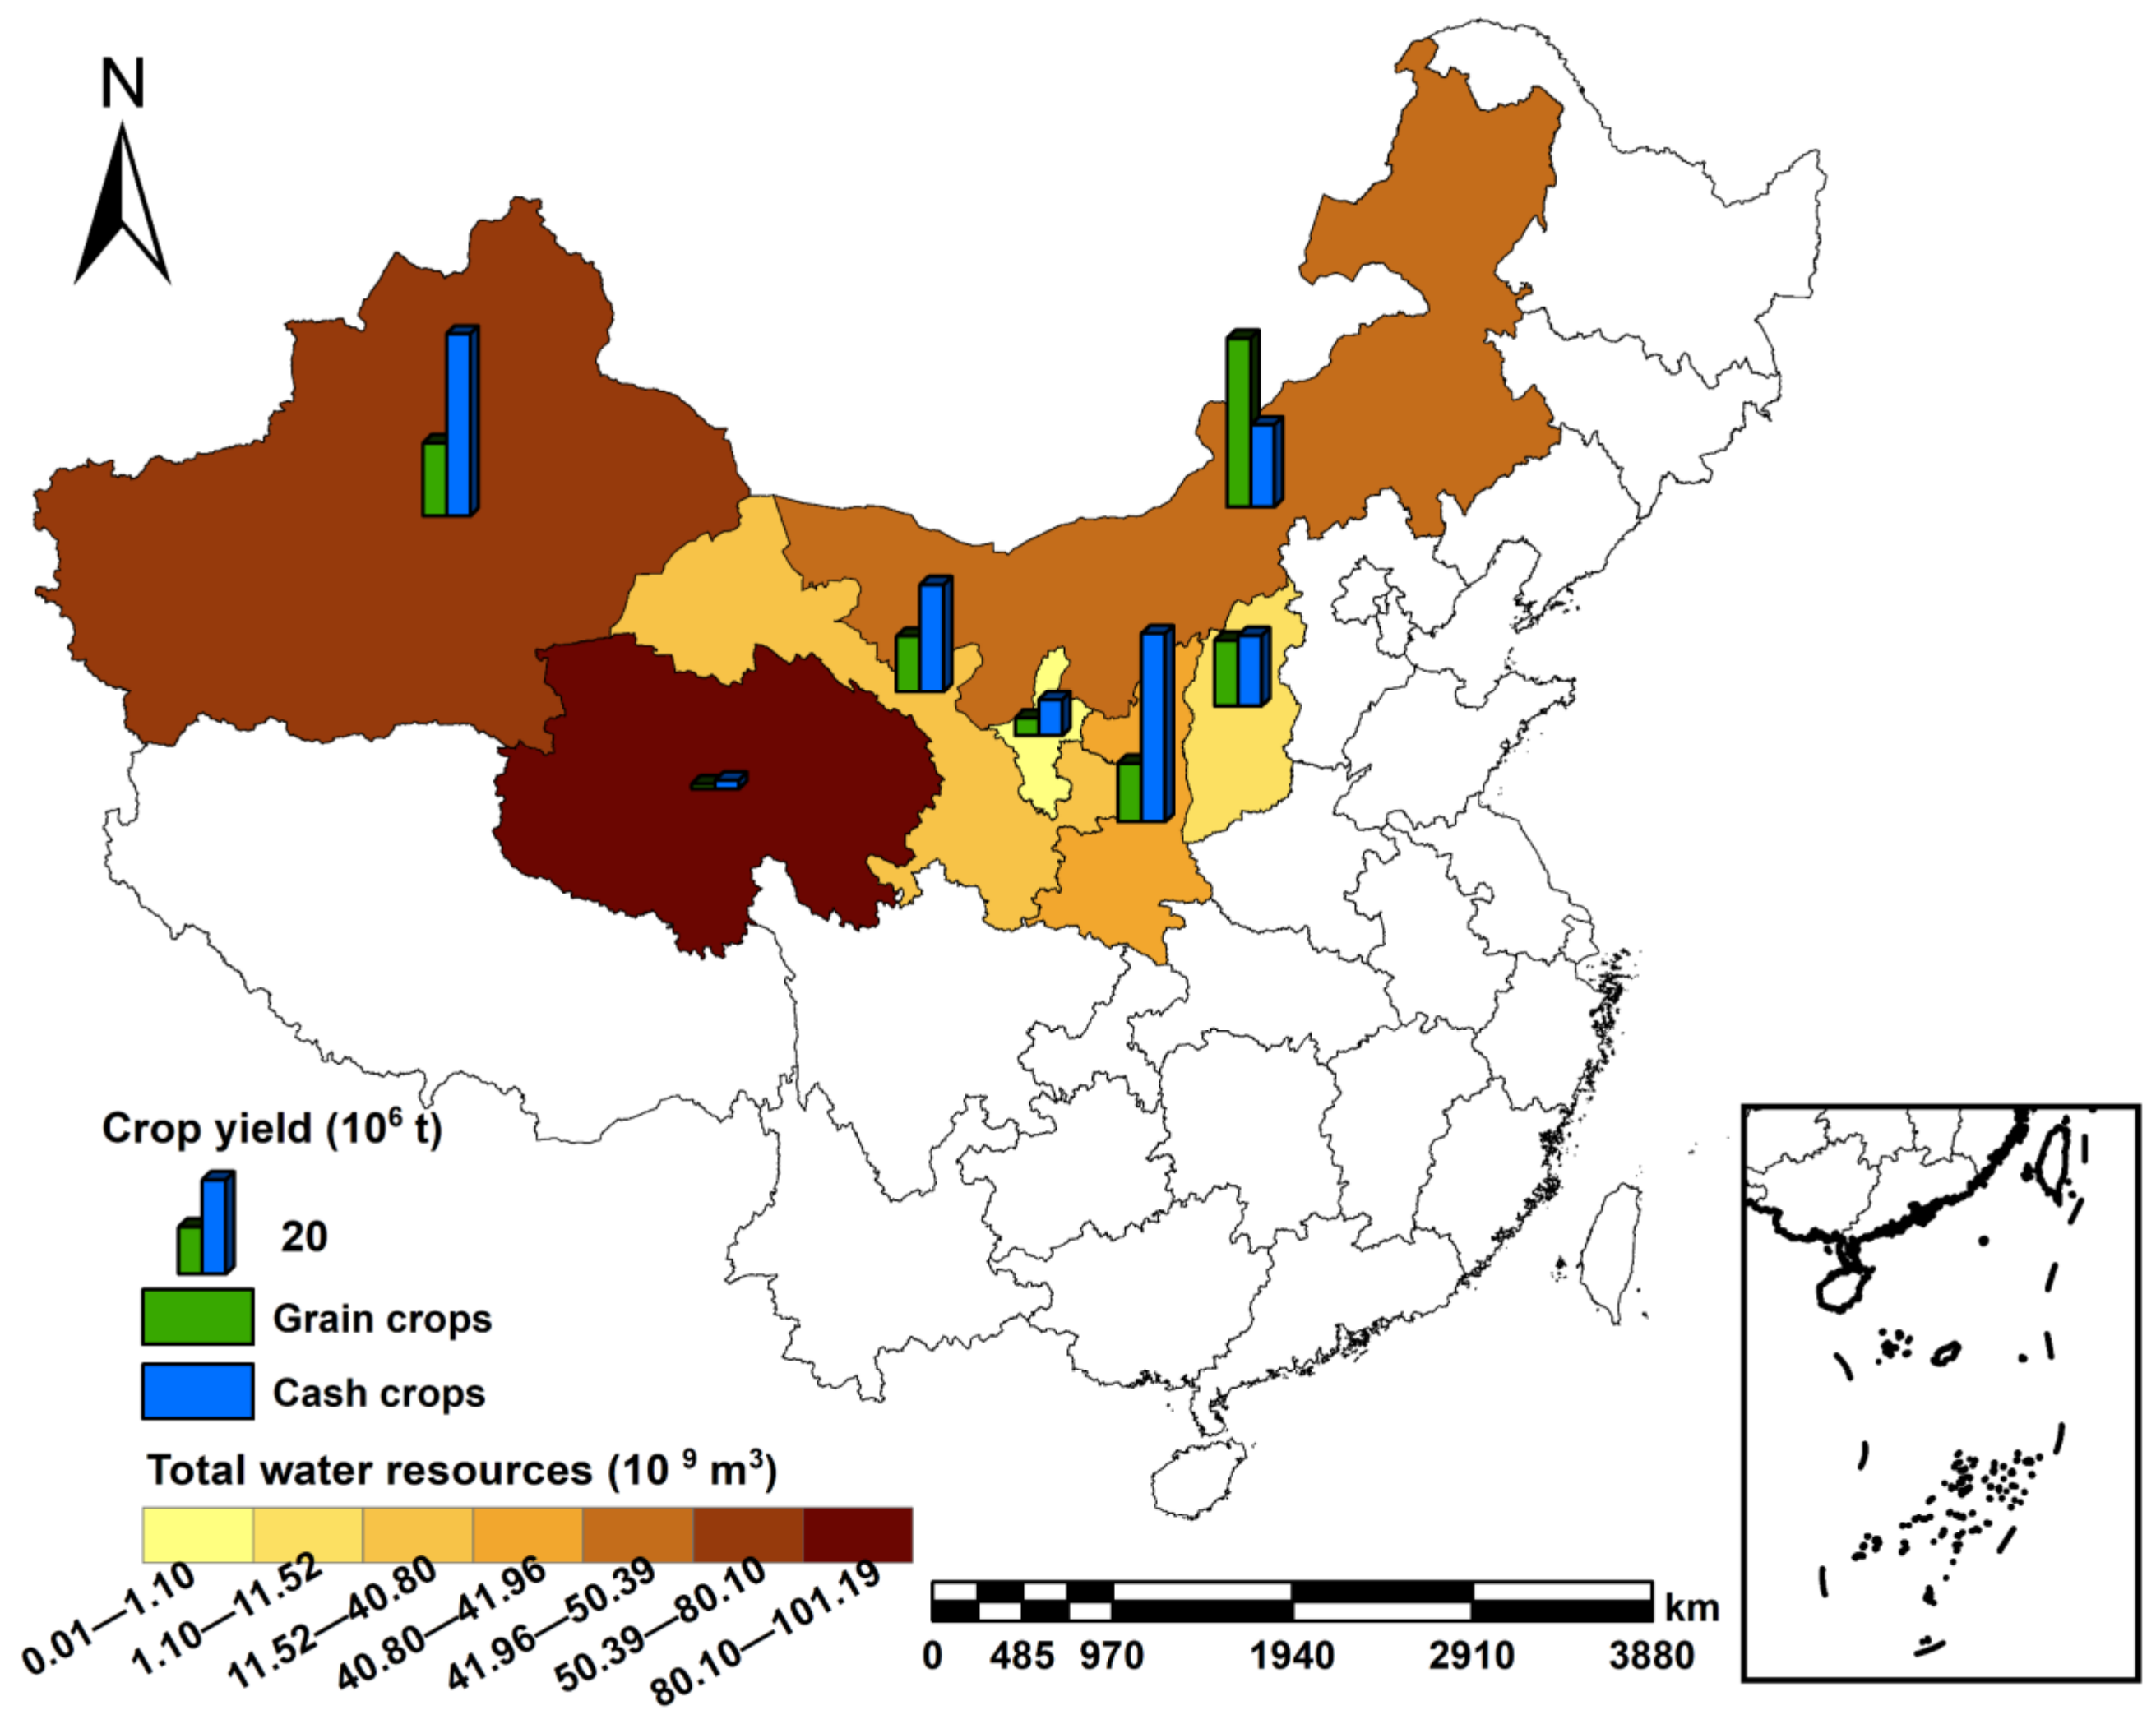
2.1. Overview of the Study Area

Northwest China (73°40′–126°04′ E, 31°60′–53°23′ N) covers Xinjiang Uygur Autonomous Region, Qinghai Province, Gansu Province, Inner Mongolia Autonomous Region, Ningxia Hui Autonomous Region, Shaanxi Province, and Shanxi Province (Figure 1). Its land resources are abundant, but water resources are very scarce. As the driest and most fragile area in China [26], it has only 10% of China’s water resources [25]. A large number of areas have average annual precipitation of less than 250 mm, but the potential evaporation is above 1000 mm, and even reaches 2000 mm in some areas [25]. This is a typical arid and semi-arid area [27], which means that the water resources utilized by agriculture, ecosystems and economic development in the northwest region are all limited, thus restricting the sustainable development of agriculture in the northwest region [28].

2.2. Methods

2.2.1. Water Footprint of Crop Production

Crop production water footprint refers to the amount of water resources consumed during crop production in a designated area [29,30], which is different from crop water productivity. The water footprint of crop production can not only reflect the total amount of water resources consumed during crop growth but also reflect the water consumption type (blue water or green water) of crops [31]. Blue water refers to groundwater and surface water resources, that is, water stored in freshwater lakes, rivers, and aquifers. Green water refers to water derived from precipitation and consumed by crop evapotranspiration. In order to better explore the amount of water demanded during crop production, the calculation of the blue water footprint in this study represents the losses and return flows involved in the delivery of irrigation water from the source to the farm in the model. This is the main difference with the approach of Hoekstra et al. [32,33].
W F p r o d i = ( B W F i + G W F i ) G i
where W F p r o d i represents the produced water footprint of grain or cash crops in province i (m3/kg); B W F i and G W F i represent the blue-water and green-water footprints consumed by grain or cash crops in province i during production (m3), respectively; Gi is the crop production in region i (kg). The crops in this study mainly include grain crops (including rice, wheat, maize, soybeans, and potatoes) and cash crops (including cotton, oil, vegetables, and fruits).
G W F i = c = 1 n ( W g c × A G c )
where W g c and A G c represent the green-water consumption (m3) and sown area (ha) of crop c during the reproductive period, respectively [34]. n represents the sum of the various grain (rice, wheat, maize, soybeans, and potatoes) and cash (cotton, oils, vegetables, and fruits) crop species involved in this study.
W g c = 10 min ( E T c c , P e c )
where P e c and E T c c represent the effective precipitation (mm) and actual evapotranspiration (mm) of crop c throughout its growth, respectively. The 10 represents the conversion factor for the process of converting water depth units (mm) to volume units (m3/ha).
E T C c = K c × E T 0
where K c represents the crop coefficient, which is determined by the crop characteristics and the average evapotranspiration effect of the soil [32,35]. E T 0 represents the reference crop evapotranspiration (mm) [36].
E T 0 = 0.408 Δ R n G + γ 900 T + 273 u 2 e s e a Δ + γ 1 + 0.34 u 2
where Δ , G , R n and γ represent the slope of the saturation water vapor-pressure versus temperature curve (kPa∙°C−1), soil heat flux (MJ∙m−2∙day−1), reference crop canopy surface net radiation (MJ∙m−2∙day−1), and wet-dry table coefficient (KPa∙°C−1), respectively. T and u 2 represent the average daily air temperature (°C) and wind speed (m∙s−1) at 2 m, respectively. e s and e a represent the saturation and actual water-vapor pressure (KPa), respectively.
The average value of daily precipitation of each region and each station in the same time period is used as the daily precipitation value of the province in that time period [24]. The USDA recommended method was used to calculate the effective precipitation for the crop reproductive period [37].
P e c = P ( 4.17 0.2 P ) / 4.17           P < 8 . 3   m m / d 4.17 + 0.1 P           P 8 . 3   m m / d
where P stands for precipitation (mm).
B W F i = c = 1 n ( I G c × A G c )
where I G c is the irrigation water consumption of crop c per unit area (m3∙ha−1) and A G c is the sown area of crop c (ha).
I G c = ( W U A × R G c ) / A G c
where R G c and WUA represent the proportion of irrigation water for crop c in the region to the total irrigation water and the total irrigation water consumption (m3), respectively [38].
R G c = ( E T c c P e c ) × A G c c = 1 n [ ( E T c c P e c ) × A G c ]

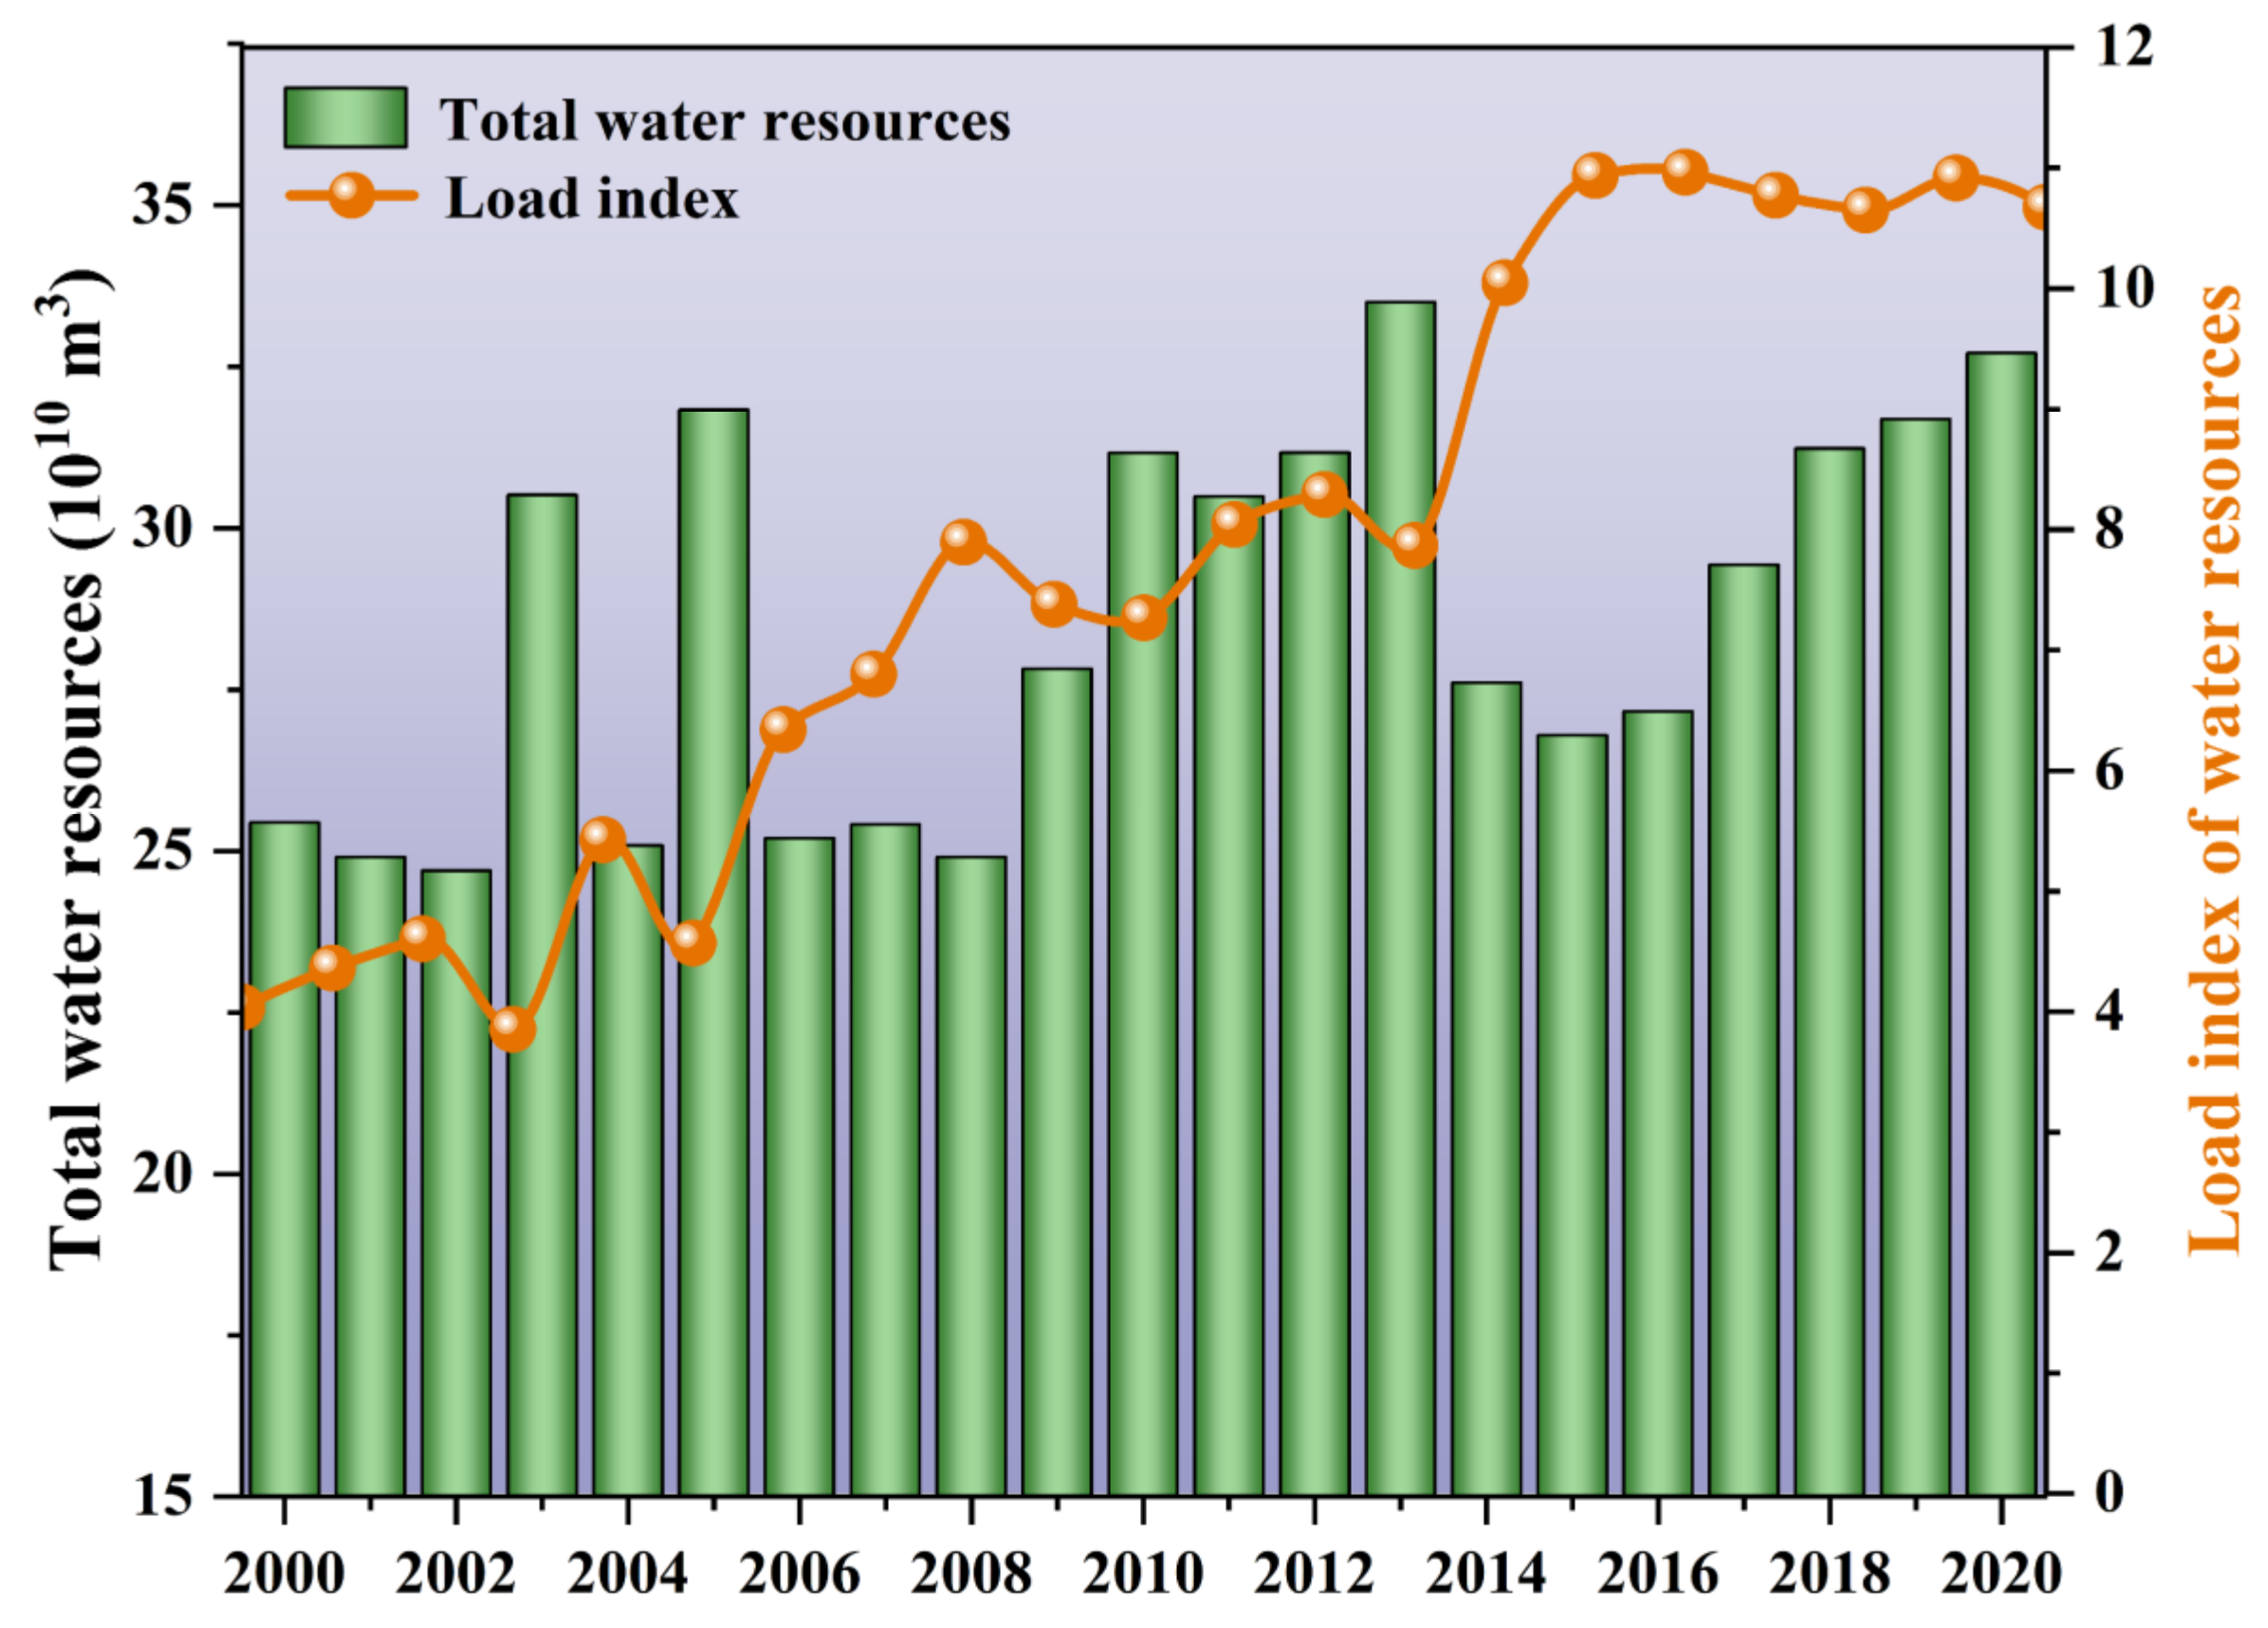
2.2.2. Water-Resource Load Index

The water-resources load index model takes into account both the natural and social attributes of a specific regional water resource system and can effectively present the realistic profile and development potential of regional water resource use [24].
C ( t ) = K ( t ) P ( t ) G ( t ) / W ( t )
where C(t), K(t), P(t), G(t) and W(t) denote the water-resources load index, precipitation coefficient, population (104 people), GDP (CNY 100 M) and total water resources (100 M cubic meters) of each province associated with time t, respectively; K(t) can be obtained from the following equation:
K ( t ) = 1.0 ,                                 R ( t ) 200   m m ; 1 . 0 0 . 1 × R ( t ) 200 200 ,           200 < R ( t ) 400   m m ; 0.9 0.2 × R ( t ) 400 400 ,           400 < R ( t ) 800   m m ; 0.7 0.2 × R ( t ) 800 800 ,           800 < R ( t ) 1600   m m ; 0.5 ,                     R ( t ) > 1600
where R(t) represents the precipitation amount (mm) in each province closely related to time t. The water-resources load index is divided into five levels, and the level division principle is shown in Table 1.

2.3. Data Sources

The meteorological data involved in this study are from China Meteorological Data Service Center (http://data.cma.cn accessed on 20 August 2021). The data on the total amount of water resources, industrial water, agricultural water, ecological water, and domestic water used in the provinces of Northwest China are from the Water Resources Bulletin of China and its provinces from 2001 to 2021. The data of planting area, irrigation water quantity, and yield of each grain and cash crop are from the Water Resources Bulletin of China and each province from 2001 to 2021, Statistical Yearbook of China and each province, China Rural Statistical Yearbook, China Environmental Yearbook, and China Agricultural Yearbook. Population and GDP data are taken from the 2001–2021 Statistical Yearbooks of the provinces.

3. Results

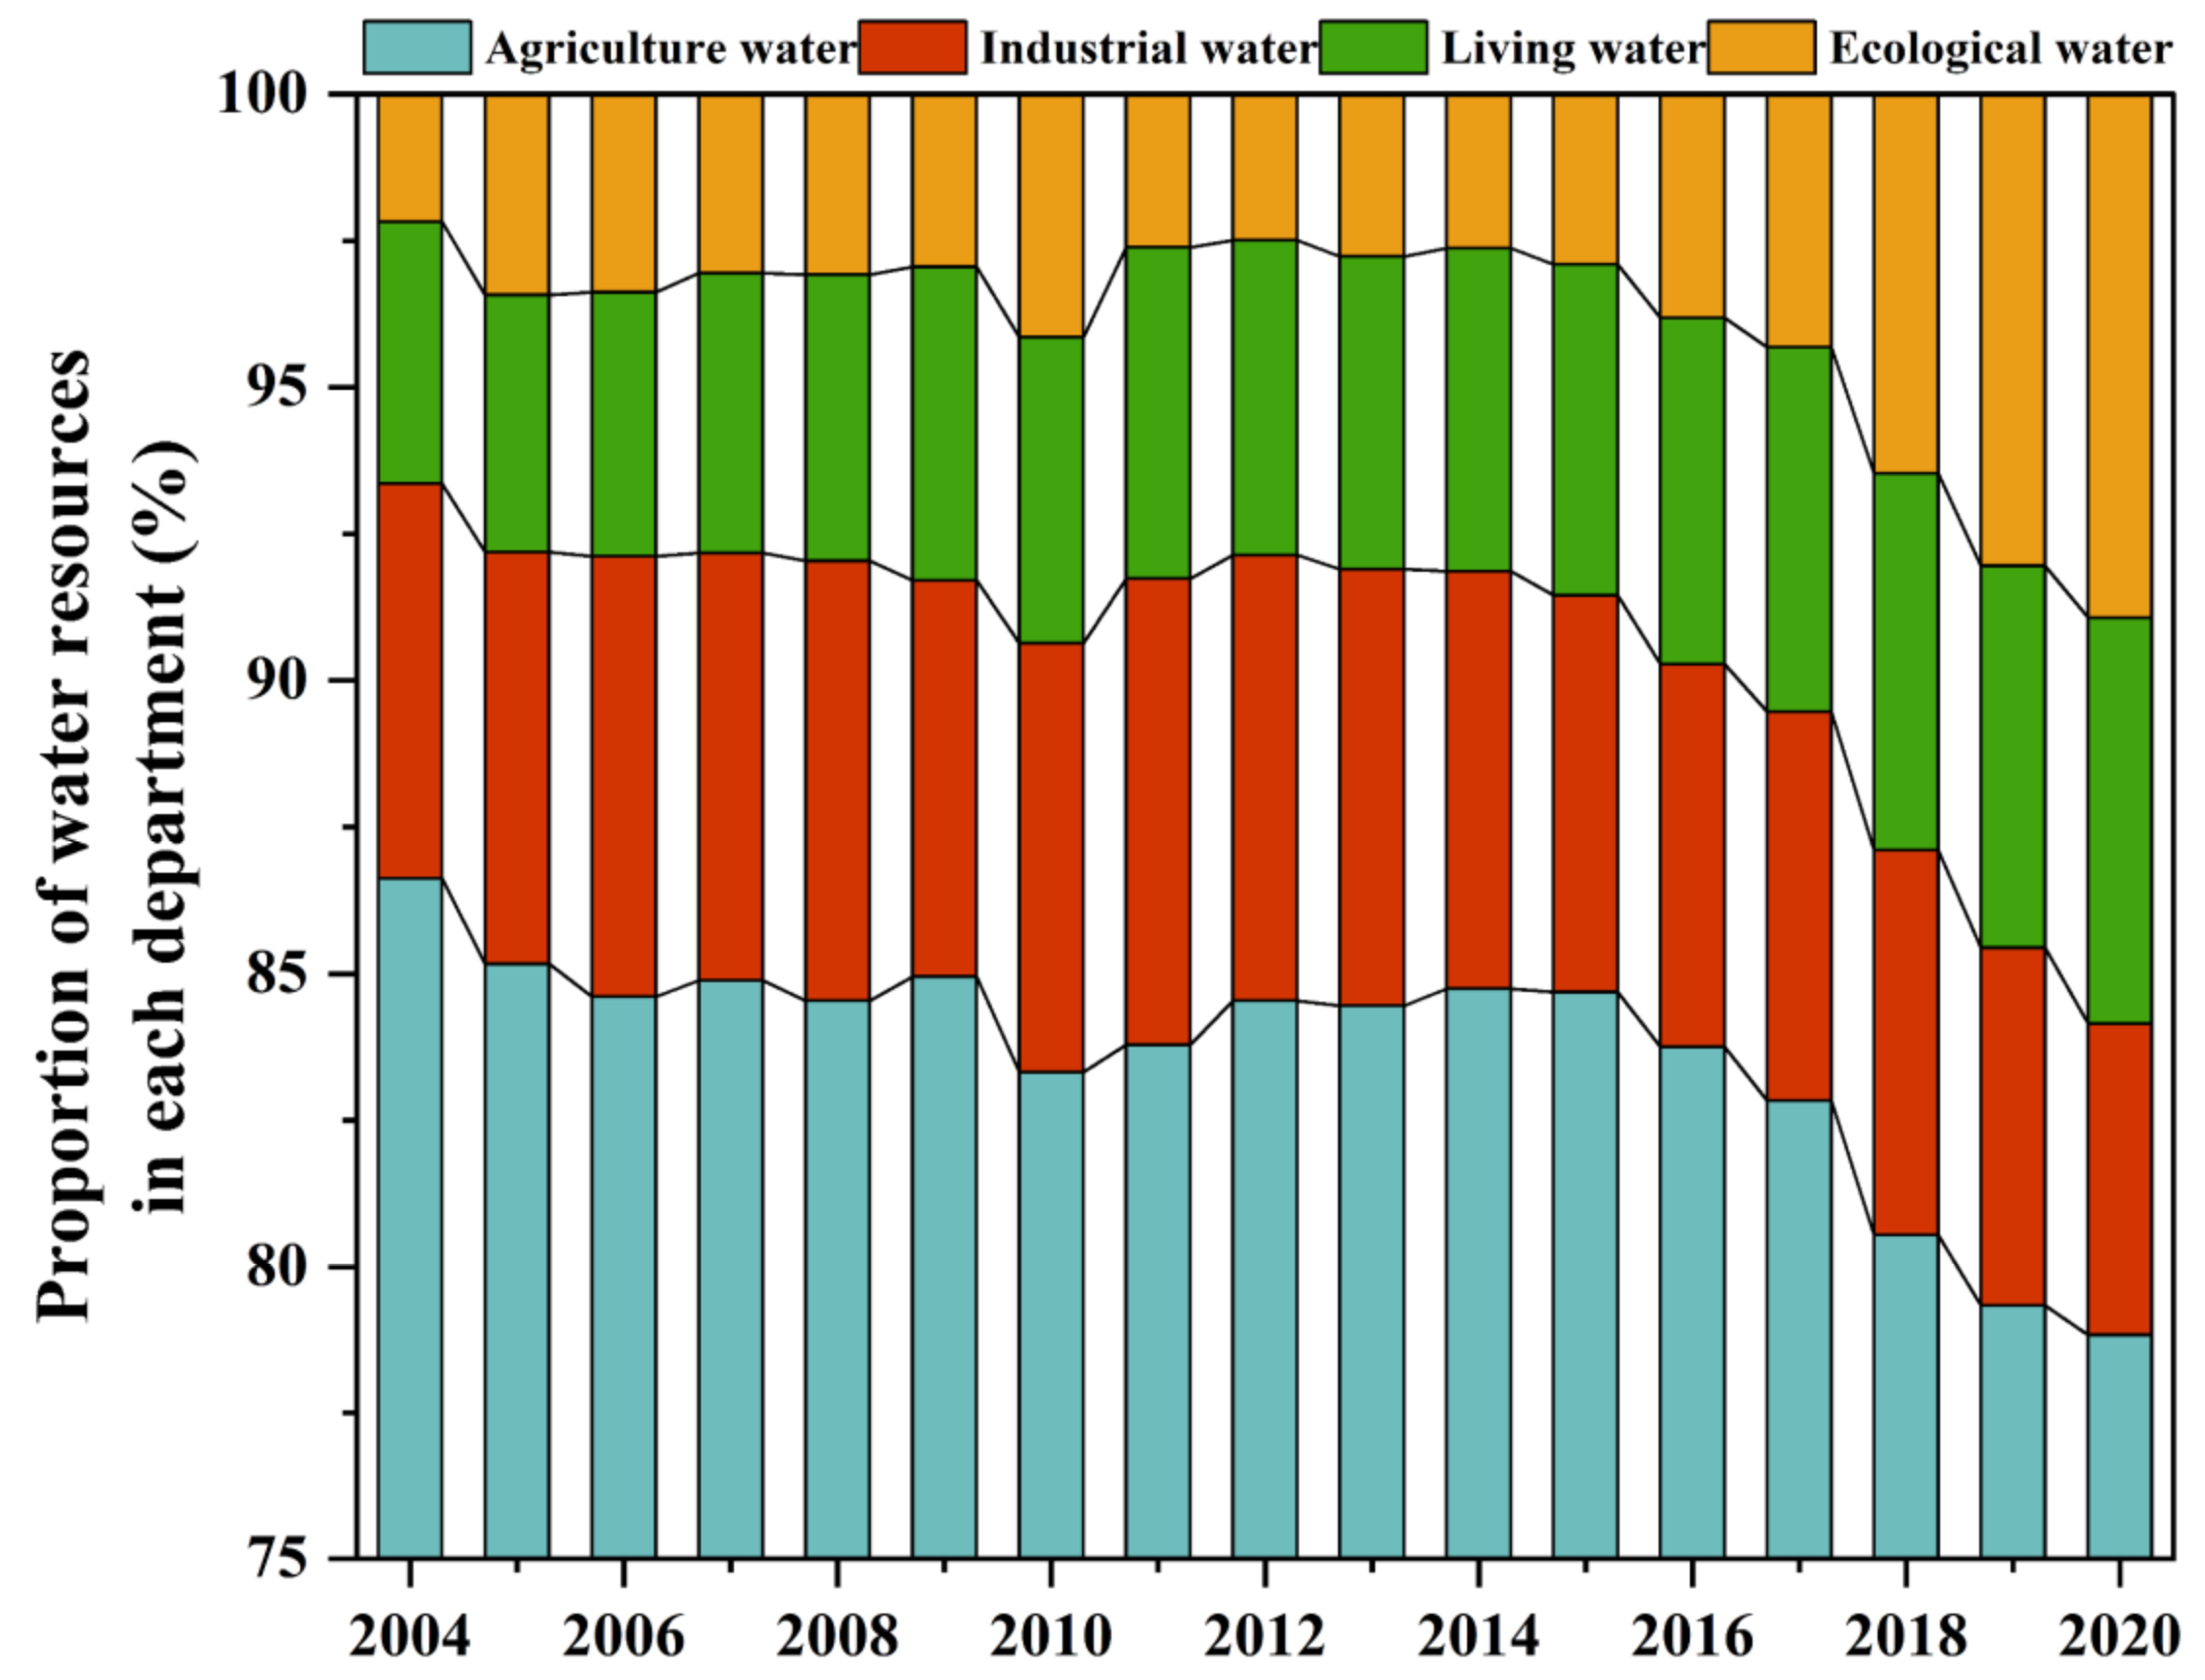
3.1. Potential Analysis of Agricultural Available Water Resources

With the increase in water consumption in Northwest China, water resources have been at a high level of water resources pressure and have no development potential. From 2000 to 2020, water resource consumption showed a significant upward trend (p < 0.01), with an average annual increase of 0.5% (Figure 2). According to the changing characteristics of regional water resource consumption over time, it can be divided into two stages. In the first stage, water consumption increased significantly (p < 0.01). From 2000 to 2013, water consumption increased by 12.8%. In the second stage, the consumption of water resources is relatively stable. From 2014 to 2020, the average annual decrease in water consumption was 0.3%. The regional water resource load index is highly consistent with the changing trend of water resource consumption. From 2000 to 2020, the regional water-resource load index showed a significant increasing trend (p < 0.01), and the water resource pressure increased from grade III to grade I. This indicates that water resources are already at a high water pressure level and do not have development potential. Therefore, it can be seen that the water resources in Northwest China are already at a high water pressure level, and the amount of available water resources are being reduced on the basis that the water resources do not have development potential.

3.2. Evolutionary Characteristics of Agricultural Available Water Resources

The proportion of agriculturally available water resources in Northwest China is decreasing year by year, which threatens the sustainable development of crop production. With the emphasis on ecology and rapid urbanization, regional ecological and domestic water consumption increased significantly (p < 0.01) from 2004 to 2020, by 309.9% and 55.0%, respectively (Figure 3). On the basis of the regionally available water resources no longer increasing or even decreasing, the available water resources of the agricultural sector with the largest demand for water resources are largely occupied. From 2004 to 2020, the available water resources for agriculture showed a significant decreasing trend (p < 0.01), and their proportion decreased by 9.0%, with an average annual decrease of 0.6%. The reduction of agricultural available water resources year by year will inevitably threaten crop yields in arid and semi-arid areas and bring challenges to sustainable crop production and food security.

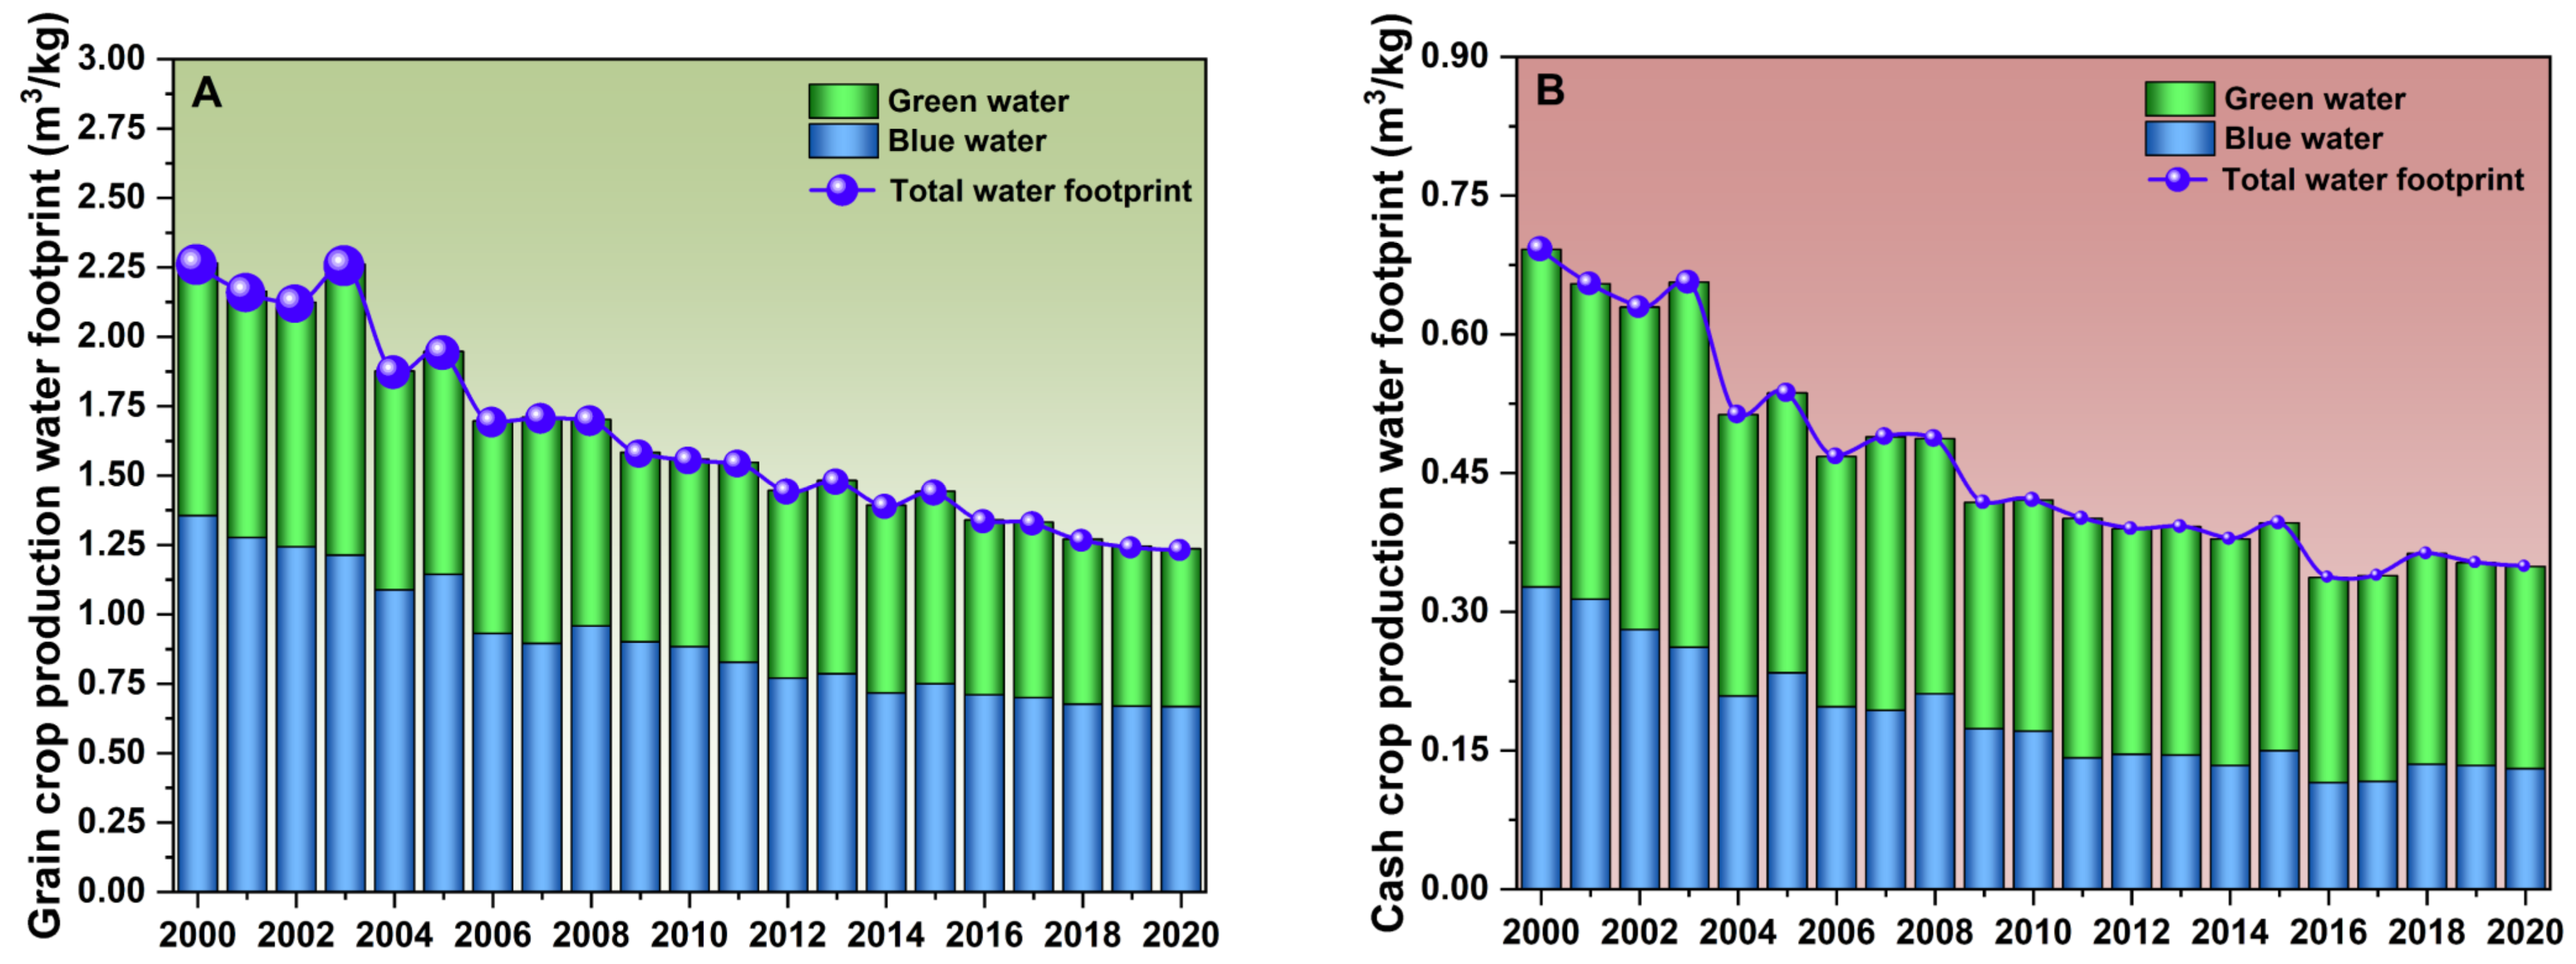
3.3. Demand Characteristics of Water Resources for Crop Production

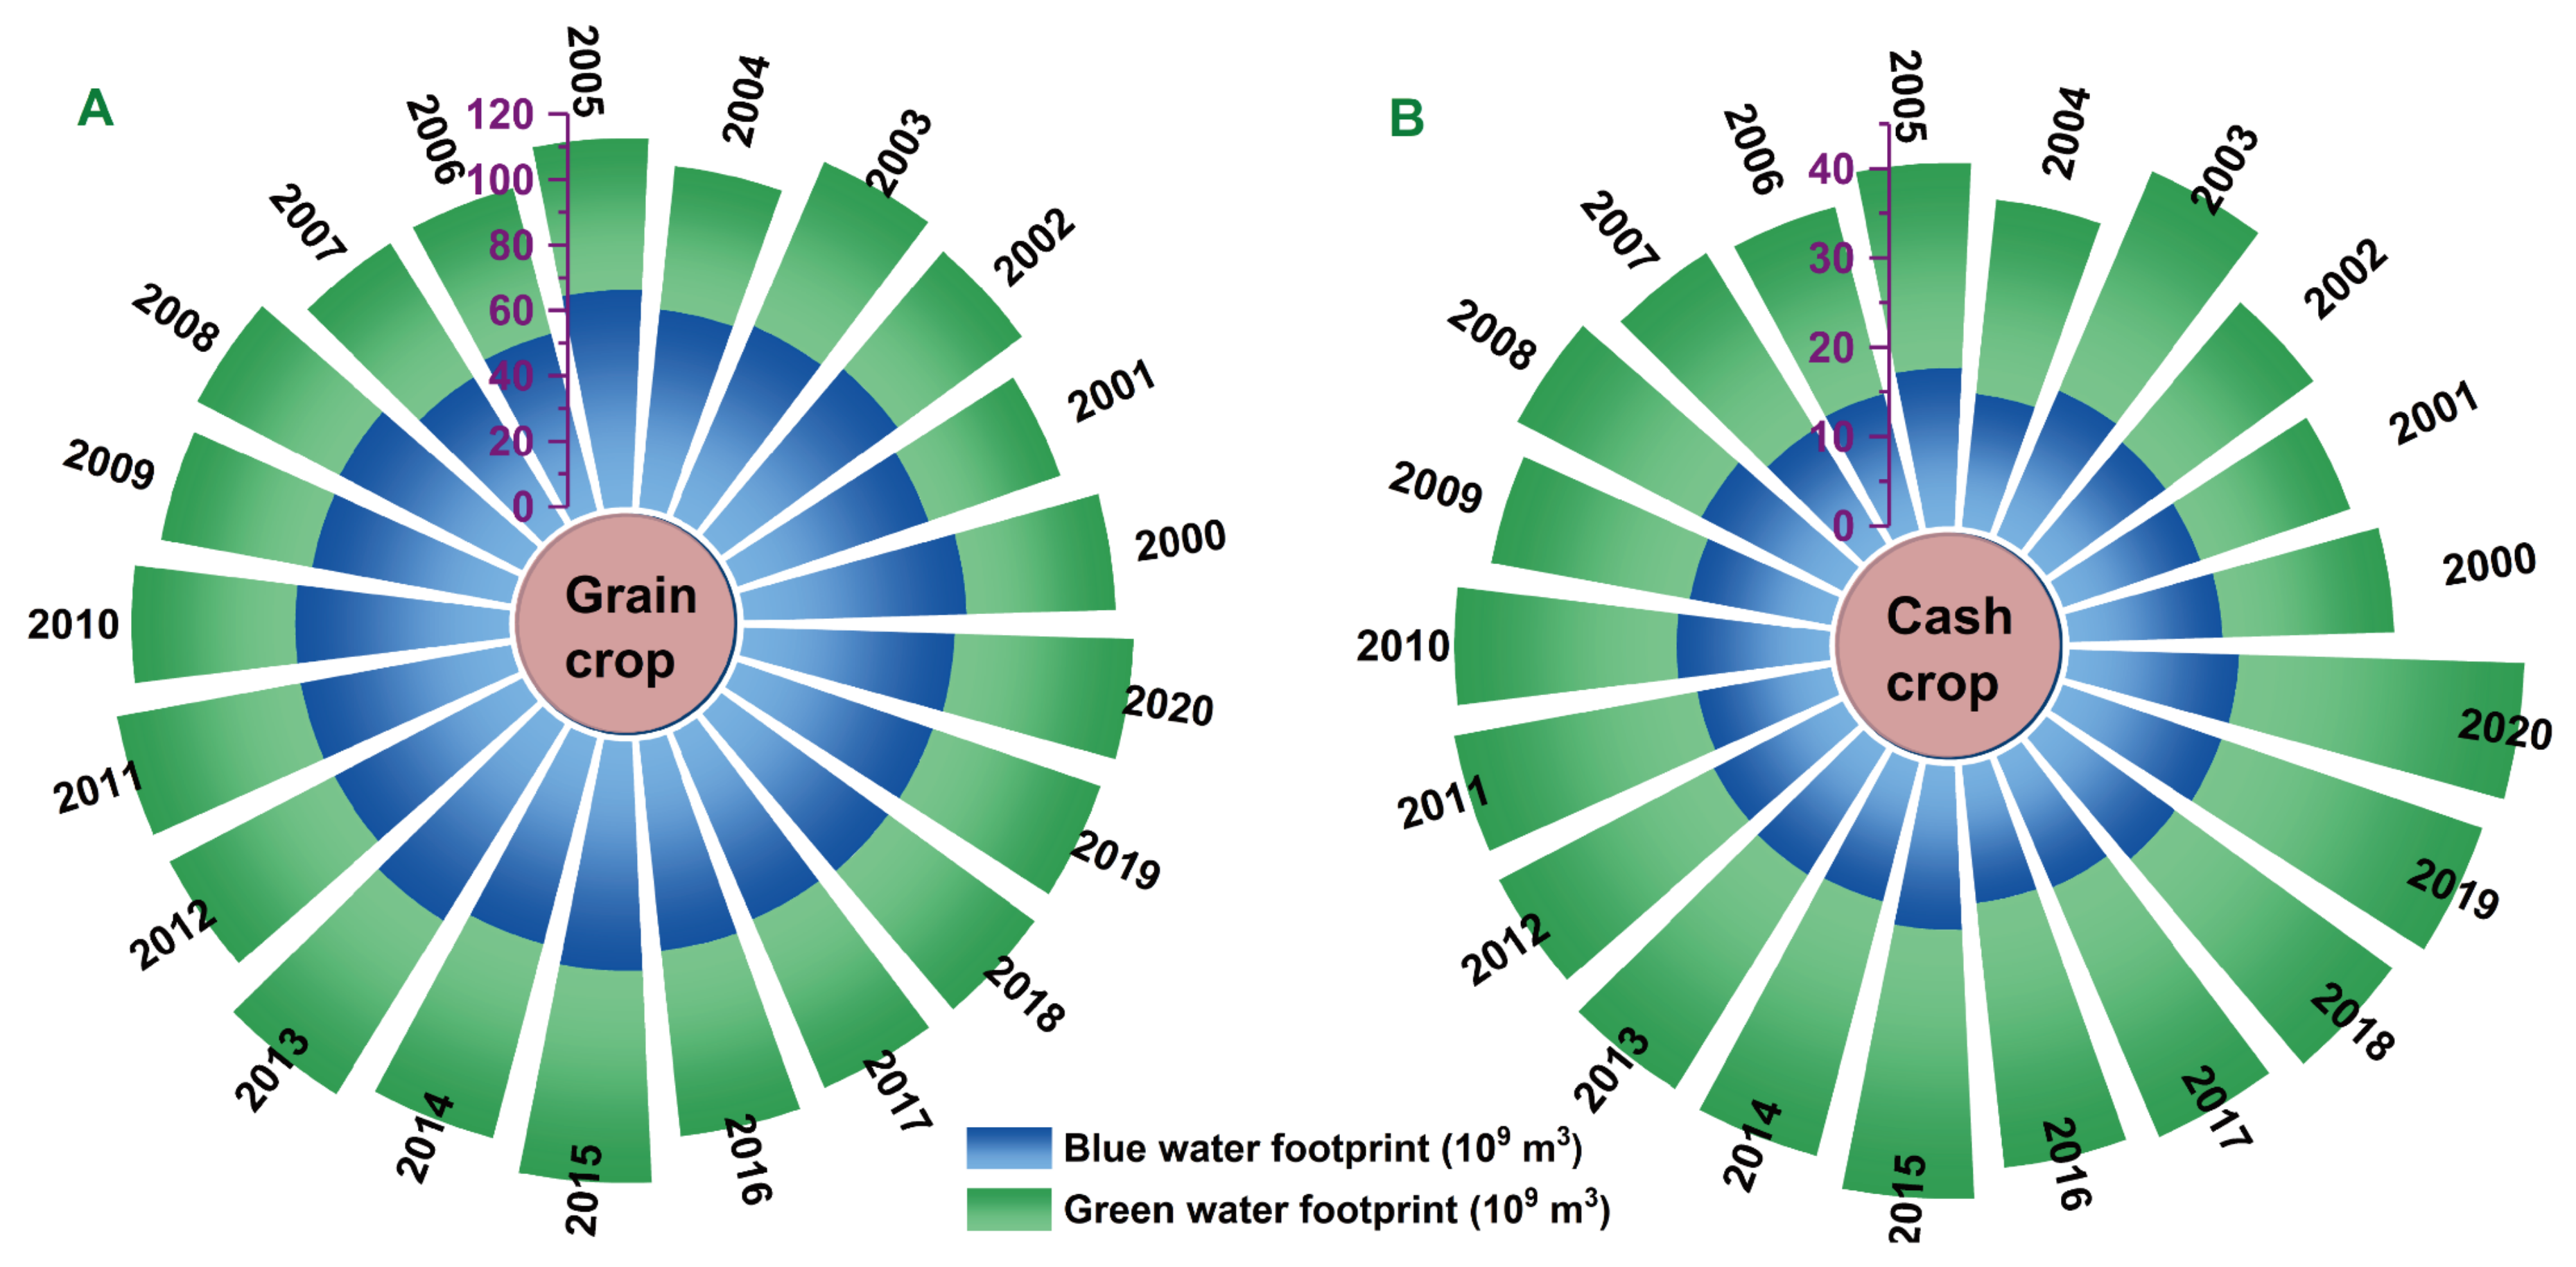
3.3.1. Characteristics of Water Footprint of Crop Production

With the improvement of regional agricultural production technology, the water footprint of crop production is decreasing year by year. From 2000 to 2020, the water footprint of crop production in Northwest China showed a significantly decreasing trend (p < 0.05), with a decrease of 43.6% and an annual decrease of 2.6% (Figure 4). Among them, the blue water footprint of crop production is reduced by 50.3%. From the perspective of water footprint structure, the regional production water footprint changed from blue water dominated in 2000 (blue water is 1.2 times that of green water) to green water dominated in 2020 (blue water is 0.9 times that of green water). Reducing the water footprint of crop production can effectively reduce the demand for water resources in regional crop production. To a certain extent, it can effectively alleviate the pressure on regional water resources and promote the sustainable production of crops.
The water footprint of grain and cash crop production showed a decreasing trend to varying degrees over time (Figure 5). The water footprint of grain crop production decreased by 45.4% from 2000 to 2020, with an average annual decrease of 2.8%. During this period, the production of blue water footprint and green water footprint decreased by 50.8% and 37.5%, respectively (Figure 5A). The water footprint of grain crop production has always been dominated by blue water. From 2000 to 2020, the average annual blue water footprint of grain crop production was 0.91 m3/kg, and the green water footprint was 0.74 m3/kg. In 2000, blue water was 49.1% higher than green water, and this value was reduced to 17.3% in 2020. From 2000 to 2020, the water footprint of cash crop production decreased by 49.5%, with an average annual decrease of 3.8%. During this period, the production of blue water and green water footprints decreased by 60.0% and 40.1%, respectively (Figure 5B). The characteristics of blue water and green water in the production water footprint of cash crops are the opposite to those of food crops. The water footprint of cash crops has always been dominated by green water. The proportion of its production of green water footprint in the total production water footprint has increased from 52.7% in 2000 to 62.6% in 2020. From 2000 to 2020, the average annual blue water footprint of economic crop production was 0.51 m3/kg, and the green water was 0.67 m3/kg. In 2000, the production of blue water was 7.5% higher than that of green water, and this value increased to 30.0% in 2020. By comparing the production water footprint of grain and cash crops, it can be seen that the average annual production water footprint of grain crops is 41.0% higher than that of cash crops.

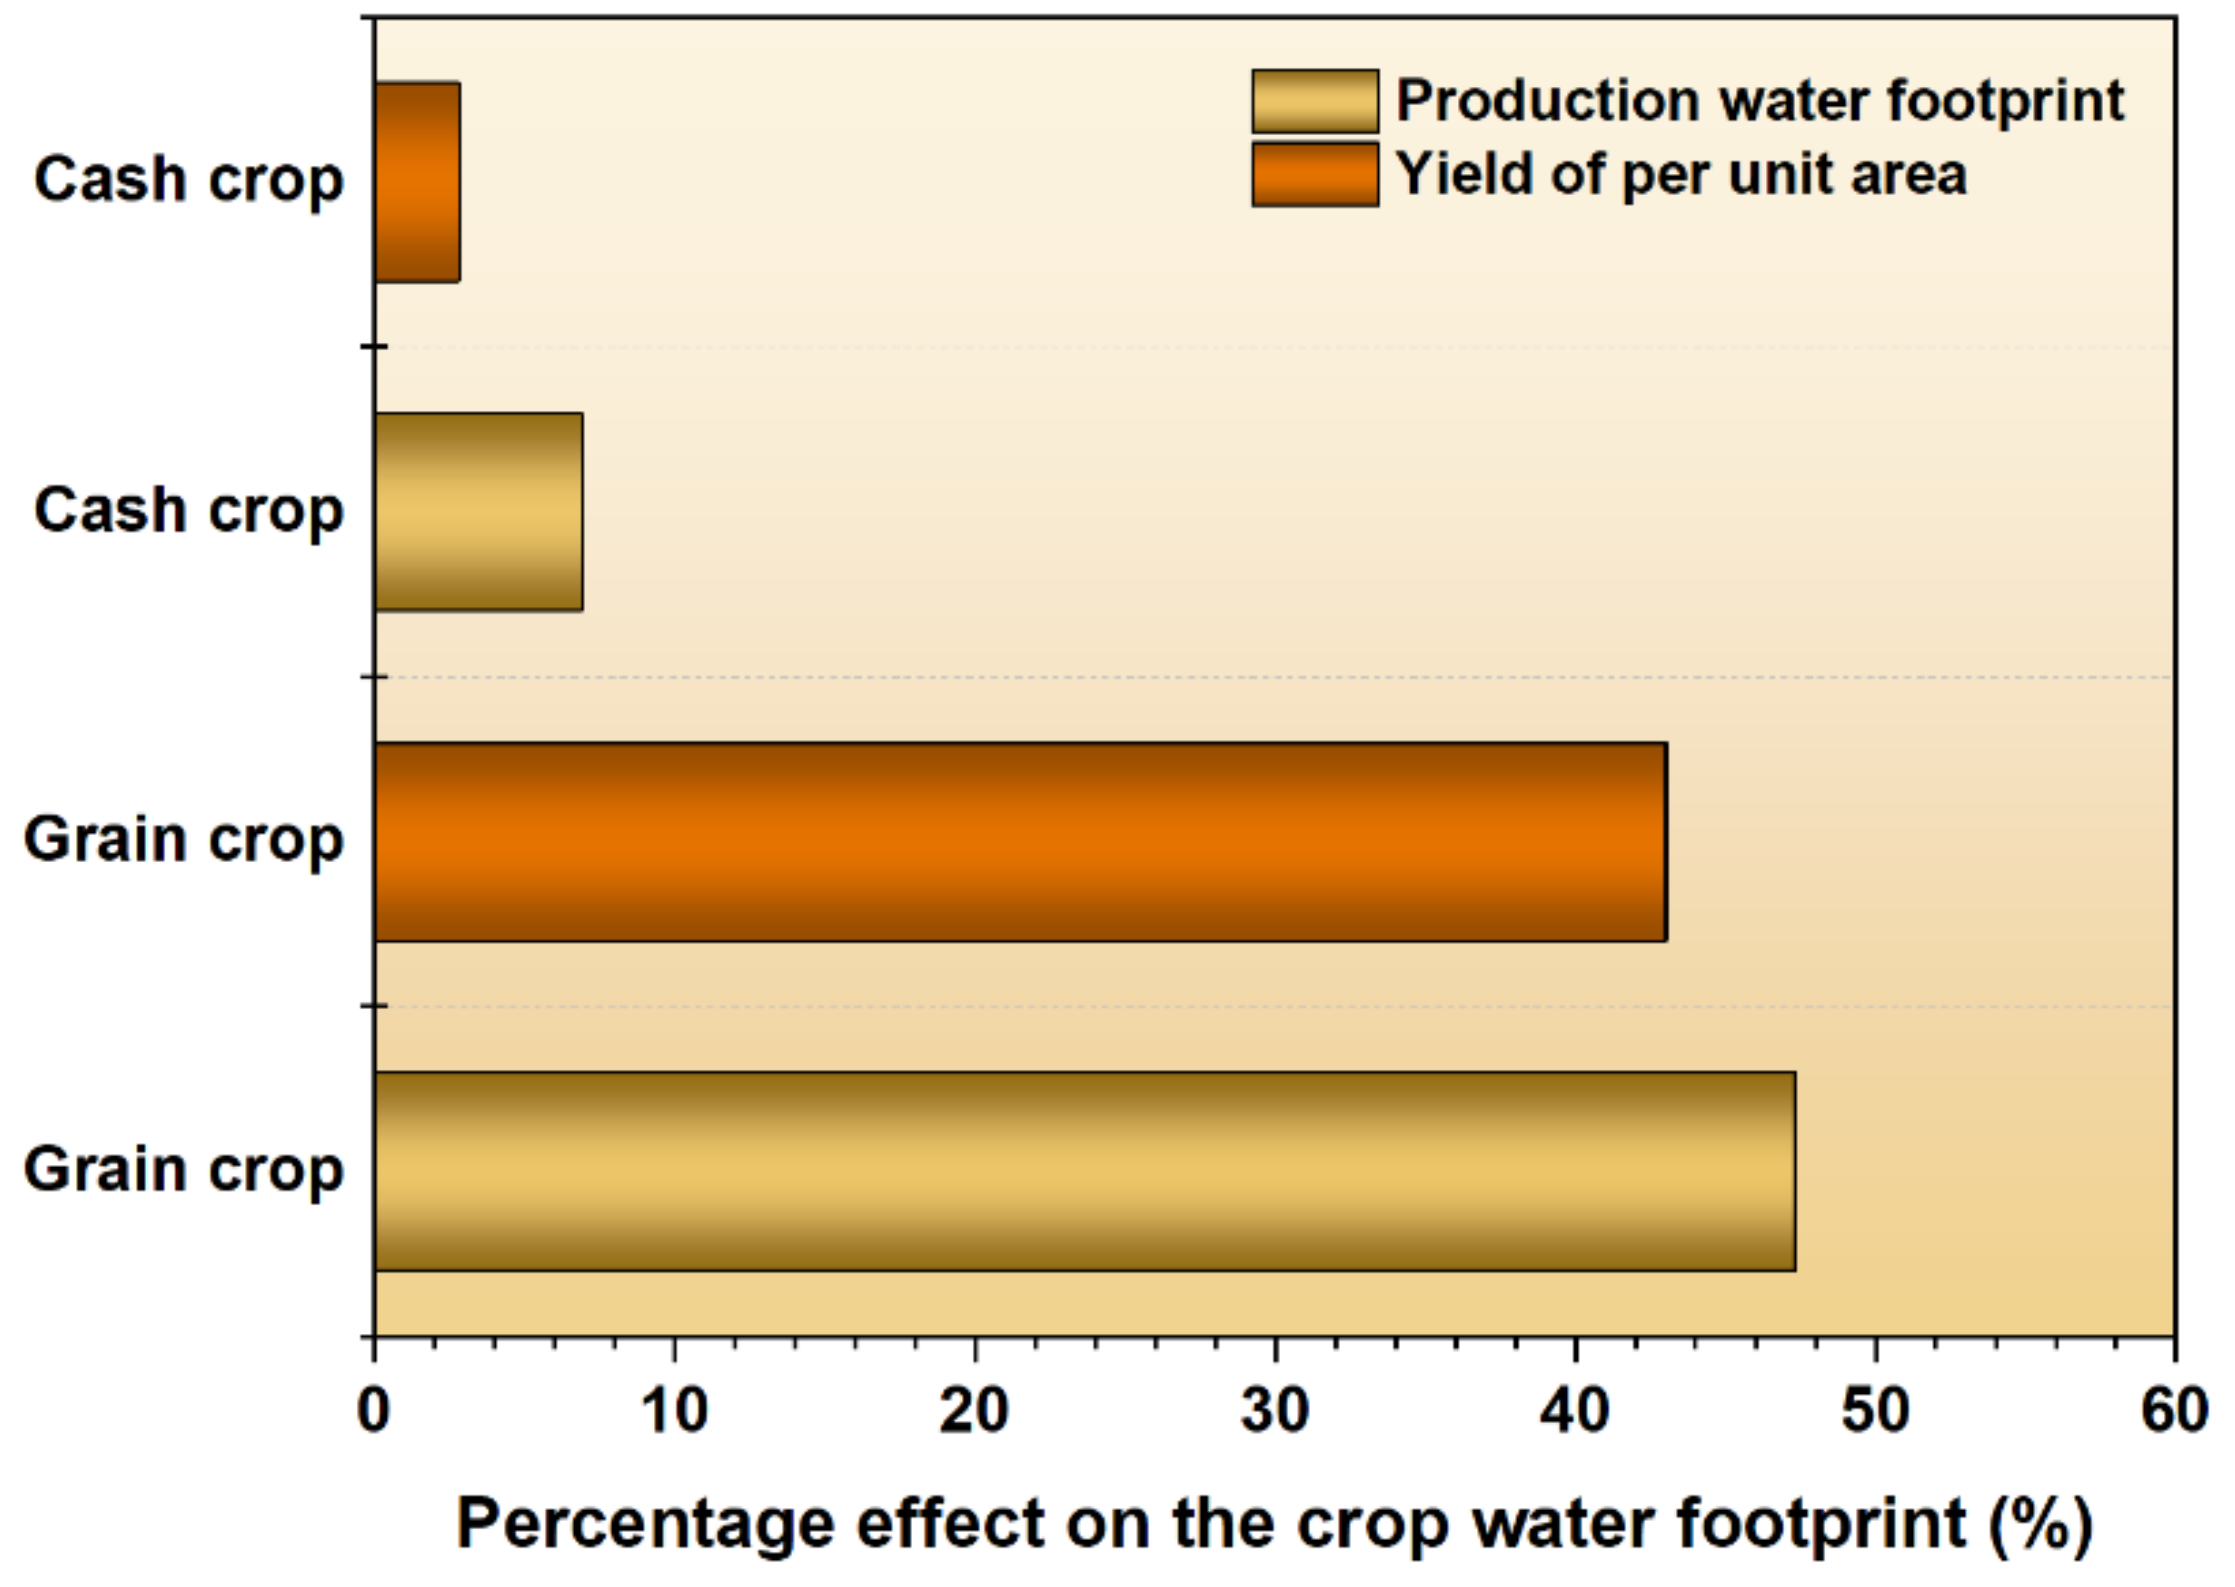
3.3.2. Evolutionary Characteristics of Crop Water Footprint

With the improvement of the position of Northwest China in ensuring China’s food security, its requirements for crop yield are increasing year by year, and the water footprint of crops is also increasing, which puts forward higher requirements for water resources that can be used for agricultural production. From 2000 to 2020, the regional crop water footprint showed a significant increasing trend (p < 0.01). On the basis of a 135.9% increase in crop yield, the crop water footprint increased by 13.4% (Figure 6). The reason for the much smaller increase in crop water footprint than in yield is the increase in crop water use efficiency (Figure 4). The reduction of the water footprint of crop production alleviates the demand for water resources for crop production to a certain extent. However, the reduction in the water footprint of crop production is still lower than the increase in demand for crop products to ensure regional food security. The composition of the crop water footprint changed from blue water in 2000 (56.8% of blue water) to green water in 2020 (51.0% of green water). The increase in the proportion of green water footprint helps alleviate regional water resource pressure to some extent. The substantial increase in crop yields in the region is a necessary way to ensure food security, but it poses a higher challenge to ensuring the water resources required for sustainable crop production.
In terms of crop types, the water footprints of both grain and cash crops tend to increase over time. On the basis of the improvement of agricultural production technology, the production water footprint of grain and cash crops is decreasing, which reduces the number of water resources required for the production of grain and cash crops (Figure 7). The region’s grain water footprint increased by 4.8% from 2000 to 2020 (Figure 7A). The production of regional grain crops mainly depends on blue water, and the average annual blue water footprint of grain accounts for 55.1%. With the advancement of water-saving irrigation technology, the proportion of regional grain blue water footprint has decreased from 59.9% in 2000 to 54.0% in 2020. The water footprint of regional cash crops increased by 40.0% from 2000 to 2020 (Figure 7B). The production of cash crops mainly depends on green water, and the average annual green water footprint accounts for 60.2%. Its green water footprint has increased from 52.7% in 2000 to 62.7% in 2020. The high dependence of cash crops on the green water footprint relieves the pressure on regional water resources to a certain extent and provides more available water resources for the sustainable production of grain crops. In terms of structure, the water footprint of food crops is much larger than that of cash crops, and the multi-year average of the former is 2.7 times that of the latter.

4. Discussion

Now, as Brazil and the United States encounter historical extreme weather (heat waves), heavy rains occur in Germany, the Netherlands, Belgium, China, and other places, triggering a series of natural disasters such as floods. In addition, a series of factors, such as the global pandemic of COVID-19, have led to the reduction of global food production and supply, which has led to a record high food inflation rate and posed a threat to global food security in the future [40]. Therefore, countries/regions must seek effective countermeasures to better serve global food security under the premise of ensuring food security in the region.
In developing countries in Asia, food security and agricultural sustainability have attracted great attention due to factors such as population growth and technological constraints, shortage of water resources in the western and southern regions, and inappropriate topography [41]. The analysis of the factors affecting the sustainable development of agriculture shows that water resources are the key to the sustainable production of crops [42]. Water shortage has become the main factor restricting social progress and economic development in arid and semi-arid regions, and it is also the main reason for the continuous deterioration of the ecological environment. In Northwest China, there has been an old saying that there is no agriculture without irrigation [25]. Nowadays, with the rapid economic growth, the acceleration of industrialization and urbanization, the improvement of people’s living standards, and the adjustment of dietary structure, water resources are gradually tilted toward urban and industrial construction, and the share of agricultural water consumption continues to decrease [43]. In addition, according to the implementation of the Belt and Road Initiative and the Western Development Strategy proposed by the Chinese government, the contradiction of water shortage will be more prominent with accelerated economic development, increased emphasis on the ecological environment, and population growth. Therefore, maintaining the efficient and sustainable utilization of water resources in Northwest China will be a strategic issue that must be solved in the process of ensuring food security and sustainable crop production.
Combined with the research results, the factors affecting the sustainable development of crops in Northwest China are mainly in the following two aspects: Reduced availability of water resources for agriculture and increased demand for water resources for crop production. Therefore, the following measures must be taken to increase the number of water resources available for agriculture:
(1) Improve the level of desalination technology, increase desalination efforts, and increase the number of freshwater resources available [44,45,46,47,48]. In addition, seawater can also be used directly to replace freshwater in related industries, thereby releasing more freshwater resources. For example, some developed countries directly use seawater instead of fresh water in thermal power generation, nuclear power, metallurgy, and petrochemical industries such as desulfurization, oil reinjection, ice making, printing, and dyeing, as well as toilet flushing, washing, and fire fighting in daily life. Some scholars have shown that seawater in hydrothermal fluidization of biomass for biocrude production has great potential for development [49].
(2) Increased availability of water resources in water-deficient areas through inter-basin water transfer (IBTs). The objective reality of uneven distribution of water resources and unbalanced demand for water in human society makes IBTs inevitable [50]. The IBTs aim to alleviate regional water pressure by shifting surface water from ‘water-rich’ areas to areas with high water pressure [51] and may reduce the adverse effects of unsustainable local water use, such as groundwater overexploitation [52]. About 1.2% of the world’s annual renewable water resources are obtained by IBTs [53]. China’s South-to-North Water Diversion Project and Australia’s Snow Mountain Project are the reality of IBTs [54].
(3) Strengthen the reuse and recycling of industrial and domestic water to achieve the purpose of increasing the number of available water resources. It can be seen from Figure 3 that the available water resources in the regional agricultural sector are crowded out by the living, industrial, and ecological sectors. Therefore, the reuse of water resources in the domestic, industrial, and ecological sectors should be strengthened to indirectly reduce the number of water resources used for their development, thereby releasing more water resources for agricultural production [55,56].
(4) Intensify publicity on the importance of water saving and water-saving technical training for residents and enterprises. Implement a “multiple uses of one water” model for domestic water and promote water-saving appliances (such as the use of low-pressure water pipes and showerheads, high-power washing machines, rainwater tanks, etc., and the installation of dual drainage systems, and the installation of rainwater collection systems in the house and other measures.) [57,58,59], reduce the use of detergents and cleaning agents, etc., and cultivate water-saving awareness. In addition, the government should force residents to quickly improve domestic water efficiency by either controlling the domestic water consumption of each household or raising water prices to reduce waste [60]. The same goes for the industry. This strategy can contribute to the change in water use habits [57].
(5) Strengthen the purification of domestic and industrial wastewater to increase the number of available water resources [61]. The integrated industry-urban water reuse concept should be strengthened to provide strategies for reducing sewage and increasing the amount of water available by combining industrial and urban wastewater flows and connecting grey and green infrastructure [62]. With proper industrial wastewater treatment, wastewater can have further uses [63,64]. For example, it is used for infrastructure (such as irrigation of urban green spaces, etc.). The demand for water in the municipal, domestic, or industrial sectors has decreased, and the amount of water used for agricultural production will likely increase. The above measures are expected to increase the amount of water resources available to agriculture and better promote the sustainable development of crop production.
On the basis of increasing the amount of water available for agriculture, another key to promoting sustainable crop production is reducing the amount of water required for crop production. According to Figure 4 and Figure 6 and the sensitivity analysis of main factors on regional crop water footprint (the Monte Carlo method is used to analyze sensitivity; Figure 8), the key point to reducing crop water footprint is to improve water use efficiency and yield level, especially for grain crops.
(A) The following are suggested measures to improve water use efficiency: (1) Improve agricultural infrastructure and equipment conditions. Increase the construction of farmland water conservancy infrastructure [65], speed up the progress of the water-saving renovation of irrigation areas, increase the effective irrigation area of farmland, vigorously promote the transformation of channel water delivery to pipeline water delivery, and the transformation of ground irrigation to drip irrigation and sprinkler irrigation, and vigorously promote film water and fertilizer integration technologies such as drip irrigation and ridge-film furrow irrigation [24,25] guide the main water users to change extensive irrigation methods such as flood irrigation. (2) Optimize crop planting structure. According to the spatial differences in the utilization efficiency of water resources by crops in each unit of the region, the regional planting structure should be adjusted in time [24]. Maximize water saving potential from the perspective of crop physiology. (3) Strengthen the independent innovation ability of agricultural science and technology and the transformation and application ability of new agricultural varieties and new technologies, cultivate crop varieties with drought resistance and water saving, and exert the potential of biological water saving [66]. (4) Improve efficient rainwater collection and utilization technology, cultivate soil reservoirs, and reduce non-productive water consumption [67]. Using the mutual transformation law of surface water and groundwater, wells and canals are combined to supplement each other. Make full use of the residual water and atmospheric precipitation in the high-water period of the river and establish underground reservoirs for the persistence of seepage. Vigorously promote field micro-rain harvesting planting technology (combined planting technology of terraced fields+ water cellar+ drought-resistant crops, etc.), mechanized deep soil preparation, drip irrigation under the film, and other technologies to improve the utilization efficiency of green water by crops [25,68].
(B) Suggested measures to improve crop yield levels: (1) Improve the coverage of high-quality and high-yield varieties. Vigorously promote high-yielding crop varieties with good resistance [66], high yield [69], and strong adaptability [70]. Using technologies such as hybrid breeding [71], haploid breeding [72], polyploid breeding [73], cell engineering breeding [74], mutation breeding [75], and genetic engineering breeding [76], crops can be greatly improved in quality and increase crop yield. In addition, each region should select high-yielding varieties suitable for different regions, crops, and cultivation modes based on factors such as soil quality and climate resources [77,78,79]. (2) Promote high-yield technologies. Increase the promotion and application of high-yield planting models such as intercropping [80,81], intercropping [82,83], and crop rotation [84,85]. (3) Reasonably increase carbon dioxide concentration and improve light conditions. Carbon dioxide is the raw material for photosynthesis, but the carbon dioxide concentration in the atmosphere is only 0.03%, while under normal light, the carbon dioxide concentration required by crops is 0.09%. Therefore, a reasonable increase in carbon dioxide concentration can promote the photosynthesis of crops, thereby increasing the production of organic matter and improving crop yields [86,87]. Therefore, farmers can be encouraged and financially supported to use greenhouses to manage the carbon dioxide and light required by crops in their growing seasons. Reasonably extending the light time, increasing the crop light area, and controlling the light intensity can effectively promote the photosynthesis of crops, thereby increasing crop yield [88], especially for cash crops. (4) Reasonably increase the planting density. Crop production in most developing countries is affected by factors such as labor quality, planting habits, and arable land conditions, and the planting density is generally low, which greatly affects grain output. Therefore, it is necessary to reasonably increase the planting density and increase the yield according to different regions, different varieties, and different farming methods [89]. After the planting density is increased, the management of water and fertilizer, field weeding, and pest control should be simultaneously improved to ensure a high and stable grain yield [90]. (5) Strengthen the early warning and prediction of meteorological disasters. Give full play to the role of the agrometeorological information joint early warning mechanism, release agrometeorological forecast and early warning information in a timely manner [91], and vigorously publicize and popularize natural disaster prevention and mitigation technologies for food crops. Minimize the damage caused by meteorological disasters to crop yields. (6) Strengthen the monitoring and control of pests and diseases. Establish normalized early warning and monitoring, and adopt ecological regulation, seed treatment, physical trapping, scientific drug use, etc., to improve the level of prevention and control of food crop diseases and insect pests [92,93]. (7) Vigorously promote scientific fertilization technology. According to the regional soil, climate, crops, and other conditions, efforts should be made to promote the scientific fertilization technology of main crops. Based on soil tests and fertilizer field experiments, according to the law of crop fertilizer demand, soil fertilizer supply performance, and fertilizer effect, on the basis of rational application of organic fertilizers [94], fertilizers such as nitrogen, phosphorus, potassium, and medium and trace elements should be reasonably supplemented (involving the variety, quantity, period, and method of fertilizer application), encourage the application of organic fertilizers and new slow-release fertilizers, and advocate the return of straw to the field [94]. This helps to increase the yield by improving the fertilizer utilization efficiency of crops while the Chinese government requires reducing the amount of chemical fertilizer application [95].

5. Conclusions

From the perspective of water resources, we will explore the potential and challenges of sustainable crop production in arid and semi-arid areas and propose effective countermeasures. This is not only essential to ensure food security and sustainable crop production in the region, but also to promote global food security. The main conclusions are as follows:
From 2000 to 2020, the number of available water resources in Northwest China was positively correlated with the water resource load index (water-resources load level is grade I), which indicated that the increase in the number of available water resources in the region was the result of over-exploitation of water resources. Today it is at a high water stress level and has no development potential. At the same time, due to the rapid development of urbanization and the government’s high emphasis on ecology, regional agricultural water consumption has been greatly compressed. This is a catastrophic consequence for arid and semi-arid regions where agricultural production is mainly maintained by irrigation, seriously threatening the sustainable development of regional crop production. Fortunately, the development of production technology has improved the water use efficiency of crops and reduced the amount of water required for crop production. This in turn promotes the sustainable development of crop production to a certain extent. However, this positive effect is far from enough on the basis of the increased food production required to ensure food security. In order to achieve food security, the region must increase crop yields, which in turn increases the amount of water demand for crop production, and the growth trend is far greater than the reduction in the water footprint of crop production. This is an unsustainable performance. This must arouse great attention from everyone and take effective countermeasures in advance. We put forward detailed suggestions and measures to promote the sustainable production of regional crops from the two aspects of “open source” (increasing the number of available water resources in the region) and “throttling” (reducing the demand for water resources in crop production).

Funding

This study was supported by the Fundamental Research Program of Shanxi Province (Free exploration category) (202103021223261).

Institutional Review Board Statement

Not applicable.

Data Availability Statement

The data presented in this study are available within the article.

Conflicts of Interest

The author declares no conflict to interest.

References

  1. Ali, N.; Mujeeb-Kazi, A. Food Production: Global Challenges to Mitigate Climate Change. In Physiological, Molecular, and Genetic Perspectives of Wheat Improvement; Springer: Cham, Switzerland, 2021; pp. 1–13. [Google Scholar]
  2. Agus, C.; Nugraheni, M.; Wuri, M.A.; Pertiwiningrum, A.; Hasanah, N.A.I.; Sugiyanto, C.; Nurjanto, H.H.; Primananda, E. The Challenges of Food Sovereignty’s Program by Global Climate Change in Tropical Ecosystem in Indonesia. In Handbook of Climate Change Across the Food Supply Chain; Springer: Berlin/Heidelberg, Germany, 2022; pp. 267–283. [Google Scholar]
  3. Mottaleb, K.A.; Fatah, F.A.; Kruseman, G.; Erenstein, O. Projecting food demand in 2030: Can Uganda attain the zero hunger goal? Sustain. Prod. Consum. 2021, 28, 1140–1163. [Google Scholar] [CrossRef]
  4. Unicef; World Health Organization. The State of Food Security and Nutrition in the World 2017: Building Resilience for Peace and Food Security; Food and Agriculture Organization of the United Nations: Rome, Italy, 2017. [Google Scholar]
  5. Szenkovics, D.; Tonk, M.; Balog, A. Can genetically modified (GM) crops act as possible alternatives to mitigate world political conflicts for food? Food Energy Secur. 2021, 10, e268. [Google Scholar] [CrossRef]
  6. Harpankar, K. Optimal Nitrogen Management for Meeting Sustainable Development Goal 2. In Science, Technology, and Innovation for Sustainable Development Goals: Insights from Agriculture, Health, Environment, and Energy; Oxford University Press: Oxford, UK, 2020; 367p. [Google Scholar]
  7. Garai, T.; Garg, H. Possibilistic multiattribute decision making for water resource management problem under single-valued bipolar neutrosophic environment. Int. J. Intell. Syst. 2022, 37, 5031–5058. [Google Scholar] [CrossRef]
  8. Garai, T.; Garg, H. Multi-criteria decision making of water resource management problem (in agriculture field, Purulia district) based on possibility measures under generalized single valued non-linear bipolar neutrosophic environment. Expert Syst. Appl. 2022, 205, 117715. [Google Scholar] [CrossRef]
  9. Dubey, P.K.; Singh, A.; Chaurasia, R.; Pandey, K.K.; Bundela, A.K.; Dubey, R.K.; Abhilash, P.C. Planet friendly agriculture: Farming for people and the planet. Curr. Res. Environ. Sustain. 2021, 3, 100041. [Google Scholar] [CrossRef]
  10. Prăvălie, R.; Bandoc, G.; Patriche, C.; Sternberg, T. Recent changes in global drylands: Evidences from two major aridity databases. Catena 2019, 178, 209–231. [Google Scholar] [CrossRef]
  11. Banholzer, S.; Kossin, J.; Donner, S. The impact of climate change on natural disasters. In Reducing Disaster: Early Warning Systems for Climate Change; Springer: Dordrecht, The Netherlands, 2014; pp. 21–49. [Google Scholar]
  12. Kang, S.; Hao, X.; Du, T.; Tong, L.; Su, X.; Lu, H.; Li, X.; Huo, Z.; Li, S.; Ding, R. Improving agricultural water productivity to ensure food security in China under changing environment: From research to practice. Agric. Water Manag. 2017, 179, 5–17. [Google Scholar] [CrossRef]
  13. Ringler, C.; Zhu, T. Water resources and food security. Agron. J. 2015, 107, 1533–1538. [Google Scholar] [CrossRef] [Green Version]
  14. Chen, X.; Yang, S.-H.; Jiang, Z.-W.; Ding, J.; Sun, X. Biochar as a tool to reduce environmental impacts of nitrogen loss in water-saving irrigation paddy field. J. Clean. Prod. 2021, 290, 125811. [Google Scholar] [CrossRef]
  15. Umair, M.; Hussain, T.; Jiang, H.; Ahmad, A.; Yao, J.; Qi, Y.; Zhang, Y.; Min, L.; Shen, Y. Water-saving potential of subsurface drip irrigation for winter wheat. Sustainability 2019, 11, 2978. [Google Scholar] [CrossRef]
  16. Zapata, N.; Robles, O.; Playán, E.; Paniagua, P.; Romano, C.; Salvador, R.; Montoya, F. Low-pressure sprinkler irrigation in maize: Differences in water distribution above and below the crop canopy. Agric. Water Manag. 2018, 203, 353–365. [Google Scholar] [CrossRef]
  17. Xiao, M.; Li, Y.; Wang, J.; Hu, X.; Wang, L.; Miao, Z. Study on the law of nitrogen transfer and conversion and use of fertilizer nitrogen in paddy fields under water-saving irrigation mode. Water 2019, 11, 218. [Google Scholar] [CrossRef] [Green Version]
  18. He, H.; Wang, Q.; Wang, L.; Yang, K.; Yang, R.; You, C.; Ke, J.; Wu, L. Photosynthetic physiological response of water-saving and drought-resistant rice to severe drought under wetting-drying alternation irrigation. Physiol. Plant. 2021, 173, 2191–2206. [Google Scholar] [CrossRef]
  19. Valcárcel, M.; Lahoz, I.; Campillo, C.; Martí, R.; Leiva-Brondo, M.; Rosello, S.; Cebolla-Cornejo, J. Controlled deficit irrigation as a water-saving strategy for processing tomato. Sci. Hortic. 2020, 261, 108972. [Google Scholar] [CrossRef]
  20. Chen, X.; Yang, S.; Ding, J.; Jiang, Z.; Sun, X. Effects of biochar addition on rice growth and yield under water-saving irrigation. Water 2021, 13, 209. [Google Scholar] [CrossRef]
  21. Ambika, A.K.; Mishra, V. Improved water savings and reduction in moist heat stress caused by efficient irrigation. Earth’s Future 2022, 10, e2021EF002642. [Google Scholar] [CrossRef]
  22. Washizu, A.; Nakano, S. Exploring the characteristics of smart agricultural development in Japan: Analysis using a smart agricultural kaizen level technology map. Comput. Electron. Agric. 2022, 198, 107001. [Google Scholar] [CrossRef]
  23. Moysiadis, V.; Sarigiannidis, P.; Vitsas, V.; Khelifi, A. Smart farming in Europe. Comput. Sci. Rev. 2021, 39, 100345. [Google Scholar] [CrossRef]
  24. Liu, X.; Xu, Y.; Sun, S.; Zhao, X.; Wang, Y. Analysis of the Coupling Characteristics of Water Resources and Food Security: The Case of Northwest China. Agriculture 2022, 12, 1114. [Google Scholar] [CrossRef]
  25. Liu, X.; Shi, L.; Engel, B.A.; Sun, S.; Zhao, X.; Wu, P.; Wang, Y. New challenges of food security in Northwest China: Water footprint and virtual water perspective. J. Clean. Prod. 2020, 245, 118939. [Google Scholar] [CrossRef]
  26. Lu, S.; Hu, Z.; Yu, H.; Fan, W.; Fu, C.; Wu, D. Changes of extreme precipitation and its associated mechanisms in Northwest China. Adv. Atmos. Sci. 2021, 38, 1665–1681. [Google Scholar] [CrossRef]
  27. Wei, K.; Wang, L. Reexamination of the aridity conditions in arid Northwestern China for the last decade. J. Clim. 2013, 26, 9594–9602. [Google Scholar] [CrossRef]
  28. Yang, Y.; Feng, Z.; Huang, H.Q.; Lin, Y. Climate-induced changes in crop water balance during 1960–2001 in Northwest China. Agric. Ecosyst. Environ. 2008, 127, 107–118. [Google Scholar] [CrossRef]
  29. Sun, S.K.; Wu, P.T.; Wang, Y.B.; Zhao, X.N. Temporal Variability of Water Footprint for Maize Production: The Case of Beijing from 1978 to 2008. Water Resour. Manag. 2013, 27, 2447–2463. [Google Scholar] [CrossRef]
  30. Hoekstra, A.Y.; Mekonnen, M.M. The water footprint of humanity. Proc. Natl. Acad. Sci. USA 2012, 109, 3232–3237. [Google Scholar] [CrossRef] [Green Version]
  31. Siebert, S.; Döll, P.; Hoff, H.; Falkenmark, M.; Gerten, D.; Gordon, L.; Karlberg, L.; Rockström, J. Quantifying blue and green virtual water contents in global crop production as well as potential production losses without irrigation. J. Hydrol. 2010, 384, 198–217. [Google Scholar] [CrossRef]
  32. Hoekstra, A.Y.; Chapagain, A.K.; Aldaya, M.M.; Mekonnen, M.M. The Water Footprint Assessment Manual: Setting the Global Standard; Routledge: London, UK, 2011. [Google Scholar]
  33. Sun, S.; Wu, P.; Wang, Y.; Zhao, X.; Liu, J.; Zhang, X. The impacts of interannual climate variability and agricultural inputs on water footprint of crop production in an irrigation district of China. Sci. Total Environ. 2013, 444, 498–507. [Google Scholar] [CrossRef]
  34. Luan, X.; Wu, P.; Sun, S.; Wang, Y.; Gao, X. Quantitative study of the crop production water footprint using the SWAT model. Ecol. Indic. 2018, 89, 1–10. [Google Scholar] [CrossRef]
  35. Allen, R.G.; Pereira, L.S.; Raes, D.; Smith, M. Crop Evapotranspiration-Guidelines for Computing Crop Water Requirements; FAO Irrigation and Drainage Paper 56; FAO: Rome, Italy, 1998; Volume 300, p. D05109. [Google Scholar]
  36. Sun, S.; Zhang, C.; Li, X.; Zhou, T.; Wang, Y.; Wu, P.; Cai, H. Sensitivity of crop water productivity to the variation of agricultural and climatic factors: A study of Hetao irrigation district, China. J. Clean. Prod. 2017, 142, 2562–2569. [Google Scholar] [CrossRef]
  37. Döll, P.; Siebert, S. Global modeling of irrigation water requirements. Water Resour. Res. 2002, 38, 1–10. [Google Scholar] [CrossRef]
  38. Sun, S.; Yin, Y.; Wu, P.; Wang, Y.; Luan, X.; Li, C. Geographical evolution of agricultural production in China and its effects on water stress, economy, and the environment: The virtual water perspective. Water Resour. Res. 2019, 55, 4014–4029. [Google Scholar] [CrossRef]
  39. Xia, F.; Chen, Y.; Dou, M.; Han, Y. Calculation method and application of spatial equilibrium coefficient of water resources. Water Resour. Prot. 2020, 36, 52–57. [Google Scholar]
  40. Pricey crops. Nat. Plants 2021, 7, 993. [CrossRef] [PubMed]
  41. Baig, M.B.; Shahid, S.A.; Straquadine, G.S. Making rainfed agriculture sustainable through environmental friendly technologies in Pakistan: A review. Int. Soil Water Conserv. Res. 2013, 1, 36–52. [Google Scholar] [CrossRef] [Green Version]
  42. Dogliotti, S.; García, M.C.; Peluffo, S.; Dieste, J.P.; Pedemonte, A.J.; Bacigalupe, G.F.; Scarlato, M.; Alliaume, F.; Alvarez, J.; Chiappe, M. Co-innovation of family farm systems: A systems approach to sustainable agriculture. Agric. Syst. 2014, 126, 76–86. [Google Scholar] [CrossRef]
  43. Gerten, D.; Heck, V.; Jägermeyr, J.; Bodirsky, B.L.; Fetzer, I.; Jalava, M.; Kummu, M.; Lucht, W.; Rockström, J.; Schaphoff, S. Feeding ten billion people is possible within four terrestrial planetary boundaries. Nat. Sustain. 2020, 3, 200–208. [Google Scholar] [CrossRef]
  44. Ahmed, F.E.; Hashaikeh, R.; Hilal, N. Hybrid technologies: The future of energy efficient desalination—A review. Desalination 2020, 495, 114659. [Google Scholar] [CrossRef]
  45. Gao, L.; Zhang, X.; Fan, L.; Gray, S.; Li, M. Algae-based approach for desalination: An emerging energy-passive and environmentally friendly desalination technology. ACS Sustain. Chem. Eng. 2021, 9, 8663–8678. [Google Scholar] [CrossRef]
  46. Park, J.; Lee, S. Desalination technology in South Korea: A comprehensive review of technology trends and future outlook. Membranes 2022, 12, 204. [Google Scholar] [CrossRef]
  47. Chauhan, V.K.; Shukla, S.K.; Tirkey, J.V.; Rathore, P.K.S. A comprehensive review of direct solar desalination techniques and its advancements. J. Clean. Prod. 2021, 284, 124719. [Google Scholar] [CrossRef]
  48. Ahmed, F.E.; Khalil, A.; Hilal, N. Emerging desalination technologies: Current status, challenges and future trends. Desalination 2021, 517, 115183. [Google Scholar]
  49. Yang, J.; Chen, H.; Liu, Q.; Zhou, N.; Wu, Y. Is it feasible to replace freshwater by seawater in hydrothermal liquefaction of biomass for biocrude production? Fuel 2020, 282, 118870. [Google Scholar] [CrossRef]
  50. Zhuang, W. Eco-environmental impact of inter-basin water transfer projects: A review. Environ. Sci. Pollut. Res. 2016, 23, 12867–12879. [Google Scholar] [CrossRef] [PubMed]
  51. Duan, K.; Sun, G.; Caldwell, P.V.; McNulty, S.G.; Zhang, Y. Implications of upstream flow availability for watershed surface water supply across the conterminous United States. JAWRA J. Am. Water Resour. Assoc. 2018, 54, 694–707. [Google Scholar] [CrossRef]
  52. Dickson, K.E.; Dzombak, D.A. Drivers of interbasin transfers in the United States: Insights from sampling. JAWRA J. Am. Water Resour. Assoc. 2019, 55, 1038–1052. [Google Scholar] [CrossRef]
  53. Duan, K.; Caldwell, P.V.; Sun, G.; McNulty, S.G.; Qin, Y.; Chen, X.; Liu, N. Climate change challenges efficiency of inter-basin water transfers in alleviating water stress. Environ. Res. Lett. 2022, 17, 044050. [Google Scholar] [CrossRef]
  54. Zhang, C.; Duan, Q.; Yeh, P.J.F.; Pan, Y.; Gong, H.; Gong, W.; Di, Z.; Lei, X.; Liao, W.; Huang, Z. The effectiveness of the South-to-North Water Diversion Middle Route Project on water delivery and groundwater recovery in North China Plain. Water Resour. Res. 2020, 56, e2019WR026759. [Google Scholar]
  55. Opher, T.; Friedler, E.; Shapira, A. Comparative life cycle sustainability assessment of urban water reuse at various centralization scales. Int. J. Life Cycle Assess. 2019, 24, 1319–1332. [Google Scholar] [CrossRef]
  56. Klemeš, J.J. Industrial water recycle/reuse. Curr. Opin. Chem. Eng. 2012, 1, 238–245. [Google Scholar] [CrossRef]
  57. Hasan, H.H.; Razali, S.F.M.; Razali, N.H.M. Does the household Save water? evidence from behavioral analysis. Sustainability 2021, 13, 641. [Google Scholar] [CrossRef]
  58. Millock, K.; Nauges, C. Household adoption of water-efficient equipment: The role of socio-economic factors, environmental attitudes and policy. Environ. Resour. Econ. 2010, 46, 539–565. [Google Scholar] [CrossRef] [Green Version]
  59. Russell, S.; Fielding, K. Water demand management research: A psychological perspective. Water Resour. Res. 2010, 46, 1–12. [Google Scholar] [CrossRef] [Green Version]
  60. Kashem, S.; Mondal, M.S. Development of a Water-Pricing Model for Domestic Water Uses in Dhaka City Using an IWRM Framework. Water 2022, 14, 1328. [Google Scholar] [CrossRef]
  61. Paneysar, J.S.; Jain, S.; Ahmed, N.; Barton, S.; Ambre, P.; Coutinho, E. Novel smart composite materials for industrial wastewater treatment and reuse. SN Appl. Sci. 2020, 2, 1084. [Google Scholar] [CrossRef]
  62. Bauer, S.; Linke, H.J.; Wagner, M. Combining industrial and urban water-reuse concepts for increasing the water resources in water-scarce regions. Water Environ. Res. 2020, 92, 1027–1041. [Google Scholar] [CrossRef] [PubMed] [Green Version]
  63. Nzila, A.; Razzak, S.A.; Zhu, J. Bioaugmentation: An emerging strategy of industrial wastewater treatment for reuse and discharge. Int. J. Environ. Res. Public Health 2016, 13, 846. [Google Scholar] [CrossRef] [PubMed]
  64. Fudge, T.; Bulmer, I.; Bowman, K.; Pathmakanthan, S.; Gambier, W.; Dehouche, Z.; Al-Salem, S.M.; Constantinou, A. Microbial Electrolysis Cells for Decentralised Wastewater Treatment: The Next Steps. Water 2021, 13, 445. [Google Scholar] [CrossRef]
  65. Pamidimukkala, A.; Kermanshachi, S.; Adepu, N.; Safapour, E. Resilience in water infrastructures: A review of challenges and adoption strategies. Sustainability 2021, 13, 12986. [Google Scholar] [CrossRef]
  66. Mondal, S.; Rutkoski, J.E.; Velu, G.; Singh, P.K.; Crespo-Herrera, L.A.; Guzman, C.; Bhavani, S.; Lan, C.; He, X.; Singh, R.P. Harnessing diversity in wheat to enhance grain yield, climate resilience, disease and insect pest resistance and nutrition through conventional and modern breeding approaches. Front. Plant Sci. 2016, 7, 991. [Google Scholar] [CrossRef] [Green Version]
  67. Recha, J.W.; Mati, B.M.; Nyasimi, M.; Kimeli, P.K.; Kinyangi, J.M.; Radeny, M. Changing rainfall patterns and farmers’ adaptation through soil water management practices in semi-arid eastern Kenya. Arid Land Res. Manag. 2016, 30, 229–238. [Google Scholar] [CrossRef] [Green Version]
  68. Kumar, G.; Chander, H. Polylined water harvesting tank technique to mitigate the impact of climate change on agro-economy in rain fed conditions: A case study. J. Biol. Chem. Chron 2018, 4, 1–7. [Google Scholar]
  69. Badu-Apraku, B.; Fakorede, M.; Oyekunle, M.; Yallou, G.; Obeng-Antwi, K.; Haruna, A.; Usman, I.; Akinwale, R. Gains in grain yield of early maize cultivars developed during three breeding eras under multiple environments. Crop Sci. 2015, 55, 527–539. [Google Scholar] [CrossRef]
  70. Sengxua, P.; Samson, B.K.; Bounphanousay, C.; Xayavong, S.; Douangboupha, K.; Harnpichitvitaya, D.; Jackson, T.M.; Wade, L.J. Adaptation of rice (Oryza sativa L.) genotypes in the rainfed lowlands of Lao PDR. Plant Prod. Sci. 2017, 20, 477–484. [Google Scholar] [CrossRef] [Green Version]
  71. Cui, Y.; Li, R.; Li, G.; Zhang, F.; Zhu, T.; Zhang, Q.; Ali, J.; Li, Z.; Xu, S. Hybrid breeding of rice via genomic selection. Plant Biotechnol. J. 2020, 18, 57–67. [Google Scholar] [CrossRef]
  72. Chen, H.Q.; Liu, H.Y.; Wang, K.; Zhang, S.X.; Ye, X.G. Development and innovation of haploid induction technologies in plants. Yi Chuan Hered. 2020, 42, 466–482. [Google Scholar]
  73. Schaart, J.G.; van de Wiel, C.; Smulders, M.J. Genome editing of polyploid crops: Prospects, achievements and bottlenecks. Transgenic Res. 2021, 30, 337–351. [Google Scholar] [CrossRef]
  74. Karki, U.; Fang, H.; Guo, W.; Unnold-Cofre, C.; Xu, J. Cellular engineering of plant cells for improved therapeutic protein production. Plant Cell Rep. 2021, 40, 1087–1099. [Google Scholar] [CrossRef] [PubMed]
  75. Viana, V.E.; Pegoraro, C.; Busanello, C.; Costa de Oliveira, A. Mutagenesis in rice: The basis for breeding a new super plant. Front. Plant Sci. 2019, 10, 1326. [Google Scholar] [CrossRef] [PubMed] [Green Version]
  76. Rahman, S.U.; McCoy, E.; Raza, G.; Ali, Z.; Mansoor, S.; Amin, I. Improvement of Soybean; A Way Forward Transition from Genetic Engineering to New Plant Breeding Technologies. Mol. Biotechnol. 2022, 1–19. [Google Scholar] [CrossRef] [PubMed]
  77. Yang, J.; He, Y.; Luo, S.; Ma, X.; Li, Z.; Lin, Z.; Zhang, Z. Optimizing the Optimal Planting Period for Potato Based on Different Water-Temperature Year Types in the Agro-Pastoral Ecotone of North China. Agriculture 2021, 11, 1061. [Google Scholar] [CrossRef]
  78. Casadebaig, P.; Gauffreteau, A.; Landré, A.; Langlade, N.B.; Mestries, E.; Sarron, J.; Trépos, R.; Vincourt, P.; Debaeke, P. Optimized cultivar deployment improves the efficiency and stability of sunflower crop production at national scale. Theor. Appl. Genet. 2022, 1–15. [Google Scholar] [CrossRef] [PubMed]
  79. Dedeoğlu, M.; Dengiz, O. Generating of land suitability index for wheat with hybrid system aproach using AHP and GIS. Comput. Electron. Agric. 2019, 167, 105062. [Google Scholar] [CrossRef]
  80. Raza, M.A.; Cui, L.; Khan, I.; Din, A.M.U.; Chen, G.; Ansar, M.; Ahmed, M.; Ahmad, S.; Manaf, A.; Titriku, J.K. Compact maize canopy improves radiation use efficiency and grain yield of maize/soybean relay intercropping system. Environ. Sci. Pollut. Res. 2021, 28, 41135–41148. [Google Scholar] [CrossRef]
  81. Weih, M.; Karley, A.J.; Newton, A.C.; Kiær, L.P.; Scherber, C.; Rubiales, D.; Adam, E.; Ajal, J.; Brandmeier, J.; Pappagallo, S. Grain yield stability of cereal-legume intercrops is greater than sole crops in more productive conditions. Agriculture 2021, 11, 255. [Google Scholar] [CrossRef]
  82. Wu, Y.; Gong, W.; Yang, F.; Wang, X.; Yong, T.; Liu, J.; Pu, T.; Yan, Y.; Yang, W. Dynamic of recovery growth of intercropped soybean after maize harvest in maize–soybean relay strip intercropping system. Food Energy Secur. 2022, 11, e350. [Google Scholar] [CrossRef]
  83. Chen, P.; Song, C.; Liu, X.-M.; Zhou, L.; Yang, H.; Zhang, X.; Zhou, Y.; Du, Q.; Pang, T.; Fu, Z.-D. Yield advantage and nitrogen fate in an additive maize-soybean relay intercropping system. Sci. Total Environ. 2019, 657, 987–999. [Google Scholar] [CrossRef]
  84. Fang, Y.; Ren, T.; Zhang, S.; Liu, Y.; Liao, S.; Li, X.; Cong, R.; Lu, J. Rotation with oilseed rape as the winter crop enhances rice yield and improves soil indigenous nutrient supply. Soil Tillage Res. 2021, 212, 105065. [Google Scholar] [CrossRef]
  85. Song, X.; Huang, L.; Li, Y.; Zhao, C.; Tao, B.; Zhang, W. Characteristics of Soil Fungal Communities in Soybean Rotations. Front. Plant Sci. 2022, 13, 926731. [Google Scholar] [CrossRef] [PubMed]
  86. Abd Rahaman, M.S.; Cheng, L.-H.; Xu, X.-H.; Zhang, L.; Chen, H.-L. A review of carbon dioxide capture and utilization by membrane integrated microalgal cultivation processes. Renew. Sustain. Energy Rev. 2011, 15, 4002–4012. [Google Scholar] [CrossRef]
  87. Verhage, L. Model behavior: Finding out how to increase photosynthesis in C4 crops. Plant J. 2021, 107, 341–342. [Google Scholar] [CrossRef]
  88. Li, Y.; Ding, Y.; Li, D.; Miao, Z. Automatic carbon dioxide enrichment strategies in the greenhouse: A review. Biosyst. Eng. 2018, 171, 101–119. [Google Scholar] [CrossRef]
  89. Yu, X.; Zhang, Q.; Gao, J.; Wang, Z.; Borjigin, Q.; Hu, S.; Zhang, B.; Ma, D. Planting density tolerance of high-yielding maize and the mechanisms underlying yield improvement with subsoiling and increased planting density. Agronomy 2019, 9, 370. [Google Scholar] [CrossRef] [Green Version]
  90. Dembele, J.S.B.; Gano, B.; Kouressy, M.; Dembele, L.L.; Doumbia, M.; Ganyo, K.K.; Sanogo, S.; Togola, A.; Traore, K.; Vaksman, M. Plant density and nitrogen fertilization optimization on sorghum grain yield in Mali. Agron. J. 2021, 113, 4705–4720. [Google Scholar] [CrossRef]
  91. Bei, G.; Zhang, S.; Guo, Y.; Yanli, L.; Hu, N.; Liu, J. Study on Meteorological Disaster Monitoring of Field Fruit Industry by Remote Sensing Data. Adv. Meteorol. 2022, 2022, 1659053. [Google Scholar] [CrossRef]
  92. Abraha, T.; Basir, F.A.; Obsu, L.L.; Torres, D.F. Farming awareness based optimum interventions for crop pest control. arXiv 2021, arXiv:2106.08192. [Google Scholar] [CrossRef]
  93. Muneret, L.; Mitchell, M.; Seufert, V.; Aviron, S.; Djoudi, E.A.; Pétillon, J.; Plantegenest, M.; Thiéry, D.; Rusch, A. Evidence that organic farming promotes pest control. Nat. Sustain. 2018, 1, 361–368. [Google Scholar] [CrossRef]
  94. Widiastuti, D.; Marzuki, S.; Hatta, M. Utilization of Organic Fertilizer in Response to Mitigate CO2 Emission; IOP Conference Series: Earth and Environmental Science; IOP Publishing Ltd.: Bristol, UK, 2021; Volume 648, p. 012120. [Google Scholar]
  95. Liu, X.; Shi, L.; Qian, H.; Sun, S.; Wu, P.; Zhao, X.; Engel, B.A.; Wang, Y. New problems of food security in northwest china: A sustainability perspective. Land Degrad. Dev. 2020, 31, 975–989. [Google Scholar] [CrossRef]
Figure 1. Survey of geography of Northwest China. Note: The data involved in this figure come from the National Bureau of Statistics (http://www.stats.gov.cn/tjsj/, accessed on 6 August 2021).
Agriculture 12 01665 g001
Figure 2. Time-dependent trends of water resources consumption and water load index in Northwest China.
Agriculture 12 01665 g002
Figure 3. The characteristics of water consumption in various departments over time.
Agriculture 12 01665 g003
Figure 4. Evolution characteristics of crop water footprint over time.
Agriculture 12 01665 g004
Figure 5. The evolution trend of the production water footprint of grains and cash crops over time. Note: (A,B) show the variation trends of the production water footprint of grain crop and cash crop over time, respectively.
Agriculture 12 01665 g005
Figure 6. Evolution of crop water footprint over time in Northwest China from 2000 to 2020. Note: The left axis represents the crop water footprint, which corresponds to the bar graph. The red and green columns in the bar chart represent the decrease or increase, respectively, in the crop water footprint in that year compared to the previous year. The right axis represents the blue and green water footprint as a proportion of the total water footprint, which corresponds to the area plot.
Agriculture 12 01665 g006
Figure 7. Composition of water footprint of grain and cash crops and its variation with time.
Agriculture 12 01665 g007
Figure 8. Sensitivity analysis of regional crop water footprint.
Agriculture 12 01665 g008
Table 1. Water-resources load index level division [24,39].
RankCWater-Resources Utilization DegreeWater-Resources Development Potential
≥10Very highBarely
[5, 10)HighSmaller
[2, 5)MediumMedium
[1, 2)Relatively lowRelatively larger
[0, 1)LowGreat
Publisher’s Note: MDPI stays neutral with regard to jurisdictional claims in published maps and institutional affiliations.

