Article

The Impact of Different Planting Systems on the Bacterial Diversity of Rice Cultivated in Saline Soil Based on 16S rRNA Gene-Based Metagenomic Insights

by
Pugazhenthi Davidson Rokins
1,
Nellaiappan Olaganathan Gopal
1,*,
Rangasamy Anandham
1 and
Ramasamy Saraswathi
2
1
Department of Agricultural Microbiology, Tamil Nadu Agricultural University (TNAU), Coimbatore 641003, India
2
Department of Plant Genetic Resources, Tamil Nadu Agricultural University (TNAU), Coimbatore 641003, India
*
Author to whom correspondence should be addressed.
Agriculture 2022, 12(10), 1624; https://doi.org/10.3390/agriculture12101624
Submission received: 1 September 2022 / Revised: 28 September 2022 / Accepted: 3 October 2022 / Published: 6 October 2022

Abstract

:
Soil salinity is considered to be a major impediment to the production of rice among other abiotic stresses. In this study, 16S rRNA Illumina amplicon sequencing was performed to characterise the halophilic communities entrapped in rice rhizosphere soil cultivated in different planting systems (conventional, aerobic and System of Rice Intensification (SRI)) under saline conditions. The physicochemical properties and urease, soil dehydrogenase, alkaline phosphatase and arylsulphatase activity of soil samples were evaluated to understand their influence on the bacterial communities of the soil. Electrical conductivity (EC) of soil was lower in SRI soil samples, while the available major soil nutrients (nitrogen, phosphorous and potassium) content and soil enzyme activities such as dehydrogenase, alkaline phosphatase, urease and arylsulphatase were higher. A total of 2,516,700 reads were generated by amplicon sequencing of the hypervariable V3–V4 regions of bacterial 16S rRNA gene and were clustered into 273,447 OTU operational taxonomic units. The total number of Operational Taxonomic Units (OTUs) was higher in the conventional soil samples compared to the SRI and aerobic soil samples. Metagenomic analysis revealed that Proteobacteria was the most dominant phyla in all the planting systems followed by Actinobacteria, Firmicutes and Chloroflexi. The alpha diversity index was higher in conventional soil samples compared to other samples and more species diversity was found in SRI soil samples. KEGG analysis revealed that bacterial communities in different soil samples showed varied functional properties. The bacterial diversity of saline soil in this study can be utilised to identify microbial communities with biotechnological potential that can be employed for plant growth promotion in saline environments.

1. Introduction

Salinity has a significant impact on soil organic matter, nitrogen, dissolved organic carbon and microbial carbon biomass (MCB) [1]. Furthermore, salinity inhibits microbial activities such as microbial biomass carbon and enzyme activity. As a result, soil salinization is regarded as a severe hazard to agriculture, human resources and health [2]. The microbial community structure of the rhizosphere is more likely to be affected by sodium ion concentrations indirectly through the quality and quantity of root exudates [3]. Soil salinity affects the physical characteristics of soil by forcing tiny particles to bind together forming aggregates, which is useful for soil aeration, root penetration and root development, but at excessive levels, salt may be harmful to plants and can potentially be lethal [4]. Any impact of salt on microbial activities will have a big impact on the amount of organic matter in the soil and the availability of nutrients [5]. Soil health greatly relies on the enzyme activities in soil. Soil enzymes such as dehydrogenase and alkaline phosphatase are greatly affected by increasing soil salinity [6]. Dehydrogenase is a measure of a soil’s potential to sustain biochemical processes that are necessary for maintaining soil quality [7]. Phosphatase is important in phosphate (P) mineralisation because it converts the inaccessible form of P to the available form in soil [8]. In agricultural systems, the urease enzyme helps in the breakdown of urea fertiliser [9]. As sulphate esters account for a large proportion of total sulphur (S) in soil, arylsulphatases play a major role in the mobilisation of inorganic SO42− for plant nutrition [10].
More than half of the world’s population consumes rice, with India and China contributing more than half of the supply [11]. Rice is prone to salinity and exhibits a wide range of negative effects in response to higher salt levels in the soil [12]. Plant growth-promoting bacteria (PGPB) found in the rhizosphere of soil operate as elicitors of salt tolerance in plants and boost their development [13]. The PGPB are engaged in multiple strategies to defend plants from the harmful effects of salt stress, including biofilm formation, extracellular polymeric substance (EPS) synthesis, nitrogen fixation, phytohormone production and ACC-deaminase activity [14].
According to a meta-analysis of soil microbial communities, salinity influences the global microbial composition of saline soil more than any other extreme chemical factor, such as temperature or pH [15]. Microorganisms found in naturally saline environments are thought to have developed mechanisms for surviving with high salt concentrations and several adaptations for keeping their population active while living in such harsh circumstances. From a genetic perspective, these species exhibit an under or over-expression of certain genes and metabolites that enable them to cope with osmotic stress [16]. Metagenomic studies have revealed the interaction between microbial populations and their environment, exhibiting ecological diversity.
For millennia, lowland rice agriculture has been performed under persistently flooded soil conditions. Most rice researchers have embraced the long-held belief that rice grows best in standing water [17]. For more than a decade, the System of Rice Intensification (SRI) has been promoted for rice cultivation that improves yield [18,19], increases input productivity [20], reduces water requirements [21] and is affordable to smallholders [22]. It is better for the environment than the conventional system, which involves constant flooding of paddies and a high dependence on artificial fertilisers [23]. The aerobic rice cultivation system is the method of cultivation where the rice crop is established by direct seeding (dry or water-soaked seed) in the non-puddle field and un-flooded field condition [24]. Compared with flooded lowland rice, aerobic rice requires 30–50% less water [25]. Cultural practices such as puddling, irrigation, application of nutrients and weed control operations are different in conventional, aerobic and SRI planting systems which might have an impact on the microbial community structure of the soil which can be revealed by this study.
In the previous studies, conventional and no-tillage operations [26], soil organic C, N-fertiliser and tillage-crop residue management [27], rhizosphere soil of rice [28] and salinity of the soil [29] were taken into consideration to compare the changes in the microbial community structure; however, to our knowledge this is the first study to compare the rhizosphere soil bacterial diversity in three types of planting systems of rice in saline soils. The objective of this study was (i) to use targeted amplicon-based (16S rRNA gene) metagenomic approach to characterise rhizosphere soil from rice fields with different planting systems, such as conventional, aerobic and SRI cultivated in saline soil and (ii) to find out correlation among soil enzymes, physicochemical properties, and bacterial diversity. We hypothesise that understanding the bacterial diversity in different planting systems of rice grown in saline soil helps us to identify the impact of different cultivation practices of different planting systems on the soil bacterial diversity and their functions.

2. Materials and Methods

2.1. Soil Sample Collection

Sampling locations were selected based on salt-affected areas of Tamil Nadu where rice is cultivated, and the yield of the crops are greatly affected by high salinity. Rice fields with different planting systems (conventional, aerobic and SRI) were selected to compare the bacterial diversity among the different planting systems. Three districts in Tamil Nadu (Tindivanam (L1), Ramanathapuram (L2) and Trichy (L3)) which are greatly affected by saline soil were selected. Rice rhizosphere soil was sampled in triplicate by pulling out the plant to collect the soil firmly attached to the roots from each field. Well established plants without any disease symptoms were selected randomly from each corner and centre of the field. The age of the crops was from panicle initiation to flowering stage. Soil from five plants was pooled together to obtain soil samples for each replication in a field, which were maintained in individual sterile plastic bags. The rice rhizosphere soil was sampled in triplicate from 13 different geographical sites of the three districts (Samples S1 to S5 from L1, S6 to S10 from L2 and samples S11 to S13 from L3). Similarly, a portion of soil collected from each location was stored separately for the analyses of physicochemical properties and enzyme activity of soil.

2.2. Estimation of Physicochemical Properties of Soil Samples

The soil samples were air-dried and passed through a 2mm sieve for further analysis. The physicochemical properties for soil samples from 13 different sites were analysed. Soil reaction (pH) and electrical conductivity were estimated according to Jackson [30]. Available nitrogen, phosphorus and potassium were estimated according to Subbiah and Bajaj [31], Olsen [32] and Stanford and English [33], respectively. The organic carbon content of the soil samples was determined as in Walkley and Black [34]. Micronutrient estimation in the soil samples was completed according to Lindsay and Norvell [35] using an atomic absorption spectrophotometer (LABINDIA AS 8000).

2.3. Soil Enzyme Analysis

The soil samples were prepared as mentioned in the previous section and soil enzymes such as dehydrogenase, alkaline phosphatase, urease and arylsulphatase were estimated. Six grams of soil was taken and mixed with 0.1 g of CaCO3 in a test tube. 1 mL of 3 percent 2, 3, 5-triphenyl tetrazolium chloride and 2.5 mL distilled water was added to it and incubated for 24 h at 37 °C. After incubation, 10 mL of methanol was added and mixed for 1 min, and the sample was then filtered using Whatman No.40 filter paper. It was repeated till the volume reached 25 mL and the reading was taken at 485nm using the spectrophotometer (M/s. Shimadzu, Japan). The standard graph was prepared from the stock solution of triphenyl formazan and methanol was used as a blank [36] and the enzyme activity was expressed as µg of triphenyl formazan (TPF)/g/day.
Dehydrogenase   enzyme   activity   = Concentration   of   the   sample Weight   of   the   sample × vol   make   up   to   ( mL )
To determine the alkaline phosphatase activity, one gram of the soil was taken and added with 0.2 mL of toluene and 4 mL of modified universal buffer (pH 9.5), followed by 1 mL of 0.05 M p-nitrophenyl phosphate (pH 9.5) and kept in an incubator at 37 °C. After 1 h of incubation, 1 mL of 0.5 M calcium chloride and 4 mL of 0.5 M NaOH was added. The soil suspension was filtered through Whatman No. 42 filter paper and the intensity of the yellow colour was measured immediately in a UV-Visible spectrophotometer at 420 nm. The p-nitrophenol content of the filtrate was computed from the standard curve. The enzyme activity was expressed in μg of p-nitrophenol released/g of soil/h [37].
Alkaline   phosphatase   activity = Concentration   of   the   sample Weight   of   the   sample × vol   make   up   to   ( mL )
In order to determine the urease activity, five grams of dry soil was taken and added with 0.2 mL of toluene and 9 mL of Tris hydroxymethyl aminomethane (THAM) buffer (0.05 M, pH 9.0), followed by the addition of 1 mL of 0.2 M urea solution and incubated for 2 h at 37 °C. Then 35 mL of KCl-Ag2SO4 was added, mixed, allowed to cool to room temperature and the volume was made up to 50 mL by the addition of KCl-Ag2SO4. From this solution, 20 mL aliquot was pipetted out into 100 mL distillation flask and steam distilled with 0.2 g of MgO for 4 min. Twenty-five ml of the distillate was collected in a 50 mL Erlenmeyer flask containing 5 mL of 2% H3BO3-indicator solution. NH4+-N concentration of distillate was estimated by titrating with standard acid with the colour change from blue to pink as the endpoint. A control was also maintained and the urease activity was expressed in μg of NH4 released/g of soil/h [38].
Two grams of soil was amended with 4 mL of acetate buffer (0.5 M; pH 5.8), 1 mL of 20 mM p-nitrophenyl sulphate and 0.5 mL of toluene to determine arylsulphatase activity. The samples were mixed and incubated at 20 °C for 5 h. After incubation, the samples were added with 2 mL of 1 M NaOH and 1 mL of 0.5 M CaCl2, mixed and the supernatant was collected for spectrophotometric analysis at 400 nm. The arylsulphatase activity was calculated from the p-nitrophenol standard curve correcting for blanks [39].
Principal component analysis for all the soil samples with available N, P, K and soil enzymes as active variables was completed to select soil samples from each planting system for metagenomic analysis. XLSTAT version 2021.4 (Addinsoft Inc., New York, NY, USA) was used to perform the principal component analysis.

2.4. Genomic DNA Extraction

The DNA of soil selected from different planting systems (aerobic, conventional and SRI) with three replications each was extracted using the Qiagen soil DNA extraction kit following the manufacturer’s protocol. The DNA was eluted in 30 μL of elution buffer according to the manufacturer’s description and stored at −80 °C until the PCR process.

2.5. 16S rRNA Gene (V3–V4) Region Amplification and Data Processing

The total DNA extracted from nine soil samples was used to amplify the V3-V4 region of the bacterial 16S rRNA gene to identify the bacterial communities. The primers V13F (5′-AGAGTTTGATGMTGGCTCAG3′); V13R (5′-TTACCGCGGCMGCSGGCAC-3′) were used for amplification. Denaturation was performed at 95 °C for 15 sec, annealing at 60 °C for 15 sec, elongation at 72 °C for 2 min, final extension at 72 °C for 10 min and hold at 4 °C. Ampure beads were used to purify amplicons from each sample to remove the unused primers. An additional 8 cycles of PCR were completed using Illumina barcoded adapters to prepare the sequencing libraries. Libraries were quantitated using Qubit ds DNA High Sensitivity assay kit and sequencing was performed using Illumina Miseq with a 2 × 300PE v3 sequencing kit.
Raw Illumina reads were demultiplexed and FASTQC (v.0.11.9) (Babraham institute, Cambridge, UK) and MULTIQC (v.1.10.1) (Seqera labs, Barcelona) were used for their quality checking (QC) to obtain high-quality reads, followed by the trimming of adapters, ambiguous reads (reads with unknown nucleotides “N” larger than 5%) and low-quality reads (reads with more than 10% quality threshold (QV) <20 Phred score) by TRIMGALORE (v.0.6.4) (Babraham institute, Cambridge, UK). QIIME was used for merging paired-end reads and chimera removal. The microbiome analyst work package was used to perform diversity analysis of the samples which includes α-diversity computations and relative abundance profiles of OTU in the samples with taxonomic assignments. The alpha diversity was constructed at the taxonomic level of the genus was measured and resulted with 4 methods such as Chao1, Shannon, Simpson and Fisher with the statistical method of T-test/ANOVA(SPSS). The beta diversity was assessed using the Permutational MANOVA (PERMANOVA) statistical approach, which is based on the Bray–Curtis index distance method, at the taxonomic level of the genus. The SILVA database was used for taxonomic assignments. The core bacterial microbiome analysis of the soil samples was based on the detection threshold level (relative abundance %) and was computed using “microbiome analyst”. KEGG analysis was completed using the online tool “METAGENassist” [40].

2.6. Data

All raw amplicon sequence data of the samples were deposited in NCBI SRA (Sequence Read Archive) under the submission ID SUB10898466 and accession number PRJNA794070.

2.7. Statistical Analysis

The data on major soil nutrients (N, P and K) and soil enzyme activities (dehydrogenase, alkaline phosphatase, urease and arylsulphatase), and the principal component analysis (PCA) were carried out to select soil samples representing each planting system for metagenomic analysis using Microsoft Excel for Windows 2010 add-in with XLSTAT version 2022.1.1.1251 (Addinsoft Inc., New York, NY, USA). To group the soil samples based on soil enzyme activities and to group the different planting systems based on bacterial diversity indices, Tukey’s test was performed at a 5% significance level using IBM SPSS Statistics version 22 (New York, NY, USA).

3. Results

3.1. Collection and Analyses of Soil Samples from Different Planting Systems

Soil samples were collected from thirteen different sites of three different districts of Tamil Nadu affected by soil salinity where rice is grown under different cultivation methods (conventional, aerobic and SRI) (Figure 1). The place of soil sample collection is presented in Table 1. The soil samples showed a wide variation in their physicochemical characteristics (Table 2). The soil pH ranged from 6.6 to 7.8 and EC ranged between 4.59 and 8.43 dSm−1. Organic matter content was maximum (0.87%) in soil sample number 4 and lower in soil sample number 7 (0.62%). Available N (288.64 kg ha−1), P (92.76 kg ha−1), and K (362.75 kg ha−1) were maximum in soil sample numbers 13, 12 and 13, respectively. The micronutrient analyses of the soil samples are given in Table S1. The soil samples were analysed for different soil enzyme activities. Soil dehydrogenase activity was maximum in soil sample number 11, alkaline phosphatase activity was maximum in sample 7, urease activity was maximum in soil samples 6 and 11 and arylsulphatase activity was higher in sample 11. PCA analysis of major plant nutrients and soil enzyme activity clustered all the 13 samples into four groups. The soil enzyme activities such as dehydrogenase, alkaline phosphatase, urease and arylsulphatase were the most influential factors affecting the soil samples, as these variables were found to be placed in the positive quadrant (+ for F1 and F2). The soil samples 6, 7 and 11 from conventional, aerobic and SRI planting systems, respectively, were found to be placed in the positive quadrant (+ for F1 and F2) and were selected for microbial analyses (Figure 2).

3.2. The 16S rRNA Gene-Based Metagenomic Analysis of Soil Samples

Amplicon sequencing of the hypervariable V3–V4 regions of bacterial 16S rRNA gene generated a total of 2,516,700 reads. After the chimera check and trimming, the sequences were clustered into 273,447 OTU operational taxonomic units. The number of reads, observed OTUs and GC content for each sample are given in Table 3. The bacterial community consisted of 21 bacterial phyla, 51 classes, 107 orders, 214 families and 384 genera in total.
A rarefaction curve was used to assess the richness of the samples which indicated that the conventional soil samples were more diverse since the number of different species (OTUs) was greater than other samples (Figure S1). A heat map was generated using the most abundant genera based on Bray–Curtis dissimilarity (Figure S2). The colour in the rectangle box suggested a positive or negative correlation between the sample and the abundance of different genera. The top dendrogram showed soil samples from three different planting system (three samples each from aerobic, conventional and SRI) and the side dendrogram showed different genera. The abundance of bacterial genera in each planting system varied, as seen by the colour differences. The phylogenetic relationship between the soil samples was shown using Hierarchical clustering/Dendrogram (Figure S3). The dendrogram showed that the bacterial diversities of the aerobic, conventional and SRI soil samples were not similar to each other and were branched at equal distance from each other in the hierarchical clustering.

3.3. Soil Bacterial Community Differs in the Rhizosphere of Rice with Different Planting Systems

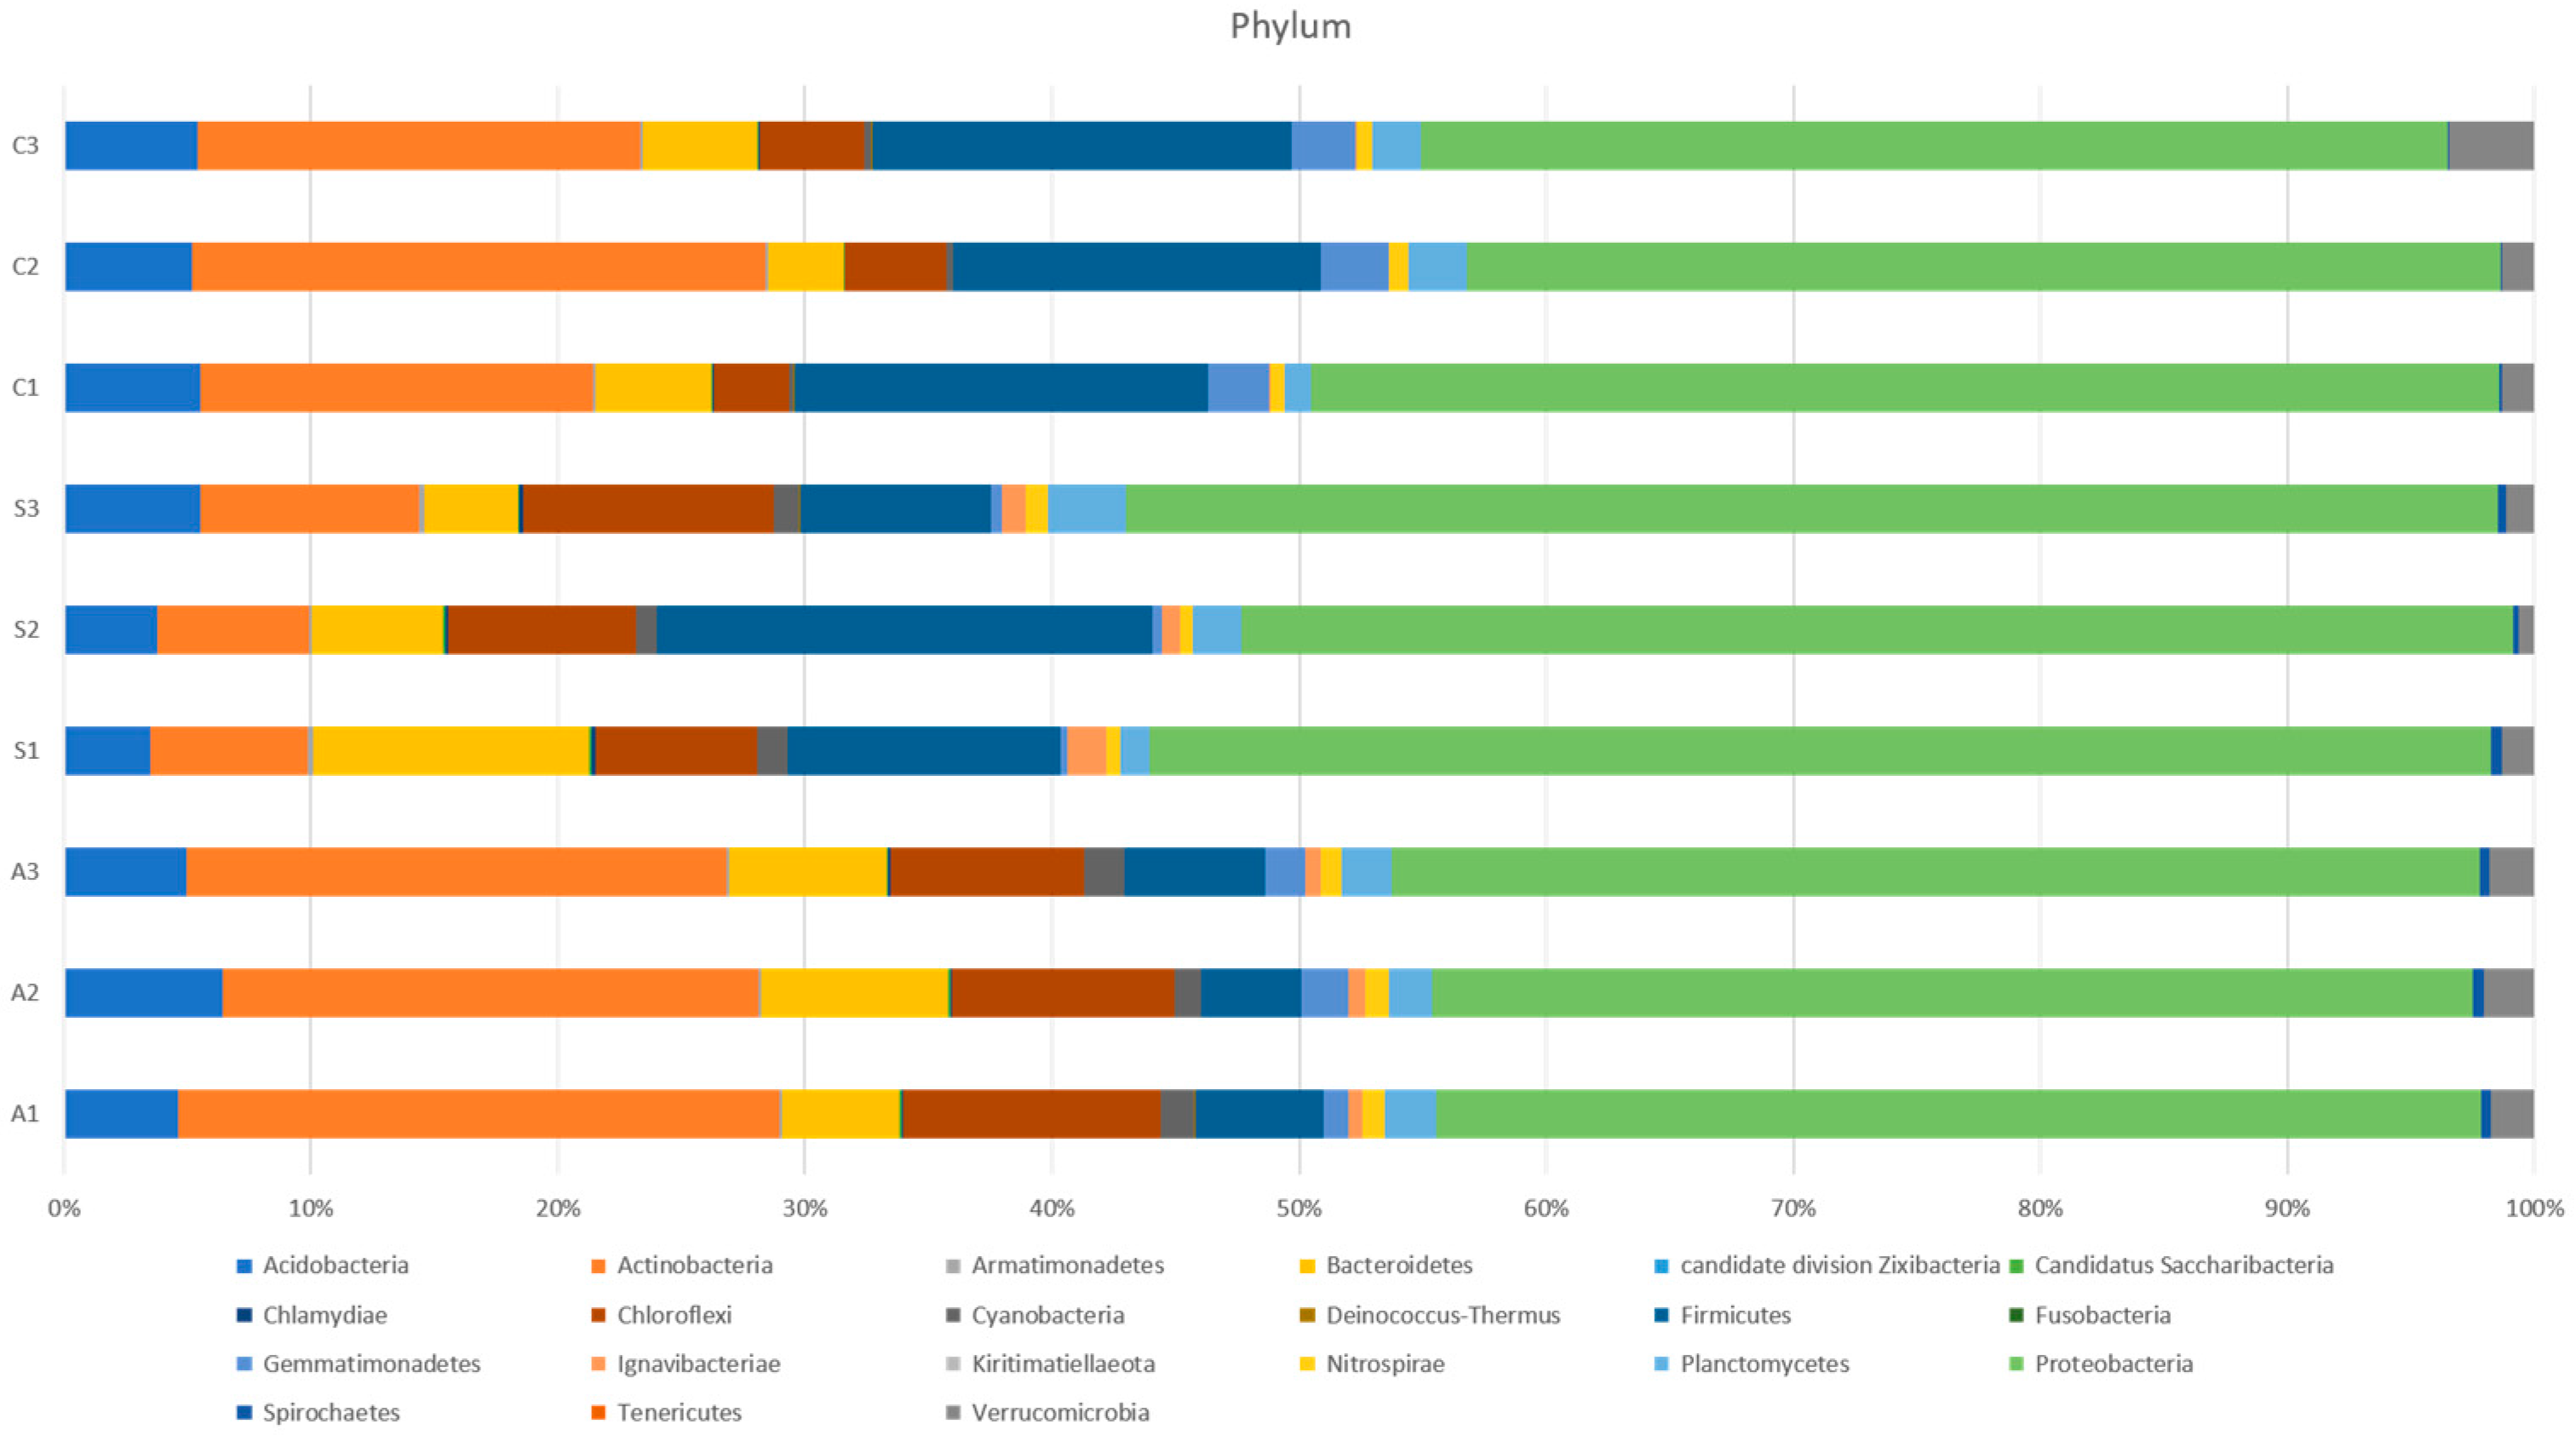
Proteobacteria was found to be the most dominant bacterial phyla with an abundance percentage of 42.82%, 43.86% and 53.74% for aerobic, conventional and SRI soil samples, respectively. It was followed by Actinobacteria (22.61%) and Chloroflexi (9.1%) in aerobic, Actinobacteria (19%) and Firmicutes (16.2%) for conventional and Firmicutes (12.93%) and Chloroflexi (8.12%) in SRI soil samples (Figure 3). The predominant bacterial class in aerobic soil was Actinobacteria (18.1%), while Alphaproteobacteria was dominant in conventional and SRI samples with 28.1% and 20.18%, respectively (Figure S4) followed by Betaproteobacteria and Deltaproteobacteria. Among different orders, Rhizobials showed a higher abundance percentage in aerobic (8.73%) and conventional (13.27%) soil samples and the order Clostridiales (9.02%) was higher in SRI samples (Figure S5). Anaerolineaceae was prevalent over the other families in aerobic (8.23%) and SRI samples (6.64%) and the dominant family in conventional samples were Bacillaceae (8.53%) (Figure S6). There was a wide range of diversity in genera among the different soil types. Actinomadura (4.66%), Rubrobacter (4.21%) and Sorangium (3.74%) were the most dominant genera in aerobic soil. While in conventional soil, Corallococcus (3.15%), Luteitalea (2.82%) and Gemmatimonas (2.6%) were found to be more abundant and Pseudomonas (4.38%), Clostridium (3.95%) and Desulfoglaeba (2.71%) were identified to be the most prevalent genera in SRI (Figure S7).
The results of alpha diversity for aerobic, conventional and SRI soil samples are given in Table 4. The Alpha diversity index was higher in conventional soil samples with an average value of Chao1-189.7, Shannon-4.05, Simpson-0.97 and Fisher-28.5 compared to other samples. The higher values of the alpha diversity index indicated a more relative abundance and/or a greater number of species. The species diversity was higher in SRI samples which showed that though the species richness was lower than conventional soil samples, the diversity of the species was higher in SRI samples which was evidenced by the distance between the scattered dots (Figure 4).
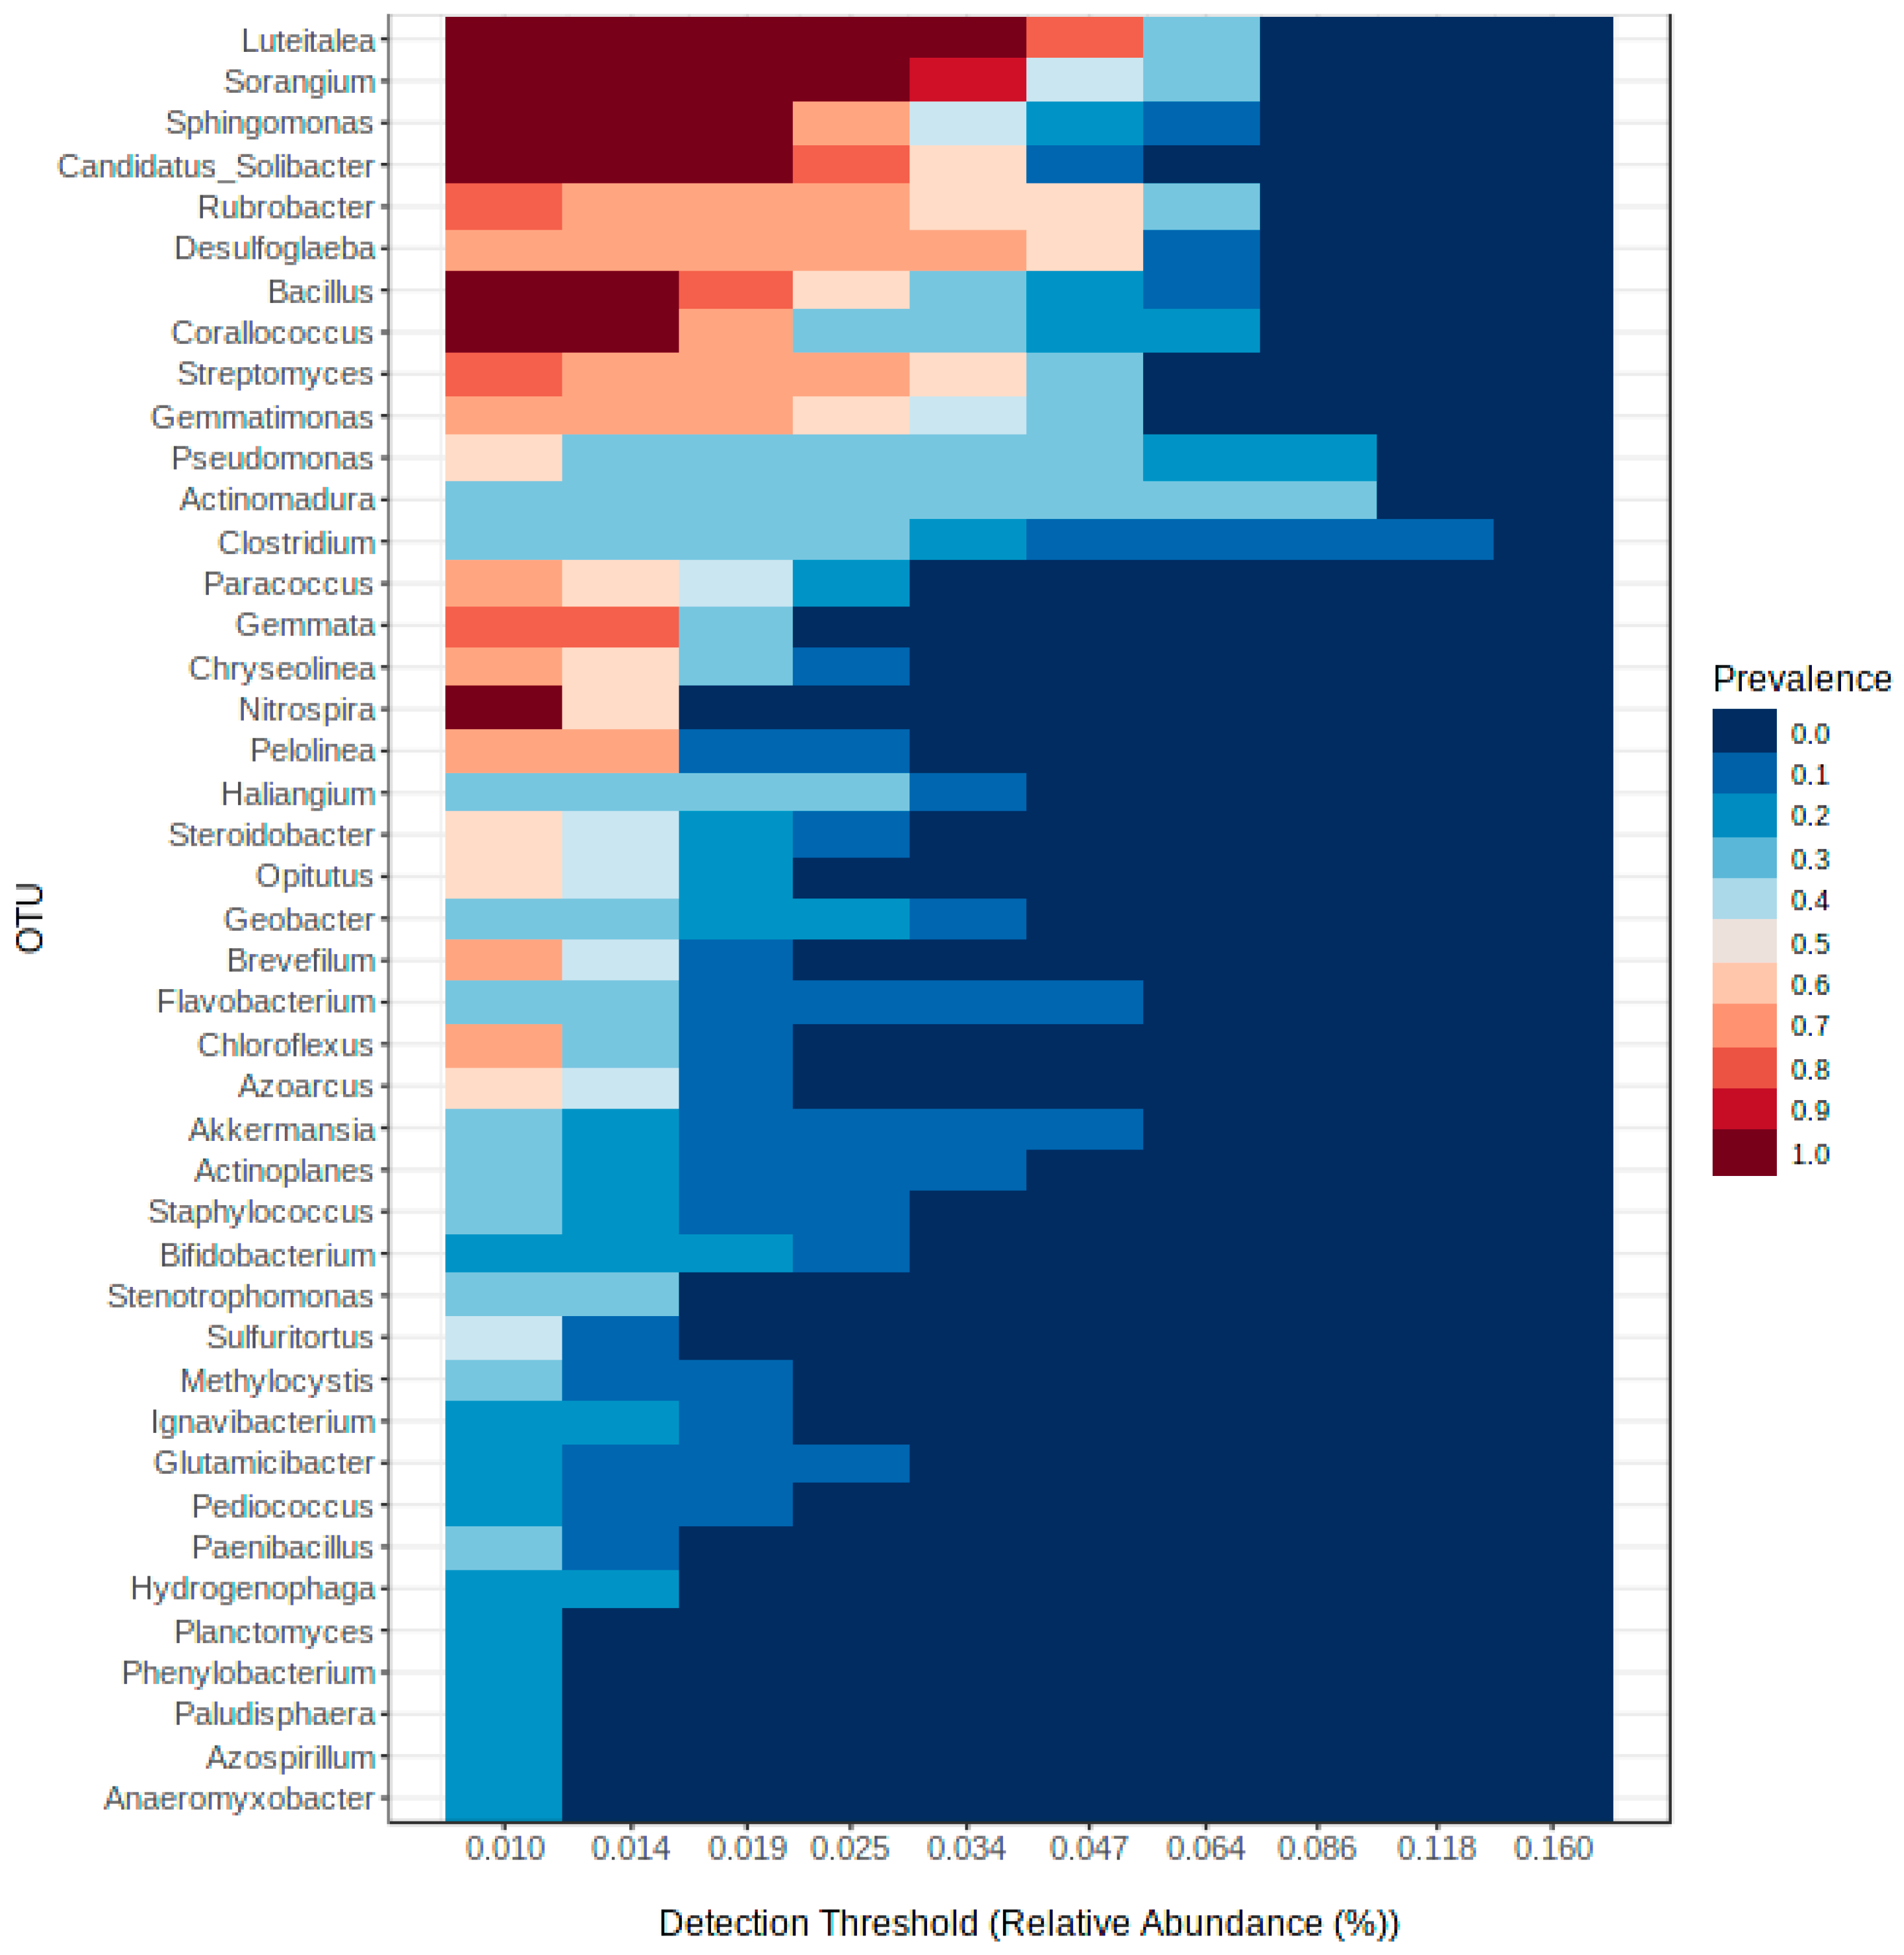
A core microbiome was deciphered based on the relative abundance and the prevalence across the soil samples of three different planting systems depicted as a heat map in Figure 5. The core taxa found with greater prevalence (1) were Sphingomonas, Sorangium, Nitrospira, Luteitalea, Corallococcus, Candidatus_Solibacter and Bacillus. Microorganisms identified with <0.1% read abundance were not considered as core bacterial flora. The soil samples contained 43 unique amplicon sequence variants (ASVs) of the bacterial core microbiome.

3.4. Comparative Analysis on the Bacterial Community Associated with Aerobic, Conventional and SRI Soil Samples

The bacterial community members of three different types of soil samples were determined by examining the distribution pattern of amplicon sequence variants (ASV) within the planting systems (Figure S8). A total of 303 bacterial ASVs were identified in which conventional soil contained the majority of unique ASVs with 46 (15.2%) followed by SRI with 32 (10.6%) and aerobic soil with 16 (5.3%) of unique bacterial ASVs. However, 154 (50.8%) ASVs were found to be commonly expressed in a middle lobe among all three samples. A total of 28 (9.2%) were shared between conventional and SRI soil samples, 17 (5.6%) were shared between aerobic and conventional and 10 (3.3%) were shared between SRI and aerobic soil samples.
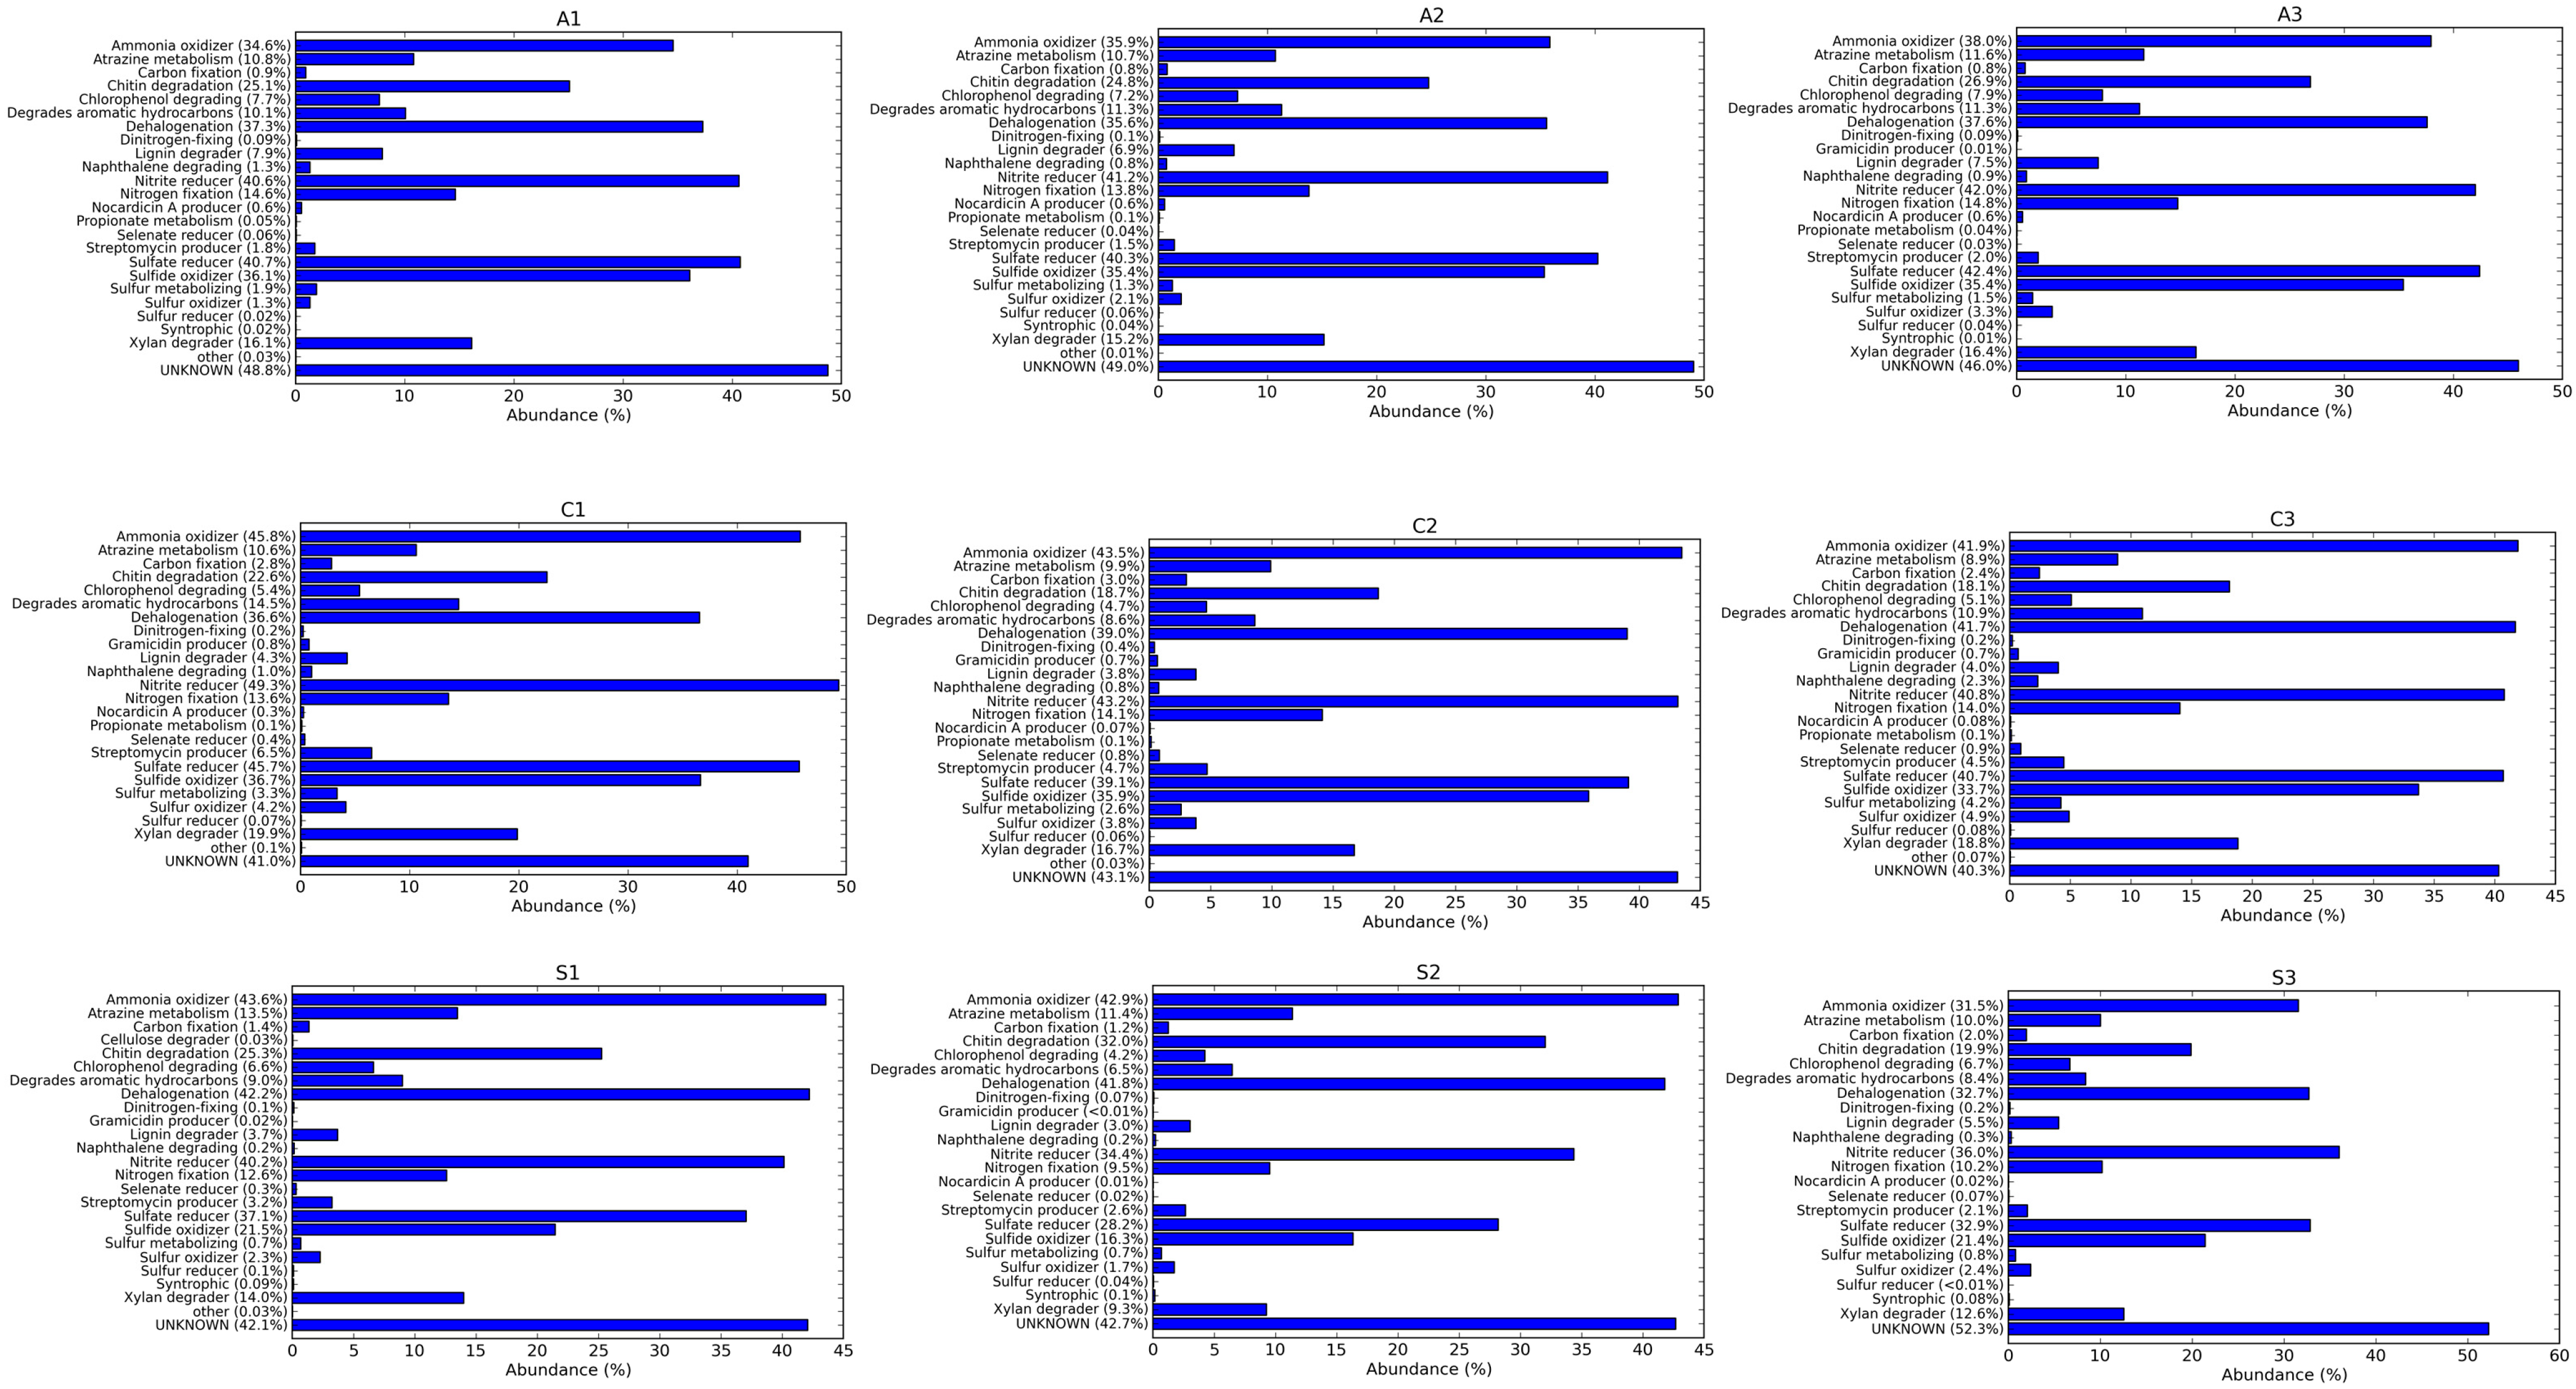
KEGG analysis was performed to identify the functional properties of the bacterial diversity in aerobic, conventional and SRI soil samples (Figure 6). Ammonia oxidisation, nitrite reduction and sulphate reduction were higher in conventional soil with an average of 43.7%, 44.4% and 41.8%, respectively. Nitrogen fixation was higher in SRI soil with an average of 14.4%. Carbon fixation was less than 1% in aerobic soil samples. About 45% of functions are unknown which might play a significant role in soil health.

4. Discussion

4.1. Soil Salinity, Soil Characteristics and Microbial Community

Soil salinity affects the growth and development of crops from the germination stage and results in poor yields. Certain bacterial communities prevailing in saline soil have the ability to protect themselves and promote plant growth even under stress conditions. In this study, rhizosphere soil samples were collected from rice fields where soil salinity was a concern for plant cultivation. High salt concentrations, as well as an uneven temporal and spatial water distribution, characterise saline soils. High salt concentrations alter bacteria’s unique habitat patterns, leading microbes in saline soils to differ from those found in non-saline soils. Salinisation is defined as the accumulation of salt by one or more natural processes, such as excessive salt content in the parent material or groundwater, as well as human interventions, such as improper irrigation practices or inappropriate fertiliser application. In any case, Na+ is a sort of salt, which is the most important component. The Na+ could be a significant proton substitute for alkaliphilic bacterial species to cope with the high external pH [41]. The relative abundance of these microbes is linked to the rate of carbon mineralisation in the soil [42].
Rhizosphere soil has been reported to have a higher alpha diversity than bulk soil [43] as it harbours a greater microbial population due to excess nutrient availability as root exudates. Soil samples were collected from rice fields with different planting systems to understand the diverse variations in the bacterial community due to differences in cultivation practices. The pH of the soil samples collected was almost neutral. The electrical conductivity of the soil samples collected was greater than 4 dSm−1 which can be indicated as saline soil. Rath, et al. [44] reported that bacterial growth is greatly affected by both low and high EC in saline soil. The extent of the influence of EC might vary depending upon the bacterial species. In our study, the SRI soil samples were found to be with low EC content compared to others and the beta diversity was higher in SRI soil samples which showed that EC content might have a direct relationship with the diversity of the bacterial community in the soil. The available nutrient content in soil such as nitrogen, phosphorous and potassium was also higher in SRI soil samples. The decomposition of soil organic matter and the recycling of nutrients in the soil are both aided by soil enzyme activity [45] and soil fertility can be indicated by the enzyme activities in soil [46]. The activity of soil enzymes can be an excellent indicator of soil health and quality [47]. Salinity inhibition of soil enzymes was linked to its direct influence on microbial enzyme production and structural changes in enzymes, soil physicochemical and microbial properties and changes in soil osmotic potential [48]. In our study, dehydrogenase, urease and arylsulphatase enzymes activity were higher in the SRI soil sample in which the EC content was low compared to the other two planting systems. Based on the higher nutrient availability and soil enzyme activity, soil samples from three different planting systems each were selected for metagenomic analysis. Environmental variations affect soil microbial diversity [49]. The amount of water in the soil regulates microbial activity and is a primary determinant of mineralization rates [50]. In this study, the alpha diversity and the species diversity was lower in aerobic soil samples. In SRI and conventional planting systems, the field is allowed to stagnate with irrigation water which increases the relative water content of the soil leading to a higher bacterial population and diversity. This might have resulted in a higher alpha diversity in conventional soil samples and a higher species diversity in SRI soil samples.

4.2. Rhizosphere Bacterial Community Differs with Different Planting Systems

Six phyla (Proteobacteria, Actinobacteria, Firmicutes, Acidobacteria, and Bacteroidetes) reported by Ma and Gong [15] contained 90% of the bacterial sequences in saline soils; here, we detected all the six major phyla with the addition of Chloroflexi in our soil samples. Proteobacteria covered almost 47% of the bacterial sequence in our study, and it is the most predominant phyla in most of the reports related to saline soil [29]. The average number of OTUs was higher in the conventional soil sample with about 34,393 OTUs. Bacterial members of the phylum Proteobacteria are known for their ubiquitous nature and metabolic diversity. To survive in harsh environments, they use a variety of carbon compounds and maintain both aerobic and anaerobic lifestyles [51]. Representatives of the most abundant halophilic bacteria in saline soils are Proteobacteria and Actinobacteria [15]. Firmicutes are also considered as special indicators for saline soil [52]. The genus Bacillus assigned to the phylum Firmicutes is considered to be a significant resource for the exploration of halophilic enzymes and metabolic pathways for remediation of pollutants in saline soil [53]. In other works, Gemmatimonadetes and Bacteroidetes were found to be involved in biogeochemical transformations in salinised soils [15,54]. Acidobacteria members have a wide existence and a genetic and metabolic diversity which enables them to survive in saline–alkaline conditions of agricultural habitats [55]. Acidobacteria can use cellulose and other compounds found in rhizospheric soil as a source of energy and can thrive in environments with low nutrition levels [56]. Chloroflexi was one of the dominant phyla which were found in our soil samples. They are filamentous bacteria that devour the organic matter produced by autotrophic cyanobacteria and can be found in surface soils, and some strains can grow autotrophically by using hydrogen or sulphide as an electron donor [57]. Members of the class Deltaproteobacteria, which deals with the reductive phase of the sulphur cycle, was found in lower numbers. At reduced salinity, these are said to be more active [58]. Deltaproteobacteria was the third most abundant class in both conventional and SRI soil samples in the current investigation. Betaproteobacteria was dominant in SRI soil samples, which consists of ammonia-oxidizing bacteria involved in the nitrogen cycle [59].
Anaerolineaceae was the most dominant family in aerobic and SRI samples. They are chemoheterotrophs that ferment proteinaceous substrates and carbohydrates [60]. Bacillaceae family was found prevalent in conventional samples. It has been discovered that members of the Bacillaceae family stimulate the growth of plant roots by reducing the levels of ethylene concentrations [61] and by enhancing the assimilation of metal ions, such as iron, by activating the plant’s own iron acquisition machinery [62]. In addition to having a number of other positive traits that help plants resist infections, Bacillus strains can also promote Rhizobium–legume symbioses [63]. The members of Actinomadura, the dominant genera in the aerobic sample can enhance plant growth by nitrogenase activity and increase the nutrient levels of nitrogen (N), phosphorus (P), potassium (K), calcium (Ca), magnesium (Mg), iron (Fe) and zinc (Zn) in plants [64]. Corallococcus genera exhibit antifungal activity against many plant pathogenic fungi [65]. They were found to be the most abundant genera in conventional soil samples. The most diverse genus of bacteria on earth, Pseudomonas, has over a hundred different species [66]. Pseudomonas is abundant in the rhizosphere [67], and it has managed to attract a lot of attention for its exceptional growth-promoting properties, including improved root colonisation, enzyme and metabolite production, nutrient solubilization, indole acetic acid (IAA), and siderophore production, acting as a biocontrol agent, and inducing systemic resistance against diseases [68]. They were found to be the most prevalent in SRI soil samples.
Among the three-planting system, the conventional soil sample was found to be rich in the bacterial community when compared to the other two systems. The conventional and SRI soil samples were close to each other as they shared the most common amplicon sequence variants (ASVs) 28 (9.2%) within them and the conventional soil sample consisted of about 15.2% of unique ASVs which was the highest among the samples. Soil microorganisms play a significant role in all major biogeochemical cycles and are responsible for a wide range of crucial roles in an ecosystem. The high degree of phylogenetic conservation of key genes and enzymes was used to estimate the evolutionary implications of microbial pathways [69]. KEGG analysis of the soil samples revealed the functional roles played by the bacterial community in the soil. In comparison to the other soil types, the bacterial community in conventional soil exhibited the most ammonia oxidation, nitrite reduction and sulphate reduction activities and nitrogen fixation activity were higher in SRI soil samples. There was no significant difference in other activities among the soil samples.

5. Conclusions

Microbial communities in naturally salt-affected soils offer biotechnological potential and can be employed in saline-environment restoration and conservation strategies. The 16S rRNA gene amplicon-based metagenomic analysis of rice rhizosphere soil from aerobic, conventional and SRI planting systems cultivated under saline conditions was carried out showing sharp distinctions in the bacterial diversity. The differences in planting systems have led to variations in the bacterial community’s population, species richness and diversity which were evident in our study. This study provides information on the changes in bacterial community structure caused by changes in cultivation practices followed in different planting systems of rice. The findings indicated a huge range of bacteria that may be used not only as a biofertiliser for increased plant health but also as a reservoir of new enzymes and metabolites that have yet to be discovered. Several of these bacteria have been shown to have potential plant growth-enhancing capabilities; therefore, they may be effective in reducing salt stress and encouraging agriculture in saline soil.

Supplementary Materials

The following supporting information can be downloaded at: https://www.mdpi.com/article/10.3390/agriculture12101624/s1, Figure S1: Rarefaction analysis of soil samples from three different types of rice planting systems; Figure S2: Heat map based on the relative abundance of bacterial genera of different types of rice planting systems; Figure S3: Hierarchical clustering/Dendrogram showing the phylogenetic relationship of three different types of rice planting systems; Figure S4: Taxonomic composition and relative abundance of bacterial classes of three different types of rice planting systems; Figure S5: Taxonomic composition and relative abundance of bacterial levels of three different types of rice planting systems; Figure S6: Taxonomic composition and relative abundance of bacterial family of three different types of rice planting systems; Figure S7: Taxonomic composition and relative abundance of bacterial genera of three different types of rice planting systems; Figure S8: Venn diagram depicting the distribution of Amplicon sequence variants of the bacterial community of aerobic, conventional and SRI soil samples. Table S1: Micronutrient analyses of the soil samples collected from three different districts of Tamil Nadu.

Author Contributions

N.O.G. and R.A. conceptualised and designed the work. P.D.R. performed the work, analysed the data and drafted the manuscript. N.O.G., R.A. and R.S. corrected the manuscript and helped in analysis. All authors have read and agreed to the published version of the manuscript.

Funding

The first author, P.D.R. being an INSPIRE fellow (IF190260), is grateful to Government of India, Ministry of Science and Technology, Department of Science and Technology, New Delhi for financial support.

Data Availability Statement

All raw amplicon sequence data of the samples were deposited in NCBI GenBank (https://www.ncbi.nlm.nih.gov/, accessed on 4 January 2022) NCBI SRA (Sequence Read Archive) under the submission ID SUB10898466 and accession number PRJNA794070.

Conflicts of Interest

The authors declare no conflict of interest.

References

  1. Xu, Z.; Shao, T.; Lv, Z.; Yue, Y.; Liu, A.; Long, X.; Zhou, Z.; Gao, X.; Rengel, Z. The mechanisms of improving coastal saline soils by planting rice. Sci. Total Environ. 2020, 703, 135529. [Google Scholar] [CrossRef]
  2. Shrivastava, P.; Kumar, R. Soil salinity: A serious environmental issue and plant growth promoting bacteria as one of the tools for its alleviation. Saudi J. Biol. Sci. 2015, 22, 123–131. [Google Scholar] [CrossRef] [PubMed] [Green Version]
  3. Nelson, D.R.; Mele, P.M. Subtle changes in rhizosphere microbial community structure in response to increased boron and sodium chloride concentrations. Soil Biol. Biochem. 2007, 39, 340–351. [Google Scholar] [CrossRef]
  4. Warrence, N.J.; Bauder, J.W.; Pearson, K.E. Basics of salinity and sodicity effects on soil physical properties. Dep. Land Resour. Environ. Sci. Mont. State Univ.-Bozeman MT 2002, 129, 1–29. [Google Scholar]
  5. Setia, R.; Smith, P.; Marschner, P.; Gottschalk, P.; Baldock, J.; Verma, V.; Setia, D.; Smith, J. Simulation of salinity effects on past, present, and future soil organic carbon stocks. Environ. Sci. Technol. 2012, 46, 1624–1631. [Google Scholar] [CrossRef] [PubMed]
  6. Saviozzi, A.; Cardelli, R.; Di Puccio, R. Impact of salinity on soil biological activities: A laboratory experiment. Commun. Soil Sci. Plant Anal. 2011, 42, 358–367. [Google Scholar] [CrossRef]
  7. Nannipieri, P.; Grego, S.; Ceccanti, B.; Bollag, J.; Stotzky, G. Ecological significance of the biological activity in soil. Soil Biochem. 1990, 293–356. [Google Scholar]
  8. Sharma, G.; Mishra, R. Soil microbial population numbers and enzyme activities in relation to altitude and forest degradation. Soil Biol. Biochem. 1992, 24, 761–767. [Google Scholar]
  9. Xiaobin, W.; Jingfeng, X.; Grant, C.; Bailey, L. Effects of placement of urea with a urease inhibitor on seedling emergence, N uptake and dry matter yield of wheat. Can. J. Plant Sci. 1995, 75, 449–452. [Google Scholar] [CrossRef] [Green Version]
  10. Fitzgerald, J.W. Sulfate ester formation and hydrolysis: A potentially important yet often ignored aspect of the sulfur cycle of aerobic soils. Bacteriol. Rev. 1976, 40, 698–721. [Google Scholar] [CrossRef] [PubMed]
  11. Muthayya, S.; Sugimoto, J.D.; Montgomery, S.; Maberly, G.F. An overview of global rice production, supply, trade, and consumption. Ann. New York Acad. Sci. 2014, 1324, 7–14. [Google Scholar] [CrossRef] [PubMed]
  12. Ghosh, P.K.; Hazra, K.K.; Nath, C.P.; Das, A.; Acharya, C.L. Scope, constraints and challenges of intensifying rice (Oryza sativa) fallows through pulses. Indian J. Agron. 2016, 61, 122–128. [Google Scholar]
  13. Daliakopoulos, I.N.; Tsanis, I.K.; Koutroulis, A.; Kourgialas, N.N.; Varouchakis, A.E.; Karatzas, G.P.; Ritsema, C.J. The threat of soil salinity: A European scale review. Sci. Total Environ. 2016, 573, 727–739. [Google Scholar] [CrossRef] [PubMed]
  14. Ansari, F.A.; Ahmad, I. Isolation, functional characterization and efficacy of biofilm-forming rhizobacteria under abiotic stress conditions. Antonie Van Leeuwenhoek 2019, 112, 1827–1839. [Google Scholar] [CrossRef] [PubMed]
  15. Ma, B.; Gong, J. A meta-analysis of the publicly available bacterial and archaeal sequence diversity in saline soils. World J. Microbiol. Biotechnol. 2013, 29, 2325–2334. [Google Scholar] [CrossRef] [PubMed]
  16. Nautiyal, C.S.; Dion, P. Molecular Mechanisms of Plant and Microbe Coexistence; Springer: Berlin/Heidelberg, Germany, 2008; Volume 15. [Google Scholar]
  17. De Datta, S.K. Principles and Practices of Rice Production; John Wiley & Sons, Inc.: Toronto, ON, Canada, 1981. [Google Scholar]
  18. Senthilkumar, K.; Bindraban, P.S.; Thiyagarajan, T.M.; De Ridder, N.; Giller, K.E. Modified rice cultivation in Tamil Nadu, India: Yield gains and farmers’(lack of) acceptance. Agric. Syst. 2008, 98, 82–94. [Google Scholar] [CrossRef]
  19. Zhao, L.; Wu, L.; Li, Y.; Lu, X.; Zhu, D.; Uphoff, N. Influence of the system of rice intensification on rice yield and nitrogen and water use efficiency with different N application rates. Exp. Agric. 2009, 45, 275–286. [Google Scholar] [CrossRef]
  20. Sinha, S.K.; Talati, J. Productivity impacts of the system of rice intensification (SRI): A case study in West Bengal, India. Agric. Water Manag. 2007, 87, 55–60. [Google Scholar] [CrossRef]
  21. Satyanarayana, A.; Thiyagarajan, T.M.; Uphoff, N. Opportunities for water saving with higher yield from the system of rice intensification. Irrig. Sci. 2007, 25, 99–115. [Google Scholar] [CrossRef]
  22. Stoop, W.A.; Uphoff, N.; Kassam, A. A review of agricultural research issues raised by the system of rice intensification (SRI) from Madagascar: Opportunities for improving farming systems for resource-poor farmers. Agric. Syst. 2002, 71, 249–274. [Google Scholar] [CrossRef]
  23. Uphoff, N. Higher yields with fewer external inputs? The system of rice intensification and potential contributions to agricultural sustainability. Int. J. Agric. Sustain. 2003, 1, 38–50. [Google Scholar] [CrossRef]
  24. Jana, K.; Karmakar, R.; Banerjee, S.; Sana, M.; Goswami, S.; Puste, A.M. Aerobic rice cultivation system: Eco-friendly and water saving technology under changed climate. Agr. Sci. Tech. 2018, 13, 1–5. [Google Scholar]
  25. Bouman, B.A.M.; Peng, S.; Castaneda, A.R.; Visperas, R.M. Yield and water use of irrigated tropical aerobic rice systems. Agric. Water Manag. 2005, 74, 87–105. [Google Scholar] [CrossRef]
  26. Souza, R.C.; Cantão, M.E.; Vasconcelos, A.T.R.; Nogueira, M.A.; Hungria, M. Soil metagenomics reveals differences under conventional and no-tillage with crop rotation or succession. Appl. Soil Ecol. 2013, 72, 49–61. [Google Scholar] [CrossRef]
  27. Chávez-Romero, Y.; Navarro-Noya, Y.E.; Reynoso-Martínez, S.C.; Sarria-Guzmán, Y.; Govaerts, B.; Verhulst, N.; Dendooven, L.; Luna-Guido, M. 16S metagenomics reveals changes in the soil bacterial community driven by soil organic C, N-fertilizer and tillage-crop residue management. Soil Tillage Res. 2016, 159, 1–8. [Google Scholar] [CrossRef]
  28. Imchen, M.; Kumavath, R.; Vaz, A.B.M.; Góes-Neto, A.; Barh, D.; Ghosh, P.; Kozyrovska, N.; Podolich, O.; Azevedo, V. 16S rRNA gene amplicon based metagenomic signatures of rhizobiome community in rice field during various growth stages. Front. Microbiol. 2019, 10, 2103. [Google Scholar] [CrossRef]
  29. Cycil, L.M.; DasSarma, S.; Pecher, W.; McDonald, R.; AbdulSalam, M.; Hasan, F. Metagenomic insights into the diversity of halophilic microorganisms indigenous to the Karak Salt Mine, Pakistan. Front. Microbiol. 2020, 11, 1567. [Google Scholar] [CrossRef]
  30. Jackson, M.L. Soil Chemical Analysis: Advanced Course; Parallel Press: Madison, WI, USA, 1973. [Google Scholar]
  31. Subbiah, B.V.; Bajaj, J.C. A soil test procedure for assessment of available nitrogen in rice soils. Curr. Sci. 1962, 31, 196. [Google Scholar]
  32. Olsen, S.R. Estimation of Available Phosphorus in Soils by Extraction with Sodium Bicarbonate; US Department of Agriculture: Washington, DC, USA, 1954. [Google Scholar]
  33. Stanford, G.; English, L. Use of the flame photometer in rapid soil tests for K and Ca. Agron. J. 1949, 41, 446–447. [Google Scholar] [CrossRef]
  34. Walkley, A.; Black, I.A. An examination of the Degtjareff method for determining soil organic matter, and a proposed modification of the chromic acid titration method. Soil Sci. 1934, 37, 29–38. [Google Scholar] [CrossRef]
  35. Lindsay, W.L.; Norvell, W. Development of a DTPA soil test for zinc, iron, manganese, and copper. Soil Sci. Soc. Am. J. 1978, 42, 421–428. [Google Scholar] [CrossRef]
  36. Casida Jr, L.; Klein, D.; Santoro, T. Soil dehydrogenase activity. Soil Sci. 1964, 98, 371–376. [Google Scholar] [CrossRef]
  37. Tabatabai, M.; Bremner, J. Use of p-nitrophenyl phosphate for assay of soil phosphatase activity. Soil Biol. Biochem. 1969, 1, 301–307. [Google Scholar] [CrossRef]
  38. Tabatabai, M.; Bremner, J. Assay of urease activity in soils. Soil Biol. Biochem. 1972, 4, 479–487. [Google Scholar] [CrossRef]
  39. Elsgaard, L.; Andersen, G.H.; Eriksen, J. Measurement of arylsulphatase activity in agricultural soils using a simplified assay. Soil Biol. Biochem. 2002, 34, 79–82. [Google Scholar] [CrossRef]
  40. Arndt, D.; Xia, J.; Liu, Y.; Zhou, Y.; Guo, A.C.; Cruz, J.A.; Sinelnikov, I.; Budwill, K.; Nesbø, C.L.; Wishart, D.S. METAGENassist: A comprehensive web server for comparative metagenomics. Nucleic Acids Res. 2012, 40, W88–W95. [Google Scholar] [CrossRef] [PubMed]
  41. Canfora, L.; Bacci, G.; Pinzari, F.; Lo Papa, G.; Dazzi, C.; Benedetti, A. Salinity and bacterial diversity: To what extent does the concentration of salt affect the bacterial community in a saline soil? PLoS ONE 2014, 9, e106662. [Google Scholar] [CrossRef] [Green Version]
  42. Fierer, N.; Bradford, M.A.; Jackson, R.B. Toward an ecological classification of soil bacteria. Ecology 2007, 88, 1354–1364. [Google Scholar] [CrossRef]
  43. Edwards, J.; Johnson, C.; Santos-Medellín, C.; Lurie, E.; Podishetty, N.K.; Bhatnagar, S.; Eisen, J.A.; Sundaresan, V. Structure, variation, and assembly of the root-associated microbiomes of rice. Proc. Natl. Acad. Sci. USA 2015, 112, E911–E920. [Google Scholar] [CrossRef] [Green Version]
  44. Rath, K.M.; Fierer, N.; Murphy, D.V.; Rousk, J. Linking bacterial community composition to soil salinity along environmental gradients. ISME J. 2019, 13, 836–846. [Google Scholar] [CrossRef] [Green Version]
  45. Demisie, W.; Liu, Z.; Zhang, M. Effect of biochar on carbon fractions and enzyme activity of red soil. Catena 2014, 121, 214–221. [Google Scholar] [CrossRef]
  46. Schloter, M.; Dilly, O.; Munch, J.C. Indicators for evaluating soil quality. Agric. Ecosyst. Environ. 2003, 98, 255–262. [Google Scholar] [CrossRef]
  47. Sipahutar, M.K.; Piapukiew, J.; Vangnai, A.S. Efficiency of the formulated plant-growth promoting Pseudomonas fluorescens MC46 inoculant on triclocarban treatment in soil and its effect on Vigna radiata growth and soil enzyme activities. J. Hazard. Mater. 2018, 344, 883–892. [Google Scholar] [CrossRef] [PubMed]
  48. Frankenberger Jr, W.; Bingham, F.T. Influence of salinity on soil enzyme activities. Soil Sci. Soc. Am. J. 1982, 46, 1173–1177. [Google Scholar] [CrossRef]
  49. Liu, S.H.; Kang, Y.H. Changes of soil microbial characteristics in saline-sodic soils under drip irrigation. J. Soil Sci. Plant Nutr. 2014, 14, 139–150. [Google Scholar] [CrossRef]
  50. Paul, K.I.; Polglase, P.J.; O’Connell, A.M.; Carlyle, J.C.; Smethurst, P.J.; Khanna, P.K. Defining the relation between soil water content and net nitrogen mineralization. Eur. J. Soil Sci. 2003, 54, 39–48. [Google Scholar] [CrossRef]
  51. Janssen, P.H. Identifying the dominant soil bacterial taxa in libraries of 16S rRNA and 16S rRNA genes. Appl. Environ. Microbiol. 2006, 72, 1719–1728. [Google Scholar] [CrossRef] [Green Version]
  52. Ramette, A. Multivariate analyses in microbial ecology. FEMS Microbiol. Ecol. 2007, 62, 142–160. [Google Scholar] [CrossRef] [Green Version]
  53. Liszka, M.J.; Clark, M.E.; Schneider, E.; Clark, D.S. Nature versus nurture: Developing enzymes that function under extreme conditions. Annu. Rev. Chem. Biomol. Eng. 2012, 3, 77–102. [Google Scholar] [CrossRef] [Green Version]
  54. Fierer, N.; Leff, J.W.; Adams, B.J.; Nielsen, U.N.; Bates, S.T.; Lauber, C.L.; Owens, S.; Gilbert, J.A.; Wall, D.H.; Caporaso, J.G. Cross-biome metagenomic analyses of soil microbial communities and their functional attributes. Proc. Natl. Acad. Sci. USA 2012, 109, 21390–21395. [Google Scholar] [CrossRef] [Green Version]
  55. Barns, S.M.; Takala, S.L.; Kuske, C.R. Wide distribution and diversity of members of the bacterial kingdom Acidobacterium in the environment. Appl. Environ. Microbiol. 1999, 65, 1731–1737. [Google Scholar] [CrossRef] [PubMed] [Green Version]
  56. Foesel, B.U.; Nägele, V.; Naether, A.; Wüst, P.K.; Weinert, J.; Bonkowski, M.; Lohaus, G.; Polle, A.; Alt, F.; Oelmann, Y. Determinants of Acidobacteria activity inferred from the relative abundances of 16S rRNA transcripts in German grassland and forest soils. Environ. Microbiol. 2014, 16, 658–675. [Google Scholar] [CrossRef] [PubMed]
  57. Björnsson, L.; Hugenholtz, P.; Tyson, G.W.; Blackall, L.L. Filamentous Chloroflexi (green non-sulfur bacteria) are abundant in wastewater treatment processes with biological nutrient removalccThe EMBL accession numbers for the sequences reported in this paper are X84472 (strain SBR1029 16S rDNA), X84474 (strain SBR1031 16S rDNA), X84498 (strain SBR1064 16S rDNA), X84565 (strain SBR2022 16S rDNA), X84576 (strain SBR2037 16S rDNA) and X84607 (strain SBR2076 16S rDNA). Microbiology 2002, 148, 2309–2318. [Google Scholar] [PubMed] [Green Version]
  58. Jackson, K.L.; Whitcraft, C.R.; Dillon, J.G. Diversity of Desulfobacteriaceae and overall activity of sulfate-reducing microorganisms in and around a salt pan in a southern California coastal wetland. Wetlands 2014, 34, 969–977. [Google Scholar] [CrossRef]
  59. Purkhold, U.; Pommerening-Röser, A.; Juretschko, S.; Schmid, M.C.; Koops, H.-P.; Wagner, M. Phylogeny of all recognized species of ammonia oxidizers based on comparative 16S rRNA and amoA sequence analysis: Implications for molecular diversity surveys. Appl. Environ. Microbiol. 2000, 66, 5368–5382. [Google Scholar] [CrossRef] [Green Version]
  60. Liang, B.; Wang, L.-Y.; Mbadinga, S.M.; Liu, J.-F.; Yang, S.-Z.; Gu, J.-D.; Mu, B.-Z. Anaerolineaceae and Methanosaeta turned to be the dominant microorganisms in alkanes-dependent methanogenic culture after long-term of incubation. Amb Express 2015, 5, 37. [Google Scholar] [CrossRef]
  61. Belimov, A.A.; Safronova, V.I.; Sergeyeva, T.A.; Egorova, T.N.; Matveyeva, V.A.; Tsyganov, V.E.; Borisov, A.Y.; Tikhonovich, I.A.; Kluge, C.; Preisfeld, A. Characterization of plant growth promoting rhizobacteria isolated from polluted soils and containing 1-aminocyclopropane-1-carboxylate deaminase. Can. J. Microbiol. 2001, 47, 642–652. [Google Scholar] [CrossRef] [PubMed]
  62. Zhang, H.; Sun, Y.; Xie, X.; Kim, M.S.; Dowd, S.E.; Paré, P.W. A soil bacterium regulates plant acquisition of iron via deficiency-inducible mechanisms. Plant J. 2009, 58, 568–577. [Google Scholar] [CrossRef]
  63. Li, D.-M.; Alexander, M. Co-inoculation with antibiotic-producing bacteria to increase colonization and nodulation by rhizobia. Plant Soil 1988, 108, 211–219. [Google Scholar]
  64. Nimnoi, P.; Pongsilp, N.; Lumyong, S. Co-inoculation of soybean (Glycine max) with actinomycetes and Bradyrhizobium japonicum enhances plant growth, nitrogenase activity and plant nutrition. J. Plant Nutr. 2014, 37, 432–446. [Google Scholar] [CrossRef]
  65. Li, Z.; Ye, X.; Chen, P.; Ji, K.; Zhou, J.; Wang, F.; Dong, W.; Huang, Y.; Zhang, Z.; Cui, Z. Antifungal potential of Corallococcus sp. strain EGB against plant pathogenic fungi. Biol. Control 2017, 110, 10–17. [Google Scholar] [CrossRef]
  66. Hesse, C.; Schulz, F.; Bull, C.T.; Shaffer, B.T.; Yan, Q.; Shapiro, N.; Hassan, K.A.; Varghese, N.; Elbourne, L.D.H.; Paulsen, I.T. Genome-based evolutionary history of Pseudomonas spp. Environ. Microbiol. 2018, 20, 2142–2159. [Google Scholar] [CrossRef] [PubMed]
  67. Muleta, D.; Assefa, F.; Hjort, K.; Roos, S.; Granhall, U. Characterization of Rhizobacteria isolated from Wild Coffea arabica L. Eng. Life Sci. 2009, 9, 100–108. [Google Scholar] [CrossRef]
  68. Podile, A.R.; Kishore, G.K. Plant growth-promoting rhizobacteria. In Plant-Associated Bacteria; Springer: Dordrecht, The Netherlands, 2007; pp. 195–230. [Google Scholar]
  69. Teske, A.; Dhillon, A.; Sogin, M.L. Genomic markers of ancient anaerobic microbial pathways: Sulfate reduction, methanogenesis, and methane oxidation. Biol. Bull. 2003, 204, 186–191. [Google Scholar] [CrossRef] [PubMed]
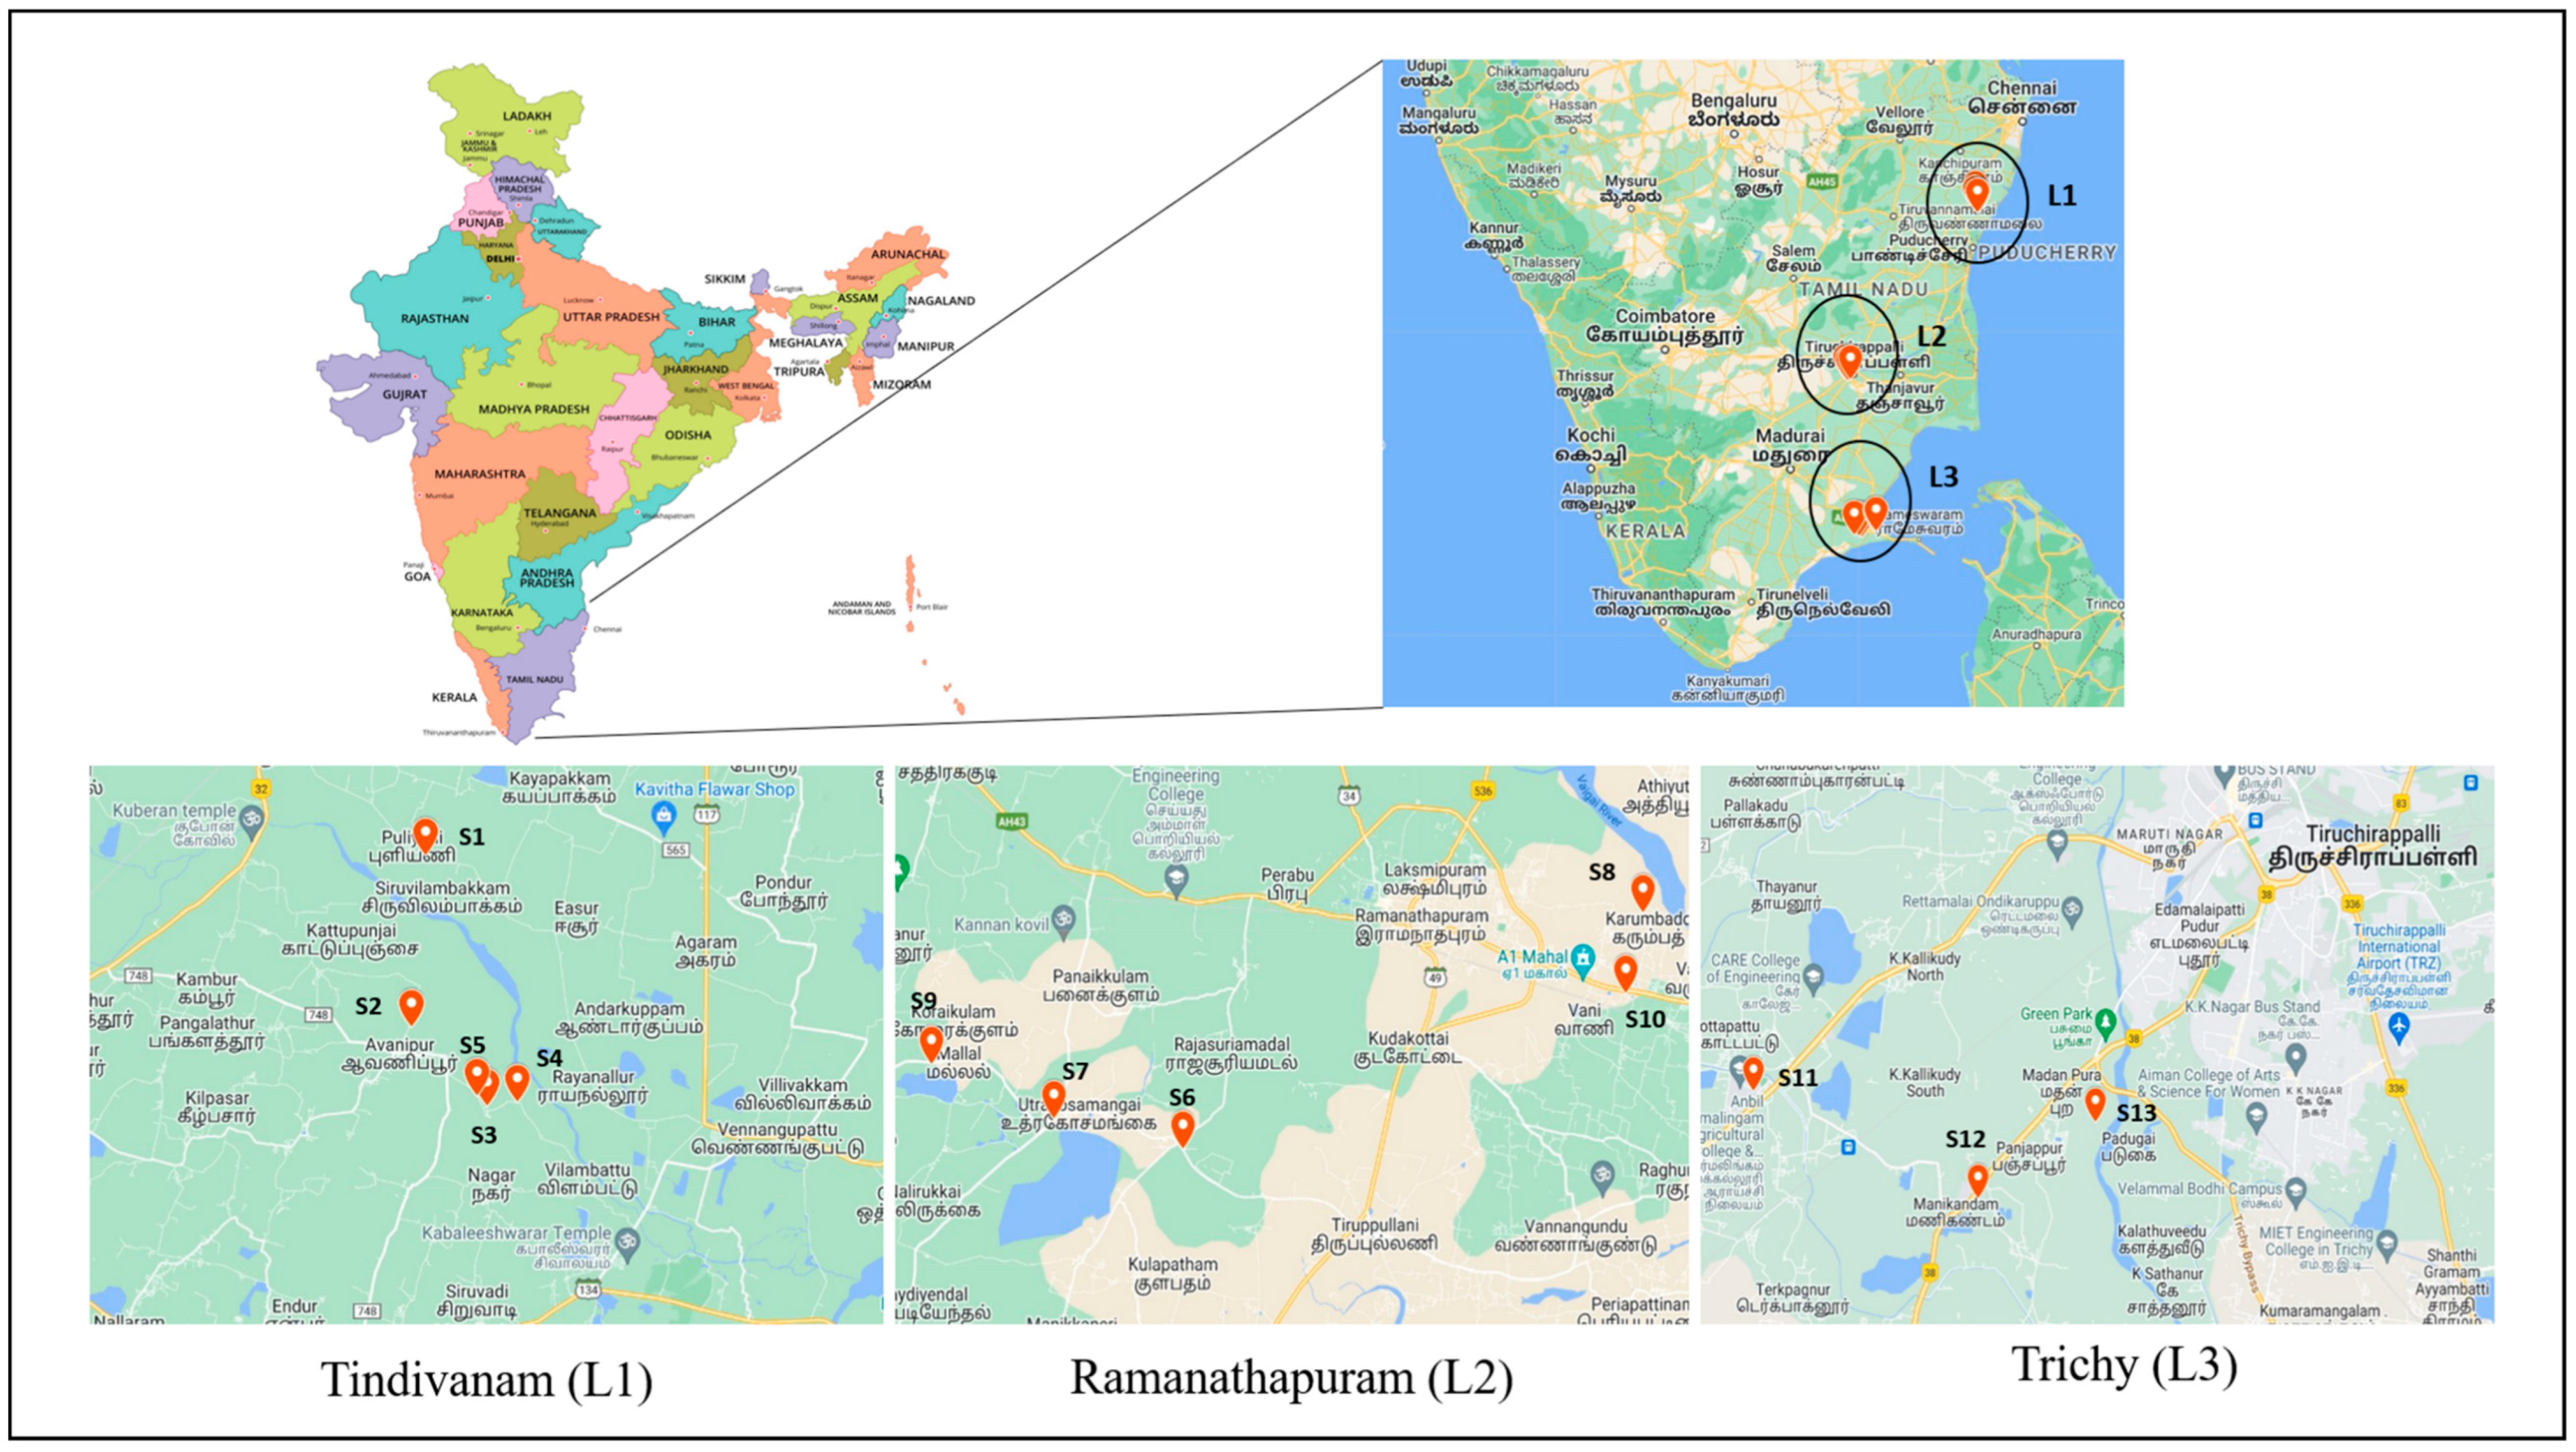
Figure 1. Map showing the sampling point of soil samples from three different districts of Tamil Nadu, India.
Agriculture 12 01624 g001
Figure 2. Principal Component Analysis (PCA) biplot representing different environmental factors of the soil of different rice planting systems. Active observations represent soil samples from 13 different locations. S1–S13 represents the thirteen soil samples collected from different locations.
Agriculture 12 01624 g002
Figure 3. Taxonomic composition and relative abundance of the bacterial phylum of three different types of rice planting systems.
Agriculture 12 01624 g003
Figure 4. Two-dimensional (left side) and three-dimensional (right side) dot plot represents the beta diversity index of different types of rice planting systems.
Agriculture 12 01624 g004
Figure 5. Heat map showing the core bacterial microbiome of rice rhizosphere soil of three different rice planting systems under saline conditions.
Agriculture 12 01624 g005
Figure 6. KEGG analysis of rice rhizosphere soil of three different rice planting systems.
Agriculture 12 01624 g006
Table 1. Collection of soil samples from rice fields of salt-affected areas from three different districts of Tamil Nadu.
Soil Sample No.DistrictRice CultivarPlanting SystemGPRS
Co-Ordinates
S1Tindivanam (L1)ADT 39ConventionalN 12.28324°
E 079.821620°
S2Tindivanam (L1)ADT 37SRIN 12.28404°
E 079.82057°
S3Tindivanam (L1)ADT 39ConventionalN 12.26342°
E 079.84108°
S4Tindivanam (L1)BPT 5204ConventionalN 12.26443°
E 079.84918°
S5Tindivanam (L1)NLR 34449ConventionalN 12.26608°
E 079.83827°
S6Ramanathapuram (L2)Co51ConventionalN 09.30568°
E 078.77067°
S7Ramanathapuram (L2)Anna 4AerobicN 09.31370°
E 078.73357°
S8Ramanathapuram (L2)Co51ConventionalN 09.36709°
E 078.90277°
S9Ramanathapuram (L2)Co51ConventionalN 09.32794°
E 078.69864°
S10Ramanathapuram (L2)Co51ConventionalN 09.34616°
E 078.89782°
S11Trichy (L3)TRY 2SRIN 10.75521°
E 078.60307°
S12Trichy (L3)Co51ConventionalN 10.73981°
E 078.63986°
S13Trichy (L3)ADT 36ConventionalN 10.75083°
E 078.65900°
Table 2. Analyses of the physicochemical and biological properties of the saline soil samples collected from the rice rhizosphere.
Soil Sample No.pHE.C
(dSm−1)
Nitrogen
(Kg ha−1)
Phosphorus (Kg ha−1)Potassium
(Kg ha−1)
Organic Carbon (%)Soil Dehydrogenase (µg Triphenyl Formazan
g−1 h−1)
Alkaline Phosphatase Activity (Phenol µg g−1 h−1)Urease Activity (µg NH4-N g−1 h−1)Arylsulphatase Activity (µg p Nitrophenol g−1 h−1)
17.1 ± 0.216.25 ± 0.05139.24 ± 6.5316.9 ± 0.1277.6 ± 1.160.64 ± 0.020.84 ± 0.044 f0.9 ± 0.038 g56 ± 1.283 e10.8 ± 0.469 f
27.5 ± 0.217.84 ± 0.12145.92 ± 0.5917.7 ± 0.7584.9 ± 4.060.72 ± 0.031.03 ± 0.002 e4.04 ± 0.204 e56 ± 2.351 e17.6 ± 0.247 d
37.7 ± 0.396.96 ± 0.26176.38 ± 1.0721.2 ± 0.1479.6 ± 3.50.68 ± 0.010.36 ± 0.016 h0.26 ± 0.012 h112 ± 4.104 c19.9 ± 0.371 c
47.8 ± 0.117.59 ± 0.2157.46 ± 3.4919.4 ± 0.8574.2 ± 2.740.87 ± 0.030.97 ± 0.008 e0.35 ± 0.09 h70 ± 0.204 d13.4 ± 0.093 e
57.6 ± 0.088.06 ± 0.42159.87 ± 5.6417.6 ± 0.6282.1 ± 2.380.84 ± 0.010.99 ± 0.028 e5.34 ± 0.012 d70 ± 0.353 d20.3 ± 0.118 bc
67.2 ± 0.098.43 ± 0.38164.25 ± 1.0921.7 ± 0.23102.5 ± 3.130.76 ± 0.011.44 ± 0.022 c7.69 ± 0.103 c224 ± 7.538 a21.5 ± 0.996 b
76.7 ± 0.337.82 ± 0.36168.64 ± 0.0820.5 ± 0.0485.6 ± 3.210.62 ± 0.031.53 ± 0.068 b10.81 ± 0.216 a140 ± 6.475 b14.5 ± 0.430 e
86.8 ± 0.147.46 ± 0.04140.78 ± 3.0116.8 ± 0.183.5 ± 0.750.81 ± 0.010.67 ± 0.021 g0.31 ± 0.08 h112 ± 1.741 c7.5 ± 0.292 gh
97 ± 0.148.22 ± 0.32157.88 ± 1.4815.2 ± 0.3298.7 ± 4.50.85 ± 0.020.78 ± 0.040 f0.42 ± 0.014 gh112 ± 3.972 c8.8 ± 0.146 g
106.6 ± 0.317.81 ± 0.25143.28 ± 6.3118.8 ± 0.0892.4 ± 2.110.74 ± 0.010.38 ± 0.012 h0.54 ± 0.003 gh112 ± 1.179 c7.1 ± 0.047 h
117.2 ± 0.085.67 ± 0.08275.98 ± 3.4128.7 ± 1.04105.3 ± 2.670.69 ± 0.012.1 ± 0.084 a9.35 ± 0.253 b224 ± 8.137 a23.6 ± 0.745 a
127 ± 0.064.59 ± 0.15191.43 ± 5.3726.1 ± 0.66101.7 ± 1.470.76 ± 0.021.16 ± 0.037 d2.16 ± 0.005 f56 ± 0.644 e16.5 ± 0.339 d
137.6 ± 0.344.94 ± 0.02288.64 ± 11.1225.3 ± 1.1999.4 ± 3.810.84 ± 0.021.12 ± 0.001 d0.75 ± 0.024 gh56 ± 2.140 e17.4 ± 0.652 d
Values in each column are the mean of three replications ± SE (standard error). Mean values in each column followed by the same letter(s) are not significantly different at 5% level.
Table 3. Estimators of number of reads, observed OTUs and GC content of soil samples of different planting systems.
Soil SampleRaw ReadsQuality Filtered ReadsNo. of
OTU’S
GC
Content (%)
A1289,490288,41029,84657.5
A2275,378274,15827,53757.5
A3406,084304,29033,97257.5
C1278,482277,17441,48256
C2262,030260,67831,51256.5
C3247,480244,15230,18657.5
S1254,354252,48829,07258
S2244,802243,72426,71359
S3258,600256,73023,12758
Total2,516,7002,401,804273,447
A1, A2, A3—Soil sample from aerobic planting system (Sample 7). C1, C2, C3—Soil sample from conventional planting system (Sample 6). S1, S2, S3—Soil sample from SRI planting system (Sample 11).
Table 4. Bacterial diversity indices of soil samples of different planting systems.
Chao1 *ShannonSimpsonFisher *
Aerobic169.34 ± 3.2 ab3.8 ± 0.030.961 ± 0.0125.5 ± 0.78 b
Conventional182 ± 2.1 ab4.01 ± 0.10.963 ± 0.0128.17 ± 0.41 a
SRI189.67 ± 6.2 a4.05 ± 0.060.97 ± 0.0128.5 ± 0.18 a
p value0.0380.0710.3140.012
Values in each column are the mean of three replications. Tukey’s test was calculated at p < 0.05 to find the significance of the treatments. ± followed by numbers are standard error. (*) indicated the presence of significant differences between the soil samples. The means sharing the same letters in each column were not significantly different as determined by the Tukey test (p < 0.05).
Publisher’s Note: MDPI stays neutral with regard to jurisdictional claims in published maps and institutional affiliations.