Article

Assessment of Genetic Diversity of the Medicinal and Aromatic Crop, Amomum tsao-ko, Using PAAP and CDDP Markers

1
Key Laboratory for Research and Utilization of Characteristic Biological Resources in Southern Yunnan, Honghe University, Mengzi 661199, China
2
College of Biological and Agricultural Sciences, Honghe University, Mengzi 661199, China
*
Author to whom correspondence should be addressed.
Agriculture 2022, 12(10), 1536; https://doi.org/10.3390/agriculture12101536
Submission received: 17 August 2022 / Revised: 13 September 2022 / Accepted: 19 September 2022 / Published: 23 September 2022
(This article belongs to the Special Issue Genetic Diversity of Medicinal and Aromatic Crop)

Abstract

:
Amomum tsao-ko (Zingiberaceae) is a well-known medicinal and aromatic crop with a long history of cultivation in China. Food and pharmaceutical industries widely use its dried ripe fruit. In this study, 12 promoter anchored amplified polymorphism (PAAP) primer pairs and 12 conserved DNA-derived polymorphism (CDDP) primers were used to assess the genetic diversity and population structure of 96 A. tsao-ko accessions from eight cultivated populations. A total of 98 polymorphic loci were detected by 12 PAAP primers with 8.167 polymorphic loci per primer, and 203 polymorphic loci were observed using 12 CDDP primers with 16.92 alleles per primer. Nei’s gene diversity (PAAP, H = 0.207; CDDP, H = 0.188) and Shannon’s information index (PAAP, I = 0.329; CDDP, I = 0.305) revealed the relatively high level of genetic diversity in these populations of A. tsao-ko. The genetic differentiation coefficient (Gst) for the populations was 0.151 (PAAP) and 0.128 (CDDP), which indicated that 84.9% and 87.2%, respectively, of the genetic variation was within populations. Analysis of molecular variance (AMOVA) also revealed that genetic differentiation of the A. tsao-ko populations mainly occurred within populations (91% variation within populations for both PAAP and CDDP). Genetic identity among the investigated populations was high for PAAP (0.957) and CDDP (0.967). Cluster and principal coordinate analysis (PCoA) grouped the 96 A. tsao-ko accessions into two major groups. Accession classification was consistent with population structure analysis. Overall, these results will be useful for A. tsao-ko germplasm resource characterization, conservation, and utilization.

1. Introduction

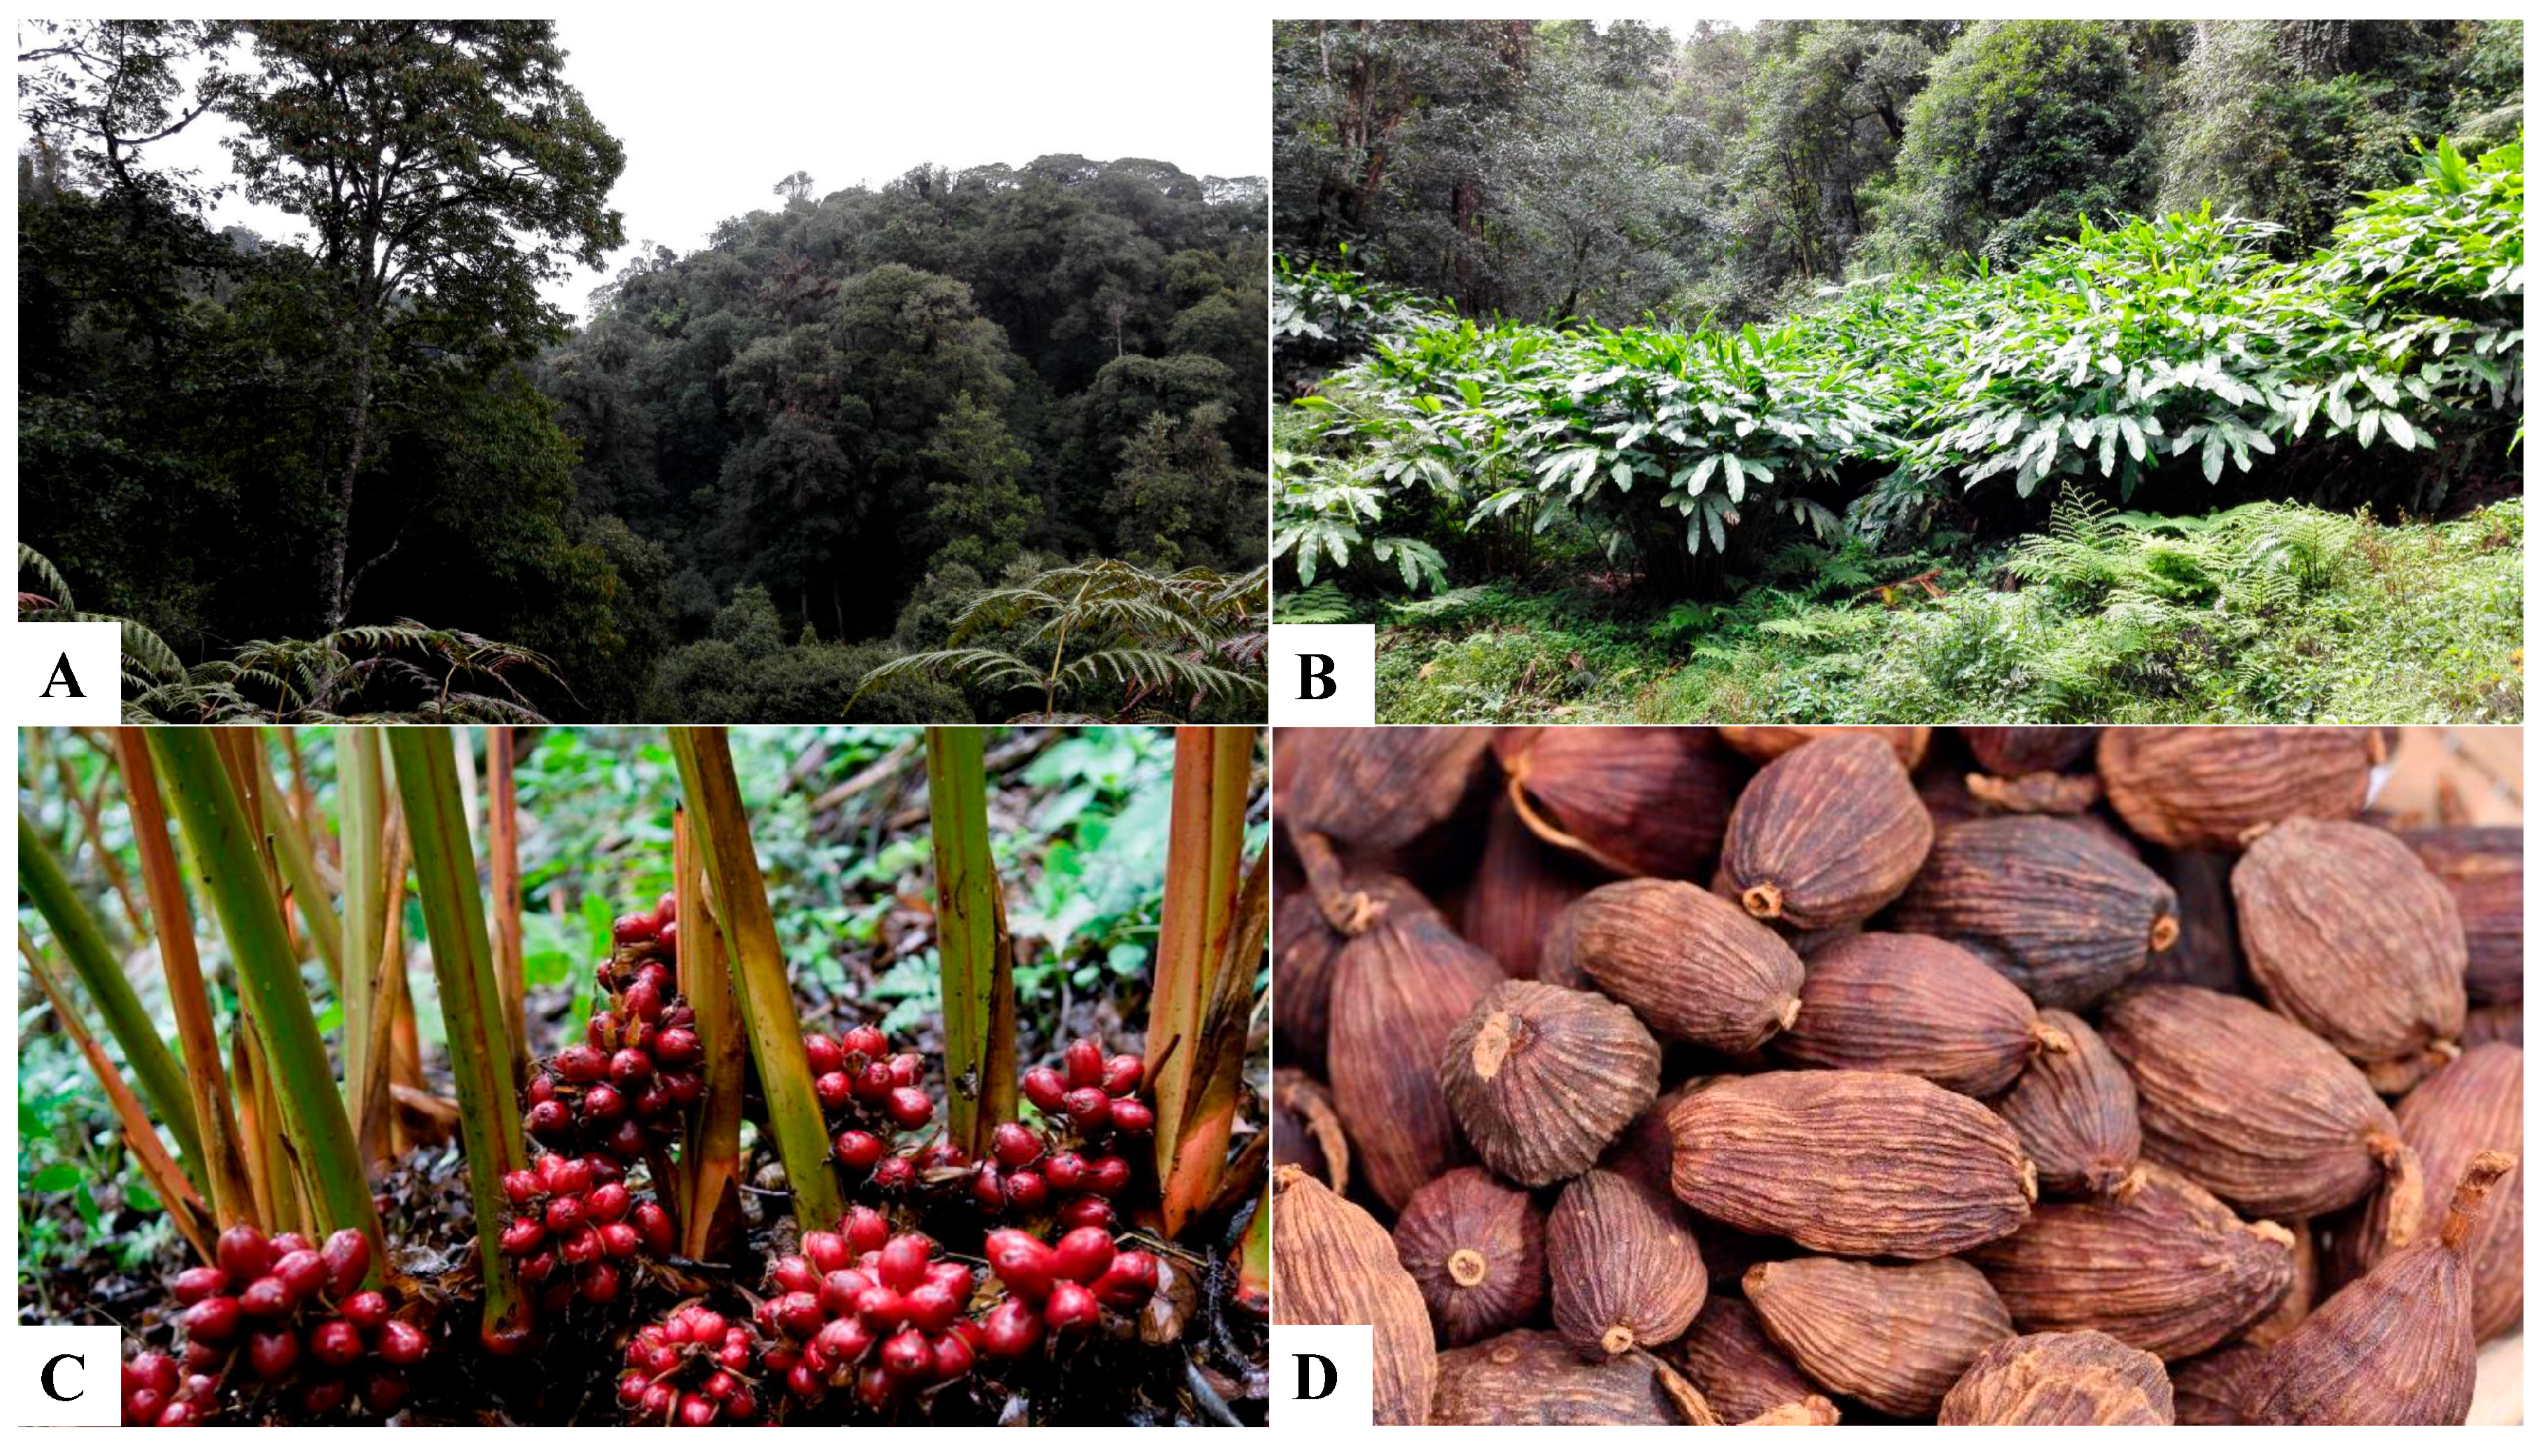
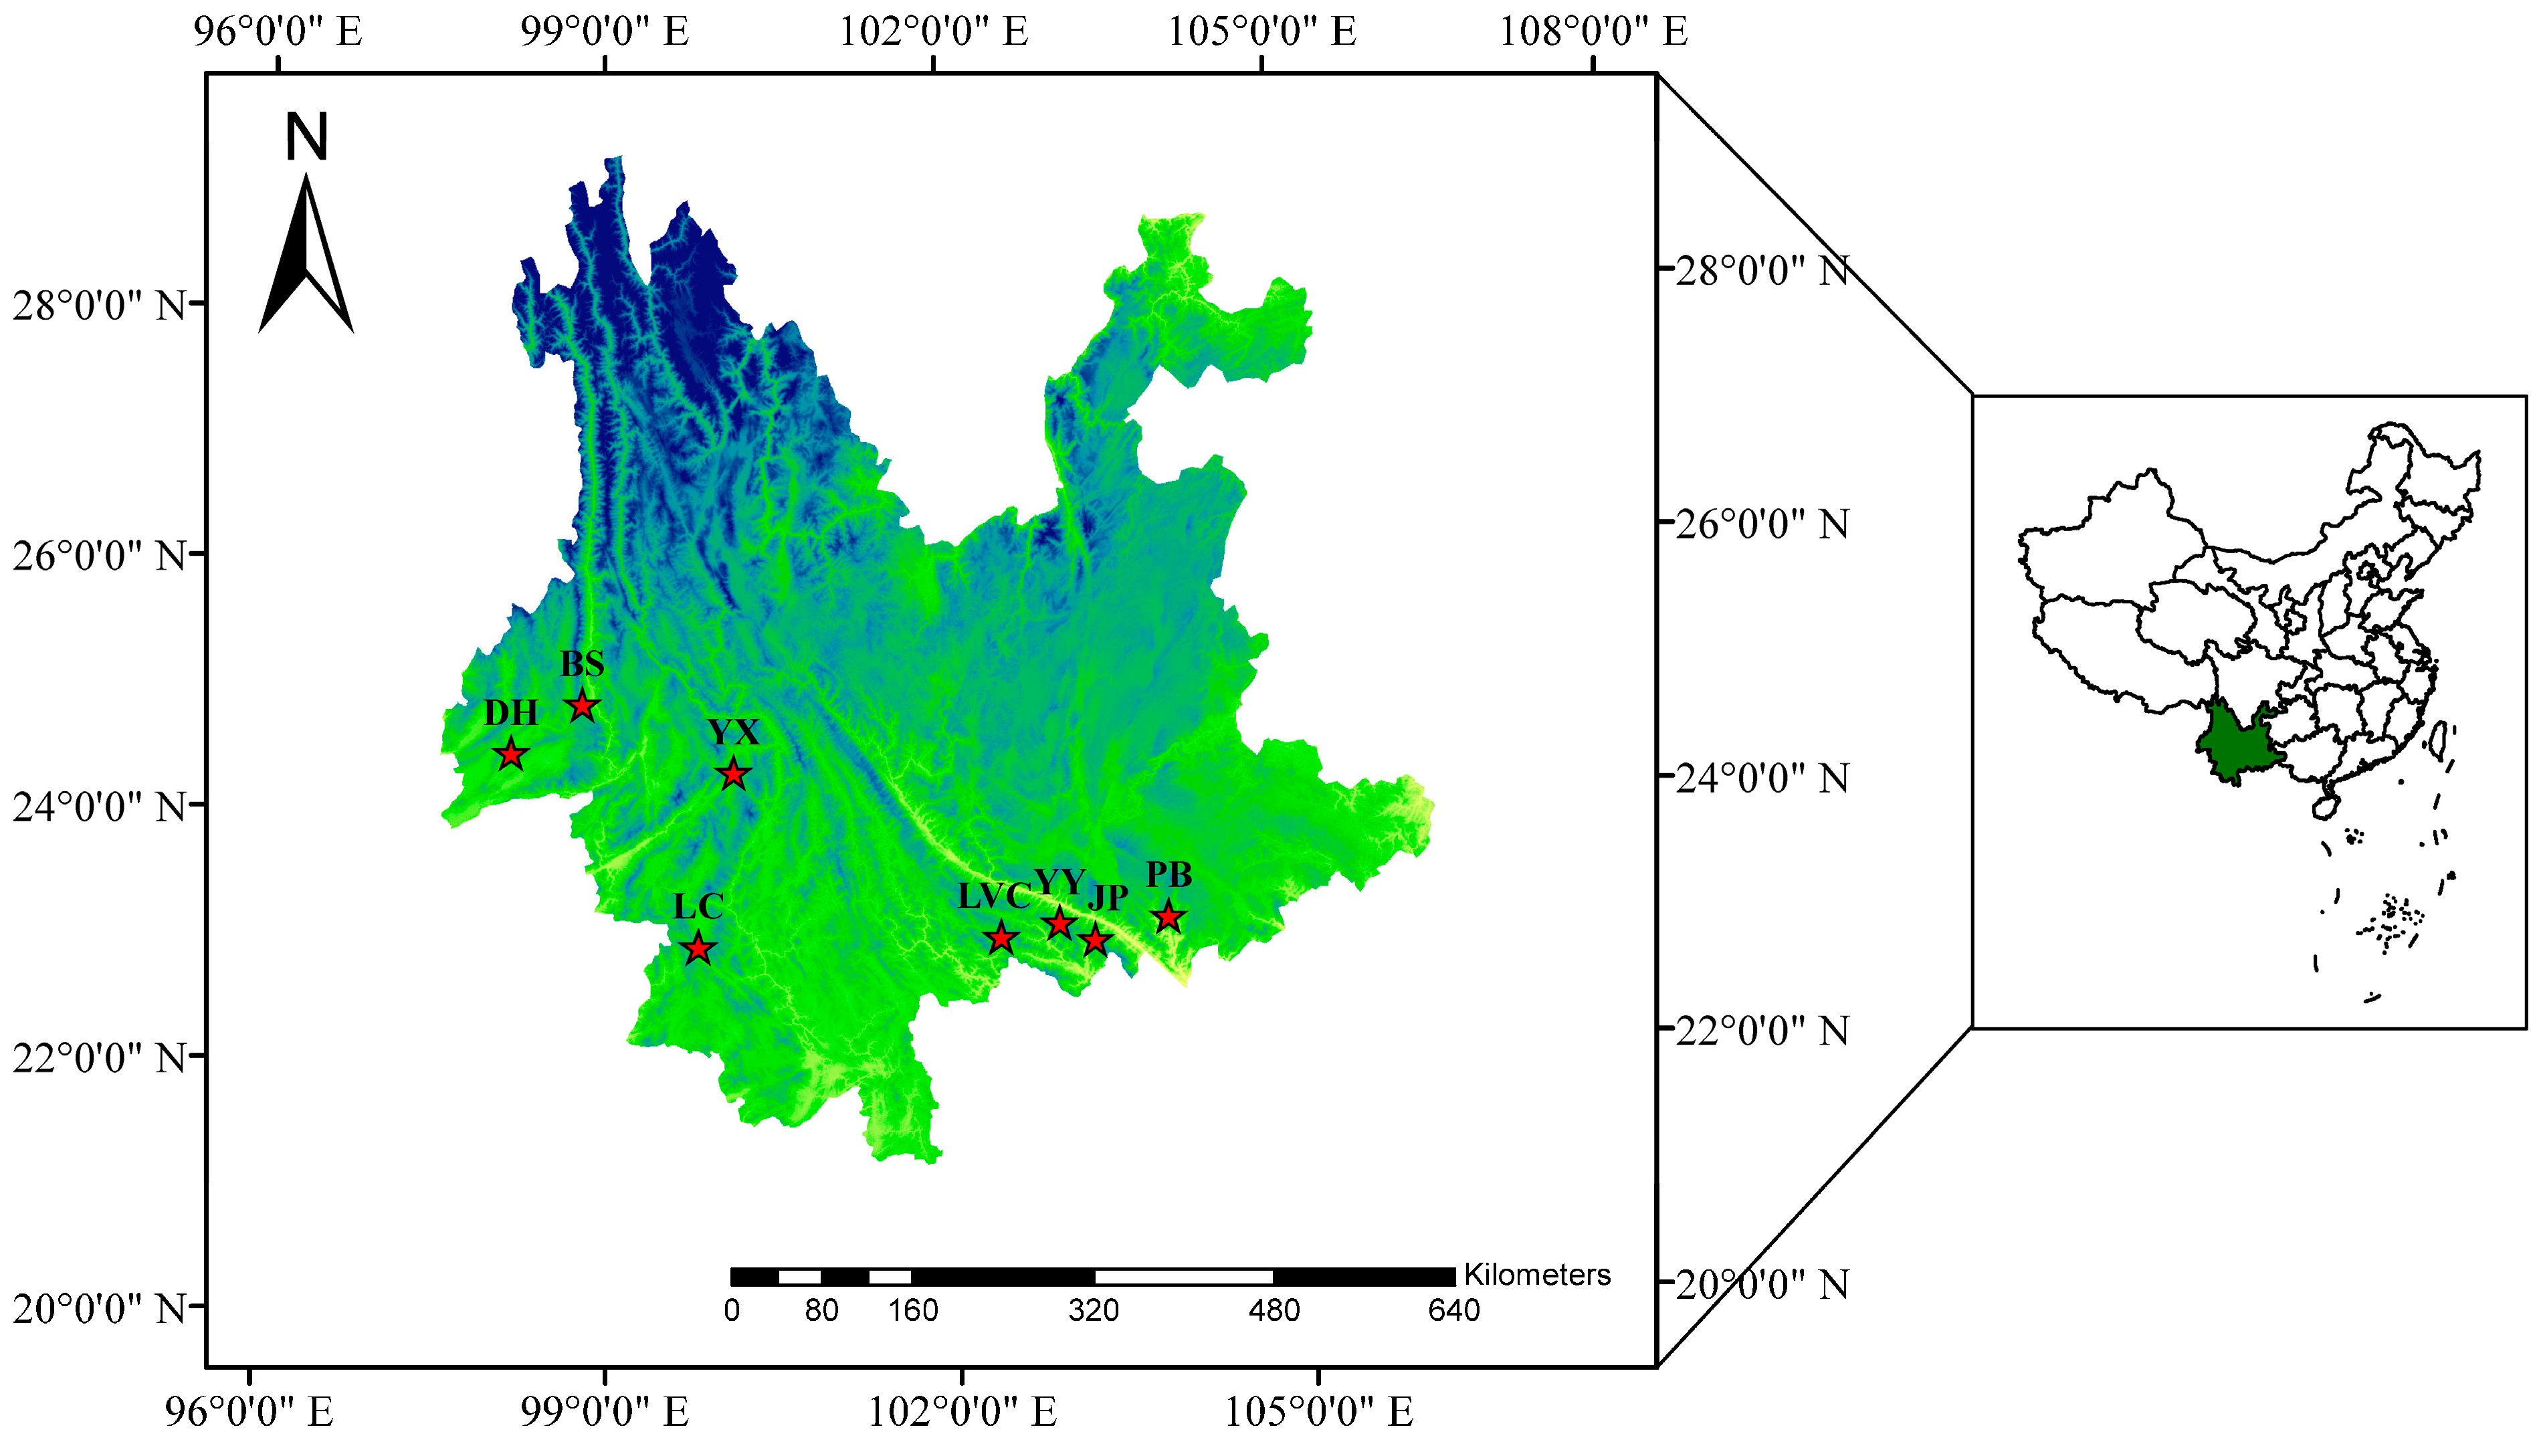
Amomum tsao-ko (2n = 4x = 48) is a medicinal and aromatic plant of the Zingiberaceae family, mainly distributed in the high-altitude mountains (1100 to 1800 m above sea level) of southern Yunnan, China and northern Vietnam and Laos (Figure 1) [1]. The ripe fruit of A. tsao-ko (also called Cao-Guo in China) is a commonly used Chinese herbal medicine for aromatizing dampness in clinical practice [2]. Pharmacological studies have shown that it has anti-oxidation [3], antibacterial [4], anti-inflammation [5], antidiabetic [6], anti-tumor [7], and anticonvulsant properties [8]. In addition, A. tsao-ko has a strong spicy and herbal fragrance, which can remove the unpleasant smell of meat ingredients and increase people’s appetite. It is an important condiment in countries such as China, South Korea, and Japan and is known as “one of the five spices” of food seasoning [9]. As an aromatic Chinese herbal medicine used for both medicinal and edible purposes, essential oil is the most important active ingredient of A. tsao-ko, and its content determines the quality of A. tsao-ko (Pharmacopoeia of the People’s Republic of China, 2020).
Molecular marker technology is widely used in genetic diversity analysis, germplasm resource identification, and molecular marker-assisted breeding [10]. Random amplified polymorphic DNA (RAPD), simple sequence repeat (SSR), inter-simple sequence repeats (ISSR), and amplified fragment length polymorphism (AFLP) are the four most widely used molecular markers [11]. However, they are all random DNA molecular markers and are not usually located in gene regions, which limits their application. Targeted molecular marker technology is a new approach that is the result of in-depth development of functional genomics and large-scale sequencing [12]. Amplification of functional regions or regulatory regions is biased towards generating candidate functional markers, and the resulting markers may be part of a target gene or closely linked to a target gene. This technology can be used across different species and requires little or no genomic sequence information, which has attracted increasing attention from researchers [13].
Promoter anchored amplified polymorphism (PAAP) based on RAPD markers is a novel dominant DNA marker technology that specifically targets the regulatory regions of a plant genome [14]. PAAP molecular marker technology uses two primers for PCR amplification, including a 10 nucleotide-long RAPD primer and a 10 nucleotide-long degenerate promoter primer based on conserved core promoter sequences. This marker system can be used to identify and map promoter regions throughout the genome. At present, this approach has been successfully applied in genetic analysis of cotton [14,15], foxtail millet [16], soybean [17], and other crops. The dominant molecular marker method of conserved DNA-derived polymorphism (CDDP) provides rapid identification of different species by designing primers based on the conserved amino acid sequences of functional genes and gene families in plants [18]. The amplified fragment from CDDP may be part of the target gene or closely linked to the gene, so CDDP markers have obvious advantages over random markers in the evaluation of plant genetic diversity and quantitative trait locus (QTL) mapping. CDDP markers have been successfully used for genetic diversity analysis of plant germplasm resources such as Salix taishanensis [19], Chrysanthemum morifolium [20], Musa [21], and Pistacia vera L. [22].
As an important medicinal and aromatic crop, previous studies of A. tsao-ko mainly focused on chemical components and pharmacological studies [2]. However, assessment of the genetic diversity of A. tsao-ko is lacking, which limits the selection of desirable germplasm and breeding of A. tsao-ko. Recently, we have conducted several studies of the genetic diversity of A. tsao-ko, including phenotypic analysis [23] and RAPD [24], ISSR [25], SRAP [25], and SSR [1] molecular marker analyses. Compared with dominant markers such as RAPD and ISSR, the primer sequences of PAAP and CDDP markers are specially designed for the regulatory elements and conserved sequences of plant functional genes, and can effectively generate functional molecular markers linked to target traits. It has important application value in genetic studies of plants without reference genomes. However, to our knowledge, the utility of PAAP and CDDP markers for genetic diversity assessment in A. tsao-ko has not yet been reported. In this study, PAAP and CDDP primers were screened, and 96 germplasms collected from eight populations of A. tsao-ko were amplified to reveal polymorphisms of these two markers in the germplasm and to determine the genetic diversity and population structure of these germplasm resources. In addition, the utility of the two marker types were compared. Our aims were to provide the theoretical basis for the application of PAAP and CDDP technology in the evaluation of A. tsao-ko germplasm.

2. Materials and Methods

2.1. Plant Materials

A total of 96 A. tsao-ko accessions were collected from eight different locations in Yunnan Province, China during October 2016. During sampling, the linear distance between samples within the same population was at least 50 m. Information on sampling points is shown in Figure 2 and Table 1.

2.2. DNA Extraction

Genomic DNA was extracted from the young leaves of 96 A. tsao-ko accessions using a modified cetyltrimethyl-ammonium bromide (CTAB) method [26]. The quantity and quality of DNA were measured by UV spectrophotometer (NanoDrop Technologies Inc., Wilmington, DE, USA) at 260/280 nm, and the extraction quality was evaluated by 0.8% agarose gel electrophoresis. Finally, the DNA was diluted to a concentration of 20 ng/μL.

2.3. PCR Amplifcation

Based on Pang et al. [14], four promoter primers and three RAPD primers were used to generate 12 PAAP primer combinations; the sequences of the primers are listed in Table 2. PAAP-PCR reactions consisted of 25-μL reactions, which contained the following: 10× Taq Buffer (Mg2+ plus), 5.5 μL; DNA template, approximately 60 ng; primer pair, 1 μM; dNTPs, 0.25 mM; Taq DNA polymerase, 1.25 U. The PCR reaction protocol was 94 °C, pre-denaturation for 5 min; 45 cycles of denaturation at 94 °C for 45 s, annealing at 40 °C for 30 s, and extension at 72 °C for 1.5 min; the final extension was at 72 °C for 5 min.
From the 21 CDDP primers of Collard and Mackill [18], 12 CDDP primers with clear bands, stable amplification, and high polymorphism were selected for this study; the selected primer sequences are shown in Table 3. The 25-μL PCR reactions contained: 10× Taq Buffer (Mg2+ plus), 5.5 μL; DNA template, approximately 60 ng; primer pair, 1 μM; dNTPs, 0.25 mM; Taq DNA polymerase, 1.25 U; and ddH2O, 14 μL. The PCR amplification protocol was: 94 °C pre-denaturation for 5 min; 35 cycles of 94 °C denaturation for 1 min, 50 °C annealing for 1 min, and 72 °C extension for 2 min; and 72 °C extension for 5 min.
The primers used were synthesized by Beijing Liuhe Huada Gene Technology Co., Ltd. PCR reactions were performed on an Eastwin PCR machine (ETC811), and the amplification products of PAAP and CDDP were separated in 5% non-denaturing polyacrylamide gels, silver-stained, and photographed.

2.4. Data Analysis

PAAP and CDDP polymorphic bands were scored as “1” or “0” for presence or absence of the band, respectively, and binary (0, 1) data matrices were generated for each primer set. Microsoft Excel software (Microsoft Excel 2016, Microsoft Corporation, Washington, DC, USA) was used to count the number of amplified bands (B), the number of polymorphic bands (PB), the polymorphism ratio (PR), the polymorphism information content (PIC), and the resolving power (RP) of each primer. PIC was calculated using the formula provided in Roldán-Ruiz et al. [27]. RP was calculated as Rp = ∑Ib, where Ib = 1 − (2 × |0.5 − p|) and “p” is the proportion of genotypes containing the band [28]. Other genetic diversity parameters of the A. tsao-ko populations were estimated using POPGENE v1.32 software [29]. The molecular analysis of variance (AMOVA), population genetic identity, and principle coordinate analysis (PCoA) were performed with GenALEx v6.502 [30]. Unweighted pair-group method with arithmetic mean (UPGMA) cluster analysis based on the genetic similarity coefficient was performed using NTSYS-pc v2.1 software [31]. Population structure of the 96 A. tsao-ko accessions was analyzed using the software STRUCTURE v2.3.4 [32], K were done from 2 to 11 in 5 independent runs, and the iteration parameters of burn-in period and Markov Chain Monte Carlo (MCMC) were both set to 10,000. The optimal number of population clusters (K) was determined using delta K criteria and was calculated using the online program Structure Harvester [33]. Visualization of the population structure was created by POPHELPER (http://pophelper.com/) [34].

3. Results

3.1. Polymorphism Analysis

In the PAAP analysis, each primer pair could amplify 3 (PAAP4) to 20 (PAAP1) DNA fragments, with a mean of 8.583 fragments (Table 2, Figure 3A). A total of 103 bands were amplified from 12 PAAP primers, of which 98 were polymorphic. The polymorphism ratio (PR) was 89.09%, and the mean polymorphism information (PIC) and resolving power (RP) were 0.214 and 2.870, respectively. In the CDDP analysis, each primer could amplify 9 (KNOX2) to 22 (ABP1-1 and WRKY-R2B) DNA fragments, with a mean of 17.00 fragments (Table 3, Figure 3B). A total of 204 bands were amplified using 12 CDDP primers; 203 were polymorphic. The PR was 99.48%, and the mean PIC and RP were 0.240 and 5.909, respectively. The results showed that both PAAP and CDDP markers can effectively reveal polymorphisms between accessions, but the level of polymorphism differed between the two types of markers. The mean PR, PIC, and RP of the amplified products from CDDP were slightly higher than those of the PAAP markers.

3.2. Genetic Diversity

Results from the PAAP markers (Table 4) showed that the total Nei’s gene diversity (H) of the eight A. tsao-ko populations was 0.207, and the Shannon’s information index (I) was 0.329. The polymorphism ratio (PR) in the eight A. tsao-ko populations ranged from 53.40% (YY) to 65.05% (JP) with a mean of 60.56%; H was between 0.150 (YY) and 0.198 (PB) with a mean of 0.177; I ranged from 0.233 (YY) to 0.299 (PB) with a mean of 0.272. The CDDP analyses (Table 5) showed that the PR of each population ranged from 55.39% (BS) to 74.02% (LC) with a mean of 62.32%; the H of each population ranged from 0.157 (PB) to 0.175 (LC) with a mean of 0.164; I ranged from 0.247 (PB) to 0.282 (LC) with a mean of 0.259. Taking into account all the indicators, the genetic diversity of A. tsao-ko at the species level was high. The genetic diversity of the JP, LVC, and LC populations was relatively high, while the genetic diversity of the YY and BS populations was relatively low.

3.3. Genetic Differentiation in Populations

For PAAP markers, total genetic diversity (Ht), genetic diversity within populations (Hs), genetic differentiation among populations (Gst), and gene flow (Nm) of the eight populations were 0.208, 0.177, 0.151, and 2.815, respectively. The results revealed that Gst was 15.10 % among populations and 84.90 % within populations. For CDDP markers, Ht, Hs, Gst, and Nm of the eight populations were 0.188, 0.164, 0.128, and 3.412, respectively. Both types of molecular markers indicated that most genetic variation occurred within populations rather than among the A. tsao-ko populations. AMOVA also indicated that most of the genetic variation was found within populations (91%) (Table 6 and Figure 4).

3.4. Genetic Identity Analysis of A. tsao-ko Populations

Nei’s genetic identity (GI) between pairs of populations using PAAP markers varied from 0.930 to 0.980 with a mean of 0.957 (Table 7). The smallest GI was between YY and YX, and the largest was between PB and LVC. For the CDDP analysis, pairwise GI values ranged from 0.952 (PB and BS, PB and DH) to 0.982 (PB and LVC). The UPGMA dendrogram based on pairwise GI from the PAAP analysis indicated that the eight populations were grouped into 2 clusters (Figure 5A). The first group contained JP, PB, LVC, YY, LC, and DH. The second group consisted of YX and BS. A dendrogram (Figure 5B), created using the CDDP data, also grouped the eight populations into two clusters. The first group contained JP, PB, and LVC. Five populations (YY, LC, YX, BS, and DH) were found in the second cluster. The UPGMA dendrogram was also constructed using the combined PAAP and CDDP data. Figure 5C showed that JP, PB, LVC, and YY populations were grouped together, and the rest of the populations (LC, DH, YX and BS) were grouped into another group. These results suggested that there was a close genetic relationship among A. tsao-ko populations.

3.5. Cluster Analysis of A. tsao-ko Accessions

A dendrogram for the 96 A. tsao-ko accessions derived from UPGMA cluster analysis based on PAAP and CDDP data is shown in Figure 6A. All 96 accessions of A. tsao-ko were grouped into two main clusters (with a similarity index of 0.75) except for LC26. Cluster I (47 accessions) included Jinping (10), Pingbian (6), Lvchun (10), Yuanyang (6), Lancang (6), Yunxian (2), Baoshan (5), and Dehong (2); Cluster II (48 accessions) included Jinping (3), Pingbian (7), Lvchun (2), Yuanyang (6), Lancang (6), Yunxian (10), Baoshan (6), and Dehong (8). Principal coordinate analysis (PCoA) was consistent with the results of the cluster analysis; all samples were divided into two groups (Figure 6B).

3.6. Population Atructure of A. tsao-ko Accessions

To further understand the genetic relationships between the A. tsao-ko accessions, we performed model-based population structure analysis using STRUCTURE software. Based on PAAP, CDDP, and PAAP + CDDP data, the best-fit grouping number (K = 2) was inferred by the delta K; all samples were stratified into two groups (Figure 7A). For PAAP markers, group I (red) contained 56 germplasm resources collected from JP (9), PB (8), LVC (10), YY (4), LC (3), YX (2), BS (3), and DH (1), while group II (blue) contained 40 accessions from JP (4), PB (5), LVC (2), YY (8), LC (10), YX (10), BS (8), and DH (9). There were 82 accessions (85.42%) with Q ≥ 0.6, which indicates that most of the A. tsao-ko accessions have a single common ancestor; only 14.58% of the accessions, from the JP (1), PB (3), LVC (1), YY(1), LC(1), YX(1), BS (5), and DH (1) populations, have admixed ancestry (Figure 7B). For CDDP markers, Group I included 52 accessions from JP (11), PB (8), LVC (11), YY (7), LC (6), YX (2), BS (4), and DH (3); group II contained 44 accessions from JP (2), PB (5), LVC (1), YY (5), LC (7), YX (10), BS (7), and DH (7). There were 15 accessions with admixed ancestry from group I and group II (Figure 7B). To reflect the actual population structure of A. tsao-ko, we also performed a calculation based on the combined PAAP and CDDP data; the results showed that group I included populations JP (10), PB (8), LVC (11), YY (7), LC (6), YX (2), BS (3), and DH (2), and group II included populations JP (3), PB (5), LVC (1), YY (5), LC (7), YX (10), BS (8), and DH (8) (Figure 7B). The STRUCTURE analysis was consistent with the results of the UPGMA cluster and PCoA analyses.

4. Discussion

Genetic variation within a species is necessary for evolutionary adaptation to environmental changes [35]. Therefore, evaluation of genetic diversity is an important part of germplasm identification and collection [36]. As a minor crop with homologous medicine and food, the genetic research on A. tsao-ko is relatively behind. We have used the dominant markers, RAPD, ISSR, and SRAP markers, to identify the genetic diversity of A. tsao-ko [24,25]. However, compared with other major crops, the available marker types and marker numbers are insufficient, which limits the evaluation, identification, and collection of A. tsao-ko germplasm resources. Therefore, mining and identifying different types of molecular markers can enrich the types and quantities of available molecular markers in 
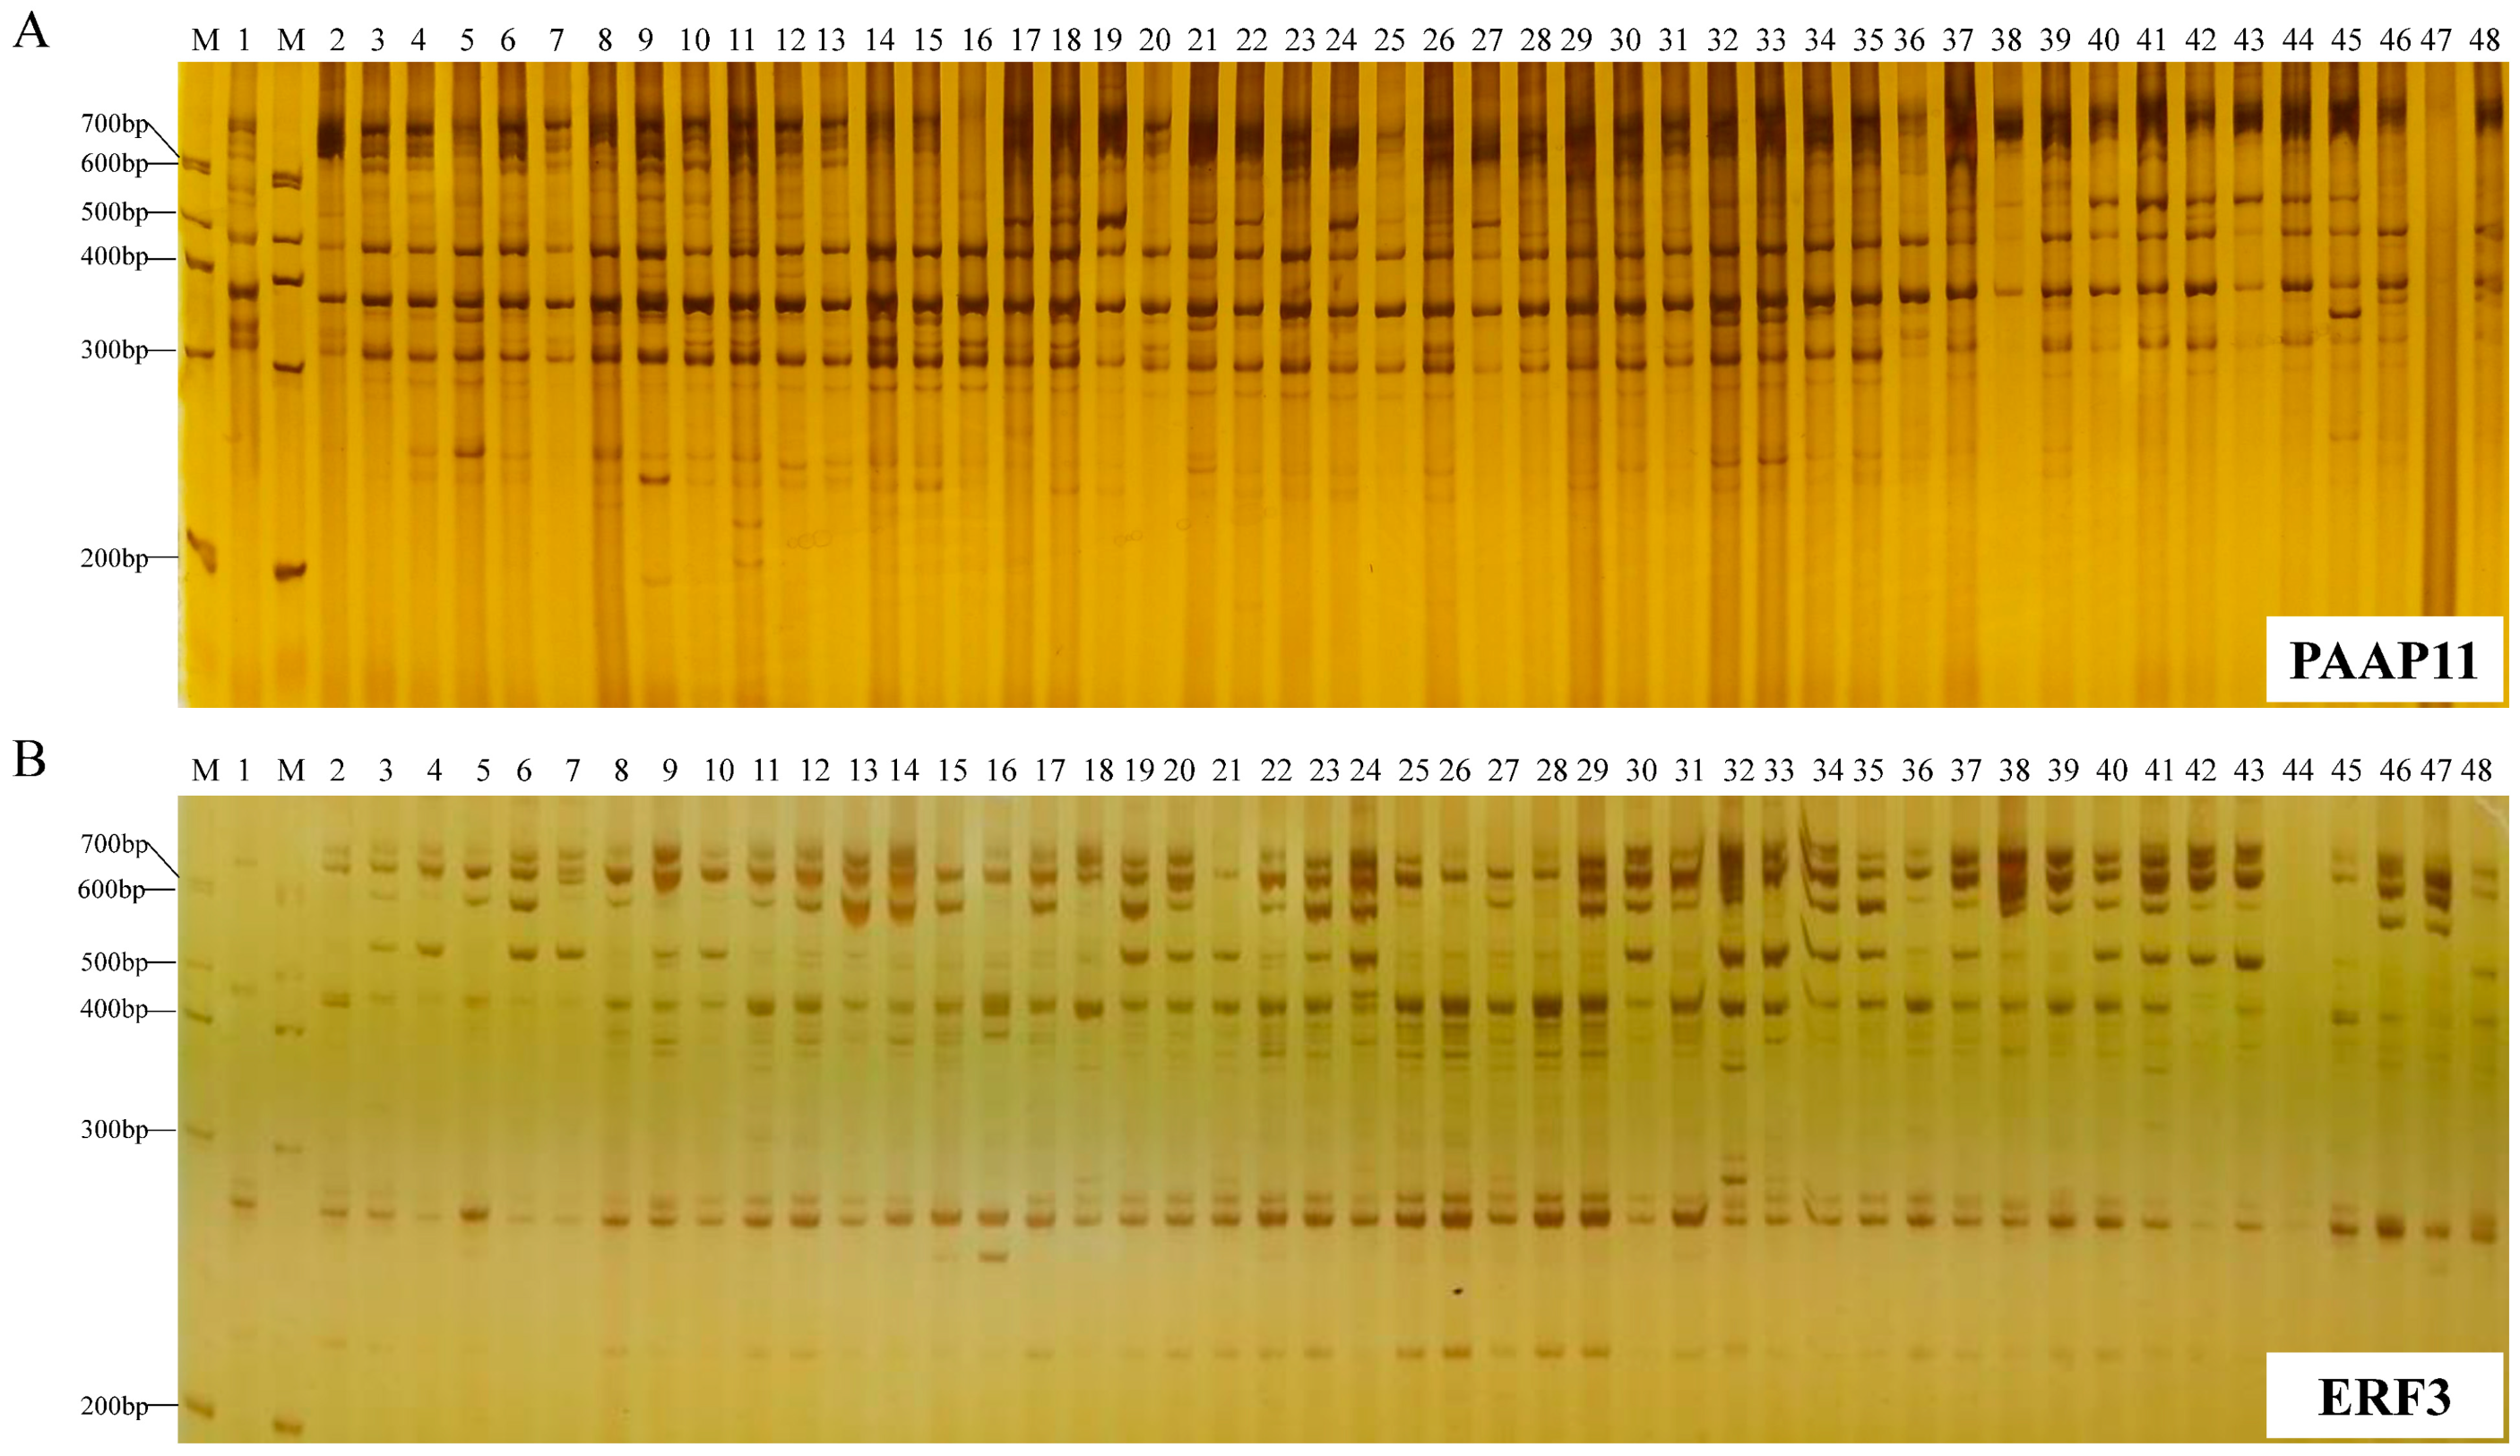
A. tsao-ko, which is of great significance to the research and utilization of this crop. In this study, two novel targeted molecular markers, CDDP and PAAP, were used to analyze the genetic diversity of 96 A. tsao-ko accessions from eight major production areas in China. The number of polymorphic bands (203), PR (99.48%), PIC (0.240), and RP (5.909) of the CDDP markers were higher than those of the PAAP markers (98, 89.09%, 0.214, and 2.870, respectively). The difference in resolution of the two marker techniques may be related to different amplification principles. CDDP generally selects conserved DNA sequences of genes or gene families related to biotic and abiotic stresses and plant development as anchor sites for primer development; most of these genes are multigene families. In contrast, PAAP is a molecular marker specifically developed for the core conserved sequence of regulatory sequence promoters [14,18]. The polymorphic ratio (99.48%) generated by CDDP was similar to that of RAPD (98.98%), SRAP (99.29%), and ISSR (99.46%), which indicated that the studied A. tsao-ko accessions had abundant genetic variations. In comparison with our previous study, CDDP primers showed a higher average PIC value than the RAPD (0.197) [24] and ISSR (0.232) [25] primers but a lower value than the SRAP (0.338) markers [25]; the mean PIC value of the PAAP primers was higher than that obtained by the RAPD primers. This result suggests that both PAAP and CDDP markers are useful tools for exploring genetic diversity and determining the genetic relationships of the A. tsao-ko germplasm.
The average percentage of polymorphic sites, expected heterozygosity, and Shannon′s index at the population level (Ppop, Hpop, and Ipop) are three important parameters used in the study of plant population genetic diversity. Zhang and Yang [37] presented a statistical analysis of common genetic diversity parameters in multiple plant species. At the population level, the mean percentage of polymorphic loci (Ppop), gene diversity (Hpop), and Shannon’s information index (Ipop) were 40.3%, 0.123, and 0.186, respectively. Our study reveals a relatively high level of Ppop (60.56% for PAAP, 62.32% for CDDP) in the eight A. tsao-ko populations; Hpop (0.177 for PAAP, 0.164 for CDDP) and Ipop (0.272 for PAAP, 0.259 for CDDP) are higher than the average genetic diversity of other plant populations based on the ISSR markers. In this study, the JP population showed a relatively high level of genetic diversity by the PAAP and CDDP markers, which is consistent with our previous results for RAPD [24], SRAP, and ISSR [25] markers. Jinping County has a long history of A. tsao-ko cultivation, more than 400 years, and it is generally believed that A. tsao-ko originated in Jinping, which is consistent with the high genetic diversity of germplasm in this area [25].
Genetic differentiation refers to the distribution of genetic diversity within and between populations [38]. The degree of genetic differentiation among populations can be evaluated by the genetic differentiation coefficient Gst; when Gst > 0.25, the degree of differentiation among populations is very high [39]. The results of this study showed that only 15.10% (Gst = 0.151 for PAAP) and 12.8% (Gst = 0.128 for CDDP) of the total genetic variation was shared among the eight A. tsao-ko populations, and within population genetic differentiation was 84.90% (PAAP) and 87.2% (CDDP). The results of AMOVA using PAAP and CDDP markers also demonstrated that most of the variability among the accessions was within the populations. Higher genetic diversity within a population is more beneficial for the conservation of a species. Therefore, to manage and protect A. tsao-ko germplasm resources more effectively, germplasm resource nurseries should be established in areas with high genetic diversity, such as Jinping County. Gene flow is the main factor affecting the genetic structure of the population; when gene flow is greater than one, genetic differentiation among populations caused by genetic drift is avoidable [40]. In this study, the high gene flow (Nm = 2.815 for PAAP, Nm = 3.412 for CDDP) among the populations indicated that gene exchange between different populations was frequent; this is also consistent with the high genetic identity (GI) revealed by the PAAP (average GI = 0.957) and CDDP (average GI = 0.967) markers. The high gene flow may be related to the cross-pollination breeding characteristics and artificial germplasm exchange of A. tsao-ko [25,41,42].
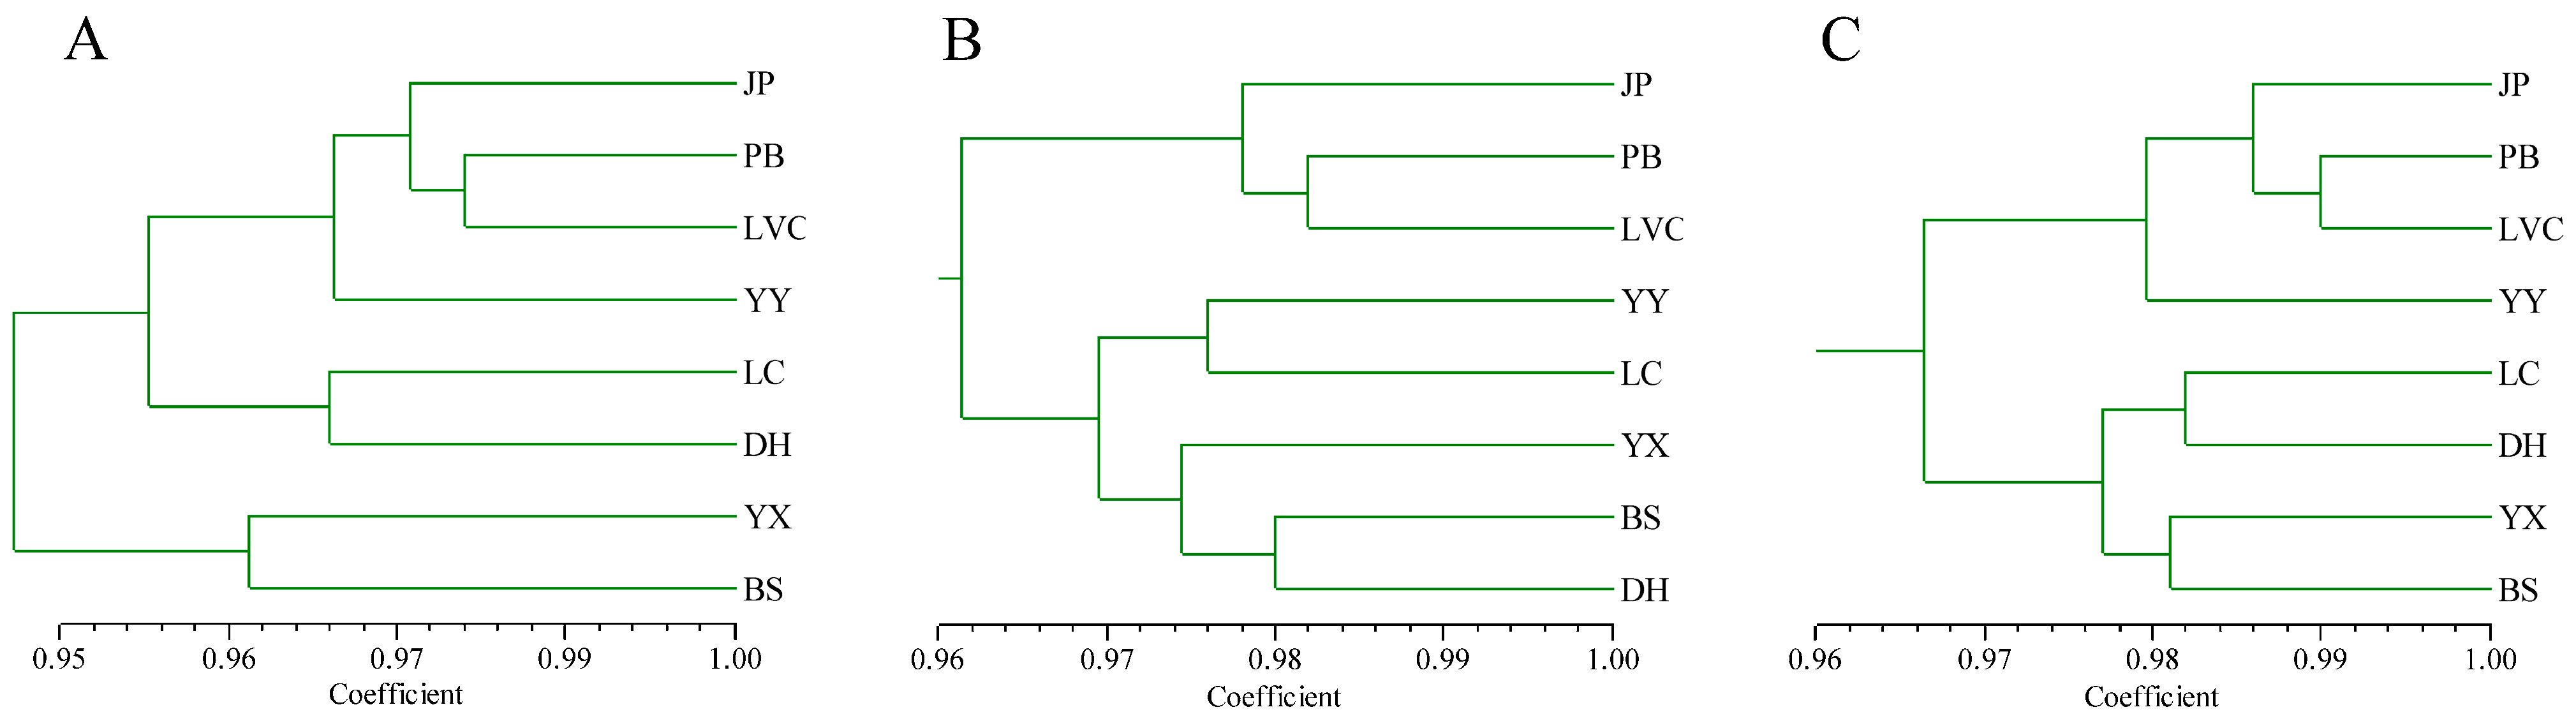
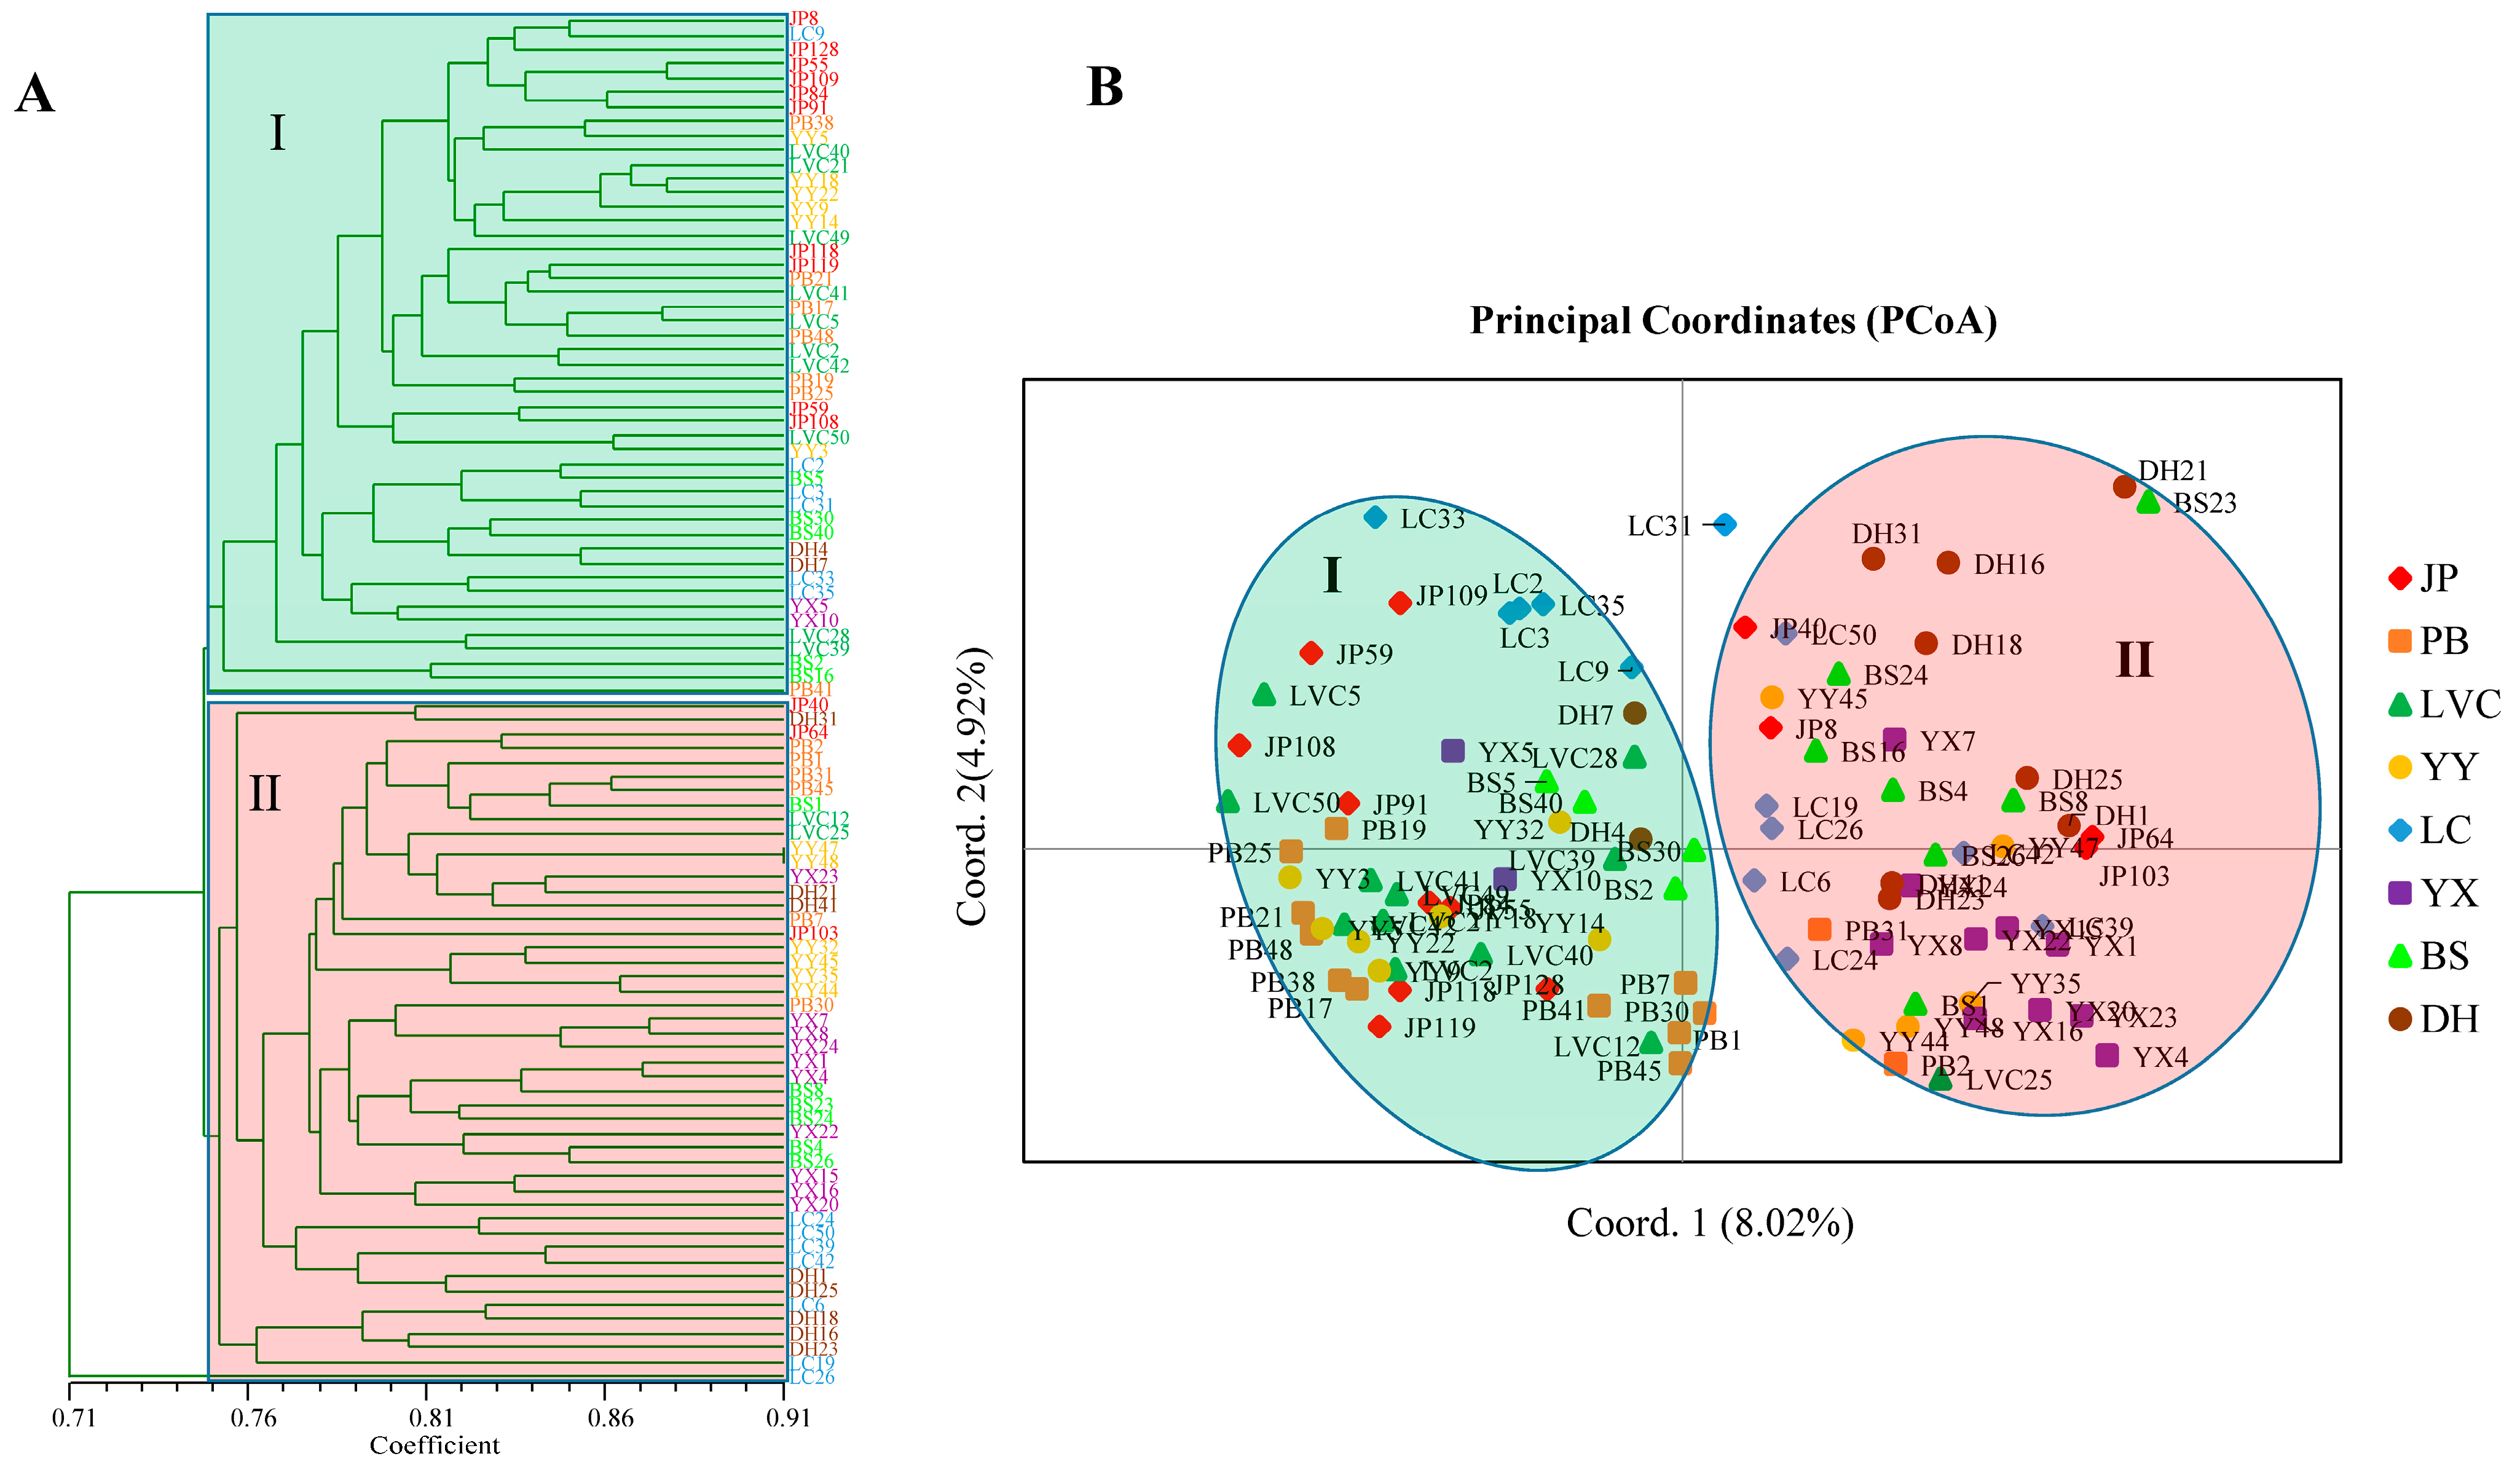
Cluster analysis and PCoA were helpful for understanding the relationships among the 96 A. tsao-ko accessions. Both UPGMA cluster and PCoA analyses divided the 96 accessions into two groups based on the combined PAAP and CDDP marker data. The accessions from different populations were distributed in different groups and were not clustered strictly by geographic origin. This result was consistent with high within-population variation, genetic identity, and gene flow and was found to be in agreement with the results obtained using PAPD, ISSR, and SRAP markers [24,25]. Furthermore, we noticed that some accessions from the same population tend to have the highest similarity, such as YY47 and YY48, YX7 and YX8, and JP55 and JP109. Although the linear distance between the collections is not less than 50 m when we sampled in the same population to reduce the possibility of sampling from the same clone, there is still a concern that a small number of accessions have similar genetic backgrounds. It will be necessary to expand the sampling distance between samples within the same population in the future. Population genetic structure is the distribution of each subgroup within the population and reflects the structural characteristics of subgroups. When the Q (the corresponding membership coefficient) value of accessions in a certain group is greater than or equal to 0.6, it is considered that the ancestry of the accession is relatively pure, otherwise the ancestry of the accession is considered to be complex [43]. In this study, 14.58% (PAAP), 15.63% (CDDP), and 14.58% (PAAP + CDDP) of accessions showed mixed ancestry (Q < 0.6) from the STRUCTURE analysis. This finding further shows that most of the germplasms of A. tsao-ko are relatively simple in origin, and most of the genetic variation occurs within populations or geographical regions. This result is also consistent with the result of genetic differentiation in A. tsao-ko populations.

5. Conclusions

In the present study, two novel targeted molecular markers, PAAP and CDDP, were used to analyze the genetic diversity of 96 A. tsao-ko accessions. The results showed that both PAAP and CDDP markers were suitable for the evaluation of the genetic diversity of A. tsao-ko. At the population level, the eight populations had high genetic diversity; Gst and AMOVA showed that the genetic variation of A. tsao-ko mainly existed within populations, and there was high gene flow among the populations. Genetic identity analysis further demonstrated that the genetic consistency among A. tsao-ko populations is relatively high, and there is no genetic differentiation among A. tsao-ko populations. UPGMA cluster, PCoA, and population structure analyses revealed that the 96 accessions were divided into two groups, and the germplasms from different populations were scattered between the various clusters and were not clustered strictly according to their geographical origin. Our study expands the types of molecular markers available for A. tsao-ko research and is of great value for the collection, identification, protection, and utilization of A. tsao-ko germplasm.

Author Contributions

Conceptualization, B.L.; methodology, M.M.; software, M.M.; validation, M.M., Z.Y. and B.L.; formal analysis, B.L.; investigation, Z.Y.; resources, M.M.; data curation, M.M.; writing—original draft preparation, M.M.; writing—review and editing, B.L.; visualization, B.L.; supervision, B.L.; project administration, B.L.; funding acquisition, B.L. All authors have read and agreed to the published version of the manuscript.

Funding

This research was funded by Applied Basic Research Key Project of Yunnan (202001BA070001-181), Youth Top-notch Talent Support Program of Yunnan Province (YNWR-QNBJ-2020-207), and National Natural Science Foundation of China (31460380, 82260735).

Institutional Review Board Statement

Not applicable.

Data Availability Statement

Not applicable.

Conflicts of Interest

The authors declare no conflict of interest.

References

  1. Lu, B.Y.; Ma, M.L.; Zhang, W.; Meng, H.L.; Lei, E.; Wang, T.T.; Li, C.Y. Development of 23 novel microsatellite markers of Amomum tsao-ko (Zingiberaceae) based on restriction-site-associated DNA sequencing. Mol. Biol. Rep. 2021, 48, 1943–1949. [Google Scholar] [CrossRef] [PubMed]
  2. Yang, S.Y.; Xue, Y.F.; Chen, D.J.; Wang, Z.T. Amomum tsao-ko Crevost & Lemarie: A comprehensive review on traditional uses, botany, phytochemistry, and pharmacology. Phytochem. Rev. 2022, 1–35. [Google Scholar] [CrossRef]
  3. Zhang, X.F.; Tang, Y.J.; Guan, X.X.; Lu, X.; Li, J.; Chen, X.L.; Deng, J.L.; Fan, J.M. Flavonoid constituents of Amomum tsao-ko Crevost et Lemarie and their antioxidant and antidiabetic effects in diabetic rats—In vitro and in vivo studies. Food Funct. 2022, 13, 437–450. [Google Scholar] [CrossRef] [PubMed]
  4. Guo, N.; Zang, Y.P.; Cui, Q.; Gai, Q.Y.; Jiao, J.; Wang, W.; Zu, Y.G.; Fu, Y.J. The preservative potential of Amomum tsaoko essential oil against E. coil, its antibacterial property and mode of action. Food Control 2017, 75, 236–245. [Google Scholar] [CrossRef]
  5. Hong, S.S.; Lee, J.E.; Jung, Y.W.; Park, J.-H.; Lee, J.A.; Jeong, W.; Ahn, E.-K.; Choi, C.W.; Oh, J.S. Monoterpenoids from the Fruits of Amomum tsao-ko Have Inhibitory Effects on Nitric Oxide Production. Plants 2021, 10, 257. [Google Scholar] [CrossRef]
  6. He, X.F.; Chen, J.J.; Huang, X.Y.; Hu, J.; Zhang, X.K.; Guo, Y.Q.; Zhang, X.M.; Geng, C.A. The antidiabetic potency of Amomum tsao-ko and its active flavanols, as PTP1B selective and alpha-glucosidase dual inhibitors. Ind. Crops and Prod. 2021, 160, 110908. [Google Scholar] [CrossRef]
  7. Chen, C.; You, F.; Wu, F.H.; Luo, Y.S.; Zheng, G.H.; Xu, H.L.; Liu, Y. Antiangiogenesis efficacy of ethanol extract from Amomum tsaoko in ovarian cancer through inducing ER stress to suppress p-STAT3/NF-kB/IL-6 and VEGF loop. Evid-Based Compl. Alt. 2020, 2020, 2390125. [Google Scholar] [CrossRef]
  8. Wang, K.N.; Liu, Y.N.; Shi, Y.; Yan, M.Z.; Rengarajan, T.; Feng, X. Amomum tsaoko fruit extract exerts anticonvulsant effects through suppression of oxidative stress and neuroinflammation in a pentylenetetrazol kindling model of epilepsy in mice. Saudi J. Biol. Sci. 2021, 28, 4247–4254. [Google Scholar] [CrossRef]
  9. Starkenmann, C.; Mayenzet, F.; Brauchli, R.; Wunsche, L.; Vial, C. Structure elucidation of a pungent compound in black cardamom: Amomum tsao-ko Crevost et Lemarie (Zingiberaceae). J. Agric. Food Chem. 2007, 55, 10902–10907. [Google Scholar] [CrossRef]
  10. Agarwal, M.; Shrivastava, N.; Padh, H. Advances in molecular marker techniques and their applications in plant sciences. Plant Cell Rep. 2008, 27, 617–631. [Google Scholar] [CrossRef]
  11. Ismail, N.A.; Rafii, M.Y.; Mahmud, T.M.M.; Hanafi, M.M.; Miah, G. Molecular markers: A potential resource for ginger genetic diversity studies. Mol. Biol. Rep. 2016, 43, 1347–1358. [Google Scholar] [CrossRef]
  12. Gupta, P.; Rustgi, S. Molecular markers from the transcribed/expressed region of the genome in higher plants. Funct. Integr. Genom. 2004, 4, 139–162. [Google Scholar] [CrossRef]
  13. Xiong, F.; Jiang, J.; Zhong, R.; Han, Z.; Jia, L.; Li, Z.; Zhang, W.; Tang, R. Two novel targeted molecular marker techniques CDDP and PAAP. Plant Physiol. Commun. 2010, 46, 871–875. [Google Scholar] [CrossRef]
  14. Pang, M.X.; Percy, R.G.; Hughs, E.; Zhang, J.F. Promoter anchored amplified polymorphism based on random amplified polymorphic DNA (PAAP-RAPD) in cotton. Euphytica 2009, 167, 281–291. [Google Scholar] [CrossRef]
  15. Adams, N.; Flynn, R.; Bajaj, S.; Percy, R.; Jones, D.; Hughs, S.; Zhang, J. Identification of cotton germplasm and molecular markers for drought tolerance. In Proceedings of the Beltwide Cotton Conferences, Atlanta, GA, USA, 4–7 January 2011; p. 708. [Google Scholar]
  16. Gangtire, D.; Magar, N.D.; Khelurkar, V.; Moharil, M.P.; Jadhav, P.; Katkar, R.; Ghorade, R.; Suprasanna, P. Promotor anchored-RAPD analysis of Foxtail Millet (Setaria italica L.) accessions selected for high iron and zinc content. Int. J. Plant Soil Sci. 2021, 33, 36–48. [Google Scholar] [CrossRef]
  17. Mokate, Y.S.; Chimote, V.P.; Deshmukh, M.P.; Gawai, K.; Kale, A.A.; Jadhav, A.S. Use of promoter-anchored rapd analysis for divergence assessment in soybean as against conventionally used ISSR assay. Appl. Biol. Res. 2017, 19, 1–9. [Google Scholar] [CrossRef]
  18. Collard, B.C.Y.; Mackill, D.J. Conserved DNA-Derived Polymorphism (CDDP): A Simple and Novel Method for Generating DNA Markers in Plants. Plant Mol. Biol. Rep. 2009, 27, 558–562. [Google Scholar] [CrossRef]
  19. Liu, H.Y.; Zang, F.Q.; Wu, Q.C.; Ma, Y.; Zheng, Y.Q.; Zang, D.K. Genetic diversity and population structure of the endangered plant Salix taishanensis based on CDDP markers. Glob. Ecol. Conserv. 2020, 24, e01242. [Google Scholar] [CrossRef]
  20. Li, T.; Guo, J.E.; Li, Y.Y.; Ning, H.; Sun, X.; Zheng, C.S. Genetic diversity assessment of chrysanthemum germplasm using conserved DNA-derived polymorphism markers. Sci. Hortic. 2013, 162, 271–277. [Google Scholar] [CrossRef]
  21. Igwe, D.O.; Ihearahu, O.C.; Osano, A.A.; Acquaah, G.; Ude, G.N. Genetic Diversity and Population Assessment of Musa L. (Musaceae) Employing CDDP Markers. Plant Mol. Biol. Rep. 2021, 39, 801–820. [Google Scholar] [CrossRef]
  22. Aouadi, M.; Guenni, K.; Abdallah, D.; Louati, M.; Chatti, K.; Baraket, G.; Hannachi, A.S. Conserved DNA-derived polymorphism, new markers for genetic diversity analysis of Tunisian Pistacia vera L. Physiol. Mol. Biol. Plants 2019, 25, 1211–1223. [Google Scholar] [CrossRef]
  23. Zhang, W.; Lu, B.Y.; Meng, H.L.; Wei, X.; Yang, Z.Q.; Yang, S.C. Phenotypic diversity analysis of the fruit of Amomum tsao-ko Crevost et Lemarie, an important medicinal plant in Yunnan, China. Genet. Resour. Crop Evol. 2019, 66, 1145–1154. [Google Scholar] [CrossRef]
  24. Lu, B.Y.; Ma, M.L.; Wang, T.T.; Meng, H.L.; Lei, E.; Zhang, W. Genetic Diversity and Genetic Relationships of Amomum tsao-ko Based on Random Amplified Polymorphic DNA Markers. Int. J. Agric. Biol. 2018, 20, 2032–2038. [Google Scholar] [CrossRef]
  25. Ma, M.L.; Wang, T.T.; Lu, B.Y. Assessment of genetic diversity in Amomum tsao-ko Crevost & Lemarie, an important medicine food homologous crop from Southwest China using SRAP and ISSR markers. Genet. Resour. Crop Evol. 2021, 68, 2655–2667. [Google Scholar] [CrossRef]
  26. Allen, G.C.; Flores-Vergara, M.A.; Krasnyanski, S.; Kumar, S.; Thompson, W.F. A modified protocol for rapid DNA isolation from plant tissues using cetyltrimethylammonium bromide. Nature Protoc. 2006, 1, 2320–2325. [Google Scholar] [CrossRef]
  27. Roldan-Ruiz, I.; Dendauw, J.; Van Bockstaele, E.; Depicker, A.; De Loose, M. AFLP markers reveal high polymorphic rates in ryegrasses (Lolium spp.). Mol. Breed. 2000, 6, 125–134. [Google Scholar] [CrossRef]
  28. Prevost, A.; Wilkinson, M.J. A new system of comparing PCR primers applied to ISSR fingerprinting of potato cultivars. Theor. Appl. Genet. 1999, 98, 107–112. [Google Scholar] [CrossRef]
  29. Yeh, F.C.; Boyle, T.J.B. Population genetic analysis of co-dominant and dominant markers and quantitative traits. Belg. J. Bot. 1997, 129, 156–159. [Google Scholar]
  30. Peakall, R.; Smouse, P.E. GenAlEx 6.5: Genetic analysis in Excel. Population genetic software for teaching and research-an update. Bioinformatics 2012, 28, 2537–2539. [Google Scholar] [CrossRef]
  31. Rohlf, F. NTSYS, version 2.1; Exeter Publishing Setauket: New York, NY, USA, 2000. [Google Scholar]
  32. Pritchard, J.K.; Stephens, M.; Donnelly, P. Inference of population structure using multilocus genotype data. Genetics 2000, 155, 945–959. [Google Scholar] [CrossRef]
  33. Earl, D.A.; Vonholdt, B.M. STRUCTURE HARVESTER: A website and program for visualizing STRUCTURE output and implementing the Evanno method. Conserv. Genet. Resour. 2012, 4, 359–361. [Google Scholar] [CrossRef]
  34. Francis, R.M. POPHELPER: An R package and web app to analyse and visualize population structure. Mol. Ecol. Resour. 2017, 17, 27–32. [Google Scholar] [CrossRef] [PubMed]
  35. Frankham, R. Quantitative genetics in conservation biology. Genet. Res. 1999, 74, 237–244. [Google Scholar] [CrossRef] [PubMed]
  36. Glaszmann, J.C.; Kilian, B.; Upadhyaya, H.D.; Varshney, R.K. Accessing genetic diversity for crop improvement. Curr. Opin Plant Biol. 2010, 13, 167–173. [Google Scholar] [CrossRef]
  37. Zhang, D.; Yang, Y. A statistical and comparative analysis of genetic diversity detected by different molecular markers. Acta Bot. Yunnanica 2008, 30, 159. [Google Scholar]
  38. Gregorius, H.R. Distribution of variation over populations. Theor. Biosci. 2009, 128, 179–189. [Google Scholar] [CrossRef]
  39. Slatkin, M. Gene flow and the geographic structure of natural populations. Science 1987, 236, 787–792. [Google Scholar] [CrossRef]
  40. Loveless, M.D.; Hamrick, J.L. Ecological determinants of genetic structure in plant populations. Annu. Rev. Ecol. Syst. 1984, 15, 65–95. [Google Scholar] [CrossRef]
  41. Cui, X.L.; Wei, R.C.; Huang, R.F. A preliminary study on the genetic system of Amomum tsao-ko. J. Yunnan Univ. (Nat. Sci.) 1995, 17, 290–297. [Google Scholar]
  42. Yang, Y.W.; Qian, Z.G.; Li, A.R.; Pu, C.X.; Liu, X.L.; Guan, K.Y. Differentiation in fructification percentage between two morphs of Amomum tsaoko (Zingiberaceae). Breed. Sci. 2016, 66, 391–395. [Google Scholar] [CrossRef]
  43. Delfini, J.; Moda-Cirino, V.; Neto, J.D.; Ruas, P.M.; Sant’Ana, G.C.; Gepts, P.; Goncalves, L.S.A. Population structure, genetic diversity and genomic selection signatures among a Brazilian common bean germplasm. Sci. Rep. 2021, 11, 1–12. [Google Scholar] [CrossRef]
Figure 1. The habitat and morphology of Amomum tsao-ko in the Lancang population, Yunnan Province, China (22°54′36″ N, 99°49′12″ E, 1924 m above sea level). A. tsao-ko plants growing in a typical shady, wet, humus-rich habitat (A,B), fresh fruit (C), and dried fruit (D).
Agriculture 12 01536 g001
Figure 2. Sampling locations of A. tsao-ko are indicated by red stars. JP = Jinping population (13 accessions), PB = Pingbian population (13 accessions), LVC = Lvchun population (12 accessions), YY = Yuanyang population (12 accessions), LC = Lancang population (13 accessions), XY = Yunxian population (12 accessions), BS = Baoshan population (11 accessions), and DH = Dehong population (10 accessions).
Agriculture 12 01536 g002
Figure 3. Amplification profiles of representative PAAP (A) and CDDP (B) markers. Lane 1–48 = JP8, JP40, JP55, JP59, JP64, JP84, JP91, JP103, JP108, JP109, JP118, JP119, JP128, PB1, PB2, PB7, PB17, PB19, PB21, PB25, PB30, PB31, PB38, PB41, PB45, PB48, LVC2, LVC5, LVC12, LVC21, LVC25, LVC28, LVC39, LVC40, LVC41, LVC42, LVC49, LVC50, YY3, YY5, YY9, YY14, YY18, YY22, YY32, YY35, YY44, YY45; Lane M = DNA marker (100 bp).
Agriculture 12 01536 g003
Figure 4. Analysis of molecular variance (AMOVA). AMOVA based on PAAP markers (A), AMOVA based on CDDP markers (B).
Agriculture 12 01536 g004
Figure 5. Unweighted pair-group method with arithmetic mean (UPGMA) dendrogram based on PAAP (A), CDDP (B), and PAAP + CDDP (C) markers for the eight A. tsao-ko populations.
Agriculture 12 01536 g005
Figure 6. UPGMA cluster (A) and principal coordinates analysis (PCoA) (B) of the 96 A. tsao-ko accessions based on PAAP and CDDP markers.
Agriculture 12 01536 g006
Figure 7. Graphical representation of population structure using STRUCTURE v2.3.4 and Structure Harvester v6.0 programs. (A) The median and variance of the estimated probability value for each K value; (B) Population structure of 96 A. tsao-ko accessions.
Agriculture 12 01536 g007
Table 1. Original information of Amomum tsao-ko accessions used in this study.
Population No. of AccessionsLatitude (N)Longitude (E)Altitude (m)Location
JP1322°54′36″103°13′12″1665Jinping, Yunnan
YY1223°3′0″102°55′12″2108Yuanyang, Yunnan
LVC1222°53′24″102°24′43″1880Lvchun, Yunnan
PB1323°2′24″103°31′48″1721Pingbian, Yunnan
LC1322°54′36″99°49′12″1924Lancang, Yunnan
BS1124°49′48″98°46′48″1873Baoshan, Yunnan
DH1024°45′0″98°18′36″1822Lianghe, Yunnan
YX1224°17′24″100°6′36″1811Yunxian, Yunnan
JP = Jinping population, YY = Yuanyang population, LVC = Lvchun population, PB = Pingbian population, LC = Lancang population, BS = Baoshan population, DH = Dehong population, and XY = Yunxian population.
Table 2. Sequences and amplification results for PAAP primers.
Primer NamePrimer CombinationBPBPR/%PICRP
PAAP1UBC001 + G12020100.000.2416.813
PAAP2UBC001 + GC11212100.000.2203.802
PAAP3UBC001 + CA11313100.000.2303.933
PAAP4UBC001 + TA13133.330.0390.125
PAAP5UBC002 + G13266.670.0410.128
PAAP6UBC002 + GC188100.000.3454.178
PAAP7UBC002 + CA199100.000.2633.453
PAAP8UBC002 + TA17685.710.2482.344
PAAP9UBC693 + G177100.000.1991.979
PAAP10UBC693 + GC177100.000.2272.438
PAAP11UBC693 + CA188100.000.2752.854
PAAP12UBC693 + TA16583.330.2412.396
Mean-8.5838.16789.090.2142.870
UBC001 = 5′-CCTGGGCTTC-3′, UBC002 = 5′-CCTGGGCTTG-3′, UBC693 = 5′-GACGAGACGG-3′, G1 = 5′-GCCACSTGTC-3′, GC1 = 5′-NNNGGGCGGN-3′, CA1 = 5′-YRRCCAATWSR-3′, TA1 = 5′-CTATAWAWASM-3′. B, the number of amplified bands; PB, the number of polymorphic bands; PR, the polymorphism ratio; PIC, the polymorphism information content; RP, the resolving power.
Table 3. Sequences and amplification results for CDDP primers.
Primer NamePrimer Sequence (5′ to 3′)BPBPR/%PICRP
ABP1-1ACSCCSATCCACCGC2222100.000.2207.087
ERF3TGGCTSGGCACSTTCGA1717100.000.1824.438
WRKY-R1GTGGTTGTGCTTGCC1414100.000.3216.761
WRKY-R3GCASGTGTGCTCGCC1515100.000.1864.132
KNOX2CACTGGTGGGAGCTSCAC99100.000.2243.271
KNOX3AAGCGSCACTGGAAGCC1919100.000.2366.391
MADS2ATGGGCCGSGGCAAGGTGG161593.800.2495.685
MADS4CTSTGCGACCGSGAGGTG2121100.000.2588.283
WRKY-R2GCCCTCGTASGTSGT2121100.000.2287.234
WRKY-R2BTGSTGSATGCTCCCG2222100.000.1905.646
WRKY-F1TGGCGSAAGTACGGCCAG1717100.000.2877.021
WRKY-R3BCCGCTCGTGTGSACG1111100.000.2964.957
Mean-17.0016.9299.480.2405.909
B, the number of amplified bands; PB, the number of polymorphic bands; PR, the polymorphism ratio; PIC, the polymorphism information content; RP, the resolving power.
Table 4. Genetic diversity of A. tsao-ko populations by PAAP markers.
PopulationPRNaNeHIHtHsGstNm
JP65.05%1.6511.2740.1670.263
PB61.17%1.6121.3360.1980.299
LVC64.08%1.6411.3160.1890.290
YY53.40%1.5341.2480.1500.233
LC64.08%1.6411.3190.1880.289
YX61.17%1.6121.3130.1870.286
BS59.22%1.5921.2680.1660.259
DH56.31%1.5631.2720.1670.258
Mean60.56%1.6061.2930.1770.272
Species89.90%1.9521.3370.2070.3290.2080.1770.1512.815
PR, polymorphism ratio; Na, observed number of alleles; Ne, effective number of alleles; H, Nei’s gene diversity; I, Shannon’s information index; Ht, total genetic diversity; Hs, genetic diversity within populations; Gst, genetic differentiation among populations; Nm, gene flow estimated from Gst.
Table 5. Genetic diversity of A. tsao-ko populations from CDDP markers.
PopulationPRNaNeHIHtHsGstNm
JP66.18%1.6621.2540.1610.259
PB58.33%1.5831.2500.1570.247
LVC62.75%1.6281.2670.1650.260
YY59.31%1.5931.2690.1650.256
LC74.02%1.7401.2740.1750.282
YX61.76%1.6181.2660.1660.261
BS55.39%1.5541.2580.1590.248
DH60.78%1.6081.2540.1630.259
Mean62.32%1.6231.2610.1640.259
Species99.48%1.9951.2950.1880.3050.1880.1640.1283.412
PR, polymorphism ratio; Na, observed number of alleles; Ne, effective number of alleles; H, Nei’s gene diversity; I, Shannon’s information index; Ht, total genetic diversity; Hs, genetic diversity within populations; Gst, genetic differentiation among populations; Nm, gene flow estimated from Gst.
Table 6. Analysis of molecular variance (AMOVA) of A. tsao-ko based on PAAP and CDDP markers.
MarkersdfSSMSEst. Var.%Valuep
PAAP
Among Pops7203.31629.0451.3009%0.0880.001
Within Pops881184.89213.46513.46591%
CDDP
Among Pops7405.76957.9672.5739%0.0870.001
Within Pops882386.62727.12127.12191%--
Table 7. Pairwise Nei’s genetic identity based on PAAP (above diagonal) and CDDP (below diagonal) between A. tsaoko populations.
PopJPPBLVCYYLCYXBSDH
JP 0.9780.9740.9680.9710.9420.9500.957
PB0.977 0.9800.9700.9680.9530.9450.953
LVC0.9790.982 0.9730.9630.9410.9380.936
YY0.9760.9680.970 0.9630.9300.9430.942
LC0.9730.9530.9640.976 0.9690.9590.970
YX0.9650.9560.9540.9720.971 0.9640.949
BS0.9620.9520.9570.9640.9690.975 0.940
DH0.9640.9520.9550.9680.9730.9740.980
Publisher’s Note: MDPI stays neutral with regard to jurisdictional claims in published maps and institutional affiliations.

