Article

Difference in Accumulation of Five Phthalate Esters in Different Elite Tea Cultivars and Their Correlation with Environment Factors

1
Zhejiang Provincial Key Laboratory of Biometrology and Inspection and Quarantine, College of Life Sciences, China Jiliang University, Hangzhou 310018, China
2
Gushi Town, Songyang 323400, China
*
Author to whom correspondence should be addressed.
These authors contributed equally to this work.
Agriculture 2022, 12(10), 1516; https://doi.org/10.3390/agriculture12101516
Submission received: 24 July 2022 / Revised: 15 September 2022 / Accepted: 16 September 2022 / Published: 21 September 2022
(This article belongs to the Section Agricultural Product Quality and Safety)

Abstract

:
Plasticizers, i.e., phthalate esters (PAEs) were liable to be detected from fresh tea leaves and tea products. In order to monitor the pollution of PAEs in tea plants and compare the difference among PAEs content of tea cultivars, fifteen elite cultivars in tea plant cultivar gardens were chosen. PAEs were extracted from the upper mature leaves and lower mature leaves of tea bushes and determined via GC–MS once every two months, six times in total in one anniversary. DMP, DEP, DiBP, DBP, and DEHP were detected in fifteen tea cultivars. DBP was the predominant congener in fifteen tea cultivars, which was followed by DiBP. PAEs content in upper mature leaves was significantly lower than that in lower mature leaves in all months. There was no significant difference among PAEs content from the fifteen tea cultivars. Except for summer, the PAEs content of fresh tea leaves gradually increased from spring to winter. The correlation analysis result was that PAEs had significant negative correlation with air temperature and positive correlation with air quality index (p < 0.01). The mutual correlation among the five PAEs were significant (p < 0.05). According to cluster analysis, three types of fresh tea leaves with high, medium, and low accumulation accounted for 26.7%, 20%, and 53.3%, respectively. The results could supply a reference for monitoring of pollution of PAEs in fresh tea leaves, as well as an evaluation of PAEs content difference of tea plant cultivars.

1. Introduction

Phthalate esters (PAEs) are mainly used as plasticizers and slightly used as additives in cosmetic and personal care products. Hundreds of products have been made by using PAEs as raw materials. The global production of PAEs is approximately 8.0 million tons per year, and those produced in China account for 20% [1,2]. Recent researches have revealed that PAEs would disrupt the human endocrine system and have teratogenic, carcinogenic, and mutagenic potential. A previous study showed that PAEs caused thyroid hypertrophy, hyperplasia, and diseases of the endocrine system of fish in Australia [3]. Additionally, fish can degrade PAEs contained in fish food into mono-PAEs [4,5,6,7]. PAEs have become one of the most common environmental pollutants, which can be absorbed by living organisms, involved in their metabolisms, and degraded by living organisms. Tea plants can absorb PAEs, which would be left in tea products even after fresh tea leaves are plucked and processed. PAEs levels in green tea and black tea during the process, tea products, and tea infusion have been investigated in previous studies [8,9,10,11]. However, research on the seasonal dynamics and variations of PAEs levels in fresh tea leaves among different tea cultivars is scarce.
There are nearly 30 kinds of PAE congeners found, and among them, five PAEs are mainly detected in tea, including di-n-butyl phthalate (DBP), di-isobutyl phthalate (DiBP), di-2-ethylhexyl phthalate (DEHP), dimethyl phthalate (DMP), and diethyl phthalate (DEP) (Table S1) [8,9]. In this study, fifteen tea cultivars of the same tree age and consistent management cultivated in an experimental tea garden were chosen as the experimental material, aiming to investigate the changes in PAEs levels of fresh tea leaves in different seasons and cultivars. This study would provide references for temporal variations in PAEs levels of tea plants and evaluation on tea cultivars with a low accumulation of PAEs.

2. Materials and Methods

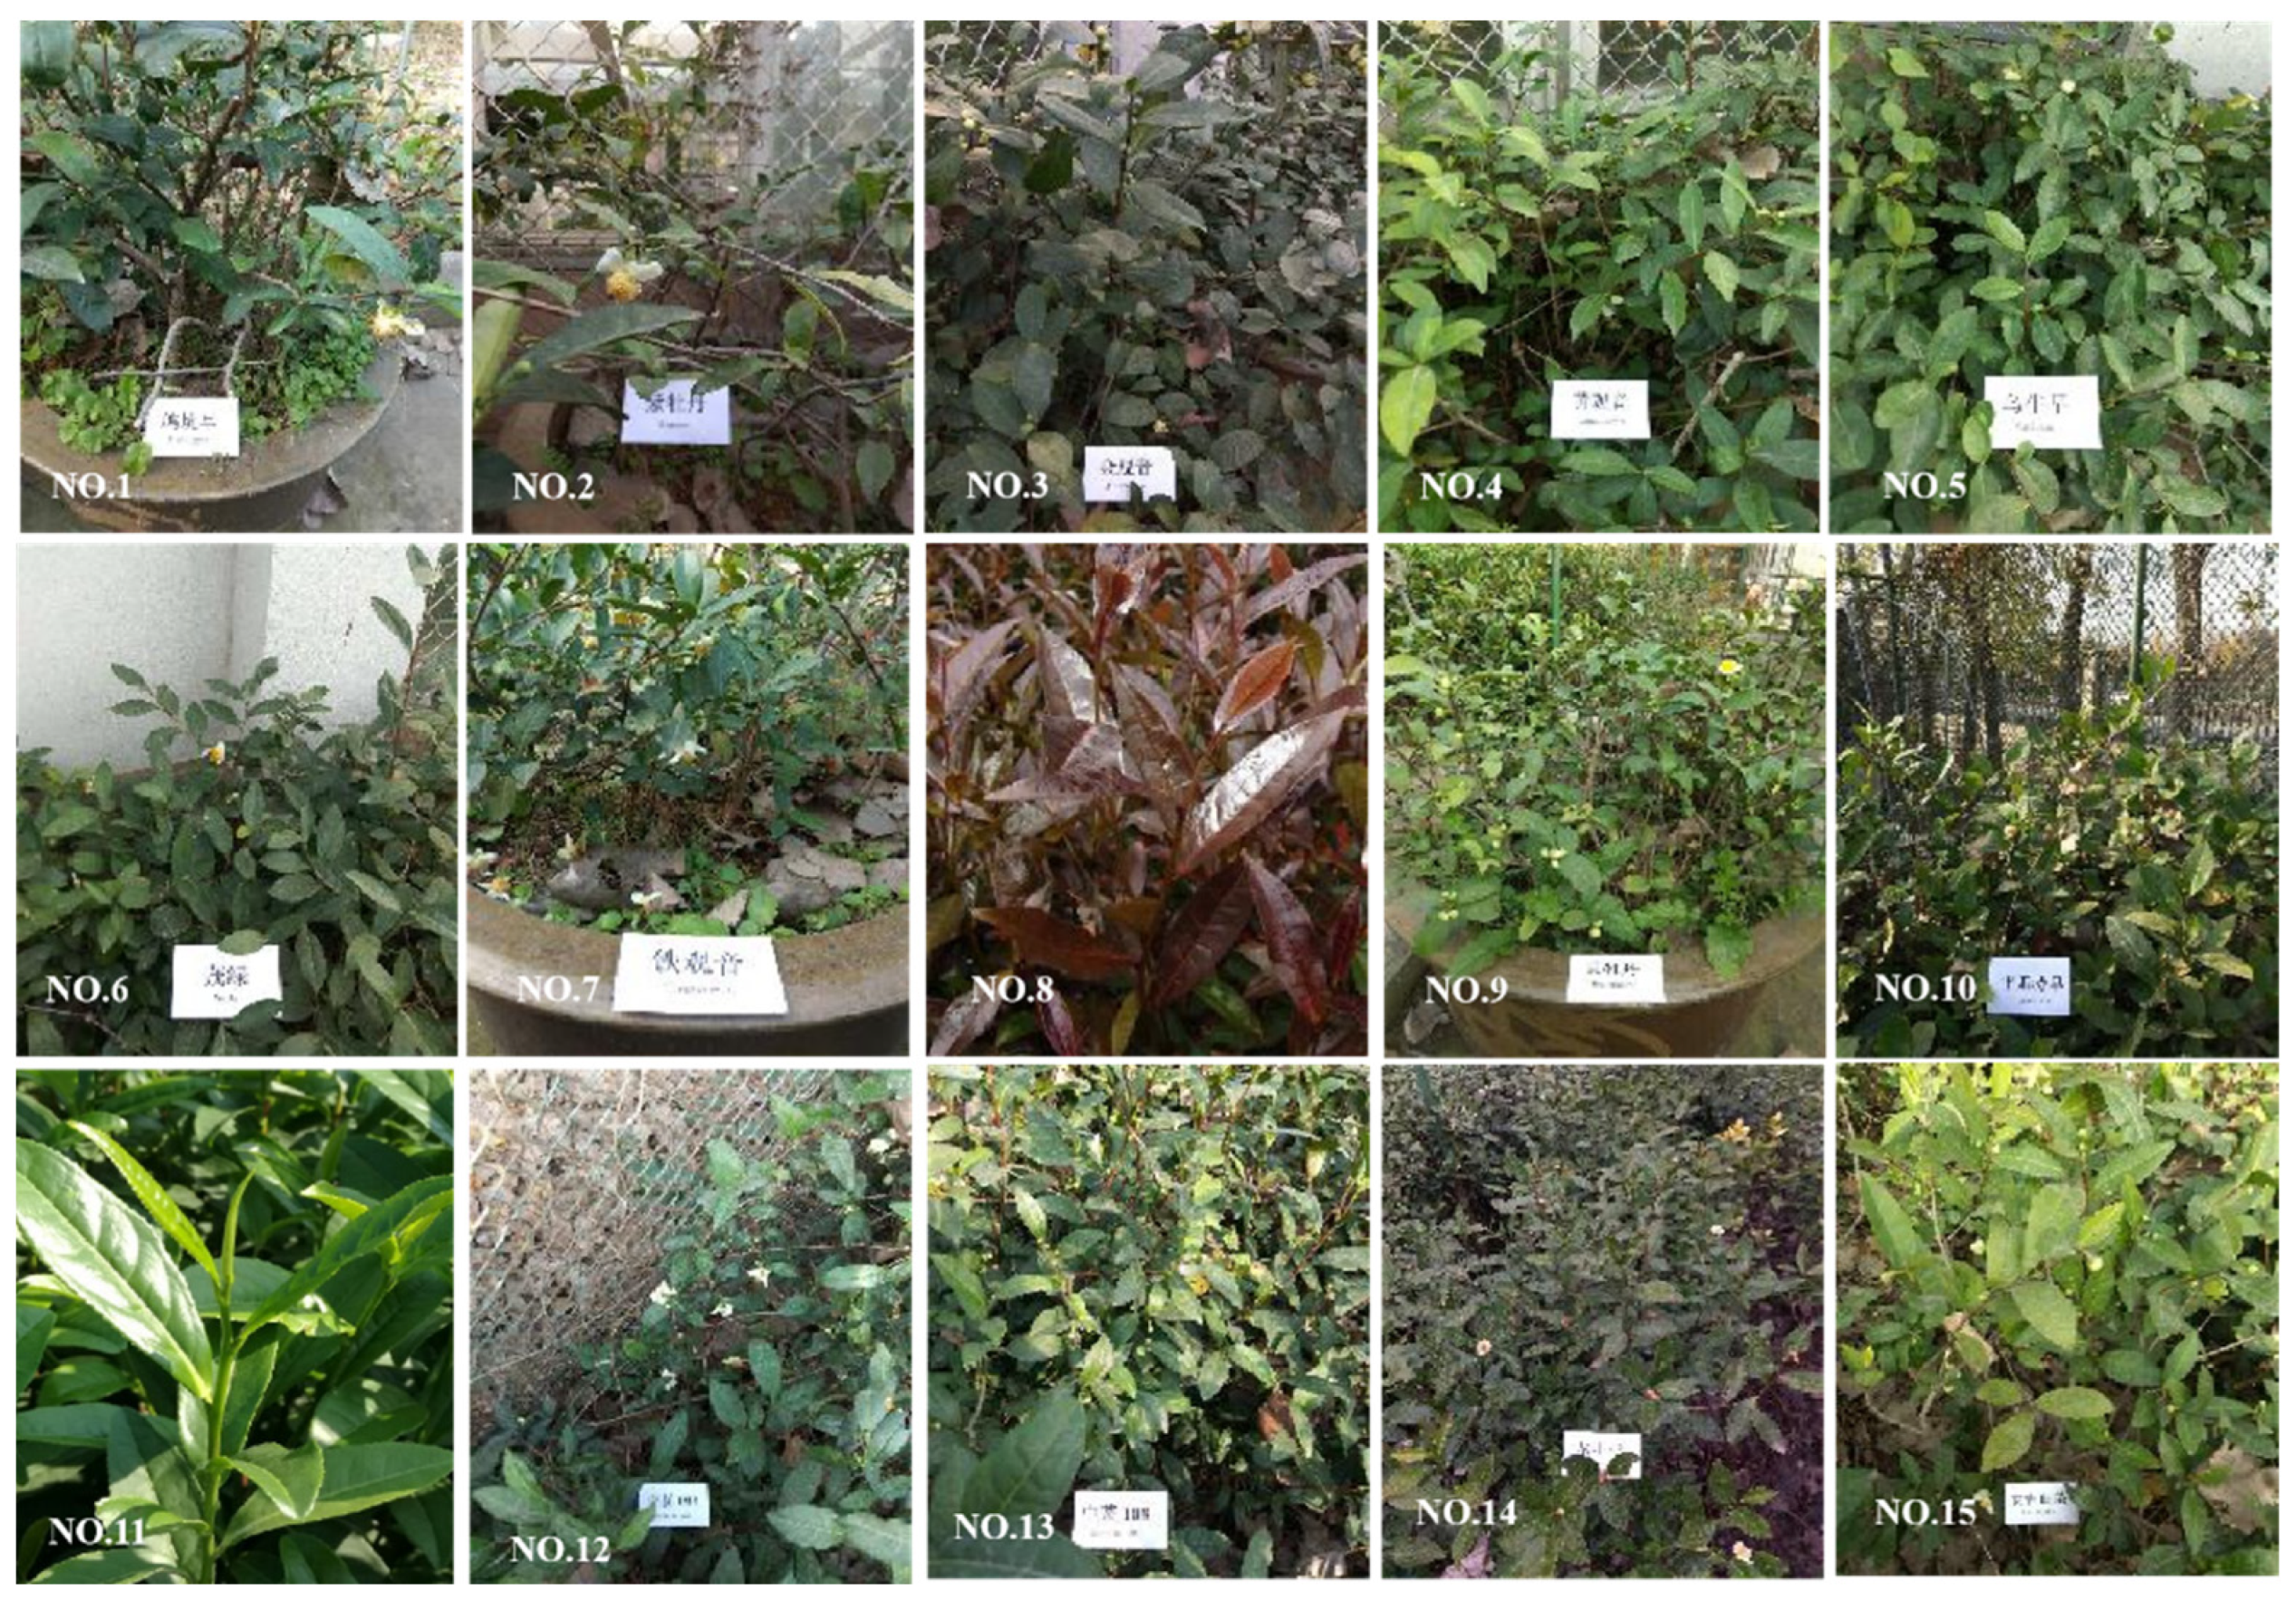
2.1. Sample Collection

Fifteen tea cultivars from the experimental tea garden in Hangzhou, Zhejiang province, China (30.32° N,120.36° E) were chosen in the present study, including ‘Jiukengzao’, ‘Zimudan’, ‘Mingke 1’, ‘Huangguanyin’, ‘Jiaming 1’, ‘Maolv’, ‘Tieguanyin’, ‘Zijuan’, ‘Huangmudan’, ‘Pingyang Tezao’, ‘Longjing Changye’, ‘Zhongcha 102’, ‘Zhongcha 108’, ‘Longjing 43’, and ‘Baiye 1’ (Figure 1).
Tea plants for each cultivar were cultivated in a single row, with a length of 20 m. The age of all tea plants was 11 years old. The management practices such as plucking, pruning, and fertilization were the same. In this field, the average annual temperature is 18.7 °C, the maximum temperature is 39.9 °C, the average annual rainfall ranges between 1100 mm and 1600 mm, the annual frost-free period is over 300 days, the average annual sunshine is 1400 h, and the average annual relative humidity is 71%. The information of air temperature, air quality index, and amount of precipitation at different times in the experimental area was shown in Table S2.
Fresh tea leaves were collected from 15 tea cultivars on 15 November 2020 and on 15 January, 15 March, 15 May, 15 July, and 15 September 2021, respectively. For each date, two groups comprising of the fifth and sixth mature tea leaves were collected from the upper and lower parts of the same tea plant, respectively. About 20 g of fresh tea leaves were collected for each group and then transferred into glass bottles. All samples were ground into powders, sealed in a clean glass bottle respectively, and then stored in a freezer at −20 °C for further usage.

2.2. Reagents and Standards for PAEs

Analytical standards of DMP (99.9%), DEP (98.8%), DBP (99.4%), DiBP (99.9%), and DEHP (99.5%) were purchased from Dr. Ehrenstorfer GmbH (Augsburg, Germany). Optima GC–MS grade toluene, acetonitrile, and n-hexane were purchased from Tedia Co., Inc. (Fairfield, OH, USA). Analytical grade sodium chloride was purchased from Sinopharm Chemical Reagent Co., Ltd. (Shanghai, China). Solid-phase extraction (SPE) glass columns (CARB/NH2, 1000 mg/6 mL) were purchased from Dikma Technologies Inc. (Beijing, China).

2.3. Preparation of the Mixed Standard Stock Solution

PAEs are generally colorless liquids with a density of approximately 1 g/mL. To prepare the mixed standard stock solution, equal amounts (100 μL) of DMP, DEP, DiBP, DBP, and DEHP standards were pipetted into a 100 mL volumetric flask and accurately diluted with n-hexane to a final concentration of 1000 μg/L. The mixed standard stock solution was stored at −20 °C until further analysis.
The matrix-matched standard working solutions were freshly prepared by serially diluting the mixed standard stock solution with the blank sample to final concentrations of 0, 1, 5, 10, 20, 50, 100, 200, 500, and 1000 μg/L. These solutions were used to construct the standard working curve.

2.4. Extraction of PAEs from Fresh Tea Leaves

The method for the analysis of PAEs was similar to the procedure of our previous study [11], with slight modifications. Aside from that, single-factor experiments and response surface design methodology were employed to optimize the extracting parameters of SPE technology, aimed at obtaining a high yield of PAEs from tea. Briefly, 2.00 g of ground tea samples were accurately weighed into a glass centrifuge tube, followed by the addition of 2.00 g of sodium chloride and 20 mL of n-hexane. The samples were mixed using a vortex shaker for 1 min, then sonicated in a sonicating waterbath for 3 h (100 kHz, 40 °C) and placed in a waterbath of 40 °C for 12 h. The mixture was then centrifuged at 3000 r/min at 10 °C for 2 min, and finally, the supernatant was collected. The supernatant was concentrated to dryness by rotary evaporation and then dissolved with 8 mL of acetonitrile-toluene (3:1, v/v) mixture. Finally, the solution was transferred into a glass SPE column to collect the eluate. The glass SPE column was pre-activated with 10 mL of acetonitrile-toluene (3:1, v/v) mixture before use. Subsequently, another 22 mL of acetonitrile-toluene (3:1, v/v) was added to the column, and the second eluate was collected and combined with the previous one. The combined eluates were concentrated to dryness by rotary evaporation and then cooled and reconstituted with 1 mL of n-hexane. The final extracts were vortexed and filtered (0.45 µm cellulose acetate syringe filters) for GC–MS analysis.

2.5. GC–MS Analysis

Samples were analyzed by gas chromatography–mass spectrometry (GC–MS) using an Agilent 6890A GC, coupled with an MSD 6975 (Agilent Technologies, Wilmington, DE, USA) and a HP-5MS quartz capillary column (30.0 m × 250 µm × 0.25 µm). The method of GC–MS operation was performed as in the previous study [11]. The injector volume was 1 µL in splitless mode, and the inlet temperature was set to 280 °C. Helium gas (99.999% pure) was used as the carrier gas at a constant flow of 1.0 mL/min. The temperature program was initiated at 80 °C for 1 min, increased to 140 °C at 5 °C/min (2 min holding time), raised to 170 °C at 3 °C/min (2 min holding time), and ramped to 280 °C at 5 °C/min and held for 1 min. The solvent delay was set to 5 min. The EI source temperature and ionization energy were 230 °C and 70 eV.

2.6. Quality Assurance and Quality Control

All glassware used in this experiment was washed clean; rinsed successively with double-distilled deionized water, methyl alcohol, and n-hexane; dried at 400 °C for 4 h; and finally cooled and stored until further use. The glassware was re-rinsed with GC–MS grade n-hexane three times before use. Furthermore, a solvent (n-hexane) blank was run with every 10 samples to evaluate the possible cross contamination [12]. Before a sample run, 1 μL of n-hexane was injected into the GC–MS to investigate the background noise, based on which continuous adjustments of the GC–MS apparatus were conducted, until the background baseline remained stable.
The external standard method was used to determine PAEs content in tea samples. Matrix-matched standard working solutions were prepared, with concentrations ranging from 1 µg/L to 1000 µg/L, then applied for GC–MS analysis to construct the standard working curves of the five PAEs. The total ion chromatograms of the five PAEs and their mass spectrometry characteristics are shown in Figure S1 and Table S3, separately. The correlation coefficients varied from 0.9910 to 0.9963, indicating a good linearity of calibration curves (Table S3). A higher value of R2 indicates a better fit for the model [13]. On the basis of the National Standard GB/T 27417-2017 [14], the limit of detection (LOD) was defined to be the signal/noise ratio of 3:1, while the limit of quantification (LOQ) was defined to be the signal/noise ratio of 10:1. In this study, the LOD values for the five PAEs varied from 0.2 to 0.4 µg/kg, and the LOQ values varied from 0.67 to 1.32 µg/kg.
At a confidence coefficient of 95%, the relative standard deviations of ten determinations below 14% could be used for quantitative analysis of PAEs, and those between 14% and 43% could be used for qualitative analysis, while those exceeding 43% indicate PAEs could not be detected [15]. PAEs levels were determined both in the blank sample and tea samples for quality assurance and quality control. According to the linear range of the five PAEs and the dilution ratio of the sample pretreatment, the mixed standard solutions at three concentrations (100, 500, and 1000 µg/L) were added to the blank samples. Each concentration measurement was conducted in triplicate. The results are presented in Table S3. As shown, the recovery rates of the five PAEs from the tea samples ranged from 81.58% to 98.24%, and the relative standard deviations of the five PAEs ranged from 3.64% to 8.25%, indicating an acceptable precision for the quantitative analysis of PAEs [15]. Subsequently, the matrix effects of the five PAEs were evaluated by the ratio of the ion response strength of the matrix-matched standard working solution to the ion response strength of the solvent standard solution [16]. An ME higher than 1 meant enhancement, whereas an ME less than 1 suggested suppression. The matrix-matched standard solution, added with 100 µg/L of mixed standard solution, was used to compensate the MEs. Results showed that matrix effects varied from 1.02 to 1.15, indicating a relatively weak interference from matrix effects.

2.7. Statistical Data Analysis

Data processing system (DPS) software (Hangzhou Ruifeng Information Technology Co., Ltd., Hangzhou, Zhejiang, China) was used for one-way analysis of variance and Fisher’s least significant difference method (LSD) [17]. Cluster analysis used Euclidean distance as the clustering distance, based on the sums of squared deviations [18]. Pearson correlation analysis was conducted to assess the relationship between five PAEs contents in fresh tea leaves and environmental factors. Origin 2018 software (OriginLab, Northampton, MA, USA) was used to create heat maps and box plots for PAE levels.

3. Results

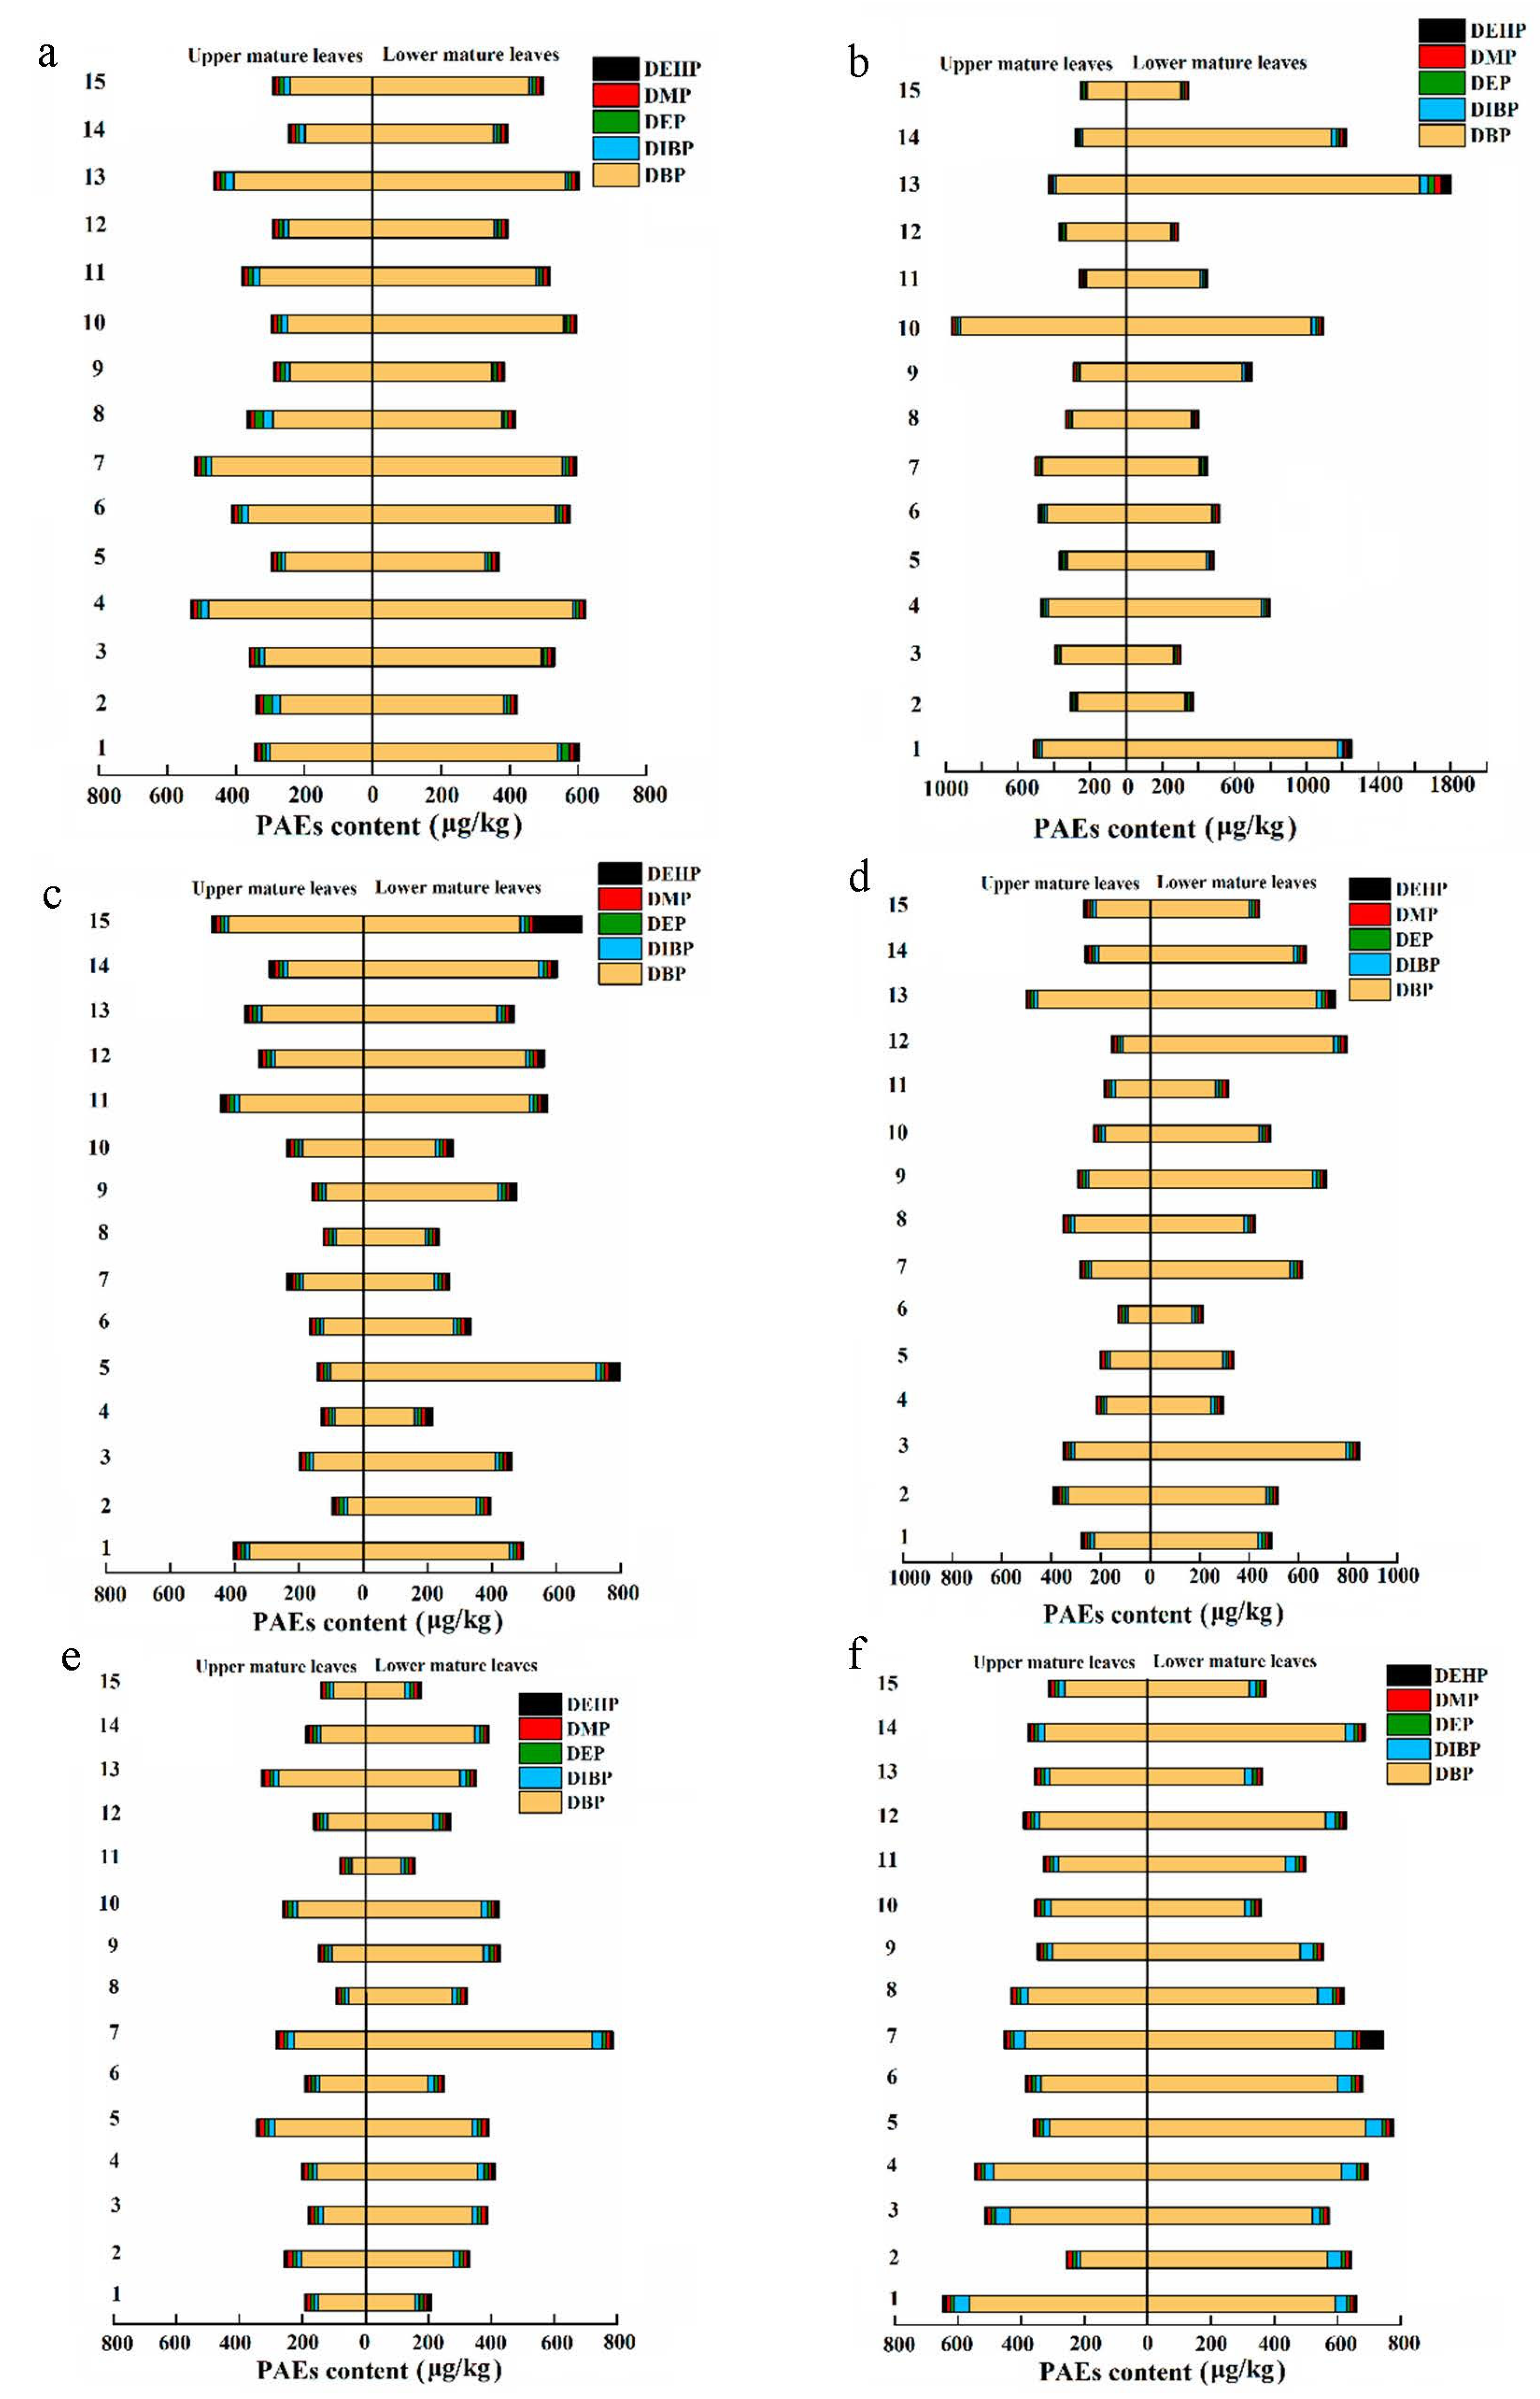
3.1. Distribution of PAEs in Fresh Tea Leaves of 15 Tea Cultivars

Fresh tea leaves of 15 tea cultivars were collected six times from November 2020 to September 2021 and then applied for the determination of PAEs levels, which were converted into dry matter. The PAEs content in fresh tea leaves of 15 tea cultivars is shown in Table 1. DMP, DEP, DiBP, DBP, and DEHP were detected in 15 tea cultivars. The content of PAEs ranged from 78.98 to 1077.59 µg/kg and 404.67 to 1915.01 µg/kg in upper mature leaves and lower mature leaves, respectively. The content of PAEs in lower mature leaves was significantly higher than that in upper mature leaves (p < 0.05). It was obvious that DBP was the predominant congener in both upper mature leaves and lower mature leaves of the 15 tea cultivars, which was followed by DiBP (Figure 2). The fractions of DBP and DiBP accounted for 50% to 94% and 71% to 94%, and for 2% to 13% and 1% to 10% in upper mature leaves and lower mature leaves, respectively.
In terms of PAEs content, these 15 tea cultivars could be classified into three groups. The first group contained the highest average PAEs level (>500 µg/kg) and included ‘Zhongcha 108’ and ‘Jiukengzao’; the second group contained the medium average PAEs levels (400–500 µg/kg) and included six tea cultivars, such as ‘Tieguanyin’, ‘Pingyang Tezao’, ‘Longjing 43’, ‘Huangguanyin’, ‘Mingke 1’, and ‘Jiaming 1’; and the third group contained the lowest average PAEs level (300–400 µg/kg) and included seven tea cultivars, which were ‘Huangmudan’, ‘Zhongcha 102’, ‘Maolv’, ‘Zimudan’, ‘Baiye 1’, ‘Longjing Changye’, and ‘Zijuan’. The average PAEs level in ‘Zhongcha 108’ was the highest (566.45 µg/kg), while that in ‘Zijuan’ was the lowest (344.53 µg/kg), but no significant difference was observed in PAEs levels among these 15 tea cultivars.

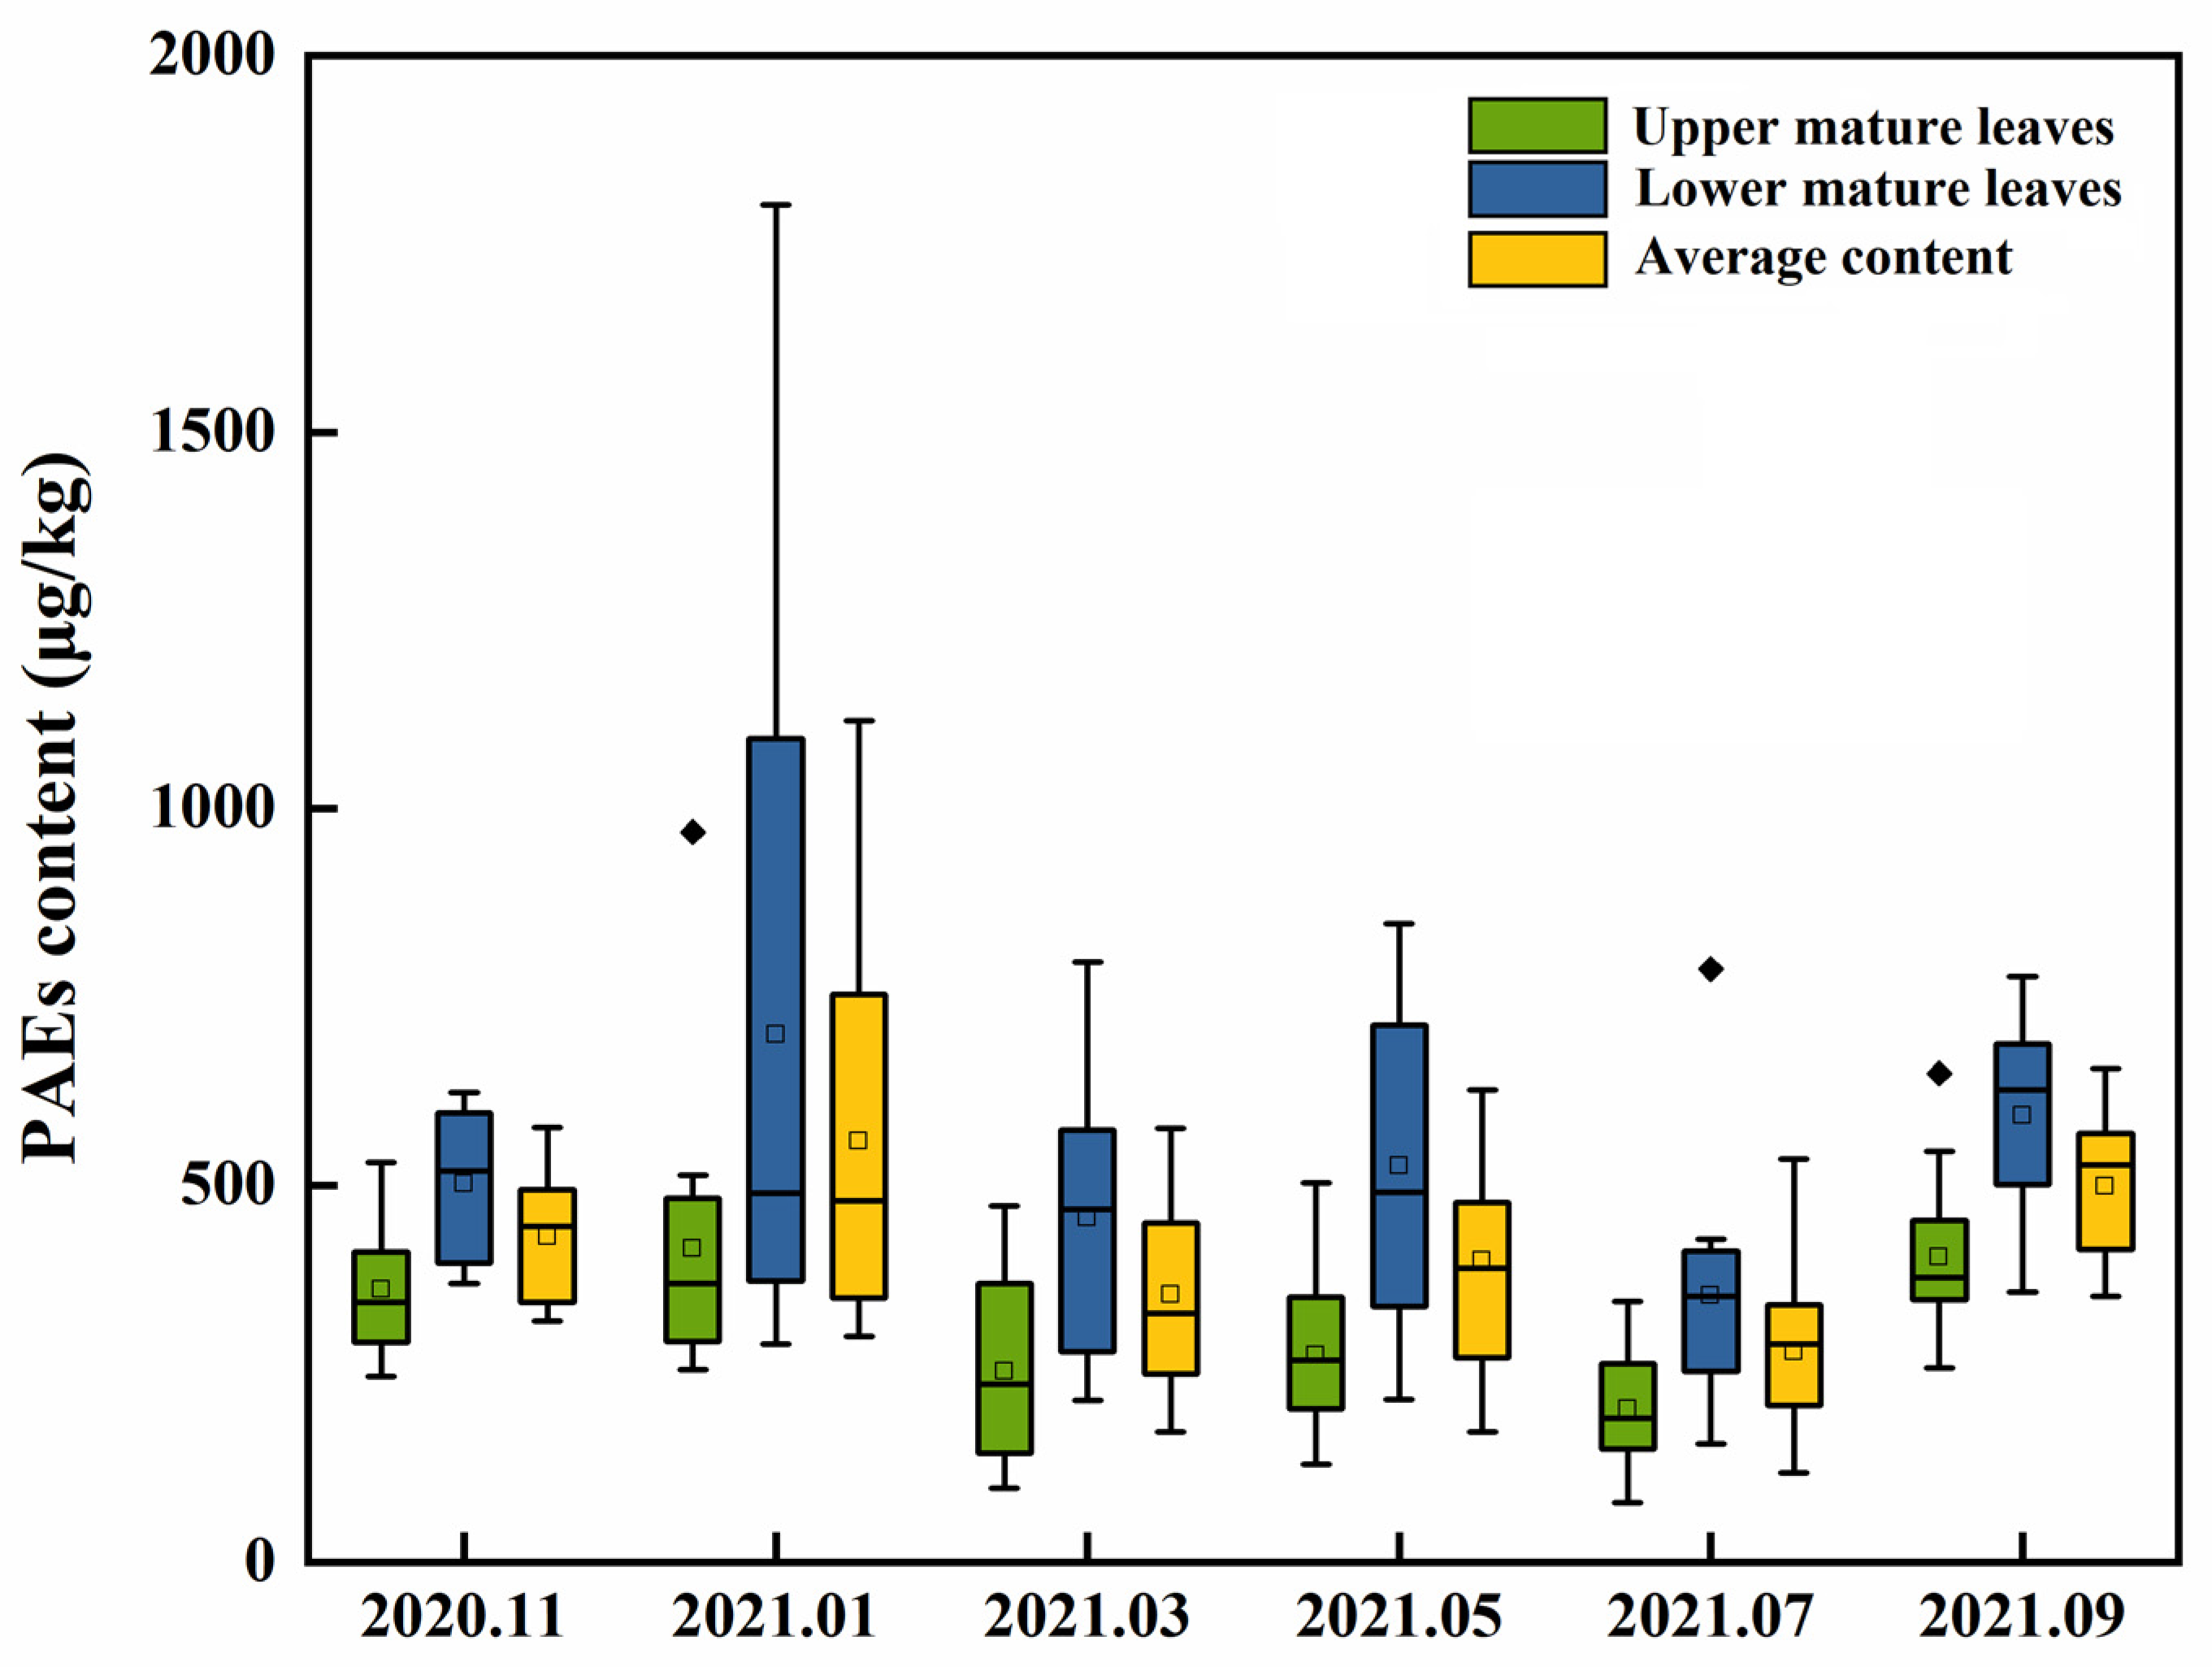
3.2. Seasonal Variation in PAEs Levels of Fresh Tea Leaves from 15 Tea Cultivars

The temporal variations of PAEs from 15 tea cultivars are presented in Figure 2. The content of PAEs was both found to have the lowest values in July, but the highest values were found in January in both upper and lower mature leaves. In addition, PAEs content had another peak value in September. Except for January and September, the content of PAEs in upper and lower mature leaves fluctuated around 273.50 µg/kg and 459.59 µg/kg in the other months, respectively. Comparative analysis revealed that significant differences (p < 0.05) were observed in PAEs levels of fresh tea leaves, which were collected from the upper and lower parts of tea plants in all months (Figure 3). The formation and elongation of new buds and fresh tea leaves exhibited a biological dilution effect on PAEs levels; meanwhile, the new buds and fresh tea leaves from the upper part of the tea plant were plucked almost continuously, which resulted in a lower accumulation of PAEs in fresh tea leaves from the upper part of the tea plant than those from the lower part of the tea plant.
PAEs levels in fresh tea leaves of the 15 tea cultivars presented increasing trends from spring to winter, except for summer, when PAEs content was the lowest (Figure 3). The average monthly PAEs levels in the 15 tea varieties ranged from 278.77 to 558.52 µg/kg. The lowest average PAEs level of 278.77 µg/kg was detected in July, while the highest average PAEs level of 558.52 µg/kg was detected in January. Significant differences were observed in PAEs levels of fresh tea leaves among three seasons, namely spring (March), autumn (September), and winter (January), but no significant differences in PAEs levels were observed in spring and summer (July). As shown in Figure 3, the PAEs level of fresh tea leaves in winter was the highest, whereas that in spring was lower, which might be due to the formation and elongation of new buds and leaves in the spring.
In recent years, the heat map approach has been widely used as a kind of statistical approach, which could integrate large data and transform them into visualizing values in the cells by the use of a color gradient. The density and frequency of data could be easily obtained from the heat map. The heat map showed PAEs levels in the fresh tea leaves of the 15 tea cultivars collected at the same time (Figure 4). Taking the data collected in March as an example, PAEs levels in ‘Baiye 1’, ‘Longjing Changye’, ‘Jiaming 1’, and ‘Zhongcha 102’ were higher than those in the other tea cultivars, which were represented by the red color in the heat map (Figure 4). PAEs levels in ‘Jiaming 1’ and ‘Zhongcha 102’ were lower than those in ‘Baiye 1’ and ‘Longjing Changye’, which were indicated by the lighter color in the heat map. In addition, Figure 4 also revealed the PAEs levels of fresh tea leaves from the same cultivars during different seasons. The PAEs content of fresh tea leaves was generally lower in the spring and summer (March, May, and July) and higher in autumn and winter (September, November, and January). Significant differences were analyzed in PAEs levels of the 15 tea cultivars in spring (March), summer (July), autumn (September), and winter (January). Except for eight tea cultivars that had no significant differences in the four seasons, namely ‘Zimudan’, ‘Mingke 1’, ‘Jiaming 1’, ‘Tieguanyin’, ‘Huangmudan’, ‘Zhongcha 102’, ‘Zhongcha 108’, and ‘Longjing 43’, the PAEs content of the other cultivars was generally lower in the summer (July).

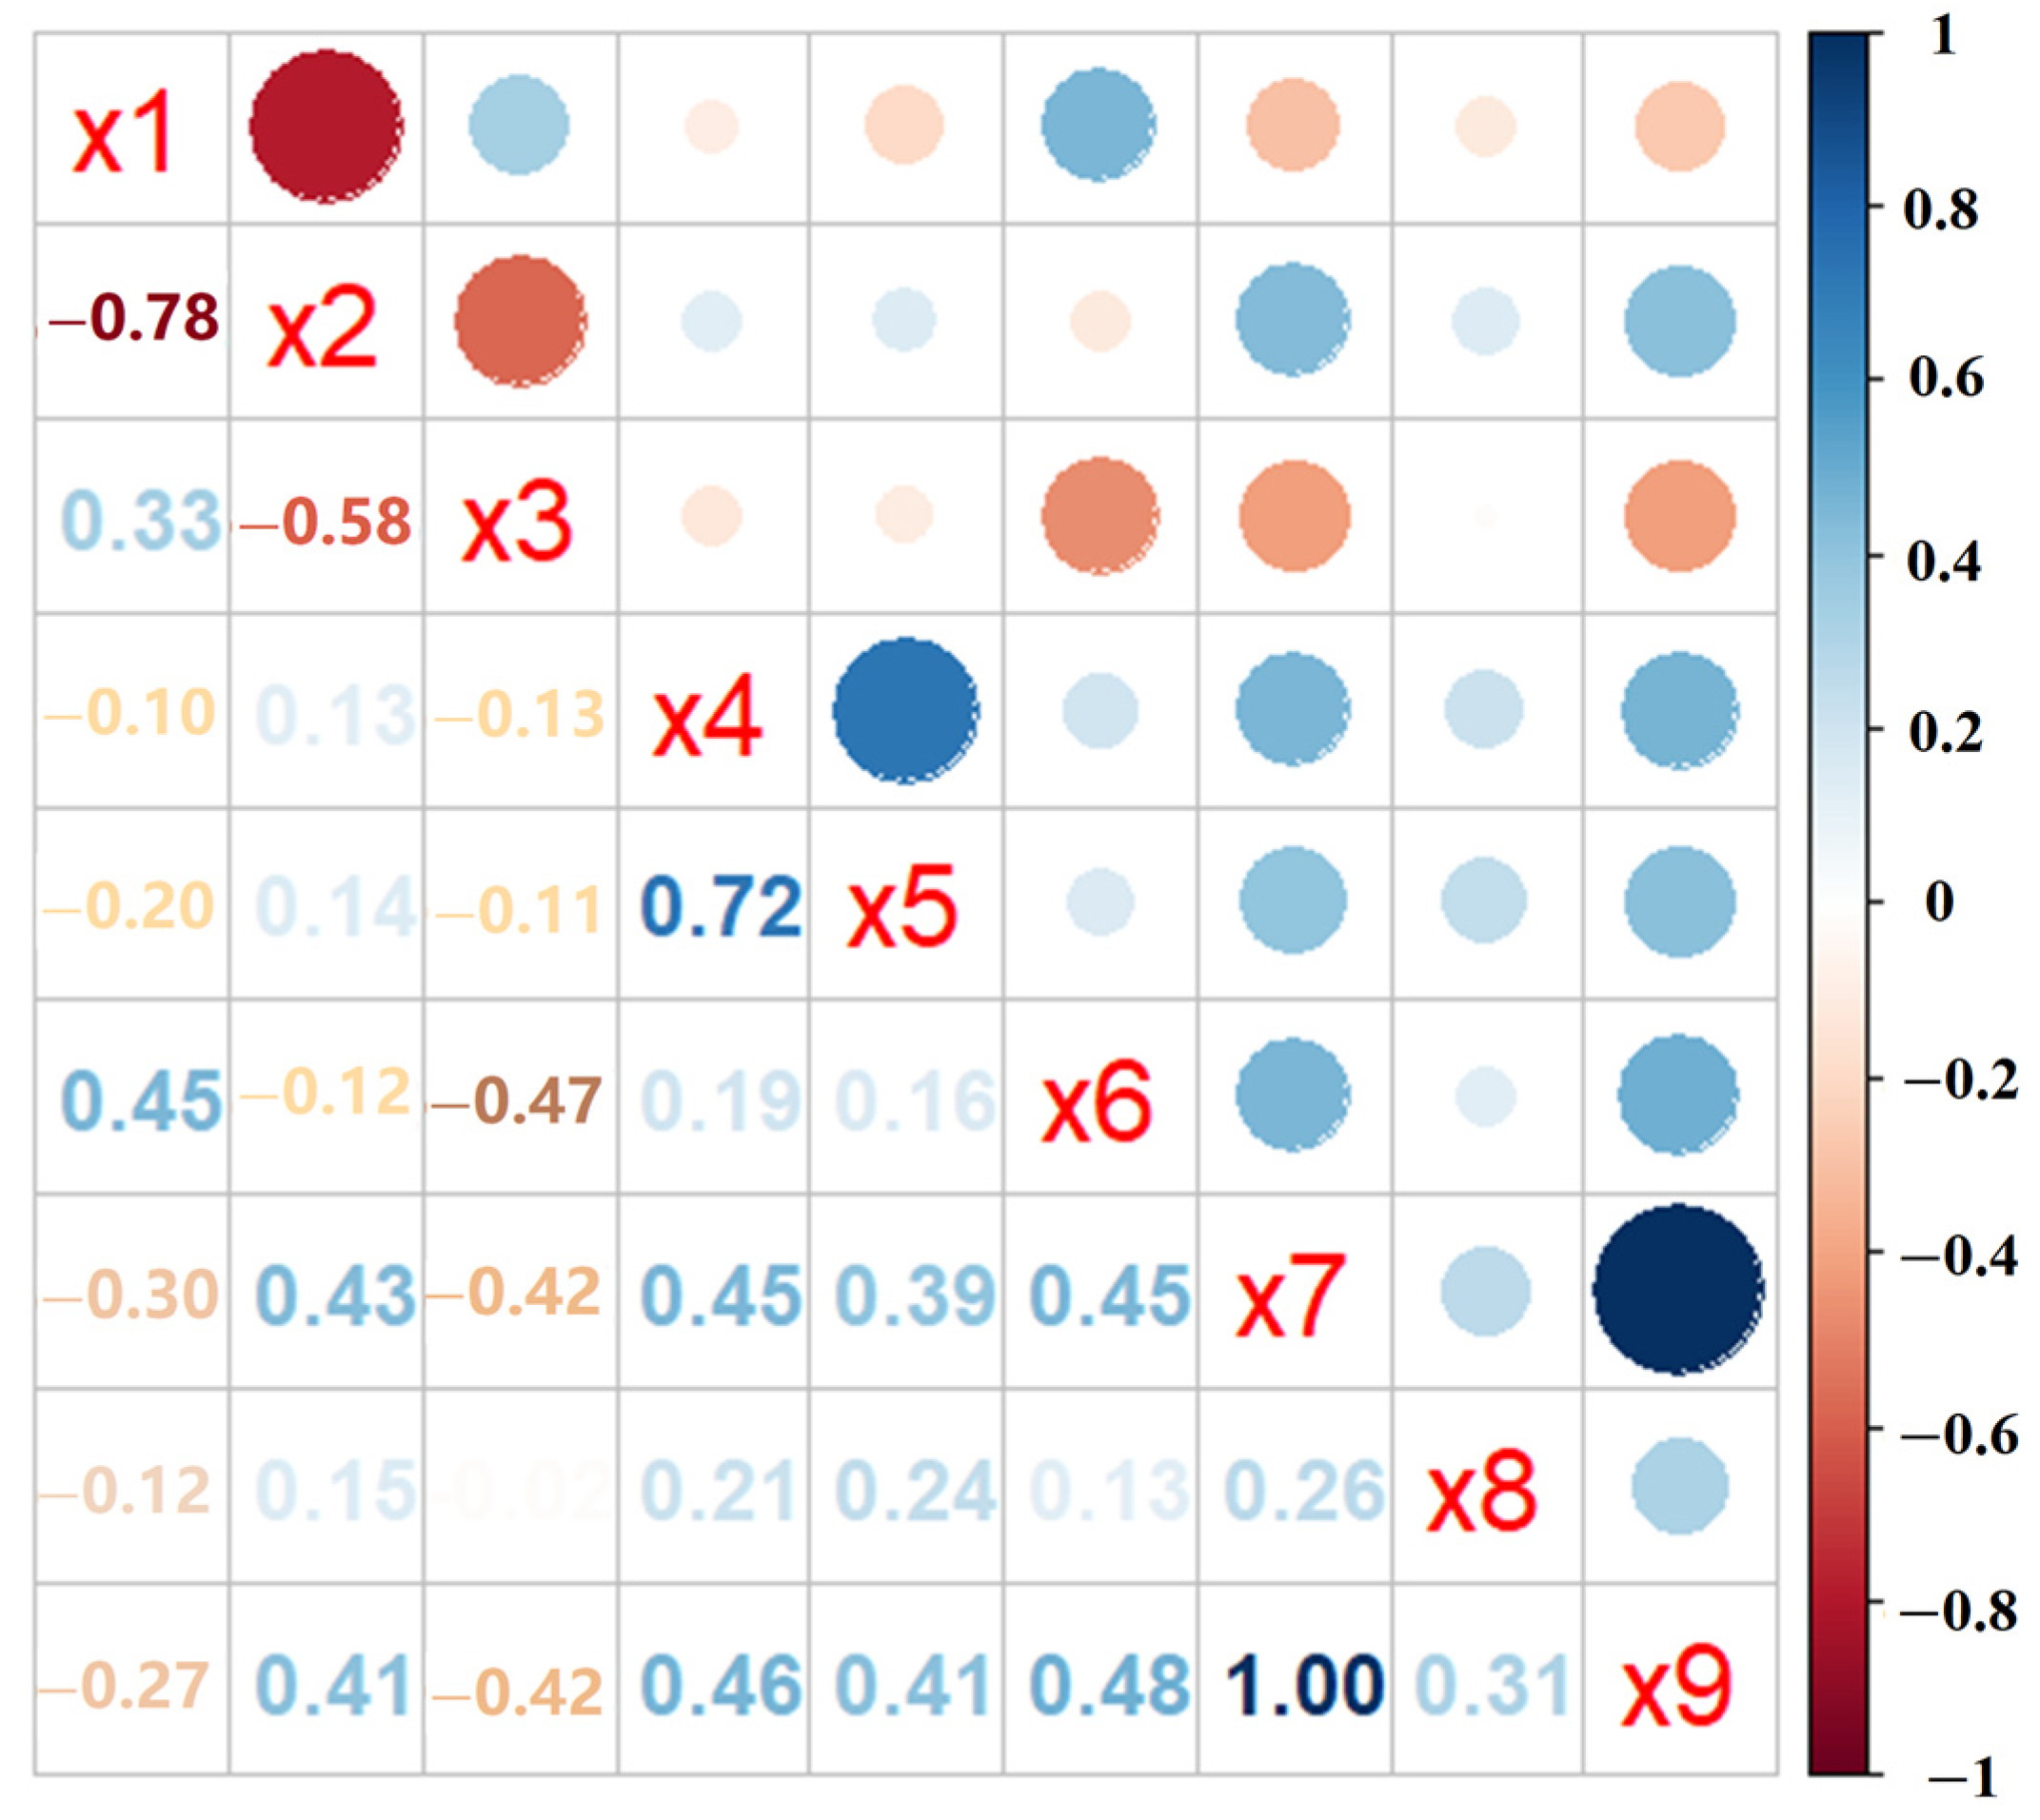
3.3. Correlation Analysis of the five PAEs Content in Fresh Tea Leaves and Environmental Factors

Temporally, the PAEs of tea plants had the highest fractions in the winter and the lowest fractions in the summer. Previous studies revealed that PAEs were associated with temperature [19,20]. Therefore, the correlation analysis was conducted between the PAEs content of fresh tea leaves and environmental factors such as air temperature, air quality index, and amount of precipitation, as well as the content of five PAE congeners (Figure 5). The results represented significantly negative correlation (p < 0.01) between PAEs and air temperature and amount of precipitation, but significantly positive correlation between PAEs and air quality index (p < 0.01). In addition, there were positive correlations among these five PAE congeners in fresh tea leaves. DBP and the other four PAE congeners had significantly positive correlation (p < 0.01), while DEP was significantly positively correlated with DMP (p < 0.01) and DEHP (p < 0.05). These results indicated that these five PAE congeners might occur simultaneously in the tea plant.

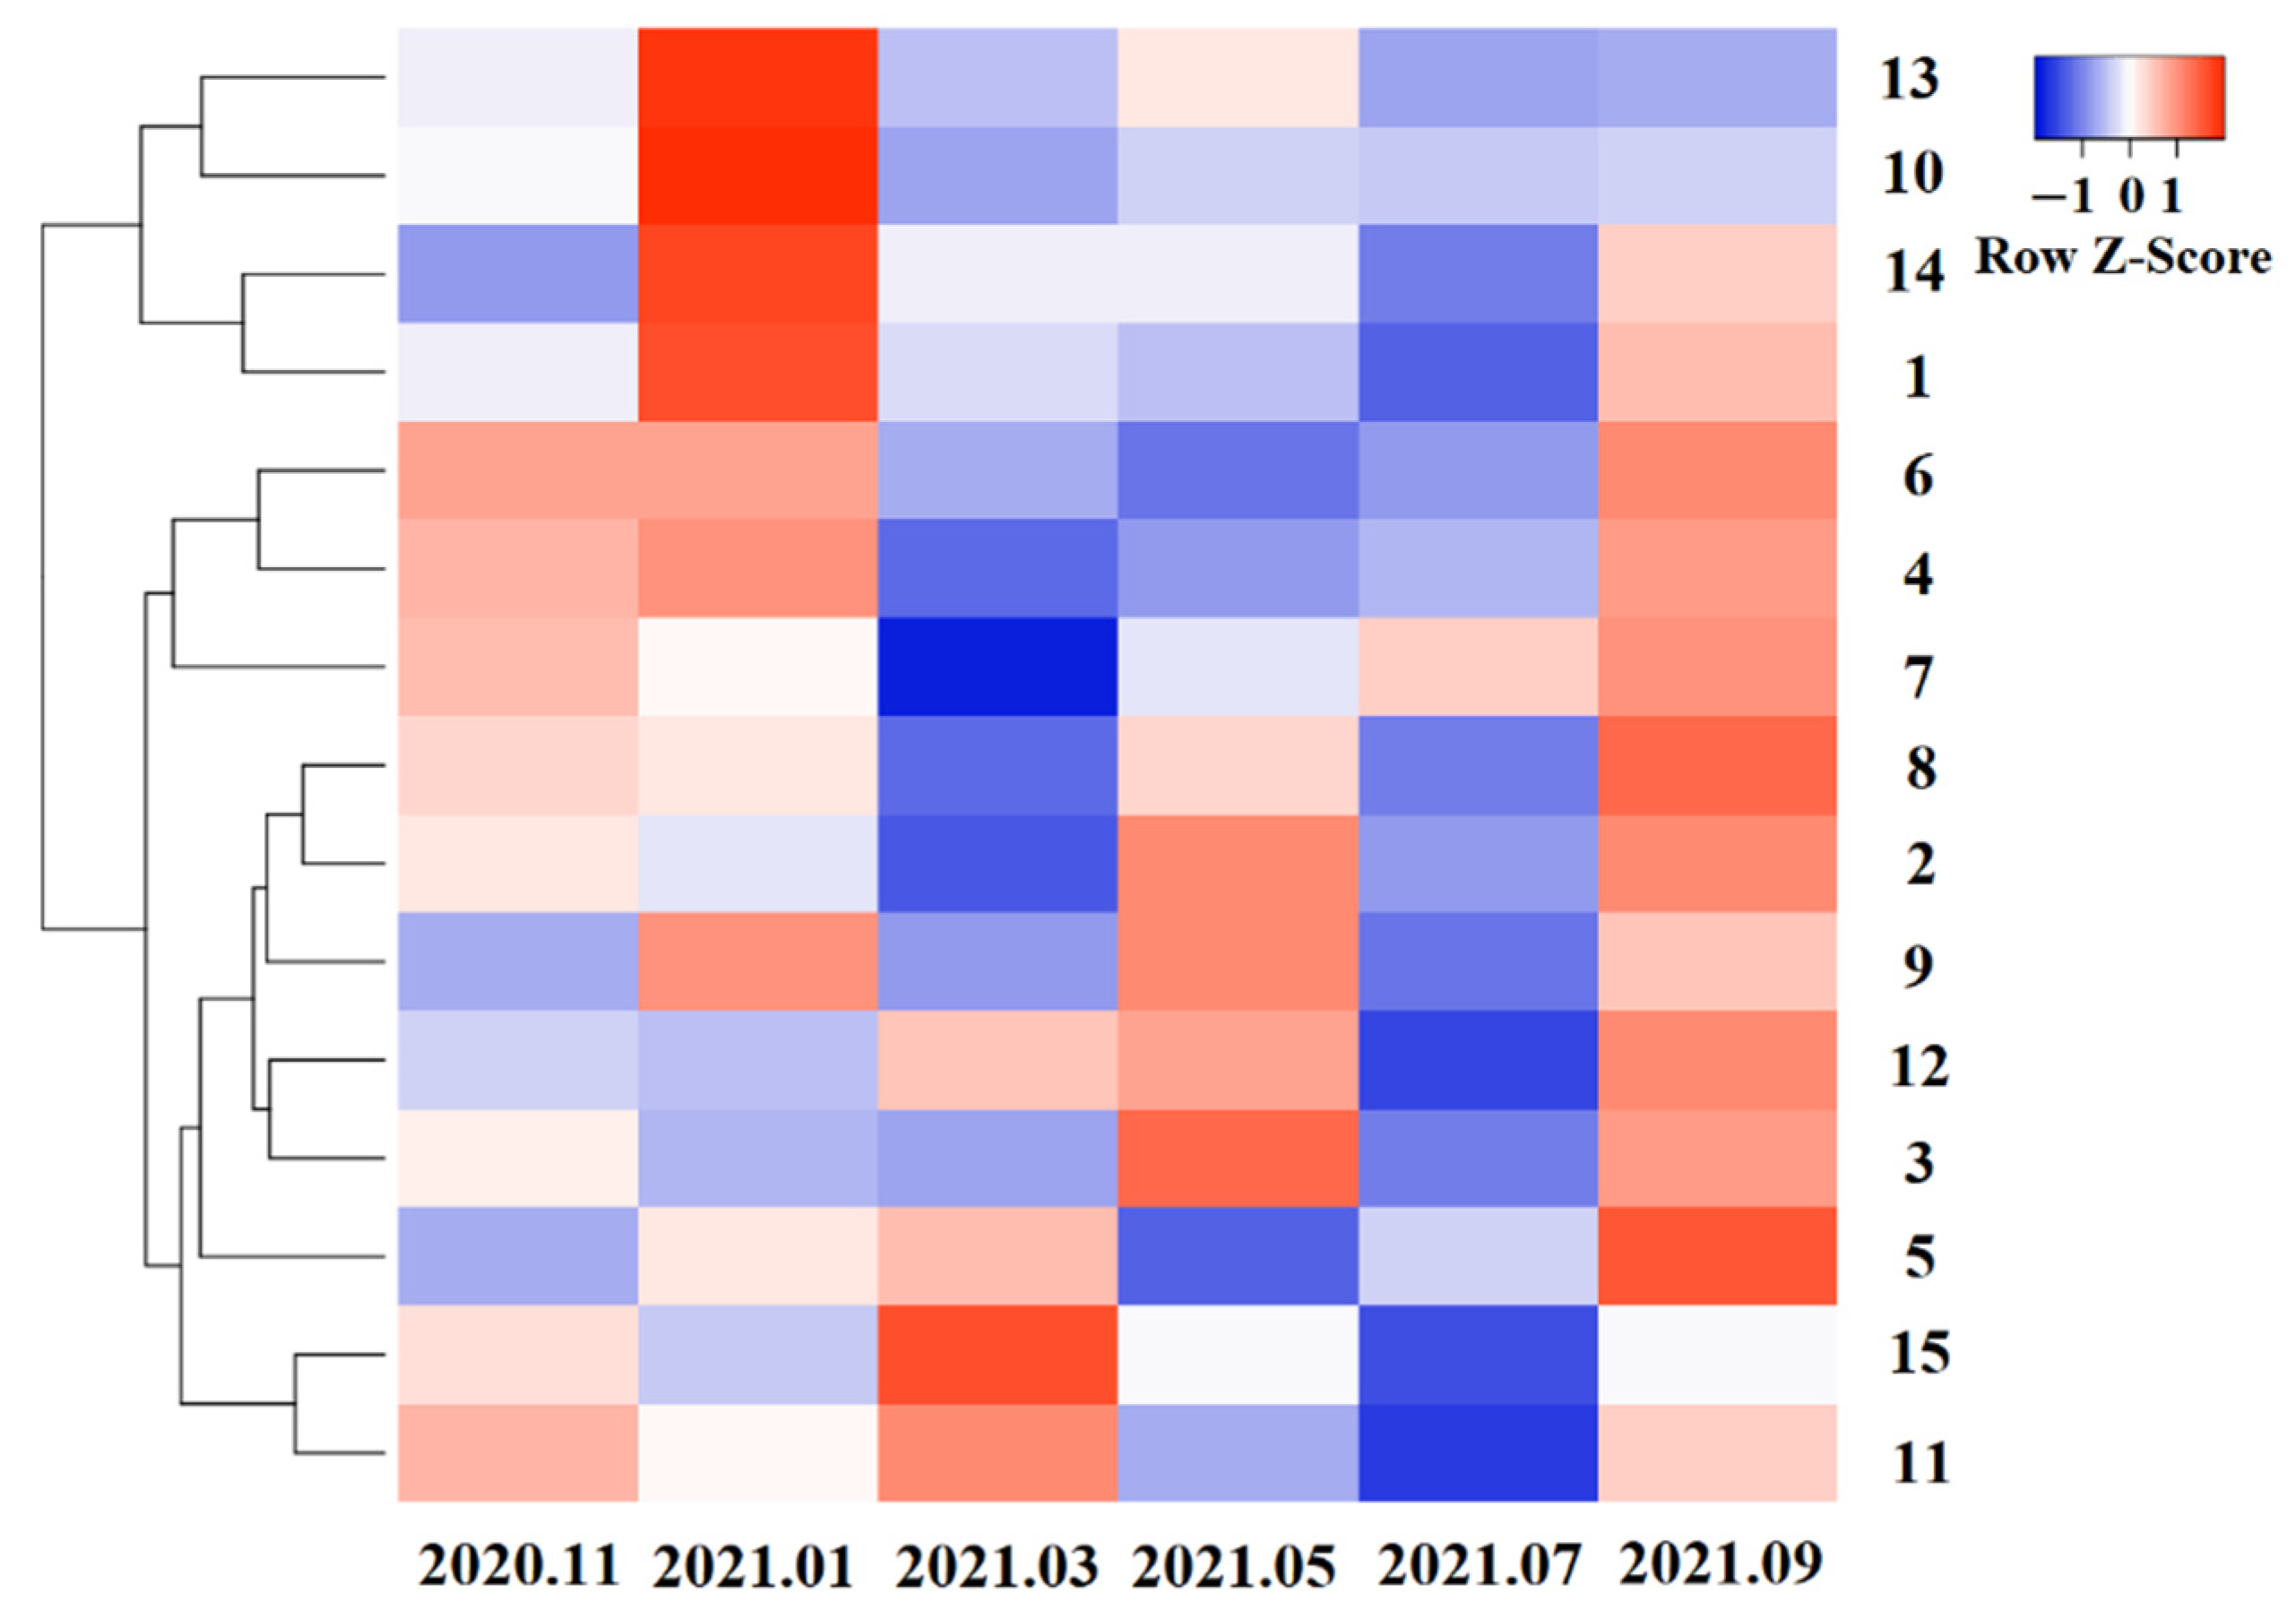
3.4. Systematic Cluster Analysis of PAEs Content from 15 Tea Cultivars

In a bid to further reduce the risk of PAEs in tea, cluster analysis was carried out on 15 tea cultivars in order to obtain tea cultivars with low accumulation of PAEs. The cluster analysis results of the PAEs content from 15 tea cultivars are shown in Figure 4. The results showed that the 15 tea cultivars could be clearly classified into two major categories: ‘Jiukengzao’ (No.1), ‘Pingyang Tezao’ (No.10), ‘Zhongcha 108’ (No.13), and ‘Longjing 43’ (No.14) could be grouped into one category (high accumulation), and the remaining tea cultivars could be grouped into a second category. The content of PAEs in the four tea cultivars mentioned above ranged from 200.58 to 1116.84 µg/kg, with median values of 358.11 to 476.22 µg/kg. The remaining tea cultivars could be classified into two subcategories. ‘Huangguanyin’ (No.4), ‘Maolv’ (No.6), and ‘Tieguanyin’ (No.7) could be classified into a small subcategory (medium accumulation). The content of PAEs in three tea cultivars ranged from 172.95 to 636.88 µg/kg, with median values of 372.08 to 507.39 µg/kg. The other tea cultivars, namely ‘Zimudan’ (No.2), ‘Mingke 1’ (No.3), ‘Jiaming 1’ (No.5), ‘Zijuan’ (No.8), ‘Huangmudan’ (No.9), ‘Longjing Changye’ (No.11), ‘Zhongcha102’ (No.12), and ‘Baiye 1’ (No.15), could be classified into a large subcategory (low accumulation). The content of PAEs in eight tea cultivars ranged from 118.03 to 599.73 µg/kg, with median values of 349.08 to 399.30 µg/kg. Among 15 tea cultivars, three types with high, medium, and low accumulation accounted for 26.7%, 20%, and 53.3%, respectively.

4. Discussion

In the present work, five phthalate esters in fresh tea leaves were enriched and purified by solid-phase extraction, then subsequently analyzed by GC–MS qualitatively and quantitatively. Due to the complex matrix of tea, which is rich in tea polyphenols, caffeine, pigments, and other compounds, the accuracy and precision of the results are affected. Therefore, the impact of the matrix effect must be evaluated in the detection process and compensated by some measures. The isotope internal standard method is considered the most ideal compensation method, which can greatly reduce the matrix effect of the target analytes [21]. Yarita et al. [22] evaluated the impact of the matrix effect in GC–MS quantification of pesticides in food using the corresponding isotope internal standards and found that matrix-matching of the calibration solution was required for very accurate quantification, even if isotope internal standards were used for calibration. In addition, the isotope internal standard is expensive and difficult to obtain, and its application is limited. Therefore, the matrix-matched standard curve correction method could be used to compensate. Li et al. [23] also found that the validation of the matrix-matched standard curve increased the recovery of veterinary drugs in animal-derived foods, and the interference of its quantitative results was effectively compensated when compared with the isotope internal standard. Qiang et al. [24] made clear the superiority of the matrix-matched standard curve correction method, which can effectively eliminate the influence of the matrix effect on the accuracy of results.
Fifteen tea cultivars that are widely cultivated in the middle and lower reaches of the Yangtze River were chosen for the present study, including ‘Jiukengzao’, ‘Zimudan’, ‘Mingke 1’, ‘Huangguanyin’, ‘Jiaming 1’, ‘Maolv’, ‘Tieguanyin’, ‘Zijuan’, ‘Huangmudan’, ‘Pingyang Tezao’, ‘Longjing Changye’, ‘Zhongcha 102’, ‘Zhongcha 108’, ‘Longjing 43’, and ‘Baiye 1’. Fresh tea leaves of the fifteen tea cultivars were collected at different times of the year and then were applied for the detection of PAEs levels. Results showed that PAEs existed in fresh tea leaves both from the upper and lower parts of the tea plants. Previous studies have reported the dynamic changes of PAEs levels in tea products and tea infusion, but little information is available concerning the dynamic changes in the PAEs levels of fresh tea leaves and the difference in PAEs levels among different tea cultivars. PAE levels in all tea cultivars fluctuated across the four seasons, indicating that tea plants might absorb PAEs from the soil and air.
PAEs levels in fresh tea leaves gradually increased from spring to winter, except for summer, when PAEs content was the lowest. In spring, the dormant basal buds would sprout and grow up to mature tea leaves, which can absorb PAEs, resulting in the increased accumulation of PAEs in fresh tea leaves. In the lower part of tea plants, the fresh tea leaves possessed higher maturity and usually would not be picked, thus retaining higher PAE levels than those in the upper part of tea plants.
Although these 15 tea cultivars were cultivated in the same environment, three types of tea cultivars with high, medium, and low accumulation were obtained. ‘Zhongcha 108’ contained the highest PAEs level, and ‘Zijuan’ contained the lowest PAEs level. Due to the increasingly serious PAEs pollution, the cultivation of tea cultivars containing low PAEs levels might exhibit a good repair function for tea garden soil and might reduce the PAEs levels of tea garden soil to the accepted levels [25]. This assumption is worth further investigation. Previous studies have reported that PAEs levels in soil were reduced by 87% when alfalfa (Medicago sativa L.) was cultivated in monoculture, and that beetroot (Beta vulgaris L.) intercropped with alfalfa or other plants exhibited good repair function for PAEs-contaminated soils [26,27,28]. In addition, enzymes in the roots of maize (Zea mays L.), in combination with soil microorganisms, were able to remove more than 50% of PAEs from soils [26,27,28]. In a microbe–plant–soil interaction environment, the rhizosphere microorganisms of some plants could potentially produce enzymes that are highly efficient in degradation of PAEs in the environment [29]. Plants used for phytoremediation of PAEs-contaminated soils have vast potential and feasibility. Therefore, tea plants intercropped with plants that are highly efficient in phytoremediation of PAEs can greatly reduce or eliminate PAEs from the soil in tea gardens.
Previous studies have demonstrated that the main kinds of PAEs that exist in fresh tea leaves are DBP, DiBP, DEHP, DMP, and DEP [8,9,10,11], while the present study indicated that these five PAE congeners were significantly positively correlated with each other, and that these five PAEs might occur simultaneously in the tea plant. Therefore, these five PAEs were chosen to investigate the dynamic changes in PAEs levels of fresh tea leaves. This study also revealed the distinctions of five PAEs levels in fresh tea leaves collected from 15 tea cultivars at different times of the year, and the coefficient of variation for DBP level was the highest. In our tea garden, tea plants were intercropped with plants that possess insect repellent or attractant activity, such as Amorpha fruticosa Linn., Flemingia macrophylla (Willd.) Prain, marigold (Tagetes erecta L.), Tagetes patula L., Mentha canadensis Linnaeus, and lavender (Lavandula angustifolia Mill.) [30,31]. Similarly, these five PAE congeners were also detected in all the intercropping plants, among which DBP was the most common with the highest amount. Meanwhile, PAEs were negatively correlated with air temperature and amount of precipitation (p < 0.01). This correlation phenomenon was consistent with the variation trend of DBP content in the atmosphere around Lake Chaohu with air temperature [19]. The correlation analysis illustrated that PAEs had a significantly positive correlation with air quality index (p < 0.01). This result may be mainly due to the fact that atmospheric PAEs are not only closely related to PM2.5 and PM10 [32], but can also be transported remotely in PM2.5 [33].

5. Conclusions

This work studied the PAEs of fresh tea leaves from 15 elite tea cultivars in the middle and lower reaches of the Yangtze River, China. DMP, DEP, DiBP, DBP, and DEHP were detected in 15 tea cultivars, among which DBP was the main PAEs congener. The content of PAEs ranged from 78.98 to 1077.59 µg/kg and 404.67 to 1915.01 µg/kg in upper mature leaves and lower mature leaves, respectively. PAEs content in lower mature leaves was significantly higher than that in upper mature leaves (p < 0.05) in all months. There was no statistically significant difference in PAEs levels among these 15 tea cultivars. The content of PAEs in fresh tea leaves was found to have the lowest values in July, but the highest values were found in January. PAEs levels in the fresh tea leaves of the 15 tea cultivars presented increasing trends from spring to winter, except for summer. Further, the correlation analysis showed that PAEs had significantly negative correlation with air temperature (p < 0.01). In addition, there was positive correlation between PAEs and air quality index (p < 0.01). Systematic cluster analysis of PAEs revealed that 15 tea cultivars could be clearly classified into three types of fresh tea leaves with high, medium, and low accumulation. Controlling the DBP of fresh tea leaves was an effective and essential strategy to reduce the pollution of PAEs in tea plants, and DiBP should receive more attention in tea plants.

Supplementary Materials

The following supporting information can be downloaded at: https://www.mdpi.com/article/10.3390/agriculture12101516/s1, Table S1: CAS number, molecular weight, and structural formula of five phthalates; Table S2: The information of air temperature, air quality index, and amount of precipitation in experimental area; Table S3: Mass spectrometric information, linearity, recoveries, limits of detection (LOD) and limits of quantification (LOQ), and matrix effect (ME) for five PAEs in tea; Figure S1: The total ion chromatogram of five phthalates in standard solution at 100 µg/L.

Author Contributions

Conceptualization, M.W., Y.T. and B.H.; investigation, J.P. and C.G.; methodology, M.W., Y.T., S.M., J.L. and B.H.; software, M.W., Y.T. and S.M.; validation, M.W., Y.T. and B.H.; formal analysis, M.W., Y.T. and S.M.; writing—original draft preparation, M.W. and Y.T.; writing—review and editing, M.W. and B.H.; funding acquisition, B.H. All authors have read and agreed to the published version of the manuscript.

Funding

This work was supported by the National Natural Science Foundation of China (32072626, 32001910), the Zhejiang Provincial Key Research and Development Program of China (2020C02026), the Zhejiang Provincial Fundamental and Public Welfare of China (LGN20C140005), the Fundamental Research Funds for the Provincial Universities of Zhejiang (2021YW41), Team Scientific Special Commissioner Project of Zhejiang Provincial Department of Science and Technology (2020.1–2024.12, SY-1), and Special Program of Scientific and Technological Innovation for Students of China Jiliang University (2019YW18).

Institutional Review Board Statement

Not applicable.

Informed Consent Statement

Not applicable.

Data Availability Statement

Data sharing not applicable.

Conflicts of Interest

The authors declare no conflict of interest.

References

  1. Wang, Y.X.; Wu, Y.; Chen, H.G.; Duan, P.; Wang, L.; Shen, H.Q.; Lu, W.Q.; Sun, B.; Wang, Q.; Zhang, B.; et al. Seminal plasma metabolome in relation to semen quality and urinary phthalate metabolites among Chinese adult men. Environ. Int. 2019, 129, 354–363. [Google Scholar] [CrossRef] [PubMed]
  2. Wang, Z.P.; Chen, L. Research progress in phthalate removal technology. Appl. Chem. Ind. 2020, 49, 426–429. [Google Scholar] [CrossRef]
  3. Nugegoda, D.; Kibria, G. Effects of environmental chemicals on fish thyroid function: Implications for fisheries and aquaculture in Australia. Gen. Comp. Endocrinol. 2017, 244, 40–53. [Google Scholar] [CrossRef] [PubMed]
  4. Li, M.K.; Ge, J.; Lin, F.; Han, B.Y. Metabolic kinetics and residues of diethyl phthalate (DEP) in tilapia (Oreochromis niloticus × O. aureus). Oceanol. Limnol. Sin. 2011, 42, 137–141. [Google Scholar]
  5. Ge, J.; Li, M.K.; Lin, F.; Zhao, J.; Han, B.Y. Metabolism of phthalic acid esters in Ctenopharyngodon idellus organs and hepatocyte. Oceanol. Limnol. Sin. 2011, 42, 549–553. [Google Scholar]
  6. Ge, J.; Li, M.K.; Lin, F.; Zhao, J.; Han, B.Y. Study on metabolism of n-butyl benzyl phthalate (BBP) and dibutyl phthalate (DBP) in Ctenopharyngodon idellus by GC and LC-MS/MS. Afr. J. Agric. Res. 2012, 7, 1855–1862. [Google Scholar] [CrossRef]
  7. Dai, X.J.; Ge, J.; Li, M.K. Metabolic kinetics and residues of dimethyl phthalate (DMP) in shakehead fish. Chin. J. Vet. Sci. 2011, 31, 77–80. [Google Scholar] [CrossRef]
  8. Liu, P.X.; Chen, H.P.; Gao, G.W.; Hao, Z.X.; Wang, C.; Ma, G.C.; Chai, Y.F.; Liu, X. Occurrence and residue pattern of phthalate esters in fresh tea leaves and during tea manufacturing and brewing. J. Agric. Food Chem. 2016, 64, 8909–8917. [Google Scholar] [CrossRef]
  9. Du, L.P.; Ma, L.J.; Qiao, Y.; Lu, Y.; Xiao, D.G. Determination of phthalate esters in teas and tea infusions by gas chromatography–mass spectrometry. Food Chem. 2016, 197, 1200–1206. [Google Scholar] [CrossRef]
  10. Yin, P.; Liu, X.; Chen, H.P.; Pan, R.; Ma, G.C. Determination of 16 phthalate esters in tea samples using a modified QuEChERS sample preparation method combined with GC-MS/MS. Food Addit. Contam. Part A 2014, 31, 1406–1413. [Google Scholar] [CrossRef]
  11. Tang, Y.Y.; Wang, M.X.; Pan, C.; Mi, S.S.; Han, B.Y. Determination of five phthalate esters in tea and their dynamic characteristics during black tea processing. Foods 2022, 11, 1266. [Google Scholar] [CrossRef] [PubMed]
  12. Wang, Y.; Zhang, Z.H.; Bao, M.J.; Xu, Y.; Zhang, L.J.; Tan, F.; Zhao, H.X. Characteristics and risk assessment of organophosphate esters and phthalates in soils and vegetation from Dalian, northeast China. Environ. Pollut. 2021, 284, 117532. [Google Scholar] [CrossRef] [PubMed]
  13. Shi, N.; Gao, Z.Q.; Chen, C.Y.; Wen, S.Y.; Shu, C.; Tang, H.; Yan, L.L. Simulation and analysis of above-ground dry matter and leaf area index of rice based on Logistic model. J. Northeast Agric. Univ. 2022, 53, 10–18. [Google Scholar] [CrossRef]
  14. GB/T 27417. Comformity Assessment—Guidance on Validation and Verification of Chemical Analytical Methods; [NSPRC] National Standards of the People’s Republic of China: Beijing, China, 2017. [Google Scholar]
  15. Jia, Y.H.; Sun, X.F.; Zhang, F. Determination of LOD and LOQ with relative standard deviation and relative range or ratio of maximum and minimum. Metall. Anal. 2021, 41, 1–12. [Google Scholar] [CrossRef]
  16. Li, H.L. Study on Simultaneous Determination of 24 Veterinary Drug Residues Contained in Animal Derived Foods and the Matrix Effect with QuEChERS-UPLC-MS/MS. Master’s Thesis, Southwest University, Chongqing, China, 2022. [Google Scholar]
  17. Tang, Q.Y. DPS© Data Processing System; Science Press: Beijing, China, 2020; Volume 1, pp. 112–116. [Google Scholar]
  18. Tang, Q.Y.; Tang, R. DPS© Data Processing System; Science Press: Beijing, China, 2020; Volume 2, pp. 734–749. [Google Scholar]
  19. He, Y.; Wang, Q.M.; He, W.; Xu, F.L. Phthalate esters (PAEs) in atmospheric particles around a large shallow natural lake (Lake Chaohu, China). Sci. Total Environ. 2019, 687, 297–308. [Google Scholar] [CrossRef] [PubMed]
  20. Shi, M.; Sun, Y.Y.; Wang, Z.H.; He, G.; Quan, H.X.; He, H.X. Plastic film mulching increased the accumulation and human health risks of phthalate esters in wheat grains. Environ. Pollut. 2019, 250, 1–7. [Google Scholar] [CrossRef]
  21. Wang, L.Q.; He, L.M.; Zeng, Z.L.; Chen, J.X. Progress in matrix effect of veterinary drug residues analysis by high-performance liquid chromatography tandem mass spectrometry. J. Chin. Mass Spectrom. Soc. 2011, 32, 321–332. [Google Scholar]
  22. Yarita, T.; Aoyagi, Y.; Otake, T. Evaluation of the impact of matrix effect on quantification of pesticides in foods by gas chromatography-mass spectrometry using isotope-labeled internal standards. J. Chromatogr. A 2015, 1396, 109–116. [Google Scholar] [CrossRef]
  23. Li, H.L.; Wu, X.Q.; Zhao, B.; Hou, M.L.; Wu, Y.L.; Huang, X.L. Matrix effect in analysis of 24 veterinary drug residues in animal-derived foods by QuEChERS-UPLC-MS/MS. Food Ferment. Ind. 2021, 47, 253–259. [Google Scholar] [CrossRef]
  24. Qiang, S.J.; Liu, Y.R.; Li, G. Influence and correction of solvent standard and matrix standard on pesticide residue detection results. Chin. Agric. Sci. Bull. 2022, 38, 99–106. [Google Scholar]
  25. Wang, X.J. Practical application of phytoremediation technology of contaminated soil. J. Xihua Univ.(Nat. Sci. Ed.) 2019, 38, 65–70. [Google Scholar]
  26. Ma, T.T.; Luo, Y.M.; Christie, P.; Teng, Y.; Liu, W.X. Removal of phthalic esters from contaminated soil using different cropping systems: A field study. Eur. J. Soil Biol. 2012, 50, 76–82. [Google Scholar] [CrossRef]
  27. Wei, L.Q.; Hu, S.B.; Wang, J.J.; Chai, Q.Q.; Liu, J.B.; Wang, M.K.; Shi, C. Phytoremediation of 4 phthalic acid esters in contaminated soil by beet-grass system. J. Agro-Environ. Sci. 2016, 35, 1097–1102. [Google Scholar]
  28. Lu, L.Q.; Ye, C.M. Bioremediation technology of phthalic acid esters in soil. Anhui Agri. Sci. Bull. 2016, 22, 25–26+42. [Google Scholar] [CrossRef]
  29. Teng, Y.; Shen, Y.Y.; Luo, Y.M.; Sun, X.H.; Sun, M.M.; Fu, D.Q.; Li, Z.G.; Christie, P. Influence of Rhizobium meliloti on phytoremediation of polycyclic aromatic hydrocarbons by alfalfa in an aged contaminated soil. J. Hazard. Mater. 2011, 186, 1271–1276. [Google Scholar] [CrossRef]
  30. Wu, Z.H.; Wang, M.X.; Pan, C.; Han, S.J.; Han, B.Y. Research progress and prospect of occurrence regularity and green control of tea green leafhopper. J. Tea Commun. 2021, 48, 200–206+252. [Google Scholar]
  31. Niu, Y.Q.; Han, S.J.; Wu, Z.H.; Pan, C.; Wang, M.X.; Tang, Y.Y.; Zhang, Q.H.; Tan, G.J.; Han, B.Y. A push-pull strategy for controlling the tea green leafhopper (Empoasca flavescens F.) using semiochemicals from Tagetes erecta and Flemingia macrophylla. Pest Manag. Sci. 2022, 78, 2161–2172. [Google Scholar] [CrossRef]
  32. Ma, J.; Chen, L.L.; Guo, Y.; Wu, Q.; Yang, M.; Wu, M.H.; Kannan, K. Phthalate diesters in airborne PM2.5 and PM10 in a suburban area of Shanghai: Seasonal distribution and risk assessment. Sci. Total Environ. 2014, 497, 467–474. [Google Scholar] [CrossRef]
  33. Li, P.H.; Jia, H.Y.; Wang, Y.; Li, T.; Wang, L.; Li, Q.Q.; Yang, M.M.; Yue, J.J.; Yi, X.L.; Guo, L.Q. Characterization of PM2.5—bounding phthalic acid esters (PAEs) at regional background site in northern China: Long-range transport and risk assessment. Sci. Total Environ. 2019, 659, 140–149. [Google Scholar] [CrossRef]
Figure 1. Appearance of the fifteen experimental tea cultivars. 1-‘Jiukengzao’, 2-‘Zimudan’, 3-‘Mingke 1’, 4-‘Huangguanyin’, 5-‘Jiaming 1’, 6-‘Maolv’, 7-‘Tieguanyin’, 8-‘Zijuan’, 9-‘Huangmudan’, 10-‘Pingyang Tezao’, 11-‘Longjing Changye’, 12-‘Zhongcha 102’, 13-‘Zhongcha 108’, 14-‘Longjing 43’, 15-‘Baiye 1’.
Agriculture 12 01516 g001
Figure 2. The temporal variations and compositions of PAEs in upper mature leaves and lower mature leaves from 15 tea cultivars. (a)-2020.11, (b)-2021.01, (c)-2021.03, (d)-2021.05, (e)-2021.07, (f)-2021.09.
Agriculture 12 01516 g002
Figure 3. PAEs content (μg/kg) of upper mature leaves, lower mature leaves, and average value of fresh tea leaves in all months.
Agriculture 12 01516 g003
Figure 4. The heat map of clustering analysis of PAEs content from the 15 tea cultivars at different seasons.
Agriculture 12 01516 g004
Figure 5. Relationships between the PAEs of fresh tea leaves and environment factors (air temperature, air quality index, amount of precipitation), as well as five PAE congeners. x1—average temperature, x2—air quality index, x3—amount of precipitation, x4—DMP, x5—DEP, x6—DiBP, x7—DBP, x8—DEHP, x9—PAEs.
Agriculture 12 01516 g005
Table 1. Summary of PAEs content (μg/kg) in upper mature leaves, lower mature leaves, and the average value from 15 tea cultivars.
NumberTea CultivarsUpper Mature LeavesLower Mature LeavesAverage Value
MaximumMinimumMedianGeometric MeanMaximumMinimumMedianGeometric MeanMaximumMinimumMedianGeometric Mean
1Jiukengzao650.96163.26346.84396.991320.75159.96545.71619.35883.75200.58462.25508.17
2Zimudan393.9294.27283.57276.24662.94317.42418.11447.31453.75247.27362.18361.78
3Mingke 1522.58100.71350.02334.34867.54115.16462.01518.36599.73286.28398.25426.35
4Huangguanyin580.60127.43349.05350.13803.37207.34514.20507.40636.88173.31441.73428.76
5Jiaming 1444.19140.79282.26369.43799.55312.23422.12527.78569.30271.59399.30407.27
6Maolv499.8180.24251.33482.97690.07210.40415.92429.52532.34172.95372.08362.08
7Tieguanyin547.87140.71396.73380.44801.99177.30589.79578.01599.28253.96507.39479.22
8Zijuan436.6588.09328.93284.39636.67230.58415.00404.67527.24179.44379.82344.53
9Huangmudan360.56119.18273.37255.08749.60165.65476.89543.32502.82288.95394.44399.20
10Pingyang Tezao1077.59165.29275.65392.051117.46154.20449.53539.761031.06257.82358.11465.90
11Longjing Changye445.6778.98275.27280.47583.24117.89501.13420.40508.22118.03386.28350.44
12Zhongcha102397.80110.39292.81283.49806.93165.20391.67490.84509.86217.13394.44387.17
13Zhongcha108508.84239.79374.86409.241915.01268.96529.95723.661116.84341.38476.22566.45
14Longjing 43383.25138.84259.79274.631298.33104.79602.61655.81753.00291.05447.08465.22
15Baiye 1480.04140.33270.36290.03685.06167.23423.43422.48575.49158.79349.08356.26
Publisher’s Note: MDPI stays neutral with regard to jurisdictional claims in published maps and institutional affiliations.

