Abstract
Appropriate modeling methods and feature selection algorithms must be selected to improve the accuracy of early and mid-term remote sensing detection of wheat stripe rust. In the current study, we explored the effectiveness of the random forest (RF) algorithm combined with the extreme gradient boosting (XGboost) method for early and mid-term wheat stripe rust detection based on the vegetation indices extracted from canopy level hyperspectral measurements. Initially, 21 vegetation indices that were related to the early and mid-term winter wheat stripe rust were calculated on the basis of canopy level hyperspectral reflectance. Subsequently, the optimal vegetation index combination for disease detection was determined using correlation analysis (CA) combined with RF algorithms. Then, the disease severity detection model of early and mid-term winter wheat stripe rust was constructed using XGBoost method based on the optimal vegetation index combination. For the evaluation and comparison of the initial results, three commonly used classification methods, namely, RF, backpropagation neural network (BPNN), and support vector machine (SVM), were utilized. The vegetation index combinations determined by the single CA algorithm were also used to construct detection models. Compared with the detection models based on the vegetation index combination obtained using the single CA algorithm, the overall accuracy of the four detection models based on the optimal vegetation index combination based on CA combined with RF algorithms increased by 16.1% (XGBoost), 9.7% (RF), 8.1% (SVM), and 8.1% (BPNN). Among the eight models, the XGBoost detection model based on the optimal vegetation index combination using CA combined with RF algorithms, CA-RF-XGBoost, achieved the highest overall accuracy of 87.1% and the highest kappa coefficient of 0.798. Our results indicate that the RF combined with XGBoost can improve the detection accuracy of early and mid-term winter wheat stripe rust effectively at canopy scale.
1. Introduction
Wheat stripe rust is an airborne epidemic disease that causes high yield loss and extensive damage in wheat production globally. During the epidemic period, wheat stripe rust will cause the wheat yield to decrease by more than 40% [1,2]. It is a low-temperature, high-moisture, high-light fungal disease that produces fungal spores on leaves infected by this pathogen and forms narrow yellow stripes parallel to the leaf veins, with dashed stripes [3]. In the later stages of spore development, the epidermis will rupture and a rust-colored powdery substance will appear [2]. Therefore, the use of modern information technology to obtain realtime and accurate information on the incidence of wheat stripe rust is important for the accurate prevention and control of wheat diseases, reduction in pesticide pollution, and improvement of wheat yield and quality [4].
Hyperspectral remote sensing data can provide detailed spectral information of landforms to invert the degree of crop stress by diseases quantitatively [5,6,7]. At present, some scholars have used wheat hyperspectral remote sensing data to detect the stress degree of winter wheat affected by stripe rust quantitatively [8,9]. The change in vegetation indices typically indicates the aging of vegetation, disease, or environmental stress. For example, Huang et al. [10] stated that the photochemical reflectance index (PRI) could detect the occurrence of winter wheat rust disease on the scale of the crown layer and field effectively. Devada et al. [11] showed that stripe rust and healthy wheat could be distinguished by the anthocyanin reflectance index (ARI). Kang et al. [12] obtained 16 spectral vegetation indices, such as water index (WI) and normalized difference water index (NDWI), by analyzing the hyperspectral reflectance of winter wheat canopy. Wang et al. [13] selected seven hyperspectral vegetation indices that were significantly related to the occurrence of winter wheat stripe rust as input variables for the PLS regression model to establish a disease inversion model for winter wheat stripe rust. Shi et al. [9] established a novel wheat rust spectral feature set by using vegetation indices. The detecting accuracy of early and late winter wheat stripe rusts reached 72.6% and 89.3%, respectively. However, it appears to be insufficient to utilize this combination of vegetation indices casually for disease detecting in the disease’s development.
In the process of model construction, the selection of appropriate feature variables for selection algorithms and models is a very critical issue because factors, such as noise and uncorrelated features in the original data, can reduce the generalization ability and accuracy of algorithmic models [14]. At present, the characteristic selection algorithm for the hyperspectral data of winter wheat stripe rust mainly analyzes and screens the correlation between the spectral characteristic variables and the disease index (DI) through the selection method [13,15]. The evaluation criteria of this method are obtained from the intrinsic properties of the spectral data itself [16]. The algorithm is simple and has good versatility. However, it does not consider the correlation among characteristic variables, and obtaining the optimal feature variable set is difficult, thereby reducing the generalization ability of the model. Random forest (RF) is an integrated learning feature selection algorithm with excellent robustness to multitemporal and noise-laden data, which can solve the multicollinearity problem of feature variables effectively [17,18]. Some scholars have used RF for feature selection to remove redundant information in the spectral data and achieve higher inversion accuracy with a smaller set of spectral feature variables. This algorithm has gradually been widely used in remote sensing data processing [19,20]. Backpropagation neural network (BPNN) and support vector machine (SVM) are traditional machine learning methods; BPNN has strong nonlinear function approximation capability, and Jiang et al. [1] used this method combined with Sentinel-2 image data to complete remote sensing detecting of wheat stripe rust. The support vector machine based on the application of inner product kernel function has strong robustness for small sample data, and this method is now widely applied to crop disease detecting and prediction research [9]. Compared with traditional machine learning methods, the extreme gradient boosting algorithm (XGBoost), as a novel machine learning algorithm, can reduce the degree of model overfitting and the computational effort [21]. In addition, this algorithm can improve the generalization ability of the model, thereby providing new ideas and methods for the detection and prediction of crop diseases [22]. Ahmed et al. [23] used the XGBoost algorithm to predict the occurrence of vegetation infestation by cotton leaf miner with a prediction accuracy of 84%, which was higher than the prediction results obtained by algorithms such as RF and logistic regression. Sandino et al. [24] identified healthy and infested trees in forests by exotic pathogens through the XGBoost algorithm with a classification accuracy of 97%.
The spectral vegetation indices will be changed by wheat stripe rust at different severity levels [4,8,25]. In this study, features were extracted from wheat stripe rust hyperspectral data by CA and CA-RF feature selection algorithms, and the two sets of feature variables were combined with four monitoring algorithms to construct eight early and mid-stripe rust monitoring models. The main objectives of this study were to (1) compare CA and CA-RF algorithms to determine the most suitable sensitive vegetation indices for detecting wheat stripe rust and to analyze them in combination with spectral bands; (2) construct a stable algorithmic model to detect the severity of wheat stripe rust in the early and mid-term by comparing the detection performance of eight models and provide methodological and technical references for making scientific and effective disease control decisions.
2. Materials and Methods
This study analyzed the hyperspectral data of winter wheat canopy to choose the vegetation indices and modeling methods that could identify the early and mid-term of stripe rust. The overall process, which consisted of four main steps: (1) field data acquisition, (2) optimal feature selection, (3) detecting model construction, and (4) model evaluation, is shown in Figure 1. In addition, the processing of the data was performed by Python for data analysis and model construction.
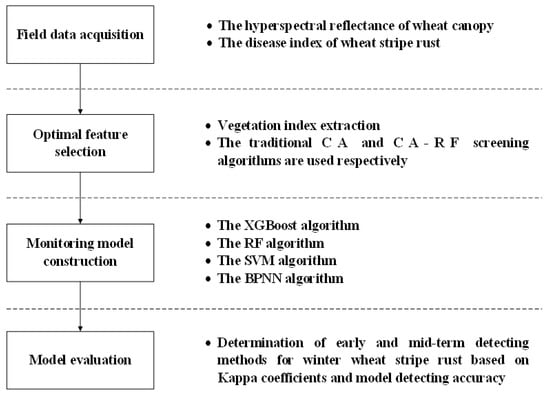
Figure 1.
The workflow of the study. Note: CA indicates correlation analysis; CA-RF indicates correlation analysis combined with random forest algorithm; XGBoost indicates extreme gradient boosting method; RF indicates random forest method; SVM indicates support vector machine method; BPNN indicates backpropagation neural network method.
2.1. Experimental Site and Design
The experiment of winter wheat stripe rust was conducted at the experiment site in Langfang, Chinese Academy of Agricultural Sciences, Hebei Province (39°30′40″ N, 116°36′20″ E), China in 2017 and 2018. The area is a typical northern crop planting area in China with excellent soil quality that meets the natural conditions for the growth of winter wheat. During the experiment, the study area was divided into four groups, namely, A, B, C, and D (Figure 2). The area of each group was 220 m2, with A and D as the healthy groups and B and C as the infected groups. The experimental variety of winter wheat “Mingxian 169”, which is a susceptible wheat variety, was selected for artificial inoculation to achieve wheat stripe rust infection. The experiment was conducted by mixing pre-prepared wheat stripe rust fungus (spores) with water to form a spore suspension at a concentration of 9 mg/100 mL, spraying the suspension uniformly on wheat leaves with a hand-held sprayer, then covering the wheat with plastic film and removing it the next morning. The process follows the Technical Specification for Evaluation of Wheat Pest Resistance—Part I: Technical Specification for Evaluation of Wheat Resistance to Stripe Rust (NY/T 1443.1-2007). In addition, pesticides were sprayed on healthy wheat areas to prevent them from being infected with stripe rust, and the entire experimental area was managed in the same way (using 200 kg/ha nitrogen and 450 m3/ha water).
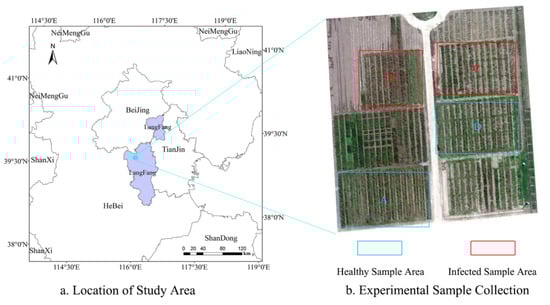
Figure 2.
Study area. (a) Location of the study area; (b) Experimental plots.
2.2. Sample Selection
To facilitate sampling and measurement, eight 1 m2 sample squares were selected for each group, and five canopy hyperspectral measurements and disease severity surveys were conducted in each sample square on winter wheat at 7, 14, 21, 26, and 31 days after stripe rust inoculation, respectively. The wheat canopy hyperspectral data obtained from each measurement were used as a sample. A total of 158 samples were selected from the 2017 and 2018 winter wheat stripe rust inoculation experiments (Table 1, Figure 3). In the meantime, we chose 7, 14, and 21 days after inoculation for disease detecting studies of winter wheat stripe rust in the early and mid-term. The DI of all samples ranged from 0 to 30%. DI was determined as the proportion of a complete leaf covered by stripe rust spores (The details are in Section 2.4).

Table 1.
Summary of field measurement activities for 2016–2017 and 2017–2018.
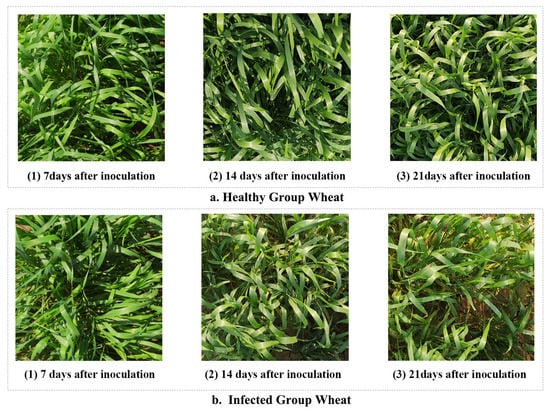
Figure 3.
Samples of the inoculation of stripe rust during different infection periods; (a) Healthy group wheat; (b) Infected group wheat.
2.3. Field Data Acquisition
The canopy hyperspectral data of winter wheat stripe rust were collected using the ASD FieldSpec spectrometer (Analytical Spectral Devices, Inc., Boulder, CO, USA); it collected the spectral reflectance of wheat in different periods after inoculation with stripe rust fungus at a height of 1.6 m above ground. The spectrometer covered a spectral range of 350–2500 nm and was fitted with a 25° field of view fore-optic. The spectral resolutions in the ranges of 350–1000 nm and 1000–2500 nm were 3 nm and 10 nm, respectively [26]. Data were collected between 11:00 and 13:30 BST under windless, cloudless, and sunny conditions, with the spectrometer probe placed vertically downward, maintaining a distance of 1.3 m from the wheat canopy. For each sample plot, irradiance was measured to obtain the average spectral reflectance, and the spectra were corrected before and after each measurement using a 40 cm × 40 cm BaSO4 standard reference plate [27]. All irradiance measurements were recorded as an average of 20 individual measurements (minus dark current) at an optimized integration time. The canopy spectral reflectance was converted by Formula (1) to calculate the ratio of canopy irradiance to whiteboard irradiance as follows:
where is the spectral reflectance of the sample wheat canopy, is the DN gray value of the sample wheat canopy spectrum, is the reflectance gray value of the reference plate, and is the reflectance value of the reference plate.
2.4. Inoculation and assessment of DI
Stripe rust was inoculated by spore inoculation according to the National Crop Disease Survey and Prediction Rules (GB/T 15795-2011) on 20 April 2017 and 18 April 2018, both times coincided with the ‘erecting’ stage of plant development [10]. A total of 80 wheat leaves were selected to calculate the DI of wheat stripe rust in each plot (Table 2). In this study, diseased leaves were scanned using a LiDE Canon 300 scanner (Canon, Beijing, China), and the DI values were obtained using MATLAB image processing software (version 2016a, Mathworks, Inc., Natick, Massachusetts, USA). The wheat stripe rust DI was expressed by a grading method, and the severity was divided into nine gradients: 0%, 1%, 5%, 10%, 20%, 40%, 60%, 80%, and 100% (percentage refers to the ratio of diseased leaves to the total number of leaves) [1,4,26]. The DI was taken as the closest gradient between the grades. Formula (2) for calculating the DI is expressed as follows:
where is the severity gradient at all levels, is the highest gradient of the disease, and is the number of leaves that correspond to each gradient. To distinguish the early and mid-term incidence of winter wheat stripe rust, the detecting model was set to three classifications, namely, healthy (I, DI = 0%), slight (II, 0% < DI ≤ 20%), and moderate (III, 20% < DI ≤ 30%) [28,29].
Table 2.
Summary of field measurement activities for 2016–2017 and 2017–2018.
2.5. Vegetation Index Extraction
In existing studies, in addition to the spectral reflectance curves that could reflect crop exposure to disease stress, vegetation indices, which were often used to identify crop pests and diseases, could also reflect the infection process of wheat by stripe rust [7,11,30]. The vegetation index was constructed in different forms using the spectral response characteristics of pests and diseases for visible and near-infrared bands. In addition, it was often used as a basic theoretical basis for remote sensing detection [31]. The vegetation index calculated through the spectral sensitive band has detected the occurrence of crop diseases and insect pests effectively according to several studies [30,32]. In this study, a total of 21 vegetation indices that were sensitive to the early and mid-term performance of winter wheat stripe rust were calculated as the preliminary features of the model based on the early and mid-term spectral response characteristics of winter wheat stripe rust, combined with the application of different vegetation indices for wheat stripe rust detection and prediction in previous studies [33]. The selected vegetation index names, calculation formulae, related parameters, and references are shown in Table 3.
Table 3.
List of 21 selected spectral vegetation indices.
2.6. Optimal Feature Selection
Due to the presence of more redundant information among the primed features, this paper opted for correlation analysis (CA) combined with the RF algorithm (CA-RF) for modeling feature selection. The RF algorithm is an integrated machine learning approach with a decision tree-based classifier that contains the bootstrap aggregating algorithm and feature subspace concept [50]. It can also evaluate the importance of feature variables based on the cross information between vegetation index features and the DI of stripe rust. The importance of feature variables was evaluated and ranked by feature importance scores [51]. Due to the coincidence of random sample sampling during the operation of the algorithm, the RF algorithm was iterated 500 times to calculate the average value of the characteristic importance score and combined with the model AUC value to select the character set that best responded to the early and mid-term of winter wheat stripe rust [52]. The AUC value of a model, which is the area under the receiver operating characteristic (ROC) curve, is often widely used to test the discriminative ability of a classification model, reflecting the validity and truthfulness of the model [53].
2.7. Detecting Model Construction and Evaluation
This study selected the XGBoost algorithm to construct an early and mid-term severity detecting model for winter wheat stripe rust, which is a scalable machine learning system based on regression tree boosting and adopts a greedy algorithm for feature variables step by step in the operation process with strong robustness to multiple feature covariances. In the meantime, the XGBoost algorithm is a strong classifier formed by combining multiple weak classifiers using Taylor second-order expansion to optimize the objective function and to prevent model overfitting. A regularization term was also introduced to control the model [22,54,55]. Compared with other algorithms, the XGBoost algorithm has advantages, such as high efficiency and accuracy in terms of classification.
To make the detecting model capabilities widely applicable, the early and mid-term winter wheat stripe rust samples from 2017 were used as training samples (96), and the samples from 2018 were used as the test samples for the model (62) in this study. The XGBoost model was tuned during model training using tenfold cross-validation and learning curve methods to determine the best parameter configuration for the model to improve the detection accuracy of the model.
To further compare and analyze the model performance, this study constructed eight detecting models by using the CA and CA-RF algorithms for the feature selection of the primary vegetation index features and by combining the algorithms that are commonly used for remote sensing detecting of stripe rust, namely the CA-RF model, the CA-SVM model, the CA-BPNN model, the CA-XGBoost model, the CA-RF-RF model, the CA RF-SVM model, the CA-RF-BPNN model, and the CA-RF-XGBoost model. The performance of the models was evaluated and analyzed by calculating the overall detection accuracy and the classification accuracy and Kappa coefficient of each model. The Kappa coefficient is a key indicator of the classification accuracy of the model based on the confusion matrix [56].
3. Results and Discussion
3.1. Canopy Spectral Reflectance of Wheat Stripe Rust Disease
The spectral response characteristics of the wheat canopy to fungi stress were very significant for identifying stripe rust infection levels in precise disease detection using hyperspectral remote-sensing data. As shown in Figure 4a, the average canopy spectral reflectance was significantly different between healthy winter wheat and slight and moderate stripe-rust-infected winter wheat. The spectral profile of healthy winter wheat had “green peaks” and “red valleys” in the visible (VIS) region and high reflectance in the near infrared (NIR) region, which was consistent with the typical reflectance of green vegetation [57]. When compared with the spectrum of healthy samples, winter wheat infected with stripe rust had different spectral characteristics in the VIS and NIR spectral regions due to changes in pigment content, moisture, and canopy architecture [8,26,58]. For example, compared with healthy samples, the red valley of samples infected with stripe rust increased on the spectral curve, while the reflectance decreased in the NIR region. The increase and decrease in reflectance in the red and NIR regions were proportional to the severity of stripe rust infection approximately.
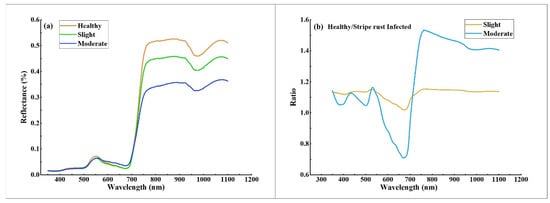
Figure 4.
(a) The average canopy spectral reflectance of different stripe rust infection levels; (b) The spectral ratios of stripe-rust-infected wheat compared to healthy winter wheat.
The ratio curve of spectral reflectance is shown in Figure 4b, dividing the reflectance of stripe-rust-infected wheat by healthy wheat. As the severity of winter wheat stripe rust disease deepened, the spectral reflectance curve of wheat canopy under the stress of stripe rust disease changed more. There were two significant differences between the spectral curve of healthy and stripe-rust-infected samples at: 560–730 nm and 800–1100 nm, and the most noticeable difference was situated at the spectral region of 630–680 nm. These differences possessed similar results to previous studies on the detection of stripe rust [8,10,29]. The above changes in spectral characteristics provide a strong theoretical basis for detecting and discriminating winter wheat stripe rust using canopy hyperspectral data.
3.2. Optimal Feature Selection and Analysis
Based on the significant role of vegetation indices in detecting the occurrence of plant diseases in existing studies, the coefficient of determination r2 (square of the correlation coefficient) obtained from the CA of vegetation indices and DI associated with wheat stripe rust was calculated, as shown in Figure 5. An independent sample t-test was used to obtain confidence values (p) for the healthy and infected samples in 21 vegetation indices. The p that corresponds to each feature in the figure of the selected vegetation indices showed excellent potential for early and mid-term detection of winter wheat stripe rust (p < 0.001), except for RVSI, WI, MCARI, and YRI (p < 0.01). The data from Figure 5 show that the PRI had the highest coefficient of determination (r2 > 0.80) value, which represented the highest correlation between the PRI and the occurrence of early and mid-term winter wheat stripe rust. Huang et al. [10] also found that PRI can characterize the occurrence of wheat stripe rust well and completed the quantitative inversion of this disease by PRI in their study. Based on the confidence values of vegetation indices and DI, 17 vegetation indices, including NDVI, SIPI, NRI, PSRI, MSR, PRI, PhRI, NPCI, and ARI, were found to reflect the disease incidence of early and mid-term winter wheat stripe rust (p < 0.001) better, and these vegetation indices were used as the initial selection characteristic variables for subsequent research work.
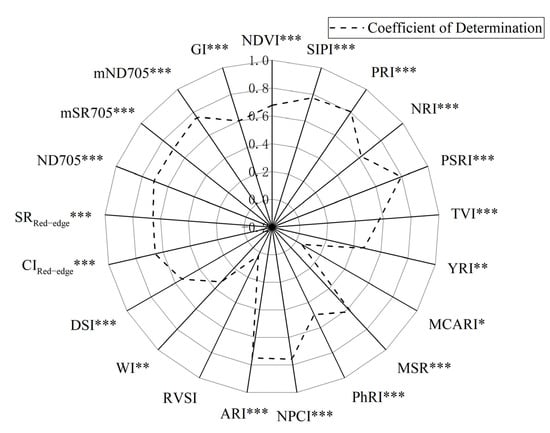
Figure 5.
Determination coefficients of selected vegetation indices and strip rust disease index. Note: * indicates confidence level p < 0.05, ** indicates confidence level p < 0.01, *** indicates confidence level p< 0.001.
To obtain the set of features with less redundant information content, the experiment used the RF algorithm to calculate the error value of out of bag data in the dataset to achieve the importance ranking of the initial feature variables, and the higher the feature importance score was, the more important the feature was [50,51]. The ranking results in Figure 6 revealed that the ability of different vegetation indices to characterize early and mid-term winter wheat stripe rust varied, with PRI having the highest importance score among the 17 vegetation indices, mainly due to the mechanism of crop exposure to disease stress [8,26,59]. Considering that too much or too little selection of the final feature set can affect the accuracy and stability of the model, we selected different values according to the results of the feature importance ranking for testing to find the appropriate number of features (k) and determined the final selected values by comparing the effects of different values on the model area under curve (AUC) values. The data results in Figure 7 show that the model AUC value was the largest when the number of features was 10, and the higher the AUC value is, the better the stability of the model and the reliability of the classification results will be [52,60]. In addition, we performed a variance inflation factor (VIF) test on the characteristic variables, and this result indicated that no strong multicollinearity was observed between the characteristic variables (Figure 8, VIF < 10) [61]. After the above analysis, a total of 10 vegetation indices, namely, PRI, PSRI, MSR, NDVI, ARI, SIPI, mND705, SRred−edge, CIred−edge, and GI, were selected as the final input features of the model to complete early and mid-term winter wheat stripe rust detection.
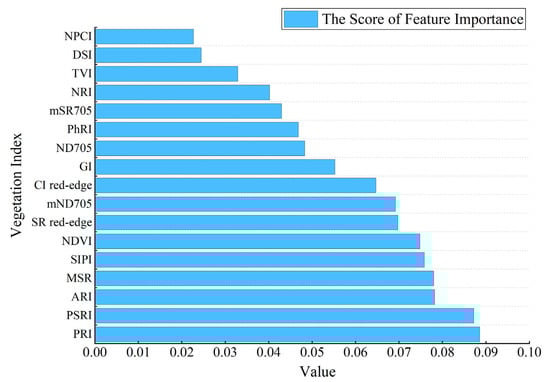
Figure 6.
RF feature importance score result.
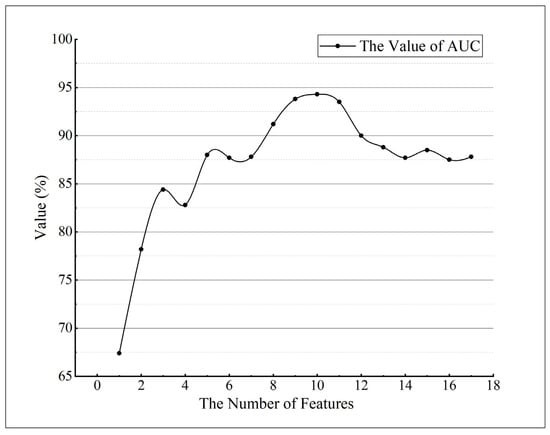
Figure 7.
Effect of the number of features on the AUC value of the model.
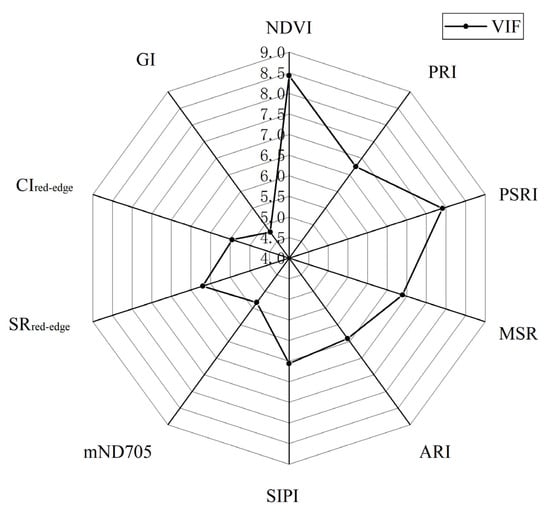
Figure 8.
VIF test for characteristic variables.
The physicochemical parameters of the leaf cell internal structure, chlorophyll, anthocyanin, and moisture are all changed after the wheat is infested by stripe rust [4,8,9,26]. The SIPI, PRI, and PSRI were all changed with factors, such as pigment content and photosynthetic rate in green vegetation [8,12]. In addition, the ARI, NDVI, and other vegetation indices are in the sensitive spectral range for winter wheat stripe rust and are more sensitive to the occurrence of winter wheat stripe rust than other vegetation indices [4,30]. The vegetation index PRI, which consists of a combination of 531 nm and 570 nm bands, can be used to reflect the photosynthetic efficiency changes. Huang et al. [10] also found that PRI has good potential for the quantitative detection of wheat stripe rust through their study, and Wang et al. [13] extracted NDVI by canopy spectral response characteristics, the MSR index, and other vegetation indices that represent vegetation greenness to complete the estimation of the severity of winter wheat stripe rust. Zheng et al. [26] found that PRI and ARI possess unique advantages in detecting against early-mid and mid-late winter wheat stripe rusts, respectively. Meanwhile, Huang et al. [10] and Devada et al. [11] made similar findings for PRI and ARI in the study of wheat stripe rust.
3.3. Model Analysis and Validation
The detection results of each model are shown in Table 4, which lists the accuracy of each classification, the overall detecting accuracy, and the kappa coefficients of the feature selection methods CA and CA-RF combined with the four wheat stripe rust detecting methods. The comparison of the data in Table 4 shows that the detection accuracy of the model constructed by the CA-RF feature selection algorithm improved by 9.7%, 8.1%, 8.1%, and 16.1% compared with that constructed by the CA algorithm. The detection accuracy and Kappa coefficient of the CA-RF-XGBoost model reached 87.1% and 0.798, respectively, which were the highest among all models. Comparing the models constructed by the CA-RF feature selection algorithm combined with RF, SVM, BPNN, and XGBoost, the detecting accuracy of the CA-RF-XGBoost model was 4.8%, 11.3%, and 16.1% higher than CA-RF-RF, CA-RF-SVM, and CA-RF-BPNN, respectively; and the kappa coefficients were 0.070, 0.166, and 0.237, respectively. Zheng et al. [26]. completed a study on the detection of wheat stripe rust in the early and mid-term using PRI and ARI based on wheat canopy hyperspectral data, and the detection accuracy reached 84.1%. As with previous studies, the study for the early and mid-term of wheat stripe rust has the following two shortcomings: (1) it can only achieve the identification of healthy and diseased samples, and cannot differentiate between disease severity, making it difficult to accurately guiding the management of agriculture; (2) the sample data selected were all from the same period, without considering the changes of meteorological and soil environment factors in different periods, making it difficult to meet the crop disease research work in practical situations [4,8,9,26]. In the process of this research, the CA-RF algorithm combined with the XGBoost method was used to avoid the shortcomings of previous studies on the early and mid-term detection of wheat stripe rust, which is of great significance for the study of complex and variable crop diseases in realistic situations.
Table 4.
Analysis and verification results of different detection models.
For healthy samples, most models had high classification accuracy. Among them, the model constructed by RF and XGBoost algorithm had the best classification effect on healthy samples, with the highest classification accuracy reaching 92.3%, which may be due to the severity of DI = 0% for healthy samples, and it was easy to distinguish from diseased samples. For slight and moderate samples, the classification effect of the model constructed by the CA algorithm for slight samples was poor, and some of the slight and moderate samples were misidentified maybe due to the close severity of the disease in the two types of samples, thereby leading to disorder in the model detecting results. Similar results occurred during the study of Jiang et al. due to the severity of the disease [1]. In the meantime, the classification accuracy of the CA-RF-XGBoost model reached 82.6% and 84.6% for slight and moderate samples, respectively. This finding is of great significance in guiding the precise use of pesticides for winter wheat stripe rust and in reducing pesticide pollution.
The above analysis can conclude that the CA-RF feature selection algorithm can obtain sensitive feature variables of wheat disease occurrence more effectively, and the classification accuracy of the model constructed using this algorithm was higher with a smaller error. Hao et al. [19] similarly assessed the feature importance of multispectral and vegetation index features by RF feature selection algorithm to improve the feasibility and classification accuracy of early crop mapping. At the same time, the CA-RF-XGBoost model had excellent discriminative ability for each class of samples, and the accuracy of each classification reached more than 82% [22,55]. In addition, the AUC value of the model reached more than 0.94, which means the model had relatively high realism and stability. Alberto [53] used the AUC value of the model as the discriminant criterion of the species distribution model in his study similarly, which can provide a reliable theoretical basis for the prediction results of the model.
4. Conclusions
In this study, the CA-RF-XGBoost model based on canopy hyperspectral data was applied to detect the severity of winter wheat stripe rust in the early and mid-term. The model was combined with the XGBoost algorithm to construct a detection model through the feature selection of vegetation indices by the CA-RF feature selection algorithm. The following conclusions were obtained:
- (1)
- The accuracy and performance of the model constructed by the CA-RF feature selection algorithm were better than those constructed by the single CA algorithm, indicating that the combination of CA and RF algorithms could be better for selecting the disease detecting features.
- (2)
- By selecting CA-RF as the feature selection algorithm, the detection accuracy of XGBoost algorithm and Kappa coefficient of winter wheat stripe rust in the early and mid-term reached 87.7% and 0.798, respectively, which were higher than those of RF, SVM, and BPNN for detecting wheat stripe rust. This finding indicates that the combination of the CA-RF algorithm and XGBoost model could improve the early and mid-term detection accuracy of winter wheat stripe rust effectively and provide methodological and technical references for early disease prevention and control.
In addition, the canopy hyperspectral data of winter wheat stripe rust in Langfang, Hebei in 2017 and 2018 were selected for mutual validation in this study, thereby further demonstrating the effectiveness and generalizability of the CA-RF-XGBoost model for early and mid-term detection of winter wheat stripe rust. However, this method model has only achieved early and mid-term detection of winter wheat stripe rust under plot control experimental conditions. Accomplishing the early detection of wheat stripe rust at field scale under natural conditions will be the focus of further research. Meanwhile, we will select wheat stripe rust samples under natural conditions to validate the method of this study for crop disease detection under realistic conditions.
Author Contributions
Conceptualization, L.H. and Y.L.; information analysis, L.H. and Y.L.; writing—original draft, L.H. and Y.L.; methodology, L.H., Y.D. and Y.L.; investigation, Y.D. and Y.L.; writing—review and editing, W.H., H.M. and A.G.; software, Y.L. and K.W. All authors have read and agreed to the published version of the manuscript.
Funding
This work was supported by the Beijing Nova Program of Science and Technology (Z191100001119089), the National Natural Science Foundation of China (42071423), the National Natural Science Foundation of China (42071320), the Program of Bureau of International Cooperation, the Chinese Academy of Sciences (183611KYSB20200080), SINO-EU, Dragon 5 proposal: Application Of Sino-Eu Optical Data Into Agronomic Models to Predict Crop Performance and to Monitor and Forecast Crop Pests and Diseases (ID 57457).
Institutional Review Board Statement
Not applicable.
Informed Consent Statement
Informed consent was obtained from all subjects involved in the study.
Conflicts of Interest
The authors declare no conflict of interest.
References
- Huang, L.; Jiang, J.; Huang, W.; Ye, H.; Zhao, J.; Ma, H.; Ruan, C. Wheat yellow rust monitoring method based on Sentinel-2 image and BPNN model. Trans. Chin. Soc. Agric. Eng. 2019, 35, 178–185. [Google Scholar] [CrossRef]
- Ma, Z. Researches and control of wheat stripe rust in China. J. Plant Prot. 2018, 45, 1–6. [Google Scholar] [CrossRef]
- Zhang, T.; Xu, Z.; Su, J.; Yang, Z.; Liu, C.; Chen, W.-H.; Li, J. Ir-UNet: Irregular Segmentation U-Shape Network for Wheat Yellow Rust Detection by UAV Multispectral Imagery. Remote Sens. 2021, 13, 3892. [Google Scholar] [CrossRef]
- Ren, Y.; Huang, W.; Ye, H.; Zhou, X.; Ma, H.; Dong, Y.; Shi, Y.; Geng, Y.; Huang, Y.; Jiao, Q.; et al. Quantitative identification of yellow rust in winter wheat with a new spectral index: Development and validation using simulated and experimental data. Int. J. Appl. Earth Obs. Geoinf. 2021, 102, 102384. [Google Scholar] [CrossRef]
- Khan, I.H.; Liu, H.; Li, W.; Cao, A.; Wang, X.; Liu, H.; Cheng, T.; Tian, Y.; Zhu, Y.; Cao, W.; et al. Early Detection of Powdery Mildew Disease and Accurate Quantification of Its Severity Using Hyperspectral Images in Wheat. Remote Sens. 2021, 13, 3612. [Google Scholar] [CrossRef]
- Lei, F.; Wu, B.; Yong, H.; Chu, Z. Hyperspectral Imaging Combined with Deep Transfer Learning for Rice Disease Detection. Front. Plant Sci. 2021, 12, 693521. [Google Scholar] [CrossRef]
- Chen, T.; Zhang, J.; Chen, Y.; Wan, S.; Zhang, L. Detection of peanut leaf spots disease using canopy hyperspectral reflectance. Comput. Electron. Agric. 2019, 156, 677–683. [Google Scholar] [CrossRef]
- Guo, A.; Huang, W.; Dong, Y.; Ye, H.; Ma, H.; Liu, B.; Wu, W.; Ren, Y.; Ruan, C.; Geng, Y. Wheat Yellow Rust Detection Using UAV-Based Hyperspectral Technology. Remote Sens. 2021, 13, 123. [Google Scholar] [CrossRef]
- Shi, Y.; Huang, W.; González-Moreno, P.; Luke, B.; Dong, Y.; Zheng, Q.; Ma, H.; Liu, L. Wavelet-Based Rust Spectral Feature Set (WRSFs): A Novel Spectral Feature Set Based on Continuous Wavelet Transformation for Tracking Progressive Host–Pathogen Interaction of Yellow Rust on Wheat. Remote Sens. 2018, 10, 525. [Google Scholar] [CrossRef] [Green Version]
- Huang, W.; Lamb, D.W.; Niu, Z.; Zhang, Y.; Liu, L.; Wang, J. Identification of yellow rust in wheat using in-situ spectral reflectance measurements and airborne hyperspectral imaging. Precis. Agric. 2007, 8, 187–197. [Google Scholar] [CrossRef]
- Devadas, R.; Lamb, D.W.; Backhouse, D.; Simpfendorfer, S. Sequential application of hyperspectral indices for delineation of stripe rust infection and nitrogen deficiency in wheat. Precis. Agric. 2015, 16, 477–491. [Google Scholar] [CrossRef] [Green Version]
- Yu, K.; Anderegg, J.; Mikaberidze, A.; Karisto, P.; Mascher, F.; McDonald, B.A.; Walter, A.; Hund, A. Hyperspectral Canopy Sensing of Wheat Septoria Tritici Blotch Disease. Front. Plant Sci. 2018, 9, 1195. [Google Scholar] [CrossRef] [Green Version]
- Wang, J.; Jing, Y.; Huang, W.; Zhang, J.; Zhao, J.; Zhang, Q.; Wang, L. Comparative Research on Estimating the Severity of Yellow Rust in Winter Wheat. Spectrosc. Spectr. Anal. 2015, 35, 1649–1653. [Google Scholar] [CrossRef]
- Jing, X.; Zhang, T.; Bai, Z.; Huang, W. Feature Selection and Model Construction of Wheat Stripe Rust Based on GA and SVR Algorithm. Trans. Chin. Soc. Agric. Mach. 2020, 51, 253–263. [Google Scholar] [CrossRef]
- Fan, Y.; Gu, X.; Wang, L.; Wang, S.; Wang, L.; Yang, G.; Chen, Z. Analysis of Canopy Spectral Characteristics of Winter Wheat Powdery Mildew and Disease Index Inversion. J. Triticeae Crops 2017, 37, 136. [Google Scholar] [CrossRef]
- Dong, J.; Yang, X.; Yang, G.; Wang, B. Inversion of Wheat Stripe Rust Disease Index Based on Near Ground Hyperspectral Data. J. Triticeae Crops 2016, 36, 1674–1680. [Google Scholar] [CrossRef]
- Bolón-Canedo, V.; Alonso-Betanzos, A. Ensembles for feature selection: A review and future trends. Inf. Fusion 2019, 52, 1–12. [Google Scholar] [CrossRef]
- Chivasa, W.; Mutanga, O.; Biradar, C. UAV-Based Multispectral Phenotyping for Disease Resistance to Accelerate Crop Improvement under Changing Climate Conditions. Remote Sens. 2020, 12, 2445. [Google Scholar] [CrossRef]
- Hao, P.; Zhan, Y.; Wang, L.; Niu, Z.; Shakir, M. Feature Selection of Time Series MODIS Data for Early Crop Classification Using Random Forest: A Case Study in Kansas, USA. Remote Sens. 2015, 7, 5347–5369. [Google Scholar] [CrossRef] [Green Version]
- Chan, J.C.-W.; Paelinckx, D. Evaluation of Random Forest and Adaboost tree-based ensemble classification and spectral band selection for ecotope mapping using airborne hyperspectral imagery. Remote Sens. Environ. 2008, 112, 2999–3011. [Google Scholar] [CrossRef]
- Zhang, Y.-R.; Liu, T.-X.; Tong, X.; Duan, L.-M.; Wu, Y.-C. Hyperspectral remote sensing inversion of meadow aboveground biomass based on an XGBoost algorithm. Acta Pratacult. Sin. 2021, 30, 1–12. [Google Scholar] [CrossRef]
- Elavarasan, D.; Vincent, D.R. Reinforced XGBoost machine learning model for sustainable intelligent agrarian applications. J. Intell. Fuzzy Syst. 2020, 39, 7605–7620. [Google Scholar] [CrossRef]
- Tageldin, A.; Adly, D.; Mostafa, H.; Mohammed, H.S. Applying Machine Learning Technology in the Prediction of Crop Infestation with Cotton Leafworm in Greenhouse. bioRxiv 2020. [Google Scholar] [CrossRef]
- Sandino, J.; Pegg, G.; Gonzalez, F.; Smith, G. Aerial Mapping of Forests Affected by Pathogens Using UAVs, Hyperspectral Sensors, and Artificial Intelligence. Sensors 2018, 18, 944. [Google Scholar] [CrossRef] [Green Version]
- Yao, Z.; Lei, Y.; He, D. Early Visual Detection of Wheat Stripe Rust Using Visible/Near-Infrared Hyperspectral Imaging. Sensors 2019, 19, 952. [Google Scholar] [CrossRef] [Green Version]
- Zheng, Q.; Huang, W.; Cui, X.; Dong, Y.; Shi, Y.; Ma, H.; Liu, L. Identification of Wheat Yellow Rust Using Optimal Three-Band Spectral Indices in Different Growth Stages. Sensors 2018, 19, 35. [Google Scholar] [CrossRef] [Green Version]
- Jing, X.; Lu, X.; Zhang, C.; Bai, Z. Early Detection of Winter Wheat Stripe Rust Based on SIF-PLS Model. Trans. Chin. Soc. Agric. Mach. 2020, 51, 191–197. [Google Scholar] [CrossRef]
- Chemura, A.; Mutanga, O.; Dube, T. Separability of coffee leaf rust infection levels with machine learning methods at Sentinel-2 MSI spectral resolutions. Precis. Agric. 2016, 18, 859–881. [Google Scholar] [CrossRef]
- Zheng, Q.; Huang, W.; Cui, X.; Shi, Y.; Liu, L. New Spectral Index for Detecting Wheat Yellow Rust Using Sentinel-2 Multispectral Imagery. Sensors 2018, 18, 868. [Google Scholar] [CrossRef] [Green Version]
- Huang, W.; Guan, Q.; Luo, J.; Zhang, J.; Zhao, J.; Liang, D.; Huang, L.; Zhang, D. New Optimized Spectral Indices for Identifying and Monitoring Winter Wheat Diseases. IEEE J. Sel. Top. Appl. Earth Obs. Remote Sens. 2014, 7, 2516–2524. [Google Scholar] [CrossRef]
- Lu, J.; Huang, W.; Jiang, J.; Zhang, J. Comparison of Wavelet Features and Conventional Spectral Features on Estimating Severity of Stripe Rust in Winter Wheat. J. Triticeae Crops 2015, 35, 1456–1461. [Google Scholar] [CrossRef]
- Ashourloo, D.; Aghighi, H.; Matkan, A.A.; Mobasheri, M.R.; Rad, A.M. An Investigation into Machine Learning Regression Techniques for the Leaf Rust Disease Detection Using Hyperspectral Measurement. IEEE J. Sel. Top. Appl. Earth Obs. Remote Sens. 2016, 9, 4344–4351. [Google Scholar] [CrossRef]
- Das, P.K.; Laxman, B.; Rao, S.V.C.K.; Seshasai, M.V.R.; Dadhwal, V.K. Monitoring of bacterial leaf blight in rice using ground-based hyperspectral and LISS IV satellite data in Kurnool, Andhra Pradesh, India. Int. J. Pest Manag. 2015, 61, 359–368. [Google Scholar] [CrossRef]
- Li, B.; Xu, X.; Zhang, L.; Han, J.; Bian, C.; Li, G.; Liu, J.; Jin, L. Above-ground biomass estimation and yield prediction in potato by using UAV-based RGB and hyperspectral imaging. ISPRS J. Photogramm. Remote Sens. 2020, 162, 161–172. [Google Scholar] [CrossRef]
- Gamon, J.A.; Serrano, L.; Surfusc, J.S. The Photochemical Reflectance Index: An Optical Indicator of Photosynthetic Radiation Use Efficiency across Species, Functional Types, and Nutrient Levels. Oecologia 1997, 112, 492–501. [Google Scholar] [CrossRef] [PubMed]
- Liu, W.; Sun, C.; Zhao, Y.; Xu, F.; Song, Y.; Fan, J.; Zhou, Y.; Xu, X. Monitoring of Wheat Powdery Mildew under Different Nitrogen Input Levels Using Hyperspectral Remote Sensing. Remote Sens. 2021, 13, 3753. [Google Scholar] [CrossRef]
- Mark, N.M.; Anatoly, A.G.; Olga, B.C.; Victor, Y.R. Non-destructive optical detection of pigment changes during leaf senescence and fruit ripening. Physiol. Plant. 1999, 106, 135–141. [Google Scholar]
- Broge, N.H.; Leblanc, E. Comparing prediction power and stability of broadband and hyperspectral vegetation indices for estimation of green leaf area index and canopy chlorophyll density. Remote Sens. Environ. 2001, 76, 156–172. [Google Scholar] [CrossRef]
- Zhang, M.; Su, W.; Fu, Y.; Zhu, D.; Xue, J.H.; Huang, J.; Wang, W.; Wu, J.; Yao, C. Super-resolution enhancement of Sentinel-2 image for retrieving LAI and chlorophyll content of summer corn. Eur. J. Agron. 2019, 111, 125938. [Google Scholar] [CrossRef]
- Zhang, J.-C.; Pu, R.-L.; Wang, J.-H.; Huang, W.-J.; Yuan, L.; Luo, J.-H. Detecting powdery mildew of winter wheat using leaf level hyperspectral measurements. Comput. Electron. Agric. 2012, 85, 13–23. [Google Scholar] [CrossRef]
- Daughtry, C.S.T.; Walthall, C.L.; Kim, M.S.; de Colstoun, E.B.; McMurtrey, J.E., III. Estimating Corn Leaf Chlorophyll Concentration from Leaf and Canopy Reflectance. Remote Sens. Environ. 2000, 74, 229–239. [Google Scholar] [CrossRef]
- Zarcotejada, P.; Berjon, A.; Lopezlozano, R.; Miller, J.; Martin, P.; Cachorro, V.; Gonzalez, M.; Defrutos, A. Assessing vineyard condition with hyperspectral indices: Leaf and canopy reflectance simulation in a row-structured discontinuous canopy. Remote Sens. Environ. 2005, 99, 271–287. [Google Scholar] [CrossRef]
- Gitelson, A.A.; Merzlyak, M.N.; Chivkunova, O.B. Optical properties and nondestructive estimation of anthocyanin content in plant leaves. Photochem. Photobiol. 2001, 74, 38–45. [Google Scholar] [CrossRef]
- Abdulridha, J.; Ampatzidis, Y.; Kakarla, S.C.; Roberts, P. Detection of target spot and bacterial spot diseases in tomato using UAV-based and benchtop-based hyperspectral imaging techniques. Precis. Agric. 2019, 21, 955–978. [Google Scholar] [CrossRef]
- PenUelas, J.; Inoue, Y. Reflectance Indices Indicative of Changes in Water and Pigment Contents of Peanut and Wheat Leaves. Photosynthetica 1999, 36, 355–360. [Google Scholar] [CrossRef]
- Ashourloo, D.; Mobasheri, M.; Huete, A. Developing Two Spectral Disease Indices for Detection of Wheat Leaf Rust (Pucciniatriticina). Remote Sens. 2014, 6, 4723–4740. [Google Scholar] [CrossRef] [Green Version]
- Pablo, J.Z.-T.; John, R.M.; Thomas, L.N.; Gina, H.M.; Paul, H.S. Scaling-Up and Model Inversion Methods with Narrowband Optical Indices for Chlorophyll Content Estimation in Closed Forest Canopies with Hyperspectral Data. IEEE Trans. Geosci. Remot Sens. 2001, 39, 1491–1507. [Google Scholar]
- Gitelson, A.A.; Gritz, Y.; Merzlyak, M.N. Relationships between leaf chlorophyll content and spectral reflectance and algorithms for non-destructive chlorophyll assessment in higher plant leaves. J. Plant Physiol. 2003, 160, 271–282. [Google Scholar] [CrossRef]
- Sims, D.A.; Gamon, J.A. Relationships between leaf pigment content and spectral reflectance across a wide range of species, leaf structures and developmental stages. Remote Sens. Environ. 2002, 81, 337–354. [Google Scholar] [CrossRef]
- Robin, G.; Jean-Michel, P.; Christine, T.-M.; Nathalie, V. Random Forests for Big Data. Big Data Res. 2017, 9, 28–46. [Google Scholar] [CrossRef]
- Georganos, S.; Grippa, T.; Vanhuysse, S.; Lennert, M.; Shimoni, M.; Kalogirou, S.; Wolff, E. Less is more: Optimizing classification performance through feature selection in a very-high-resolution remote sensing object-based urban application. GISci. Remote Sens. 2017, 55, 221–242. [Google Scholar] [CrossRef]
- Wen, C.; He, B.; Quan, X.; Liu, X.; Liu, X. Wildfire Risk Assessment Using Multi-Source Remote Sense Derived Variables. In Proceedings of the IGARSS 2018–2018 IEEE International Geoscience and Remote Sensing Symposium, Valencia, Spain, 22–27 July 2018; pp. 7644–7647. [Google Scholar]
- Jiménez-Valverde, A. Insights into the area under the receiver operating characteristic curve (AUC) as a discrimination measure in species distribution modelling. Glob. Ecol. Biogeogr. 2012, 21, 498–507. [Google Scholar] [CrossRef]
- Jafarzadeh, H.; Mahdianpari, M.; Gill, E.; Mohammadimanesh, F.; Homayouni, S. Bagging and Boosting Ensemble Classifiers for Classification of Multispectral, Hyperspectral and PolSAR Data: A Comparative Evaluation. Remote Sens. 2021, 13, 4405. [Google Scholar] [CrossRef]
- Chen, T.; Guestrin, C. XGBoost: A Scalable Tree Boosting System. In Proceedings of the 22nd ACM SIGKDD International Conference on Knowledge Discovery and Data Mining, New York, NY, USA, 13 August 2016; pp. 785–794. [Google Scholar]
- McHugh, M.L. Interrater reliability: The kappa statistic. Biochem. Med. 2012, 22, 276–282. [Google Scholar] [CrossRef]
- Nilsson, H. Remote sensing and image analysis in plant pathology. Annu. Rev. Phytopathol. 1995, 33, 489–528. [Google Scholar] [CrossRef] [PubMed]
- Feng, W.; Qi, S.; Heng, Y.; Zhou, Y.; Wu, Y.; Liu, W.; He, L.; Li, X. Canopy vegetation indices from in situ hyperspectral data to assess plant water status of winter wheat under powdery mildew stress. Front. Plant Sci. 2017, 8, 1219. [Google Scholar] [CrossRef]
- Ma, H.; Huang, W.; Jing, Y.; Pignatti, S.; Laneve, G.; Dong, Y.; Ye, H.; Liu, L.; Guo, A.; Jiang, J. Identification of Fusarium Head Blight in Winter Wheat Ears Using Continuous Wavelet Analysis. Sensors 2019, 20, 20. [Google Scholar] [CrossRef] [Green Version]
- Amirruddin, A.D.; Muharam, F.M.; Ismail, M.H.; Ismail, M.F.; Tan, N.P.; Karam, D.S. Hyperspectral remote sensing for assessment of chlorophyll sufficiency levels in mature oil palm (Elaeis guineensis) based on frond numbers: Analysis of decision tree and random forest. Comput. Electron. Agric. 2020, 169, 105221. [Google Scholar] [CrossRef]
- Franke, G.R. Multicollinearity. In Wiley International Encyclopedia of Marketing; Wiley-Blackwell: Oxford, UK, 2010. [Google Scholar] [CrossRef]
Publisher’s Note: MDPI stays neutral with regard to jurisdictional claims in published maps and institutional affiliations. |
© 2022 by the authors. Licensee MDPI, Basel, Switzerland. This article is an open access article distributed under the terms and conditions of the Creative Commons Attribution (CC BY) license (https://creativecommons.org/licenses/by/4.0/).