Abstract
In Brazil, the National School Feeding Program (PNAE) seeks to contribute to the socio-economic development of smallholder farmers, prioritizing them in supplying their products for preparing daily meals in public schools. However, farmers face challenges in determining which school calls to bid for and the potential benefits from their participation, due to the multiple quantitative and qualitative decision criteria involved. This paper presents a novel Data Envelopment Analysis (DEA)-based method for bidding priority setting, to support the decision making. The model was applied for a case study in Brazil. The academic contribution lies in the innovation of using a Double-Frontier Slack-Based Measure (SBM) DEA model for Hierarchical Network systems, i.e., applied to multiple levels and followed by a tie-breaking method. The practical contribution lies in the decision support of farmers by presenting the results at three levels, the first of which is a ranking by the town or urban cluster priority, the second by the school, and the third by the products. Thus, using the rankings of calls, farmers can make informed decisions regarding the feasibility of bidding for each PNAE public call. At the same time, the objective rankings can alleviate friction and conflict within co-operatives during the decision-making process.
1. Introduction
“Equal access to land” is set as a pillar for three goals of the 2030 United Nations Development Agenda—namely, Ending poverty (Goal 1), Ending hunger (Goal 2), and Achieving gender equality (Goal 5). In this context, the promotion of smallholder farmers’ welfare and their products’ commercialization means a shift from subsistence to more market-oriented farming and represents a fundamental step for achieving global goals.
In the last decades, Brazil received international recognition for successful initiatives against poverty and hunger [1]. Among the Brazilian initiatives, the PNAE (National School Feeding Program) is believed to be the largest institutional procurement program in the world that deliberately prioritizes purchasing from smallholder farmers [2]. In this program, Brazilian public schools must allocate at least 30% of the total budget available for food purchases to the acquisition of products from local smallholder farmers. This initiative seeks, at the same time, to guarantee fresh and healthy food for students, as well as income generation for smallholder farmers.
One of the procurement rules is the prioritization of organized local groups of smallholder farmers, such as cooperatives and associations of Agrarian Reform, Maroons (descendants of Africans in the Americas who formed settlements away from slavery), or Native American farmers [3]. In this way, the PNAE can also be seen as a program that promotes the dynamics of associateship and self-organization processes, which was already pointed out as an effective way for sustainable development as well as financial gains [4].
According to the perception of public agents, most challenges in implementation are related to the fact that smallholder farmers face several difficulties to operate in the institutional market context. Based on the perception of the smallholder farmers, the main challenge is deciding which public calls they should apply for, as: (1) the calls are published almost simultaneously by each school; (2) the deadline for bidding for the calls is short; (3) the application process is bureaucratic and requires significant effort, time, and travel cost for physical bid submission for each call; (4) there are many schools with many products and different purchase prices, even for the same product; (5) the location of each school affects the delivery cost of the products; and (6) depending on the school location, the priority of each farmer varies according to the potential competitors.
Therefore, it is necessary to support the smallholder farmers in deciding which calls to attend, considering their objectives and constraints. Currently, the decision is intuitively made, leading them to often choose to attend less profitable, or even, economically unviable calls. Moreover, “Responsible Rural Research and Innovation” has already been pointed out as a new field of research, once digitalization creates new socio-technical systems which can marginalize rural places [5]. In this way, PNAE implementation requires encompassing digitalization for improving efficiency.
1.1. Purpose and Structure
Given the aforementioned context, this paper aims to present a tool to support the decision making of smallholder farmers for priority setting for the bid/no-bid decisions, regarding which public calls they should choose to apply for. This tool considers simultaneously the quantitative characteristics of the calls and the qualitative parameters that reflect the objectives of the smallholder farmers and is based on the calls’ relative efficiencies. Further, the developed method and tool need to be easily automated and quickly applied and updated when new bids are created and new DMUs need to be included in the revaluation of the problem, facilitating and speeding the decision-making process of the smallholder farmers. So, DEA is a suitable method for this purpose. In academic terms, it also represents a methodological innovation to evaluate the bid/no-bid decision using a multiple-level Double Frontier Slack-Based Measure (SBM) Data Envelopment Analysis (DEA) model. The method consists of the application of the SBM for hierarchical network systems and the Double-Frontier (DF) Composite Index (CI) method for tie-breaking purposes.
Regarding the structure of the paper, Section 1.2 presents the Literature Review of Data Envelopment Analysis (DEA) as a decision-support tool. Section 2 describes the Materials and Methods in two main subsections, the case study context (including information about the PNAE program and settlement of Canudos), and the methodology (including the existing Hierarchical Network DEA, the proposed model, and the tiebreaking approach). Section 3 presents the results and discusses implications, and Section 4 presents the conclusions, summarizing the results and discussing their implications in smallholder farmers’ development.
1.2. Literature Review
Bid/no-bid decisions are usually made in a context of at least two players: a contracting one, responsible for offering a tender for delivering a project or products (normally associated with long-term contracts or high-volume financial transactions) [6] and a player in becoming legally responsible for delivering a project or products if it wins the tender [7].
In the past, the common practice has been to base the ‘bid/no-bid’ decision primarily on subjective intuitions, which are usually influenced by a mix of experience and guesses [8]. Additional factors were introduced in the process, leading to an increase in complexity, highlighting the need for more structured and objective approaches [9,10].
The literature for systematic bid/no-bid decision-making, from the perspective of the service/product provider, has been developed overwhelmingly for auctions in civil construction [11,12,13,14]. Although it is possible to find papers investigating bid/no-bid decisions of institutional markets [15,16], applications beyond civil construction are scarce. The context of smallholder farmers applying for the public calls can be compared to the construction context regarding the attributes of resource capability and company reputation, though it differs regarding the competition [17].
The construction sector involves competitive bidding, in which two sequential decisions are made: firstly, the decision on whether to bid or not and secondly, the definition of the mark-up level for the shortlisted bids [12]. The PNAE process is similar because the total number of competitors is not known in advance [7,16]. However, the PNAE fixes the bidding price and prioritizes the selection of vulnerable groups (co-operative of smallholders, Native American groups, Maroons groups, etc.), local/less-distant producers, and the type of product (organic and ecological) [2]. This is a critical differentiating aspect, as bids are awarded based on the combination of two criteria: distance from the schools and social exclusion [3]. This fact eliminates the need for mark-up level decisions (commons to the civil construction sector), as contract prices and production costs are fixed and known in advance of bidding. The only exception is the product distribution costs, which depends on the number of bids the farmers will be successful in. Consequently, the expected profit may be estimated with a reasonable confidence level.
Moreover, differently from civil construction, the competition is limited to the geographical distance where the production and transportation/distribution costs render the participation in a call for the PNAE fixed price bid profitable. The existence of priority groups that may be interested in participating in the same call can be estimated and be considered in the decision-making process. In this regard, the PNAE features lower uncertainties and associated risks than civil construction [7,16] and allows farmers to focus exclusively on the economic dimension of the bid.
Decision Support and Data Envelopment Analysis (DEA)
Two prominent decision support systems (DSS) family of tools are applied to ‘bid/no-bid’ decisions: model-driven DSS and knowledge-driven DSS [7]. The first approach applies statistical analysis, based on historical data, to support the decision. However, model driven DSS’s drawback is the assumption of the competitors’ past bidding behavior being like the future one [16]. On the other side, knowledge-driven DSSs use structured and unstructured data, including also qualitative information, normally expressed on a linguistic scale [16], and transforming them into quantitative values through a variety of techniques. Among this kind of DSS, the most used are based on the multi-criteria decision methods (MCDM) [17,18].
A wide variety of criteria can be found in the literature [19,20,21], though they have a common drawback, which relates to the influence of the decision-makers’ subjectivity on the outcome of the decision [18]. Mathematical programming solves this drawback [22]. In this regard, data-driven techniques, such as Data Envelopment Analysis (DEA), may be seen as more adequate to reduce bias due to subjective allocation of weights, since they automatically attribute weights [14,23].
Ref. [24] compared Analytic Hierarchy Process (AHP) and DEA, two methods widely applied to rank systems and DMUs, showing that both methods have similarities and drawbacks. Ranks with a high correlation coefficient can be obtained when applying AHP and DEA, but at the same time suggesting different benchmarking. The analysis also showed that AHP is better for gradual improvement, but it needs more steps to generate results than DEA.
According to [25], another disadvantage of the AHP, besides the high computational requirement and increased time (even for small problems), is the effort demanded to make pair-wise comparisons and revaluation of the problem when adding new DMUs. Further, these pair-wise comparisons would require too much effort and time from the smallholder farmers, just because of the size of the problem, so this kind of problem would reduce the utility of the method. In addition, DEA is a quicker strategy with fewer steps. So, applying DEA can be advantageous in situations where time is a priority, and it is more suitable to the purpose of this work because it would be needed to re-evaluate the problem every time a new bid is created.
The DEA is used to evaluate the relative efficiency of Decision-Making Units (DMUs), through the insertion of measures (usually classified as inputs and outputs), and automatically attributes weights. The same parameter setup always results in the same rank of efficiency, without the process mechanism’s obscurity [26]. Among the DEA strengths for use in bid/no-bid, it can be cited: (i) accommodation of many measures and DMUs; (ii) inputs and outputs not required to have the same measurement units; and (iii) the weights are resulted from data, reducing arbitrariness. It also permits the constraints of weights, whether necessary [26].
A previous paper [27] proposed a taxonomy of the DEA literature. The authors stated that, as a new topic of Management Science, the DEA literature was growing exponentially, expanding the domains of application. For example, at the time, the authors identified agriculture as a domain, though not explicitly policymaking yet. For example, at the time, the authors identified agriculture as a domain, though not explicitly policymaking yet. Regarding applications in small-scale agriculture, a further paper [23] applied a DEA model integrated to Double Bootstrap Approach in Principal Component Analysis for measuring the relative technical efficiency of smallholder maize farmers in Zimbabwe. Through the DEA approach, it is possible to identify factors affecting technical efficiency and best management practices. Similarly, another paper [28] applied a DEA model and Tobit regression to determine the relative technical efficiency of smallholder potato farmers in Cameroon. In large-scale agriculture, a previous paper [29] applied a DEA model with a networking model for determining the most efficient expansion areas for soybean plantation. Another paper [30] applied DEA for investigating the impact of the COVID-19 pandemic in sugarcane plantations for attending green-fuel demands. Regarding specifically policymaking, the DEA was applied for discriminating the efficiency of Brazilian state governments in implementing the Bolsa Família Program, seen as a necessary policy to achieve the Millennium Development Goals [31].
Ref. [32] developed a Decision Support System based on two sequential MILP optimization models, guiding smallholder farmers from developing countries, and applied it to a Brazilian institutional market, so that the vulnerable community can make a better decision on supplying their products to schools based on the optimal bidding and contract acceptance strategy. Their first step is applied to a similar context, but differently from what is proposed here. They applied a MILP (Mixed Integer Linear Programming) model based only on quantitative criteria, as the net profit. In the second step, they applied another MILP model, but with more details to support whether to sign the contract or not. Another difference is that in our proposed model we used qualitative criteria, aside from the quantitative criteria.
Though a paper [22] stated that DEA applications also arose as a tool to gain insight (aggregating qualitative and quantitative measures) into bidders’ comparative performances, when applied as an MCDM, DEA inputs are understood as measures to be minimized (in the benefit of the efficiency) and DEA output, as measures to be maximized [26].
Additive DEA models work under Constant Returns to Scale (CRS) as well as Variable Returns to Scale (VRS) assumptions and do not require the choice of orientation. Among them, Slack-Based Measure (SBM), proposed by [33], advanced the technique, generating an index between zero and one as a result [34].
According to [35], through using the Hierarchical Network (HN) DEA model, the integration of different levels of DMU (a lower level of sub-DMUs being aggregated at an upper level, as a unique DMU) can be done by constructing the frontier based only on the lower level of sub-DMUs, even for DMUs with different internal structures (i.e., different combinations of sub-DMUs).
Evaluating different categorical DMUs jointly could be considered unfair due to heterogeneity [36]. Considering hierarchical levels is a way to solve this problem, e.g., suppose that a problem has two levels. Level 2 can influence level 1, but it would be unfair to let level 2 be influenced by level 1. So, the frontier for DMUs from level 1 is constructed considering constraints of all DMUs, while the frontier for DMUs from level 2 is constructed considering only DMUs from level 2, excluding the constraints of DMUs from level 1.
Refs. [10,37] applied DEA to the context of bid/no-bid decision, using a CRS DEA model, oriented to inputs, without weight restrictions. Similarly, to the current application, each DMU represents a bidding opportunity. Similarly to [10], ref. [37] considered the qualitative measures only before the DEA model application, while incorporated linguistic judgments to DEA measures. Ref. [37] discussed the limitations of DEA discrimination power and pointed out that the model of [37] as a solution, though, as well as [38], did not discuss the incorporation of tie-breaking methods.
In this regard, the current paper applies the SBM model of [33] with hierarchization levels based on [35], followed by the composite index tie-breaking method, created by [39].
In the proposed model, there is a need to deal with similar bids in terms of inputs and outputs, but different aggregated structures (levels), in terms of the number of products and numbers of school calls, once the farmers can propose a bid that attends the call partially (considering only some schools and/or some products). It is a problem of three levels, towns (level 1), schools (level 2), and products (level 3). The bid for each town can present different aggregations of inputs and outputs in each level (the towns are level 1 in the hierarchical system and their data are aggregations from schools that are level 2, and similar aggregation applies to the relation among school in level 2 and products in level 3). Therefore, it is necessary to use a Hierarchical-Network Data Envelopment Analysis (HN-DEA) model to address these differences under structure levels.
Although the SBM model has already been applied with composite index tie-breaking for international supply chain management [40,41,42,43], the combination with a double-frontier composite index and HN structure is a novelty. In this way, besides the social relevance for supporting bid/no-bid decisions of smallholder farmers, the present paper also brings a methodological novelty in the DEA literature.
2. Materials and Methods
2.1. Case Study Context
This section describes more details about the PNAE program and the settlement of smallholder farmers, the current case study context.
2.1.1. The National School Feeding Program (PNAE)
In Brazil, public schools are legally liable to provide free daily meals to students [44]. Public schools may be municipal, state, and, in a few cases, federal. In 2017, 99.4% of children age between 6 and 14 years were in school; among them, 8.35 million were in municipal schools [44].
Since 2013, the PNAE Law [3] established that 30% of public-school food budget allocation must be directed for acquiring products from local smallholder farmers. The program also set rules for each school (or association of schools) establishing and opening the public calls (with the bidding price for each product) and prioritizes the criteria of bidder selection in the following order: (1) bidders’ social exclusion level (cooperative of smallholders, Native American groups, Maroons groups, etc.), (2) local/less-distant producers, (3) the type of product (organic and ecological), and (4) the type of bidder (individual, informal group, or formal group) [2].
This is a critical differentiating aspect, as bids are awarded based on the combination of four criteria, and not on the bid price [3]. This fact eliminates the need for mark-up level decisions—common in civil construction [14] as contract prices and first estimative of production costs are fixed and known in advance of bidding. The only exception is the product distribution costs, which depend on the number of bids the farmers will be successful in. Consequently, the expected profit may be estimated in advance with a reasonable confidence level.
The competition is limited to the geographical distance where the production and transportation/distribution costs render the participation in a call for the PNAE fixed price bid profitable. The existence of priority groups that may be interested in participating in the same call can be estimated and be considered in the decision-making process. In this regard, the PNAE features lower uncertainties and associated risks than civil construction [15,18].
Figure 1 shows the part of the interest of the PNAE process in this study. At first, the calls for bids are published informing about the products demanded by each school in each town. As the smallholder farmers are informed about the calls, they must make a decision regarding which products, from which schools, in which towns they will present a sales project proposal (at this stage the proposed DEA is applicable). After receiving the proposals from the farmers, the school managers must make a ranking of the winning proposals for each of the products using the prioritization criteria. Following the ranking, the schools call the farmers to sign contracts for supplying food products to schools. At this point, the farmer can withdraw their proposals and not sign the contract. If this occurs, the schools invite the next farmer in the ranking, without penalty for the farmer who did not sign the contract. However, in case the farmer signs the contract and does not comply with it, as a penalty, the farmer cannot participate in the bid of the next time-period.
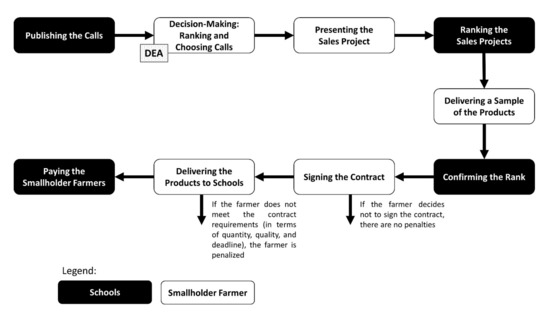
Figure 1.
Illustration of the PNAE process and Decision Making of the Smallholder Farmers.
Some studies on public procurement in Brazil brought elements of the context and importance of the PNAE. Ref. [45] carried out a representative survey of the Brazilian population to verify people’s understanding of ethical consumption and public purchases based on the PNAE. The result of this work raises the discussion of how ethical consumption can be thought of collectively when it comes to this type of scholar feeding program by government procurement. Most Brazilians think that the criteria used by the PNAE are not only the price and quality, but they also included social, environmental, and animal rights aspects. According to their interview results, 91% of Brazilians wanted citizens to be involved in defining public procurement criteria. In this research, the view of Brazilians is that the PNAE continues to support family farming, as this opens the possibility that schools provide nutritionally superior foods, the local economy is strengthened and that buying from local farmers would reduce transport costs in addition to enabling the rural population to live with better dignity. Additionally, they feel that the menu of public schools, prepared by nutritionists, should recognize and include the regional food culture, being concerned with the local cultural identity [45].
Ref. [46] carried out a study for analyzing the case of school meals in São Paulo, Brazil. Although the city of São Paulo is the largest buyer of school food products in Brazil (3200 educational institutions contracted or managed by the city of São Paulo, 900,000 enrolled students, 1.8 million meals a day), the requirement to purchase 30% of family farm products has not yet been met. This is due to difficulties related to the extension of the territory and intense traffic that leads to logistical problems in providing fresh food to the school. Examples of actions taken to enable the purchase of family farming products was the transformation of a shed into a distribution centre that is intended for family farming organizations in a rotation system with cooperatives exchanged every 90 days. Additionally, a logistics company was hired to transfer fresh produce from family farmer properties to the distribution centre or other intermediary locations.
A study carried out by [47] with municipal public managers investigated the purchase of food from family farming in a broader way than the PNAE and identified that the purchase of products is more frequent among managers who work in municipalities with less than 50,000 inhabitants, or in self-managed (there is neither leadership nor hierarchy) and educational institutions. It also identified that municipalities that purchase products from family farming promote healthier and sustainable food actions. In addition, the study demonstrated that the lack of technical assistance to producers, the seasonality of production and the bureaucratic purchasing process makes it difficult to purchase products from family farming.
2.1.2. The Settlement of Canudos
The PNAE Law is an institutional guarantee that a substantial percentage of the ingredients of school meals must be bought locally, from smallholder farmers. In 2017, there were 972,289 smallholder farmers in Brazil, living in 9374 settlements [48]. The settlement of Canudos is in the state of Goiás, 80 km away from Goiânia (the capital of the state). Currently, 320 families live in the settlement and each family has a 21-hectare farm (considered small in Brazil). Each farm is autonomous to decide what to plant, to produce, and where to distribute its products.
The smallholder farmers from Canudos currently produce more than 29 agricultural products and some groups of farmers have associations to facilitate the commercialization of their products. The main commercialization channels are fairs and the supply of milk for the dairy industry. The first market is characterized by sales uncertainty, and the second market is characterized by the low price paid for production. Thus, smallholder farmers consider the PNAE as an important market for guaranteeing the flow of production at a good price and a constant and predictable income (once they win the bid).
The team of researchers (during the years 2017, 2018, and 2019) adopted an action research approach, supporting the small farmers of the Canudos Settlement regarding the preparation of sales projects for the PNAE. This led to the identification of the main challenges regarding decision making about public calls, which is assumed to be like those in most Brazilian smallholder farmers.
Specifically, for this study, the research team conducted two one-day workshops (in 2018 and 2019). During the first workshop, the farmers pointed out they needed help to decide which public calls they should apply for, once the schools publish the calls simultaneously, the deadlines are short, the application process is bureaucratic, and it requires significant effort, time, and travel cost for physical bid submission for each call. Furthermore, there are many schools with many products and different purchase prices, even for the same product, and the location of each school affects the delivery cost of the products.
Besides this, depending on the school location the priority of each farmer varies according to the potential competitors. During the first workshop, rough information about costs was also collected. After the event, all historical calls were consulted and data regarding products and prices were collected. During the second workshop, the model results was presented to the farmers, as well as the inputs and outputs and their calculations, to confirm whether the values seemed reasonable and applicable in practice. The farmers approved it and the model was presented in the next section. Although the application here is limited to the settlement of Canudos, it is expected to replicate the same methodology and tools to all other settlements and developing contexts, because the proposed model was made for general hierarchical-network systems, and the measures (inputs and outputs), DMUs, and hierarchical levels can be adapted to different demands.
2.2. Methodology
This section is divided into three subjections. The first discusses the rationale for model type selection, the second proposes a model, and the third incorporates the tiebreaking approach for the proposed model.
2.2.1. HN-DEA Models
In this topic, the proposed DSS, based on HN-DEA, is presented. The analyzed units (calls) are named Decision Making Units (DMUs). A DEA rank result equal to “1” represents a DMU with 100% efficiency and a rank result equal to “0” represents a completely inefficient DMU. Except for the efficient DMUs, each one of the others, with results between 1 and 0, represents a DMU that can be improved to achieve the efficient frontier, considering efficient DMUs as benchmarks, and a deeper investigation of this DMU result may point out the directions for efficiency achievement.
Due to the different aggregated structures of the levels in bid/no-bid problems, an HN model can be used to address it. Ref. [35] developed a model to calculate the efficiency of these kinds of systems (an example of application is shown in Figure 2).
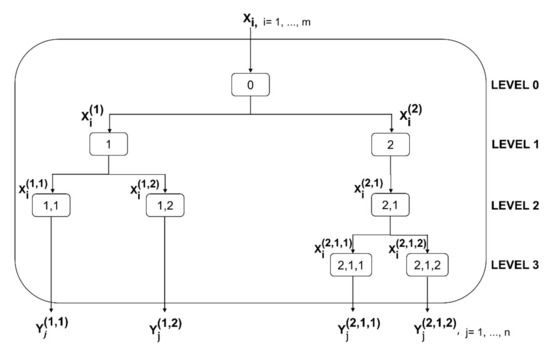
Figure 2.
Illustration of the hierarchical system. Source: Adapted from [35].
According to [35], this efficiency calculation can be generalized to hierarchical levels. Specifically, the efficiency of the whole DMU0 system is ; of the pth sub-unit at Level 1, as a subordinate under the DMU0, is ; of the qth sub-unit at Level 2, as a subordinate under the pth sub-unit of level 1, is , of the rth sub-unit at Level 3, as a subordinate under the rth sub-unit of level 2 and pth sub-unit of level 1, is ; and so on.
The lower levels are the ones without subordinates. In the case of system from Figure 2, these are the rth sub-units in level 3 (sub-units (2,2,1) and (2,2,2)), plus the sub-units in level 2 without subordinates in level 3 (sub-units (1,1), (1,2), (1,3), and (2,1)). The other Sub-DMUs can be aggregated using these lower levels, even the most upper level that represents the DMU, at level 0. The original model of [35] is presented in Appendix A. The adopted Slack-Based Measure (SBM) DEA model, formulated in [33], is integrated into the current application as it will be shown in the next subsection.
In the literature of DEA application to bid/no-bid problems, usually, only the efficient DMUs (efficiency = 1) are considered as bid options [10]. Though, here, it is proposed to consider all DMUs (including the inefficient ones), because even inefficient DMU could be profitable, despite their efficiency not being equal to 1. In this way, the final ranking is more important than efficiencies. In this regard, avoiding ties in the final ranking is important, so the proposed model will also incorporate the double-frontier composite index (tie-breaking method developed by [39]) to obtain a final ranking.
The composite index (with double frontier) was initially proposed by [49], and further developed by [39], and applied for the SBM model in [50,51]. The inverted efficiency (used jointly with standard efficiency to compute the double frontier composite index) is formulated by handling outputs as inputs, and inputs as outputs. The formulation of the Inverted SBM model is presented in [40].
In bid/no-bid decisions, the aggregation method may mix sums with averages. For example, considering a profit based on revenue, production, and logistics costs. The logistics cost to transport some products to schools, one school at a time at the school level, is different from transporting to all schools at once at the town level. In other words, at the town level, the logistics costs could be considered as averages, while the revenues are summed. Because of this, a situation comparable to what is called “super-efficiency” in DEA literature may happen in the HN-DEA model proposed in this paper, when comparing upper levels under analysis with the lower-level constraints.
So, in these situations, a super-efficiency model should also be used. Refs. [50,52,53] proposed the super-efficiency analysis in the linear form for SBM. Here the Super-SBM model from [50] is adopted. In a super-efficiency model, the super-efficient DMUs obtain super-performance values ≥ 1 (equal or greater than one). This means that these DMUs would be efficient and obtaining an efficiency value equal to 1 in the DEA standard model.
2.2.2. Proposed HN-SBM DEA Model
For each bid, the farmers can choose among many situations or levels, for example, delivering only some products to many schools, all the products of a bid to only one school, or all/some products to more than one school in one or more cities, etc. So, it is important to consider all the levels (e.g., product, school, or city levels) in the analysis, because these levels are hierarchically integrated, and, for dealing with the different levels, it was applied a hierarchical network model. For example, it is possible to save fuel in the more aggregated level (delivering to a whole city instead of many distant schools) and it may affect the results.
The HN system for the current bid/no-bid problem can be seen in Figure 3.
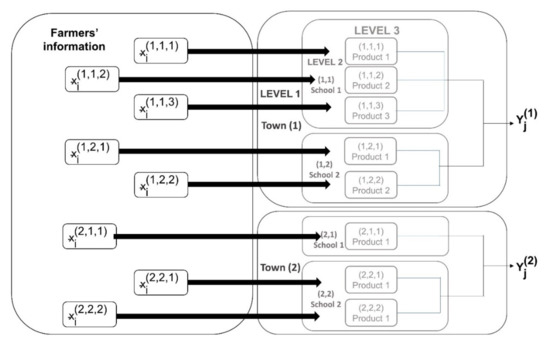
Figure 3.
Bid/No-Bid hierarchical network system.
The proposed model for the Bid/No-Bid Hierarchical Network System is a modified version of SBM and considering the levels (hierarchical categories) based in Figure 3 and it is described as follows in Equations (1)–(5) in the multiplier form.
Subject to:
where: is the hierarchical network efficiency, is the weight of the jth output, is the weight of the ith input, is the ith input of the kth sub-unit without subordinates, is the jth output of the kth sub-unit without subordinates, m is the number of inputs, n is the number of outputs, is the number of sub-units without subordinates, and k = 0 refers to the DMU under analysis.
For a matter of comparison to models of the literature, in the envelop form, the dual formulation is available in Appendix B (Equations (A5)–(A9)). The inverted form of the dual formulation is also available in Appendix C (Equations (A10)–(A14)). When the model in Equations (1)–(5) is infeasible due to super-efficiency (extreme DMU in upper levels), the super-HN-SBM model in the multipliers form (the proposed HN version based on the dual form from super-efficiency model of [50] should be addressed substituting it by the model in Equations (6) and (10):
Subject to:
It has the same measures and parameters as Equations (1)–(5), but the constraint for the DMU under analysis is not considered ( in Equation (8)) and the and weight constraints change to the “lower than” type. So, instead of lower bounds, in the super-efficiency model, they are upper bounds (and also being greater than 0).
At first sight, the model from Equations (6)–(10) seems to be equal to Equations (1) to (5), though it differs mainly by two factors: (i) at each loop of interaction, the analyzed DMU does not enter in the constraints of Equation (8) (), and (ii) the weight constraints (Equations (9) and (10) are based on maximum values () instead of the minimum (). One of the shortcomings of DEA ranking results is that results with many tied efficient DMUs may occur [30]. To overcome this difficulty, Ref. [40] proposed the Composite Index (CI). The double-frontier Composite Index for the hierarchical network SBM is as in Equation (11).
where: CI is the composite index based on the efficiencies. is the standard efficiency (Equations (1)–(5). is the inverted efficiency (Equations (A5)–(A9).
For the super-efficient DMUs, it can be assumed , regarding the status of the efficient DMU (as in DEA, a super-efficient DMU is an efficient DMU with efficiency = 1, but it can obtain higher values if it is not being considered in the constraints related to the efficient frontier).
2.2.3. Efficiency Decomposition and Information about the Empirical Application
The priority setting of attending a specific public call is defined by the position of the public call in the final rank (after the application of the double-frontier composite index tie-breaking method). It is important to define the measures (inputs and outputs) for the empirical application beforehand.
The distance from the schools is an important factor, but for the farmers, the profit is more important than the distance, and it is composed of three quantitative measures (revenue, production costs, and transportation costs). The revenue is calculated based on the prices and quantities from the bids, the production costs are calculated based on the quantities from the bids and cost to produce each product, and the transportation costs is calculated based on distance from the schools, the fuel consumption, and the fuel price. It is important to note that the transportation costs are a first estimative because it is possible to save fuel depending on the bids chosen (the farmers can choose to deliver products for more than one city/school at a time, creating logistical synergies).
It should be mentioned that it is possible to have situations when it is better to choose more than one city than choosing just only one nearest city, because of profitability, easiness of production of the products from the bid, perishability, and risk of losing, among other measures.
The profit is the most important quantitative measure for the farmers, but besides it, they consider other qualitative measures equally important to the profit in their pre-harvest bid selection process. The harvest will be made only after choosing and winning a bid.
The quantitative measures were used to compose the DEA output (i.e., the measures whose maximization benefit the efficiency):
Profit (a measure based on the difference between revenue and costs of production and transportation).
It was calculated as in Equation (12).
Profit = (Revenue − Production Costs − Logistics Costs)
The quantitative data were obtained from the public calls, then they were presented to the smallholder farmers, as well as the calculations, to be validated by them as reflecting their objectives and interests.
The output in Equation (12) as revenue minus costs is measured based on the absolute profit in a simple way to behave as “the higher, the better”. It is only one output containing all quantitative measures (revenue and costs), instead of splitting in two or three measures, because then the same importance is given to the quantitative measures (same weights for revenue and costs).
It is important to note that DEA, mainly the SBM model, has challenges working with negative data and it may happen for those products with costs greater than revenue, but they may be considered in upper levels, because aggregating products in one delivery may save fuel, resulting in less costs. It is possible to treat it in the model by changing its orientation, but keeping the same weight as the revenue, or simply assuming 0 efficiencies for the non-aggregated levels with loss.
Further, a brainstorming with the smallholder farmers was made to define qualitative measures reflecting their objectives and interests. For the current application, the qualitative measures used as inputs (i.e., the measures whose minimization benefit the efficiency) were:
- Priority in the selection process (using an inverted scale, the higher the priority, the lower the measure).
- Perception of the chance of losing (the lower, the better).
- The necessity of hiring third-party transportation for product distribution (the lower, the better).
- Difficulty of Crop Production (the lower, the better).
- Perishability of the Crop (the lower, the better).
- Necessity of required equipment (the lower, the better).
- Necessity of initial investment (the lower, the better).
- Inability to reduce the cost of transportation by delivering products collectively (the lower, the better).
The decomposition of the efficiencies (Equation (13)) may lead to the relationship among the efficiency of a unit and the ones from its subordinates’ sub-units. For example, the efficiency of the unit (p) is a weighted average of the sub-units (p,q).
where is the efficiency of the pth unit at level 1, is the efficiency of the qth sub-unit at level 2, as a subordinate under the pth sub-unit of level 1, and is the weight of the qth sub-unit at level 2, as a subordinate under the pth sub-unit of level 1, and is the number of sub-units at level 2.
In general, as it was described in Section 2.2.1, the application to a system that assumes different aggregations may lead to the super-efficiency of upper levels. So, if it is assumed that the weight is proportional to the average inputs and sum of outputs, then the sum of the weights is equal to , instead of being equal to 1 as in [36]. It is one of the reasons for the possibility of obtaining super-efficiency for extreme DMUs. It is not an issue, because it indicates that it is above the efficient frontier based on the lower level, as in [36], but with another aggregation (weighted sum). In a rare specific situation, when in Equation (13) it may cause the Equation (11) of CI to be negative, so the geometric approach of the tie-breaking method (for all DMUs) proposed by [54] can be used to reverse the inverted efficiency and compute the CI as in Equation (14).
Comparing our study to the literature, Ref. [55] had a similar scope to the current paper but applied the common CCR model instead of the SBM model used herein with the CI tie-breaking method. Furthermore, it did not have the Hierarchical-Network model structure suggested in the current paper. Regarding the variables, the main difference is on the orientation of the measures. For example, we used the “profit” as an output (instead of the inverted measure used as an input in [55]) and the qualitative ones were changed to “the lower, the better” as inputs. In this way, it reflects better the practical orientation of measures as outputs and inputs and the hierarchical-network structure of the problem.
The current application was made considering public calls for six state schools and two municipal calls (the latter including all municipal schools of the respective towns). This represents eight different combinations of up to five products demand, involving the geographic distribution of six towns in the state of Goiás, Brazil. The products, schools, and towns related to each call are shown in Table 1.

Table 1.
Products, schools, and towns considered in the current application.
It is important to note that Table 1 shows the set of the empirical application of this study. The results are only applicable to this specific application, but the proposed model can be generally applied to other situations with more (or less) DMUs and levels.
3. Results and Discussion
Table 2 displays the results at the three hierarchical levels: product, school, and town. The columns labeled as ‘Ef_Std’ (standard efficiency) represent the results of the DEA model before the application of any tie-breaking method. Analyzing the product level, there are two ties in the municipal call of Aparecida de Goiânia. This city is also efficient at the school and town levels.
Table 2.
Results of DEA model, including the standard efficiency (Ef_Std), the inverted efficiency (Ef_Inv), the composite index (CI), and the final rank.
The columns labeled as ‘1-Ef_Inv’ (inverted efficiency) show an intermediate step for tie-breaking. Inverted Efficiency is the efficiency result when inputs are inserted as outputs in the model and vice-versa. The tie-breaking results are shown in the columns labeled as ‘CI’ (Composite Index). In the end, the column ‘Rank’ (final rank) displays the rank for each level. The rank is a direct result of the CI, the highest the CI, the highest the rank position.
As it can be seen (Table 2—Column ‘Rank’ of ‘Towns’ level), in terms of town ranking, the public call of Aparecida de Goiânia is the most efficient DMU, the public call of Guapó is the second one, while the public call of Pirenópolis is on the third position. Aparecida de Goiânia is the second most distant city from the settlement of Canudos, though it represents a larger institutional market with an estimated population of around 600,000 inhabitants.
The benefits of adopting a hierarchical analysis approach are demonstrated in the case of the town of Guapó. At the school level (Table 2—Column ‘Rank’ of ‘Schools’ level), the schools of the town are in 3rd, 5th, and 6th positions. However, at the town level (considering the three schools jointly), Guapó is in the 2nd position, ahead of the town of Pirenópolis, which contains the 2nd most efficient call at the school level. The reason for this difference in ranking at the two levels lies in the fact that Guapó has three schools, which could lead to lower transportation costs due to logistical synergies if the farmers succeed in all bids and better performance on other qualitative criteria that reflect their objectives besides the profit.
Besides this, the provision of a ranking at three different levels (encompassing also the ‘Products’ level) allows farmers to make more informed decisions. The ranking of towns allows them to understand the ‘attractiveness’ of each town as a whole. Based on it, they can prioritize to bid in all school calls of a town. The ranking of schools provides more detailed information within each town and guides farmers in deciding which calls to bid for, at the school level, when they are not able to bid for all school calls within the same town. Finally, the ranking of products within each school allows the farmers to understand which products have good potential for them, according to the criteria they have set. For example, the school of Pirenópolis (SS Municipal call), which ranks 2nd at individual school ranking and 3rd at town ranking, contains products, such as lettuce, that ranked very low (due to the farmers’ productive preferences and productive limitations). Therefore, the farmers should be cautious in including lettuce in their bid if they decide to bid for that school.
To demonstrate the usefulness of the proposed method for smallholder farmers’ decision support, Table 3 shows a comparison of the efficiency rankings (‘IC’) and data rankings (‘Profit’), i.e., the rankings that would be obtained solely from expected profits. The values of these expected profits are presented in the column ‘Profit Value’. Despite the similarities between both rankings, there are some notable differences: the 2nd and 3rd positions at the town level are inverted (Guapó and Pirenópolis), and the school at Palmeiras de Goiás ranks 5th in terms of expected profit compared to the last position (8th), using the proposed method. This means that, despite the quantitative measure (expected profit) being the only output and the most important measure for the DEA model (as it will always have a weight > 0), the DEA model results will not lead to the same ranking as when only based on profit, once the qualitative measures are incorporated to the model and influence the results. This demonstrates the ability of the proposed method to be used for considering simultaneously qualitative and quantitative factors in decision making. The qualitative factors are quite significant, as they include, among others, potential farmers’ tacit knowledge of the probability of local competition in bids (which impacts the probability of success), product quality issues, and resource availability. It is, therefore, demonstrated that the proposed method is a useful tool for supporting smallholder farmers’ decision making by incorporating qualitative aspects and tacit knowledge, while also remaining simple and unambiguous in the outcomes, by ensuring the rankings do not contain ties.
Table 3.
Comparison between the rank based on efficiency—Composite Index (CI)—and the rank based on the profits.
For example, where the farmers can make an offer to whole towns, they should investigate the rank of towns. If they cannot afford a whole town, but the farmers have the opportunity to make an offer to whole schools, they should investigate the rank of schools. Otherwise, if they can do partial offers of products to attend the calls, they should investigate the rank of products.
Combinations other than looking just in one of the ranks of levels could appear and be evaluated. If the farmers can afford more than one product, it is recommended to look at higher levels first (starting by the rank of towns) to avoid conflicts, because different ranks could point out in different directions, though higher-level ranks account for benefit of aggregation. Otherwise, when the aim is to choose just one or a few products, the most efficient product (i.e., the best-ranked) is recommended to be chosen. In other words, the same logic goes for the rank of schools, i.e., before arriving at the product level, where farmers can bid for just one more school (but not for a whole town), the best-ranked school should be chosen.
For example, in this study, 34 products from eight schools and six towns were evaluated. Supposing the farmers know they have the resources to attend one town and three more schools, then, looking at Table 2 and Table 3, Aparecida de Goiânia is for sure the best town to attend. Looking at the rank of schools (excluding schools from Aparecida de Goiânia, because they were already chosen), the next schools are Municipal call (from Pirenópolis), SS Teacher Liodosia (from Guapó), and SS of Indiara (from Indiara), but due to the aggregation effect (it is more than one school left), it is recommended looking into the rank of towns, so Guapó has the second-highest efficiency, then the farmers should select SS Teacher Liodosia, SS José de Assis, and SS José Feliciano (three schools from Guapó), instead of the ones from Pirenópolis and Indiara, once the aggregation makes schools from Guapó worth being chosen.
On the other hand, let us suppose the farmers know they could attend only six products. Then, looking at Table 2 and Table 3, the 1st town, Aparecida de Goiânia, stands for five products so it is worth aggregating then and choosing the first city. For the 6th product, looking at the rank of towns, the 2nd highest efficiency town is Guapó, but looking at the rank of products, the next product is the garlic from Pirenópolis. In this case, it is worth choosing the garlic from Pirenópolis to the detriment of lack of aggregation that could justify the selection of a Guapós’ product, since only bidding for just one product would not allow benefiting from aggregation.
Finally, the clear proposed ranking can also contribute to avoiding conflicts between farmers within co-operatives or associations. Bidding through co-operatives or associations leads to a higher priority than individual bidders (and a subsequent, much higher chance of success); hence, in most cases, farmers bid through co-operatives or associations. However, it is common to have disagreements and friction over which calls to bid for, which depend on the subjective judgment and priorities of each associated farmer. Having objective guidance in the form of a ranking, like the one offered by the proposed method, can help alleviate these frictions and support better collaboration and more effective joint decision making within the co-operative or association, ultimately supporting improving social coherence.
4. Conclusions
The problem of supporting smallholder farmers’ bid/no-bid decisions, regarding their participation in public calls of the PNAE (National School Feeding Program, the world’s largest institutional procurement program that deliberately prioritizes purchasing from the smallholder farmers), was investigated. A decision-support approach has been developed for priority setting of the bid/no-bid decisions and showed that, although the previous existing farmers’ decision heuristics (based on farmers’ judgment and tacit knowledge) cannot be neglected, they should be systematically integrated to financial criteria to compound a priority setting where qualitative and quantitative measures are used jointly to make a decision.
The current paper has demonstrated that the proposed methodological approach based on the Hierarchical Network Slack-Based Measure (HN-SBM) Data Envelopment Analysis (DEA) model, dealing with three levels of hierarchy pertinent to the PNAE public calls (towns, schools, and products), is a useful tool for supporting smallholder farmers’ decisions. The proposed approach was applied to real public calls for six state schools and two municipal calls in the state of Goiás, Brazil. The outcomes of the current application were that the combination rule developed under the hierarchical assumption of the model outperformed other priority-setting schemes, such as exclusively considering products’ profit values or separately considering the public call of a unique school (neglecting the possibility of attending multiple schools in the same town). In this regard, the current paper stands out as one of the pioneering contributions to the literature of mathematical decision-support tools for bid/no-bid decisions in agricultural institutional markets. Moreover, the value of providing an objective priority ranking also extends in reducing friction and conflicts between the farmers within co-operatives or associations, during the joint decision-making process.
Specifically, this is the first DEA-based decision support model specifically focusing on smallholder farmers’ participation in institutional market bidding processes. Beyond its potential practical implications for smallholder farmer livelihood improvement, the mathematical formulation of the DEA model is a methodological innovation compared to the current state-of-the-art in the DEA literature, since it proposes a double-frontier hierarchical network Slack-Based Measure (HN-SBM) model for dealing with three levels of decisions and including the geometric composite index tie-breaking method in this hierarchical network approach. As the proposed approach can help farmers to identify the most profitable public calls with a better chance of winning the bid, it can be applied to other regions of Brazil, as well as other countries, where institutional markets with similar bidding structures exist, for supporting bidding decisions, to promote commercialization of their products and improve the income of family farmers, contributing to the improvement of their standard of living.
In operational terms, the proposed model can form the basis of a free mobile app. The online open calls could directly feed the app with quantitative information (i.e., the offered price by the call, per product), the smallholder farmers will fill the app with their qualitative judgment for each product, the production cost (per product), the distance from the settlement to each school, and the fuel cost. As a result, the smallholder farms will be able to see three ranks, one of the towns, one of the schools, and one of the products. The higher the position of an item, the better. These ranks in the app will guide them to discuss and choose the best strategy. The authors aim to develop an application for smartphones based on the proposed model and the logic behind which rank to look at, and which call to attend.
Additionally, further investigations could integrate the current model with optimization solutions, for example, a DEA-Routing model, considering more than one town in a route. Besides this, other agricultural products and business models should be investigated. For example, the pupunha palm heart, which demonstrated to have the power of creating a new business ecosystem and generation of economic gains [56], contributing to the strengthening of family farming, and local rural development.
Author Contributions
P.N.A.J.: Conceptualization, Methodology, Software, Validation, Visualization, Writing—Review and Editing, Writing—Original Draft Preparation, Investigation. I.C.M.: Conceptualization, Visualization, Writing—Review and Editing, Writing—Original Draft Preparation, Formal analysis, Investigation. L.Y.: Conceptualization, Writing—Review and Editing, Writing—Original Draft Preparation, Data Curation, Resources, Investigation. M.R.S.: Conceptualization, Funding acquisition, Project administration, Supervision, Writing—Review and Editing, Writing—Original Draft Preparation, Data Curation, Resources. A.R.: Conceptualization, Funding acquisition, Project administration, Supervision, Writing—Review and Editing, Writing—Original Draft Preparation. All authors have read and agreed to the published version of the manuscript.
Funding
This work was supported by an Institutional Links grant, ID 332405356, under the Newton Fund (UK) and National Council for the States Funding Agencies—CONFAP (Brazil) partnership. The grant is funded by the UK Department for Business, Energy and Industrial Strategy delivered by the British Council and FAPEG Foundation (Fundação de Amparo à Pesquisa do Estado de Goiás). This work also was supported by Brazilian National Council for Scientific and Technological Development (CNPq), ID 443439/2018-4, and Coordination for the Improvement of Higher Education Personnel (CAPES), 0001. The Universidad Católica del Norte (UCN) supported the payment of the Article Processing Charge.
Institutional Review Board Statement
Ethical review and approval were waived for this study because all participants were adults, capable, and completely able to exercise their freedom. The questions were publicly made in an open place. There was no identifying question or questions judged to be sensitive. The answers will not be publicly divulgated.
Informed Consent Statement
Not applicable.
Data Availability Statement
The historical data about public calls and product prices are public. The answers of the smallholder farmers about which criteria they prioritize will not be provided because this information is strategical for their business.
Acknowledgments
The contribution of Paulo Nocera Alves Junior (the corresponding author) includes work done both at the São Carlos School of Engineering (EESC), University of São Paulo (USP), São Carlos/SP, Brazil, and Escuela de Ingeniería de Coquimbo (EIC), Universidad Católica del Norte (UCN), Coquimbo, Chile. Athanasios Rentizelas’s contribution includes work done both at the Department of Design Manufacturing and Engineering Management, University of Strathclyde, Glasgow, United Kingdom and National Technical University of Athens, Greece. And Isotilia Costa Melo’s contribution includes work done both at the São Carlos School of Engineering (EESC), University of São Paulo (USP), São Carlos/SP, Brazil, and Facultad de Ingeniería y Ciencias, Universidad Adolfo Ibáñez (UAI), Viña del Mar, Chile.
Conflicts of Interest
The authors declare no conflict of interest.
Appendix A. Kao’s HN-DEA Model
The HN-DEA model is formulated as follows in Equations (A1)–(A4) [35]:
Subject to:
where: is the hierarchical network efficiency, is the weight of the jth output, is the weight of the ith input, is the contribution of the kth sub-unit to the DMU under analysis, is the ith input of the kth sub-unit, is the jth output of the kth sub-unit, m is the number of inputs, n is the number of outputs, z is the number of sub-units, and k = 0 refers to the DMU under analysis.
Appendix B. Dual Formulation of the HN-SBM Model
For a matter of comparison with the literature (in the envelop form), the dual formulation of the HN-SBM Model is in Equations (A5)–(A9):
Subject to:
where: is the efficiency, is the slack of the jth output, is the slack of the ith input, is the contribution of the kth sub-unit without subordinates to the unit under analysis, t is the model linearization measure, is the ith input of the kth sub-unit, is the jth output of the kth DMU, n is the number of inputs, m is the number of outputs, is the number of sub-units without subordinates, and k = 0 refers to the unit under analysis.
Appendix C. Formulation of the Proposed Inverted HN-SBM Model
The inverted form of the proposed model is as follows in Equations (A10)–(A14).
Subject to:
where: is the inverted hierarchical network efficiency, is the weight of the ith input in the inverted model, is the weight of the jth output in the inverted model, and the other measures and parameters are the same as the standard dual model (Equations (A1)–(A5), but handling inputs as outputs, and outputs as inputs.
The same logic of the inversion (input to output, and output to input) can be applied to Equations (6)–(10) and used to calculate the inverted super-efficiency HN-SBM.
References
- World Food Program. UN agency honours Brazilian President for efforts against hunger. Available online: https://news.un.org/en/story/2010/05/338092-un-agency-honours-brazilian-president-efforts-against-hunger (accessed on 27 December 2021).
- IPC-IG. Structured Demand and Smallholder Farmers in Brazil: The Case of PAA and PNAE. 2013. Available online: http://www.ipc-undp.org/pub/IPCTechnicalPaper7.pdf (accessed on 27 December 2021).
- Federative Republic of Brazil. Resolution 26, of June 17, 2013 [Resolução No 26, de 17 de Junho de 2013]. 2003. Available online: https://www.in.gov.br/materia/-/asset_publisher/Kujrw0TZC2Mb/content/id/30683767/do1-2013-06-18-resolucao-n-26-de-17-de-junho-de-2013-30683763 (accessed on 27 December 2021).
- Asian, S.; Hafezalkotob, A.; John, J.J. Sharing economy in organic food supply chains: A pathway to sustainable development. Int. J. Prod. Econ. 2019, 218, 322–338. [Google Scholar] [CrossRef]
- Cowie, P.; Townsend, L.; Salemink, K. Smart Rural Futures: Will Rural Areas Be Left behind in the 4th Industrial Revolution? J. Rural. Stud. 2020, 79, 169. [Google Scholar] [CrossRef] [PubMed]
- Ancarani, A.; Guccio, C.; Rizzo, I. The role of firms’ qualification in public contracts execution: An empirical assessment. J. Public Procure. 2017, 16, 554–582. [Google Scholar] [CrossRef]
- Mohemad, R.; Noor, N.M.M.; Hamdan, A.R.; Othman, Z.A. A Comprehensive Review of Decision Support Systems in Con-struction Tender Management. Int. J. Civ. Eng. Technol. 2018, 9, 1871. Available online: https://iaemecom/MasterAdmin/Journal_uploads/IJCIET/VOLUME_9_ISSUE_7/IJCIET_09_07_198pdf (accessed on 27 November 2021).
- Sonmez, R.; Sözgen, B. A support vector machine method for bid/no bid decision making. J. Civ. Eng. Manag. 2017, 23, 641–649. [Google Scholar] [CrossRef]
- Ahmad, I. Decision-Support System for Modeling Bid/No-Bid Decision Problem. J. Constr. Eng. Manag. 1990, 116, 595. [Google Scholar] [CrossRef]
- Polat, G.; Bingol, B. Data Envelopment Analysis (DEA) Approach for Making the Bid/No Bid Decision: A Case Study in a Turkish Construction Contracting Company. Sci. Iran. 2017, 24, 497–511. [Google Scholar] [CrossRef][Green Version]
- Cheng, M.Y.; Hsiang, C.C.; Tsai, H.C.; Do, H.L. Bidding Decision Making for Construction Company Using a Multi-Criteria Prospect Model. J. Civ. Eng. Manag. 2011, 17, 424. [Google Scholar] [CrossRef]
- Wanous, M.; Boussabaine, A.H.; Lewis, J. To bid or not to bid: A parametric solution. Constr. Manag. Econ. 2000, 18, 457–466. [Google Scholar] [CrossRef]
- Wanous, M.; Boussabaine, H.A.; Lewis, J. A neural network bid/no bid model: The case for contractors in Syria. Constr. Manag. Econ. 2003, 21, 737–744. [Google Scholar] [CrossRef]
- Liang, Z.H.; Sun, Y.W.; Yang, K. Study on Incentive Regulation Model of Electricity Distribution and Supply Price Based on the Method of DEA and Malmquist Indices, Zhongguo Dianji Gongcheng Xuebao. Proc. Chin. Soc. Electr. Eng. 2007, 27, 84. [Google Scholar]
- Chu-Chun-Lin, S. Bidding Efficiencies for Rights to Car Ownership in Singapore. Omega 1998, 26, 297. [Google Scholar] [CrossRef]
- Lin, C.T.; Chen, Y.T. Bid/No-Bid Decision-Making-A Fuzzy Linguistic Approach. Int. J. Proj. Manag. 2004, 22, 585. [Google Scholar] [CrossRef]
- Leśniak, A.; Plebankiewicz, E. Modeling the Decision-Making Process Concerning Participation in Construction Bidding. J. Manag. Eng. 2015, 31, 4014032. [Google Scholar] [CrossRef]
- Leśniak, A.; Radziejowska, A. Supporting bidding decision using multi-criteria analysis methods. Procedia Eng. 2017, 208, 76–81. [Google Scholar] [CrossRef]
- Chisala, M.L. Quantitative Bid or No-Bid Decision-Support Model for Contractors. J. Constr. Eng. Manag. 2017, 143, 4017088. [Google Scholar] [CrossRef]
- Egemen, M.; Mohamed, A. SCBMD: A knowledge-based system software for strategically correct bid/no bid and mark-up size decisions. Autom. Constr. 2008, 17, 864–872. [Google Scholar] [CrossRef]
- Ahmad, I.; Minkarah, I. Questionnaire Survey on Bidding in Construction. J. Manag. Eng. 1988, 4, 229–243. [Google Scholar] [CrossRef]
- Ballesteros-Pérez, P.; González-Cruz, M.C.; Cañavate-Grimal, A. On competitive bidding: Scoring and position probability graphs. Int. J. Proj. Manag. 2013, 31, 434–448. [Google Scholar] [CrossRef]
- Bahta, Y.T.; Jordaan, H.; Sabastain, G. Agricultural Management Practices and Factors Affecting Technical Efficiency in Zimbabwe Maize Farming. Agriculture 2020, 10, 78. [Google Scholar] [CrossRef]
- Rashidi, K. AHP versus DEA: A comparative analysis for the gradual improvement of unsustainable suppliers. Benchmark. Int. J. 2020, 27, 2283–2321. [Google Scholar] [CrossRef]
- Munier, N.; Hontoria, E. The Need for Improvement of the MCDM Modeling. In Uses and Limitations of the AHP Method; Management for Professionals; Springer: Cham, Switzerland, 2021; pp. 91–95. [Google Scholar] [CrossRef]
- Cook, W.D.; Tone, K.; Zhu, J. Data envelopment analysis: Prior to choosing a model. Omega 2014, 44, 1–4. [Google Scholar] [CrossRef]
- Gattoufi, S.; Oral, M.; Reisman, A. A taxonomy for data envelopment analysis. Soc-Econom. Plan. Sci. 2004, 38, 141–158. [Google Scholar] [CrossRef]
- Mengui, K.C.; Oh, S.; Lee, S.H. The Technical Efficiency of Smallholder Irish Potato Producers in Santa Subdivision, Cameroon. Agriculture 2019, 9, 259. [Google Scholar] [CrossRef]
- Branco, J.E.H.; Bartholomeu, D.B.; Alves Junior, P.N.; Filho, J.V.C. Mutual analyses of agriculture land use and transportation networks: The future location of soybean and corn production in Brazil. Agric. Syst. 2021, 194, 103264. [Google Scholar] [CrossRef]
- Alves Junior, P.N.; Melo, I.C.; Santos, R.D.M.; da Rocha, F.V.; Caixeta-Filho, J.V. How did COVID-19 affect green-fuel supply chain?–A performance analysis of Brazilian ethanol sector. Res. Transp. Econ. 2021, 101137, 101137. [Google Scholar] [CrossRef]
- Campoli, J.S.; Júnior, P.N.A.; Rossato, F.G.F.D.S.; Rebelatto, D.A.N. The efficiency of Bolsa Familia Program to advance toward the Millennium Development Goals (MDGs): A human development indicator to Brazil. Soc-Econ. Plan. Sci. 2020, 71, 100748. [Google Scholar] [CrossRef]
- Fuchigami, H.Y.; Tuni, A.; Barbosa, L.Q.; Severino, M.R.; Rentizelas, A. Supporting Brazilian smallholder farmers decision making in supplying institutional markets. Eur. J. Oper. Res. 2021, 295, 321–335. [Google Scholar] [CrossRef]
- Tone, K. A slacks-based measure of efficiency in data envelopment analysis. Eur. J. Oper. Res. 2001, 130, 498–509. [Google Scholar] [CrossRef]
- Mariano, E.B.; Sobreiro, V.A.; Rebelatto, D.A.N. Human Development and Data Envelopment Analysis: A Structured Literature Review. Omega 2015, 54, 33–49. [Google Scholar] [CrossRef]
- Kao, C. Efficiency measurement for hierarchical network systems. Omega 2015, 51, 121–127. [Google Scholar] [CrossRef]
- Cooper, W.W.; Seiford, L.M.; Tone, K. Data Envelopment Analysis: A Comprehensive Text with Models, Applications, References and DEA-Solver Software, 2nd ed.; Princeton University Press: Princeton, NJ, USA, 2007. [Google Scholar] [CrossRef]
- El-Mashaleh, M.S. Decision to bid or not to bid: A data envelopment analysis approach. Can. J. Civ. Eng. 2010, 37, 37–44. [Google Scholar] [CrossRef]
- McCabe, B.; Tran, V.; Ramani, J. Construction prequalification using data envelopment analysis. Can. J. Civ. Eng. 2005, 32, 183–193. [Google Scholar] [CrossRef]
- Leta, F.R.; de Mello, J.C.C.B.S.; Gomes, E.G.; Meza, A.L. Métodos de Melhora de Ordenação Em DEA Aplicados à Avaliação Estática de Tornos Mecânicos. Investig. Oper. 2005, 25, 229. Available online: https://www.researchgate.net/publication/228375009_Metodos_de_melhora_de_ordenacao_em_DEA_aplicados_a_avaliacao_estatica_de_tornos_mecanicos (accessed on 27 November 2021).
- Melo, I.C.; Alves Junior, P.N.; Perico, A.E.; Guzman, M.G.S.; Rebelatto, D.A.N. Benchmarking freight transportation corridors and routes with data envelopment analysis (DEA). Benchmark. Int. J. 2018, 25, 713–742. [Google Scholar] [CrossRef]
- Rentizelas, A.; Melo, I.C.; Alves Junior, P.N.; Campoli, J.S.; Rebelatto, D.A.N. Multi-criteria efficiency assessment of international biomass supply chain pathways using Data Envelopment Analysis. J. Clean. Prod. 2019, 237, 117690. [Google Scholar] [CrossRef]
- Nourbakhsh, S.M.; Bai, Y.; Maia, G.D.; Ouyang, Y.; Rodriguez, L. Grain supply chain network design and logistics planning for reducing post-harvest loss. Biosyst. Eng. 2016, 151, 105–115. [Google Scholar] [CrossRef]
- Melo, I.C.; Alves Junior, P.N.; Kodama, T.K.; da Silva, K.A.; Chimirri, M.W.; Rebelatto, D.A.N. B2C E-Commerce for Home Appliance in The Brazilian Market: A Cost Efficiency Investigation through a DEA-OCT Model. Internext 2020, 15, 72–89. [Google Scholar] [CrossRef]
- INEP. School Census Data [Dados Do Censo Escolar]. Available online: http://portal.inep.gov.br/artigo/-/asset_publisher/B4AQV9zFY7Bv/content/dados-do-censo-escolar-ensino-fundamental-brasileiro-tem-quase-duas-escolas-de-anos-iniciais-para-cada-escola-de-anos-finais/21206 (accessed on 27 November 2021).
- Kleine, D.; Brightwell, M.D.G. Repoliticising and scaling-up ethical consumption: Lessons from public procurement for school meals in Brazil. Geoforum 2015, 67, 135–147. [Google Scholar] [CrossRef]
- Belik, W.; Fornazier, A. Public Policy and the Construction of New Markets to Family Farms: Analyzing the Case of School Meals in São Paulo, Brazil. Adv. Food Secur. Sustain. 2017, 2, 69–86. [Google Scholar] [CrossRef]
- Soares, P.; Martinelli, S.; Davó-Blanes, M.; Fabri, R.; Clemente-Gómez, V.; Cavalli, S. Government Policy for the Procurement of Food from Local Family Farming in Brazilian Public Institutions. Foods 2021, 10, 1604. [Google Scholar] [CrossRef]
- INCRA. Settlements [Assentamentos]. Available online: http://painel.incra.gov.br/sistemas/index.php (accessed on 27 December 2021).
- Yamada, Y.; Matsui, T.; Sugiyama, M. An Inefficiency Measurement Method for Management Systems. J. Oper. Res. Soc. Jpn. 1994, 37, 158–168. [Google Scholar] [CrossRef]
- Taleb, M.; Ramli, R.; Khalid, R. Developing a two-stage approach of super efficiency Slack-Based Measure in the presence of non-discretionary factors and mixed integer-valued data envelopment analysis. Expert Syst. Appl. 2018, 103, 14–24. [Google Scholar] [CrossRef]
- Adler, N.; Golany, B. PCA-DEA. In Modeling Data Irregularities and Structural Complexities in Data Envelopment Analysis; Springer: Berlin/Heidelberg, Germany, 2007; pp. 139–153. [Google Scholar] [CrossRef]
- Fang, H.-H.; Lee, H.-S.; Hwang, S.-N.; Chung, C.-C. A slacks-based measure of super-efficiency in data envelopment analysis: An alternative approach. Omega 2013, 41, 731–734. [Google Scholar] [CrossRef]
- Tone, K. A slacks-based measure of super-efficiency in data envelopment analysis. Eur. J. Oper. Res. 2002, 143, 32–41. [Google Scholar] [CrossRef]
- Mariano, E.B.; Rebelatto, D.A.N. Transformation of Wealth Produced into Quality of Life: Analysis of the Social Efficiency of Nation-States with the DEA’s Triple Index Approach. J. Oper. Res. Soc. 2014, 65, 1664. [Google Scholar] [CrossRef]
- Alves Junior, P.N.; Costa Melo, I.; Severino, M.R.; Yamanaka, L.; Tuni, A. A Data Envelopment Approach to Support the Bid/No-Bid Decision of Smallholder Farmers on Public Calls Participation. In Proceedings of the International Joint Conference on Industrial Engineering and Operations Management, IJCIEOM 2019, Novi Sad, Serbia, 15–17 July 2019; pp. 1–7. [Google Scholar]
- Varella, W.A.; Oliveira Neto, G.C.; Sousa, T.B. Adoption of Cleaner Production in a Pupunha Palm Heart Factory: A Systematic Literature Review and a Case Study. Food Sci. Technol. 2021. epub ahead of print. [Google Scholar] [CrossRef]


Publisher’s Note: MDPI stays neutral with regard to jurisdictional claims in published maps and institutional affiliations. |
© 2021 by the authors. Licensee MDPI, Basel, Switzerland. This article is an open access article distributed under the terms and conditions of the Creative Commons Attribution (CC BY) license (https://creativecommons.org/licenses/by/4.0/).